


Features
- 8 Unique slides
- Fully editable and easy to edit in Microsoft Powerpoint, Keynote and Google Slides
- 16:9 widescreen layout
- Clean and professional designs
- Export to JPG, PDF or send by email


Do you have any questions?
Recommend


6 slides
Key Points Overview Presentation
Bring your message to life with a slide that makes every key point feel clear, organized, and easy to follow. This presentation helps you highlight essential ideas, compare insights, and simplify complex information for any audience. Perfect for meetings, reports, or strategy updates. Fully compatible with PowerPoint, Keynote, and Google Slides.


10 slides
5G Technology and Network Advancements Presentation
Showcase key milestones and trends in modern telecom evolution with this dynamic 5G network infographic. The slide features a clean, wave-like flow connecting five signal tower icons, perfect for outlining technological phases, speed upgrades, or infrastructure rollouts. Suitable for IT professionals, telecom analysts, and future-tech strategists. Fully customizable in PowerPoint, Keynote, and Google Slides.


23 slides
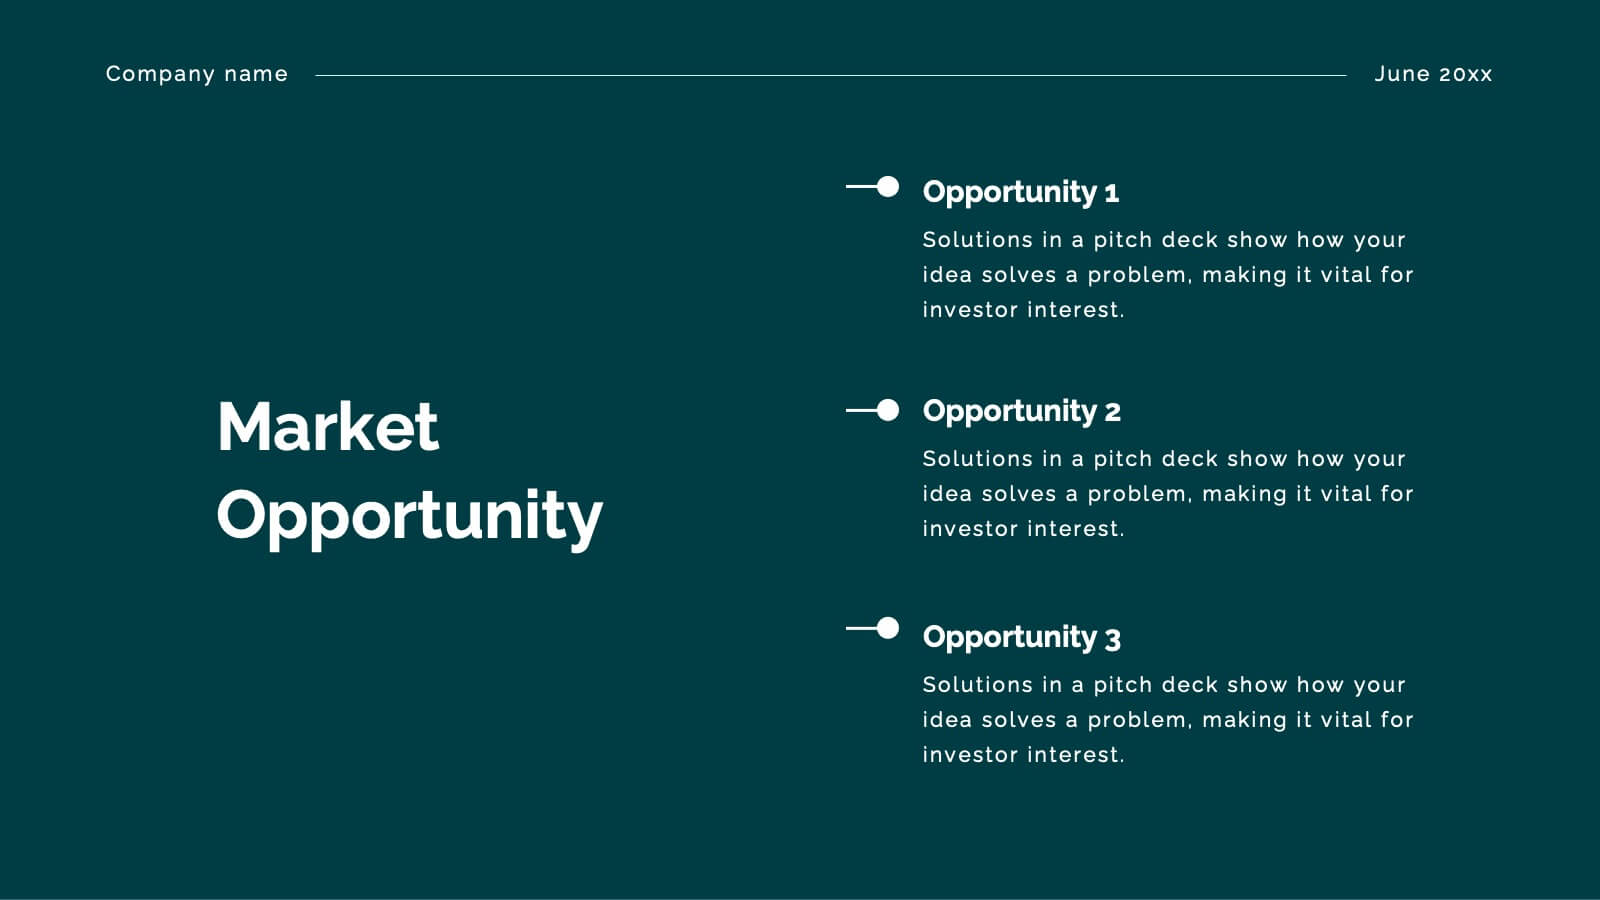
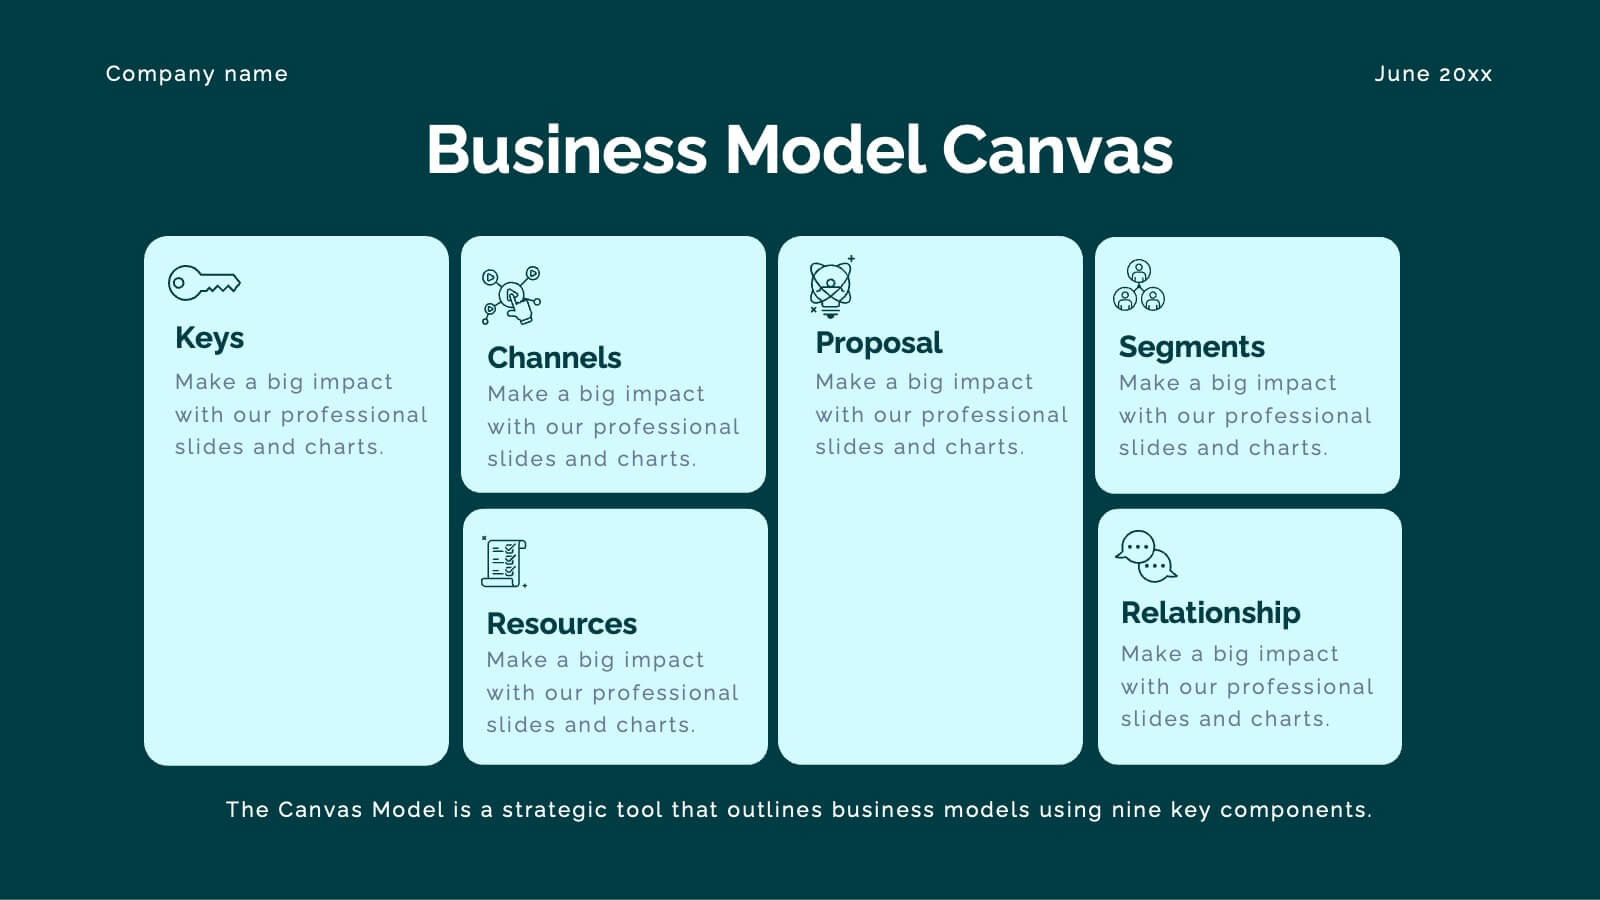
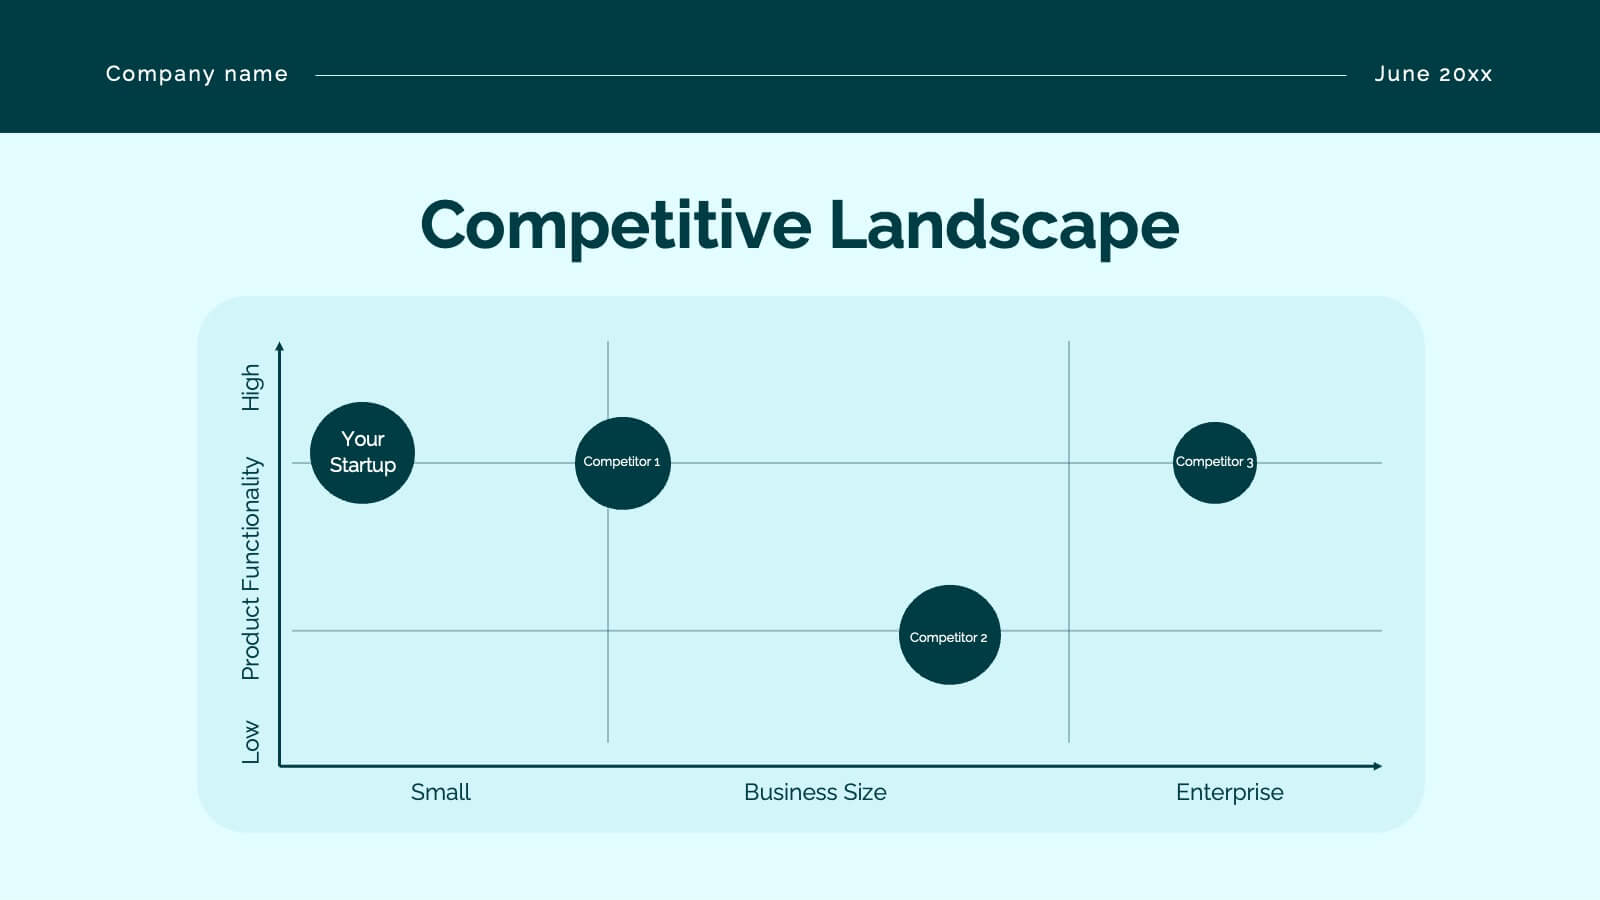
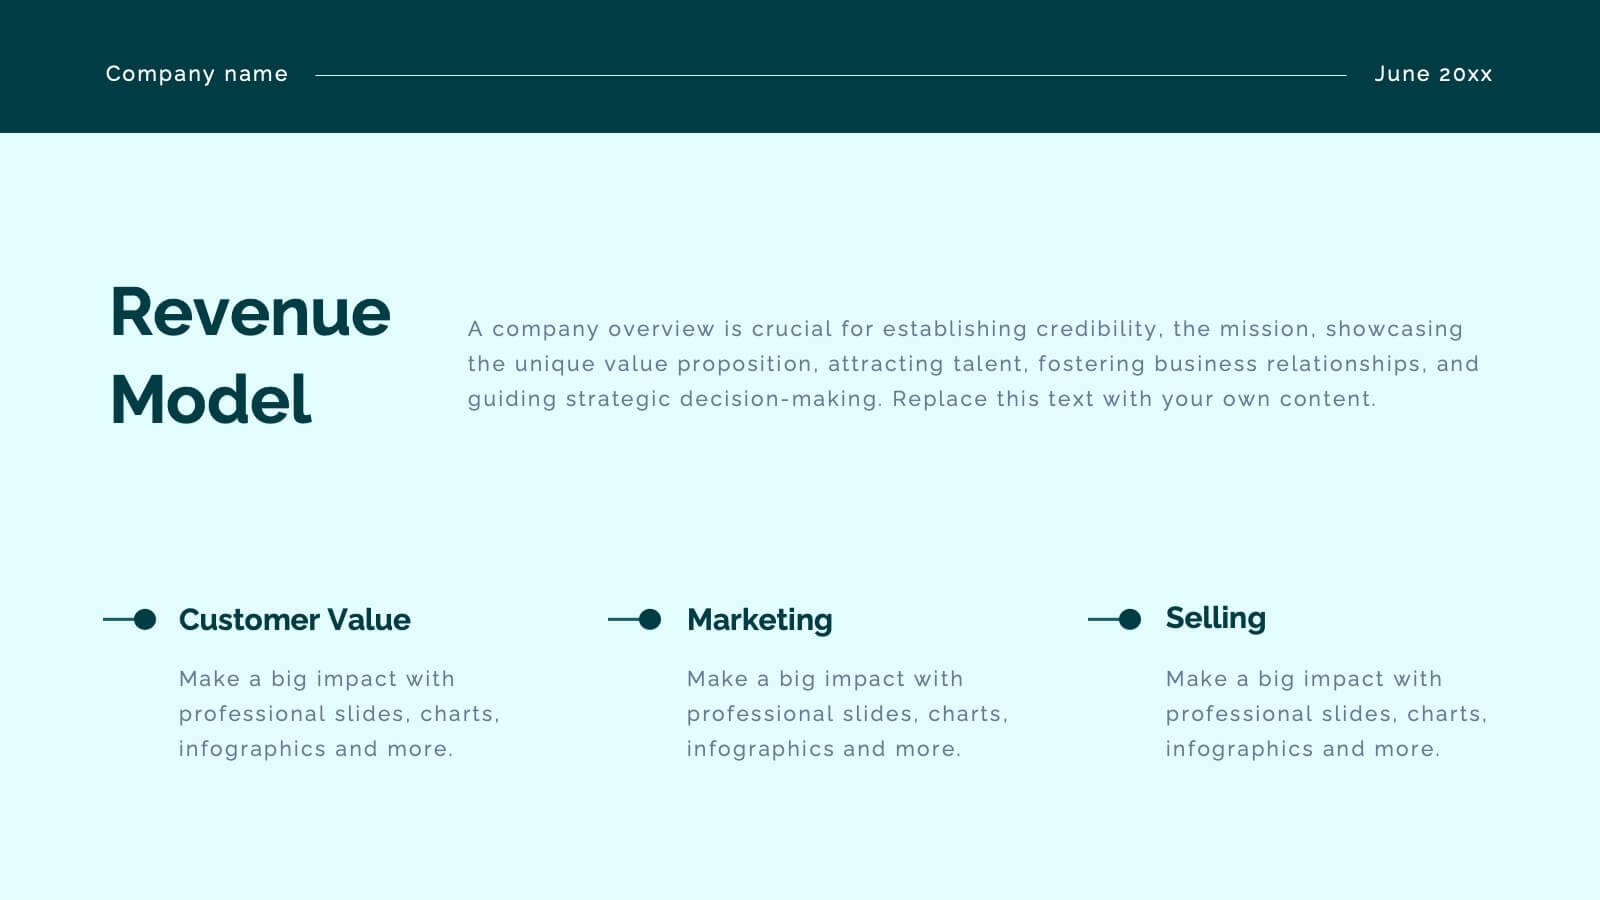
Crest Investor Pitch Presentation Presentation
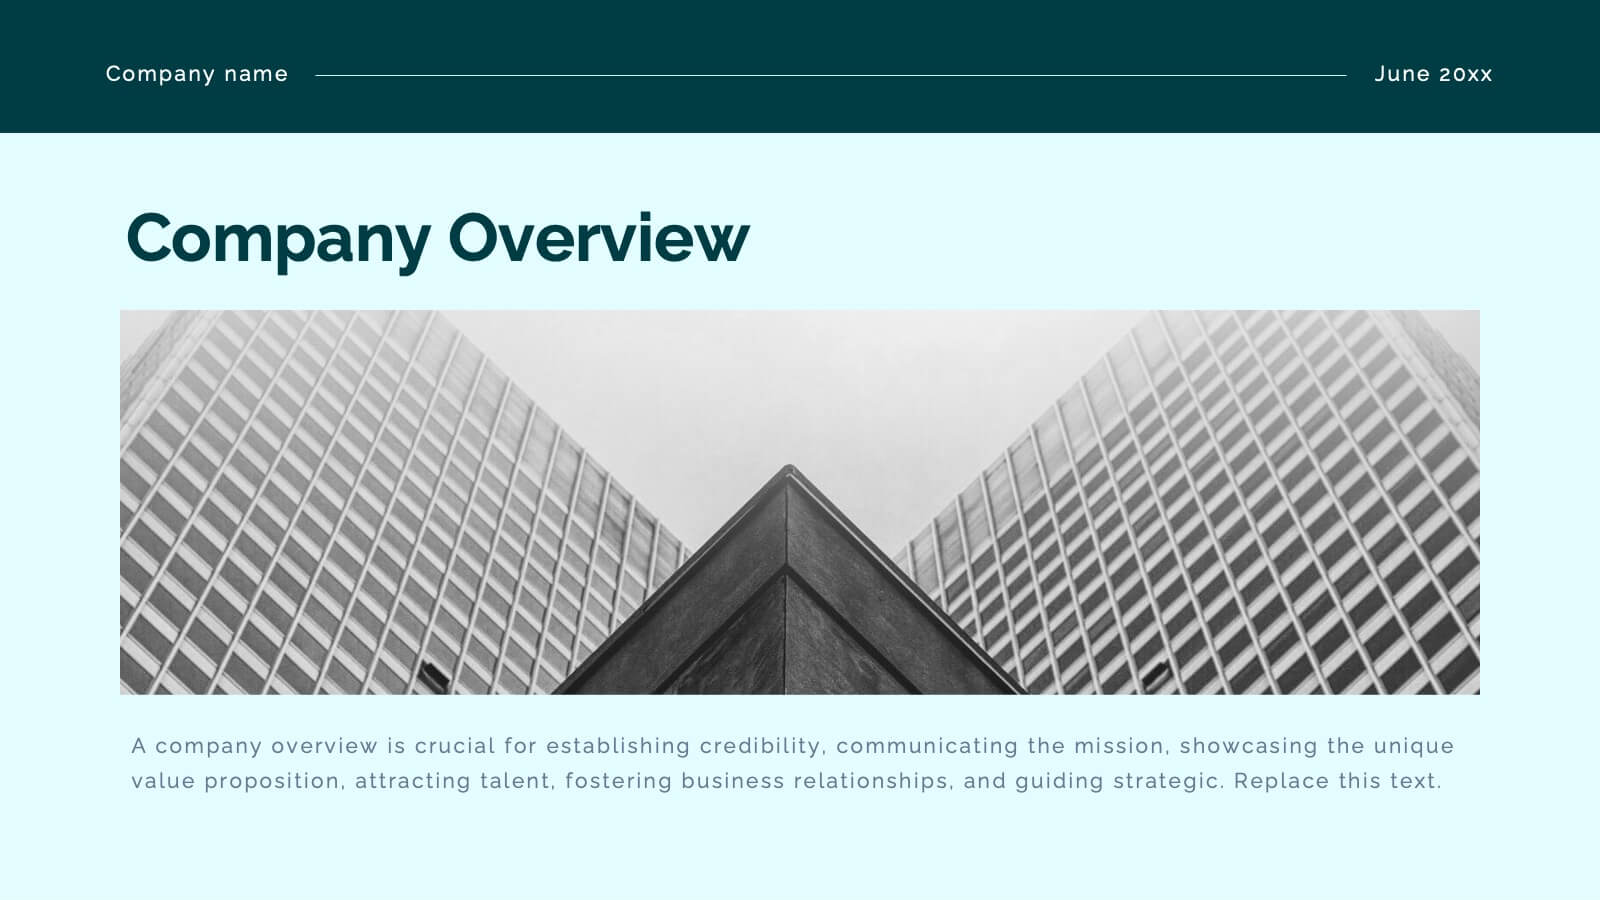
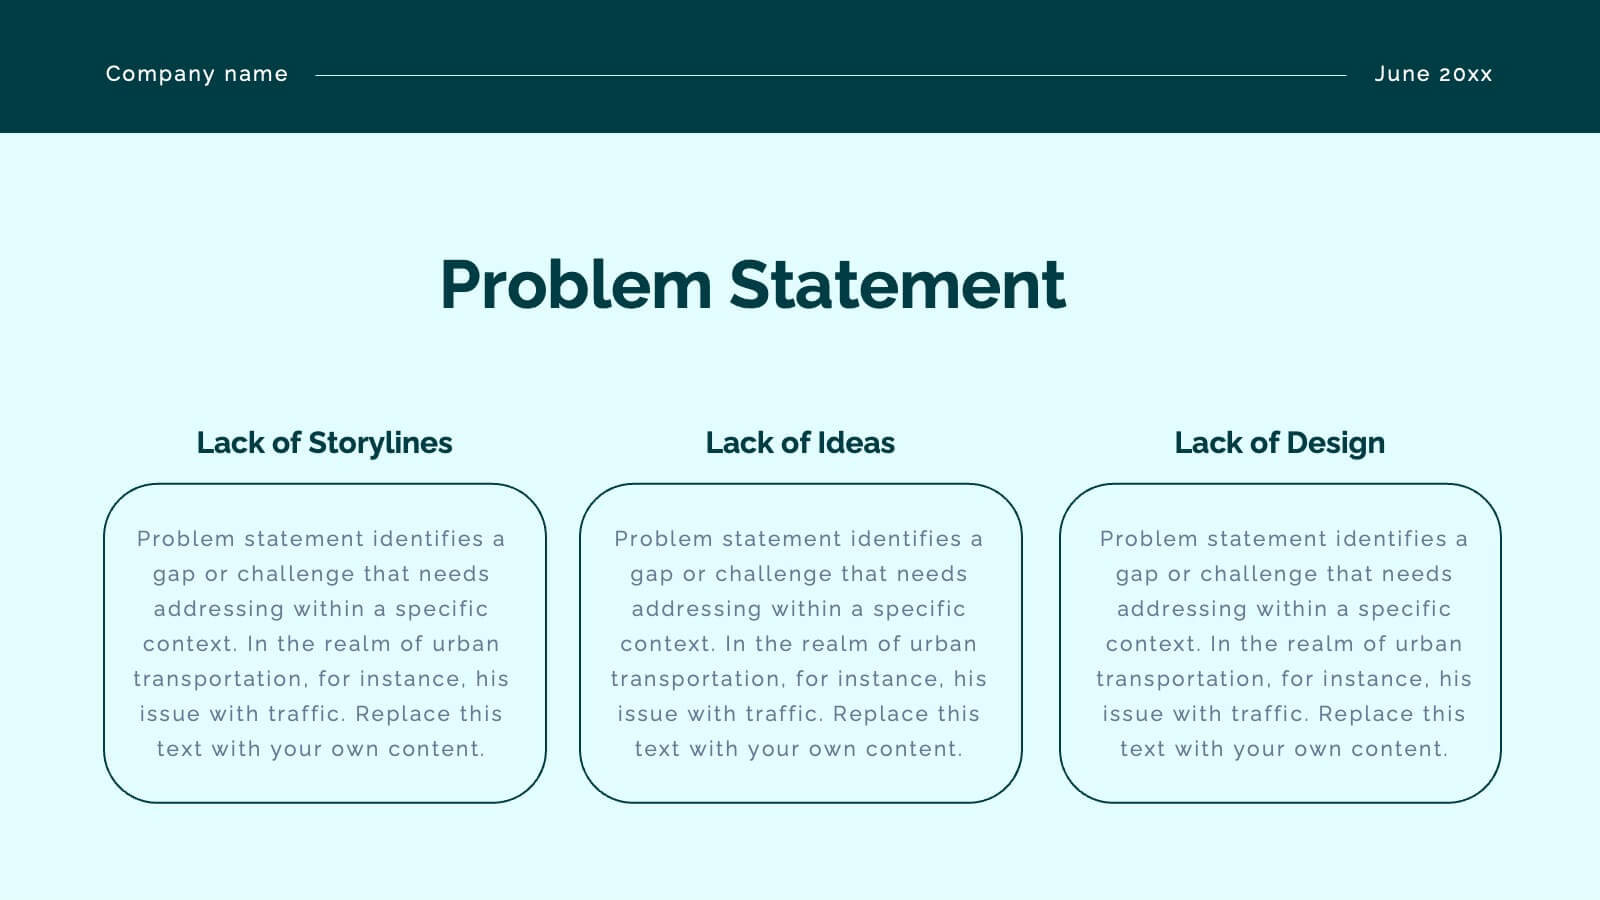
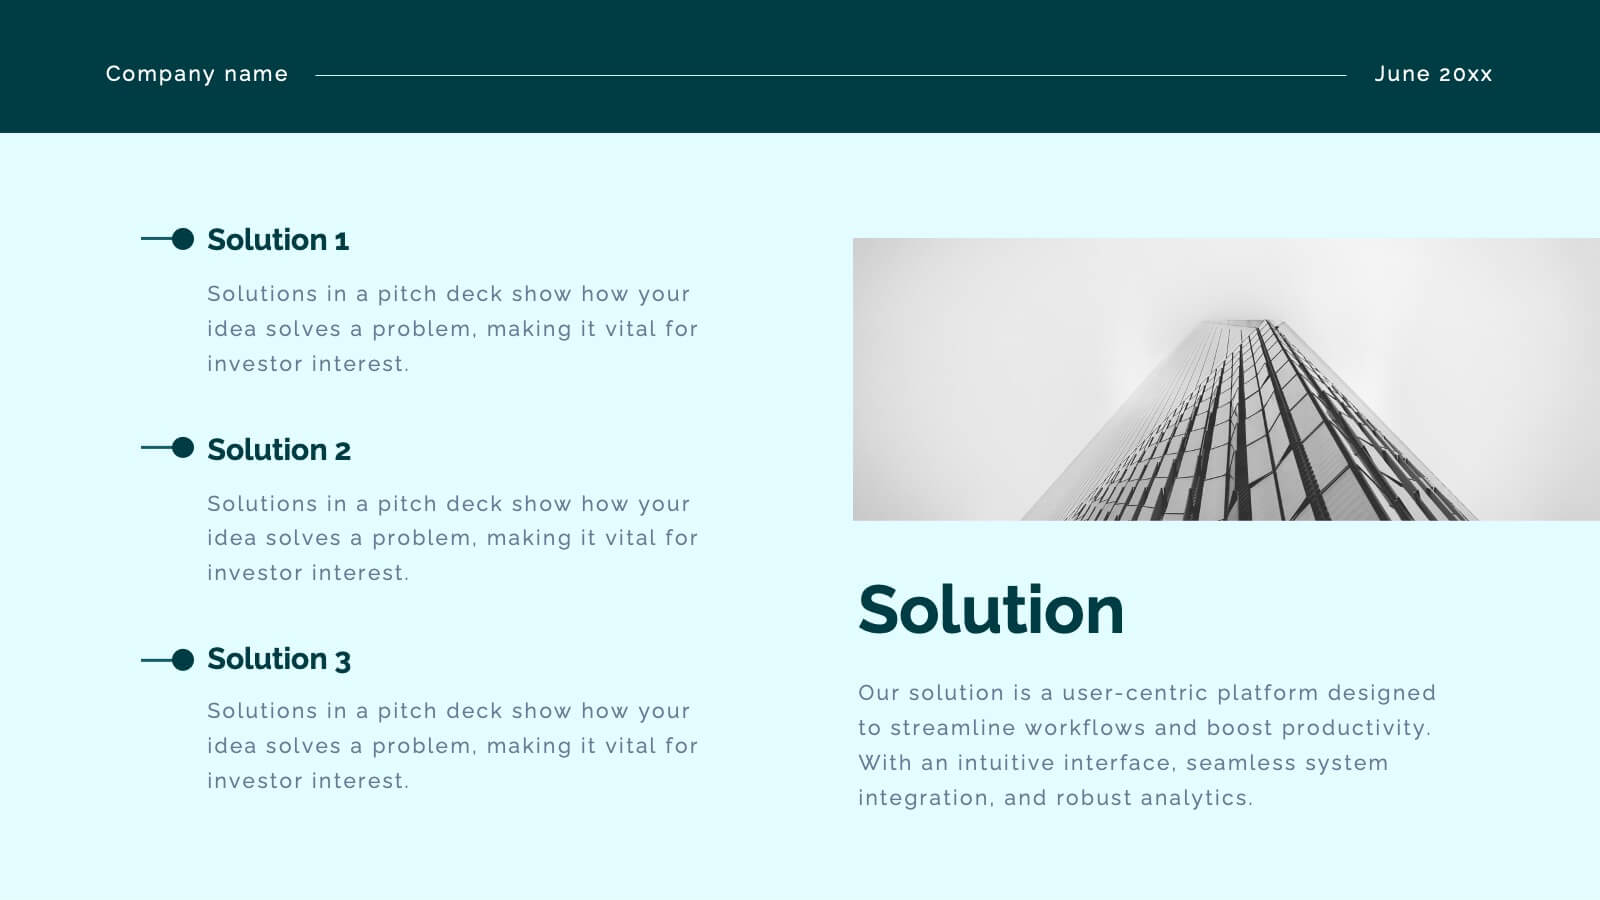
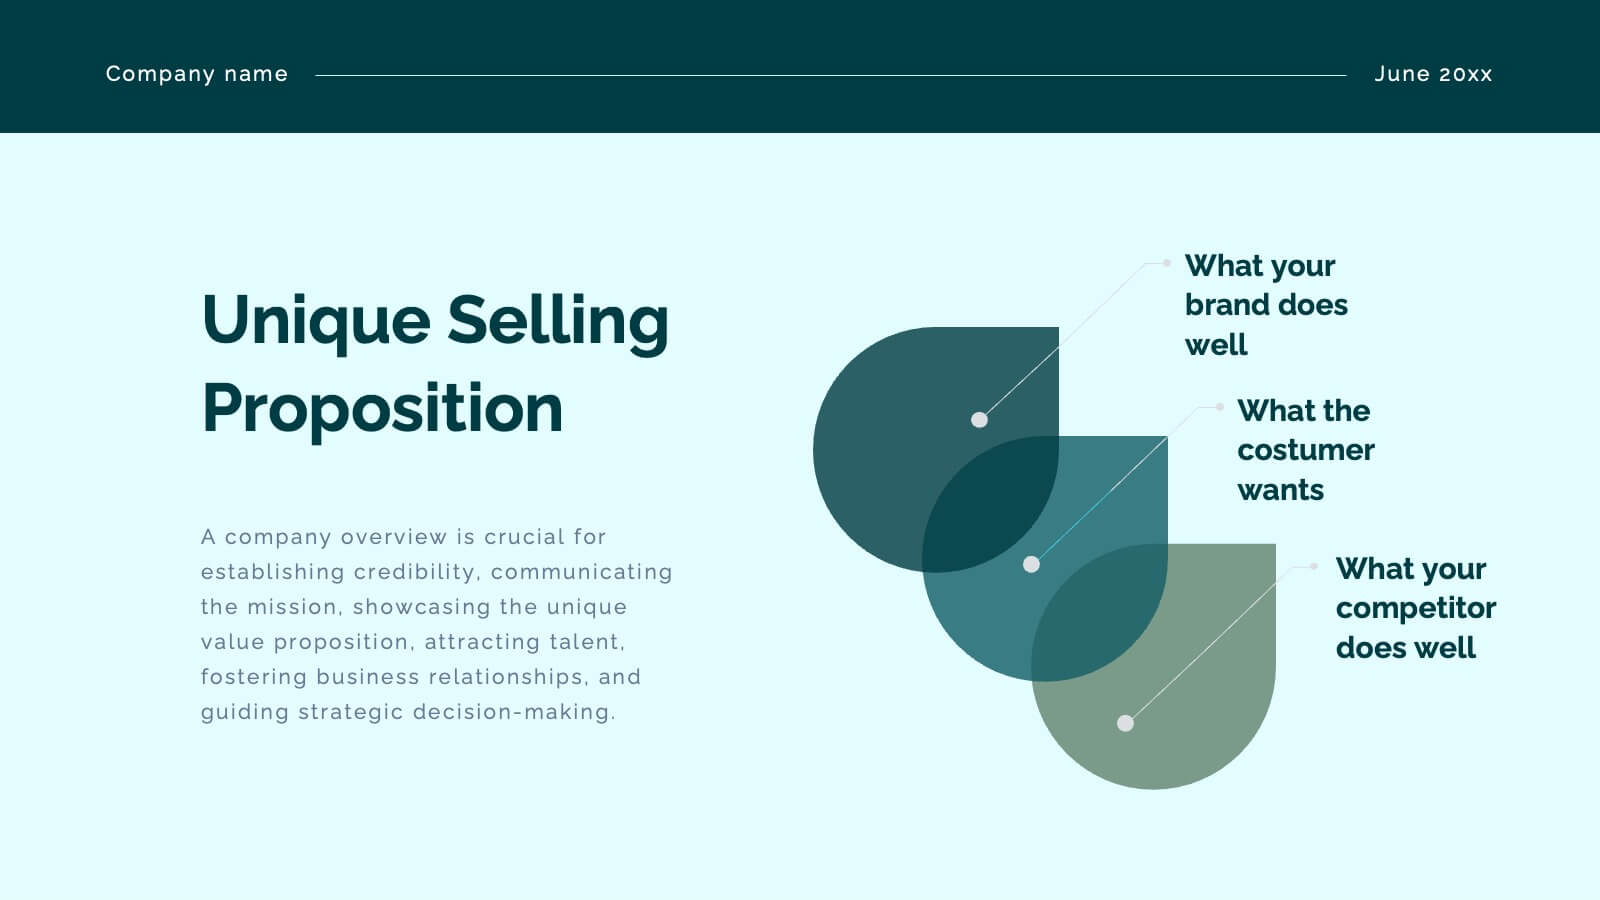
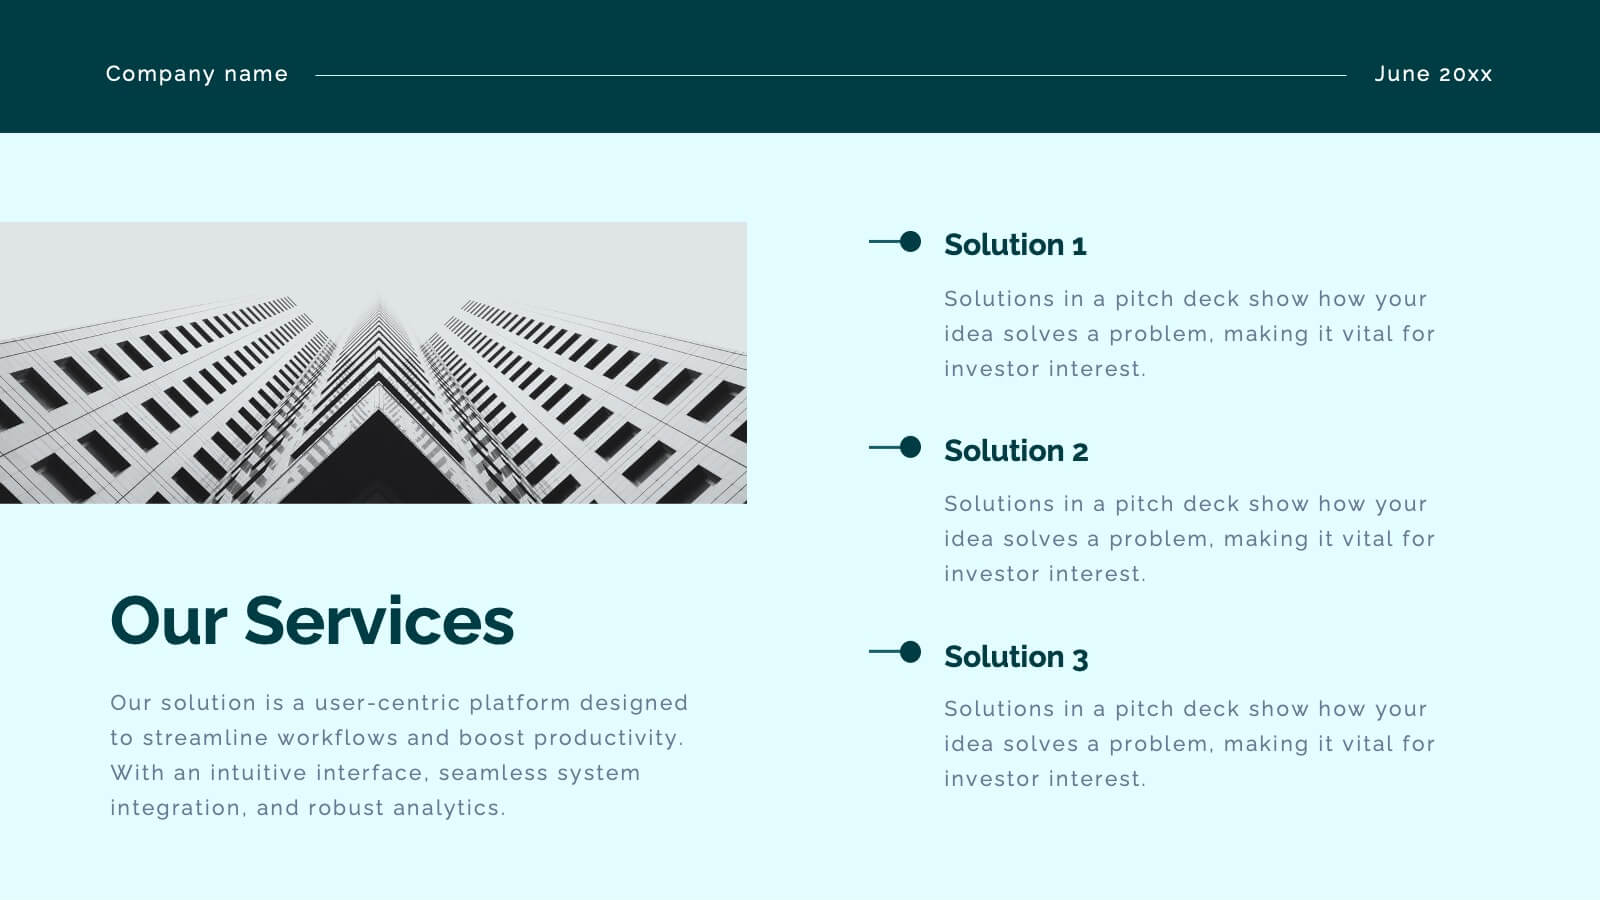
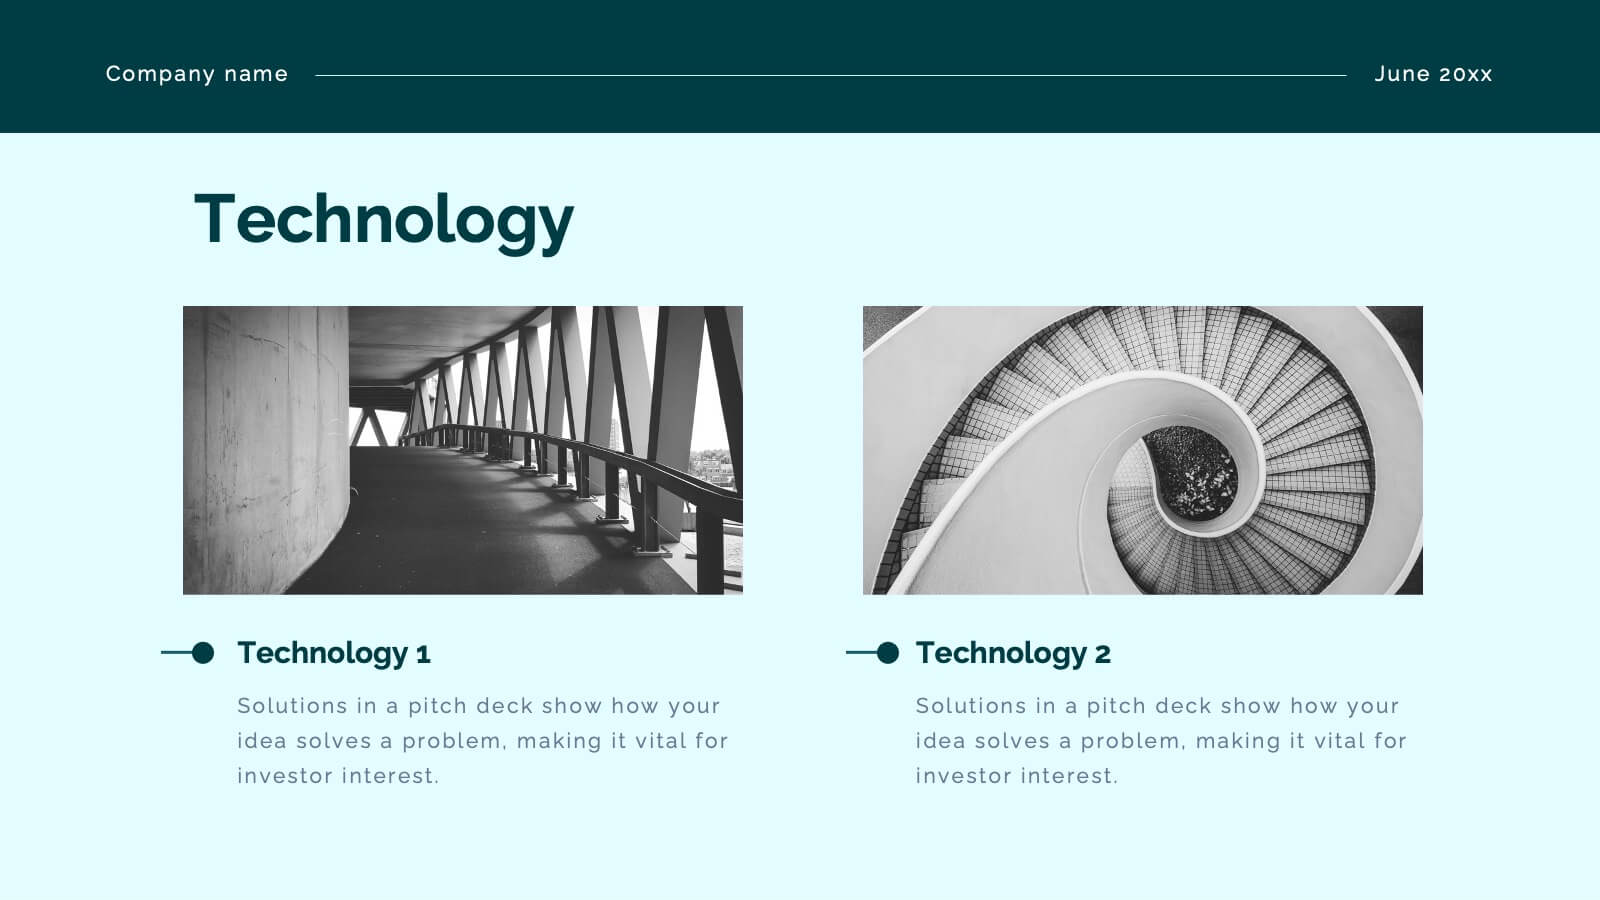
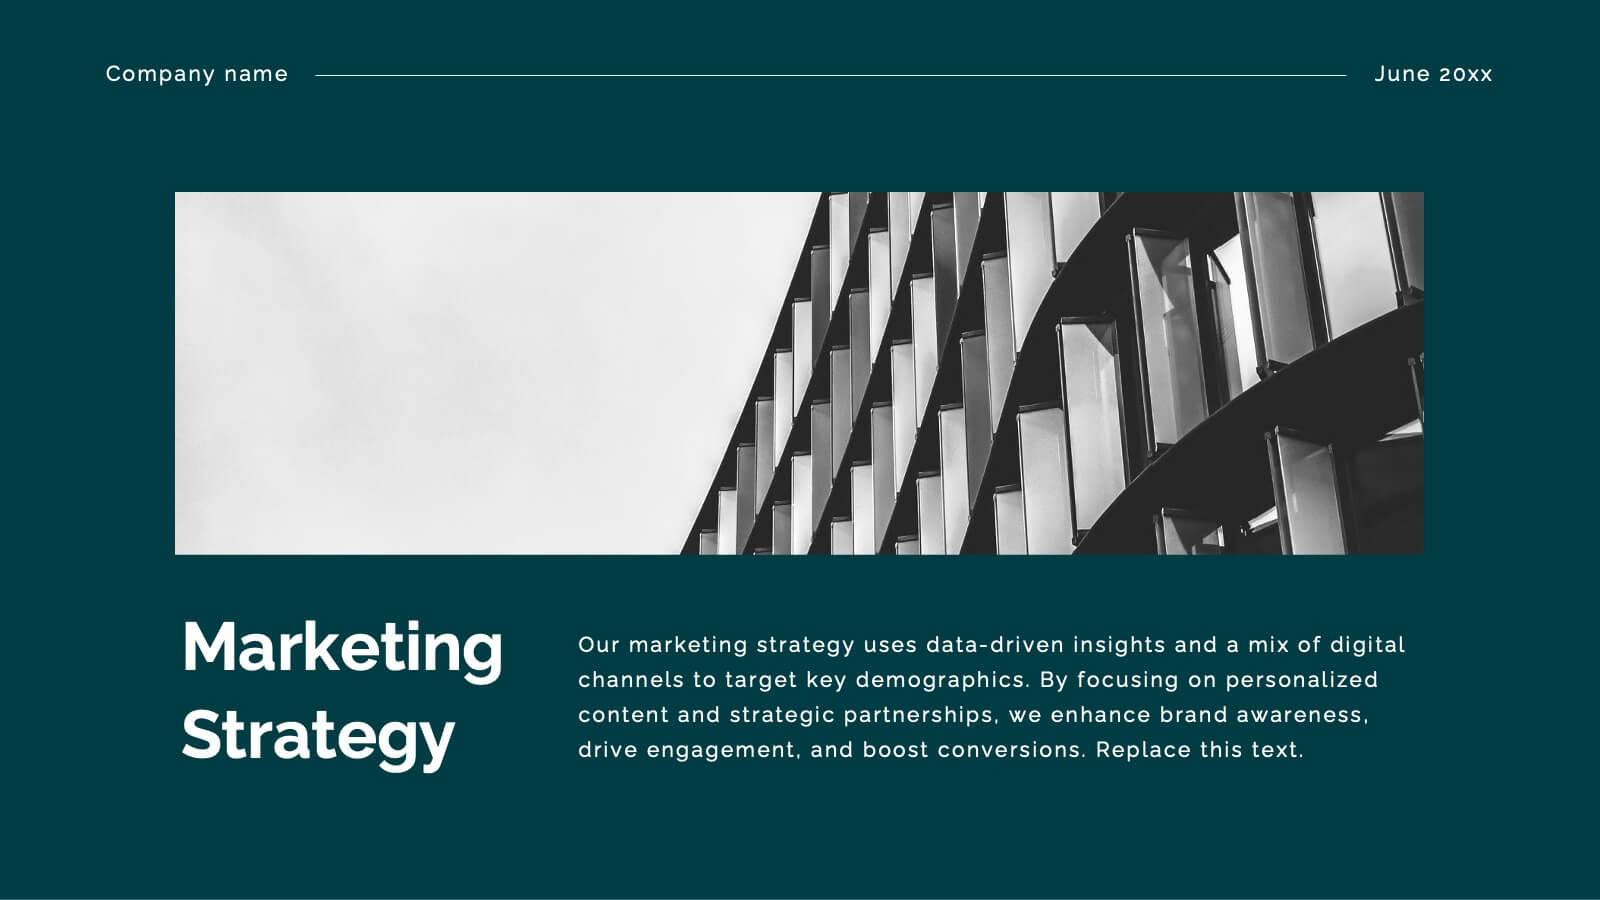
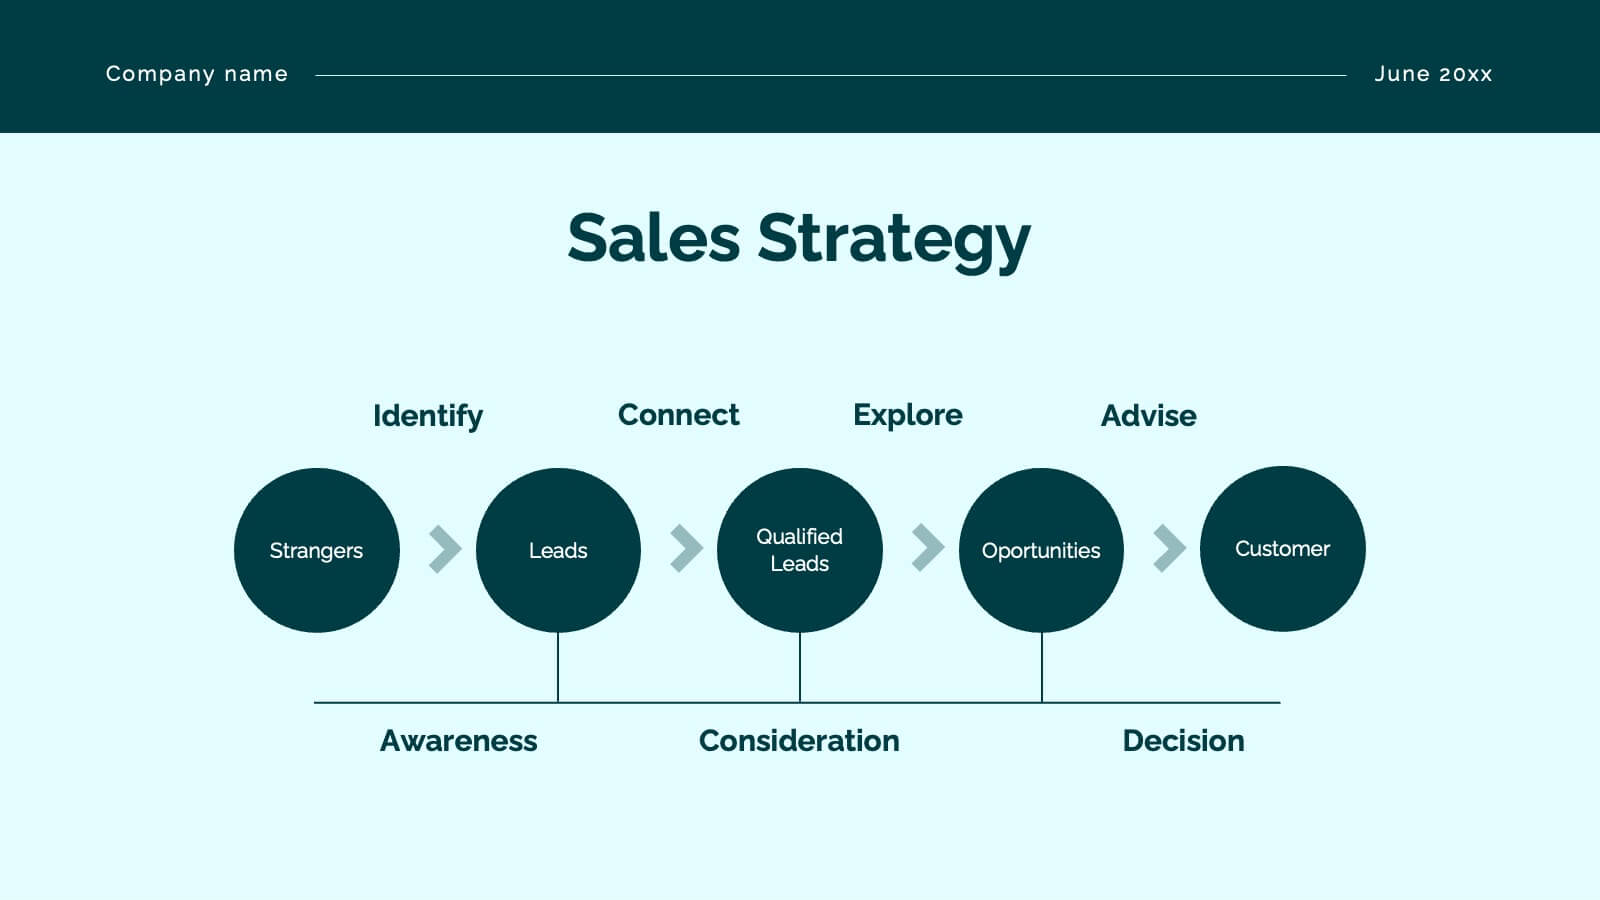
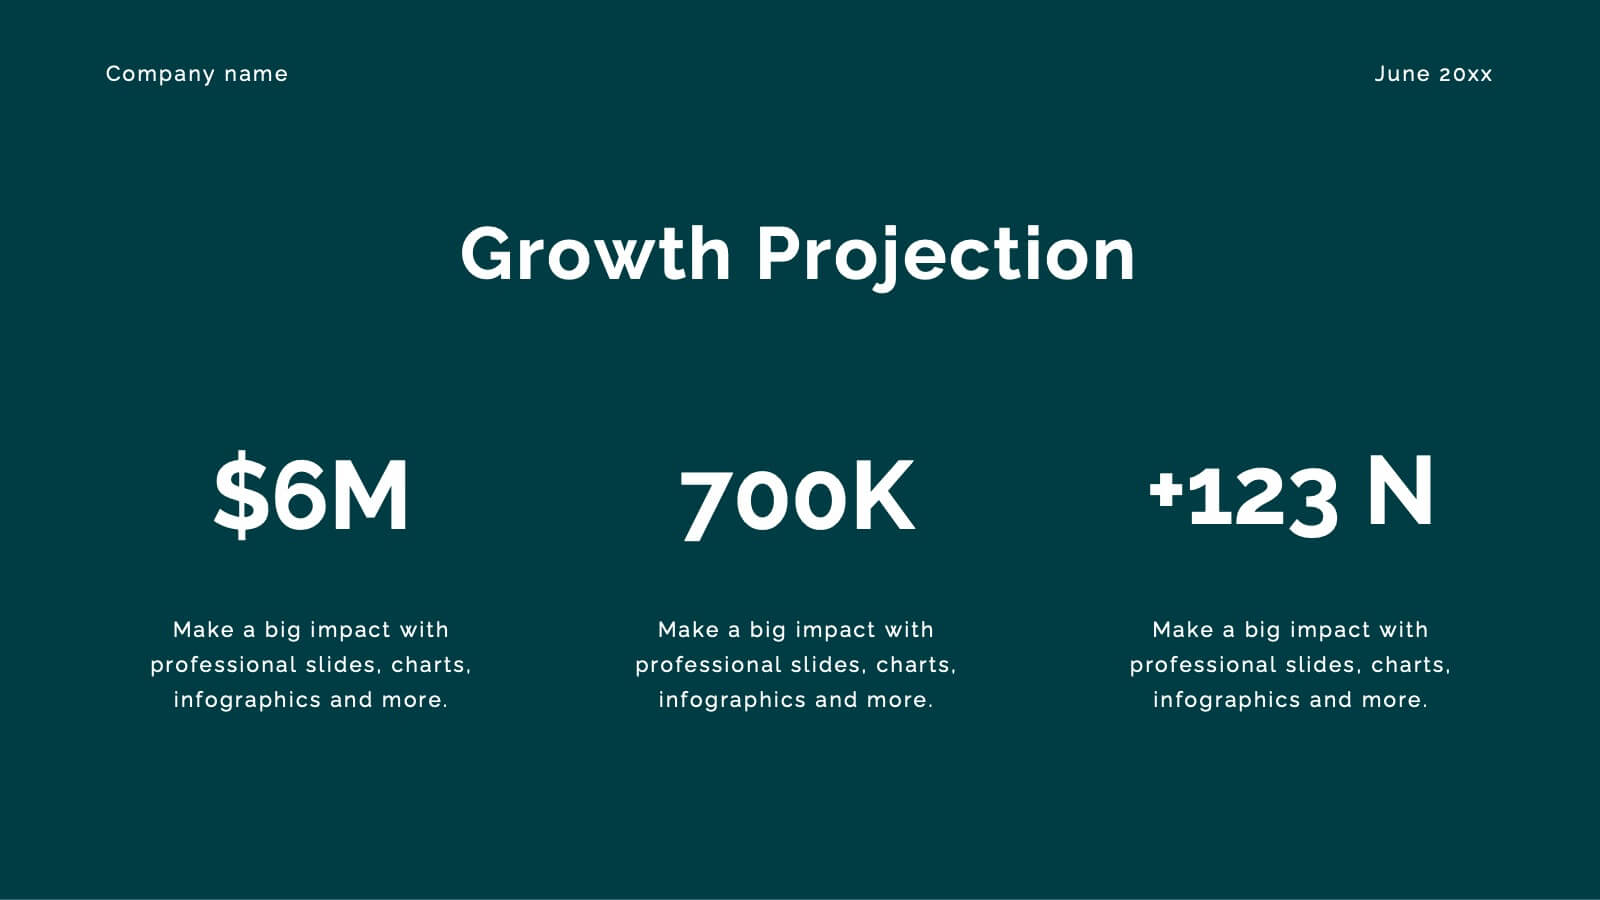
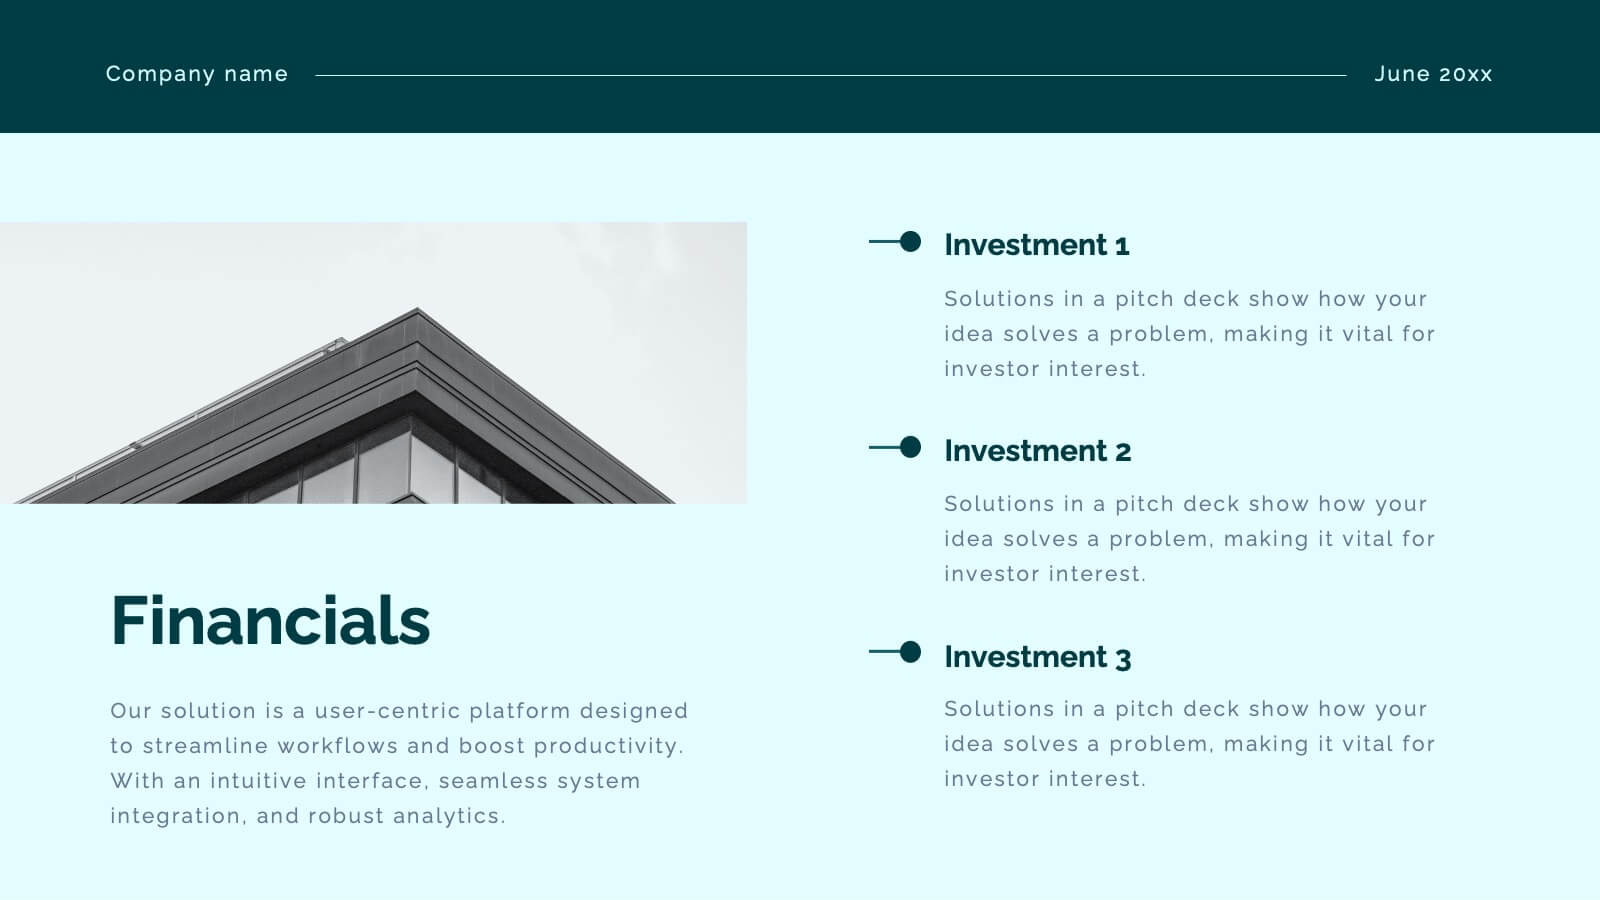
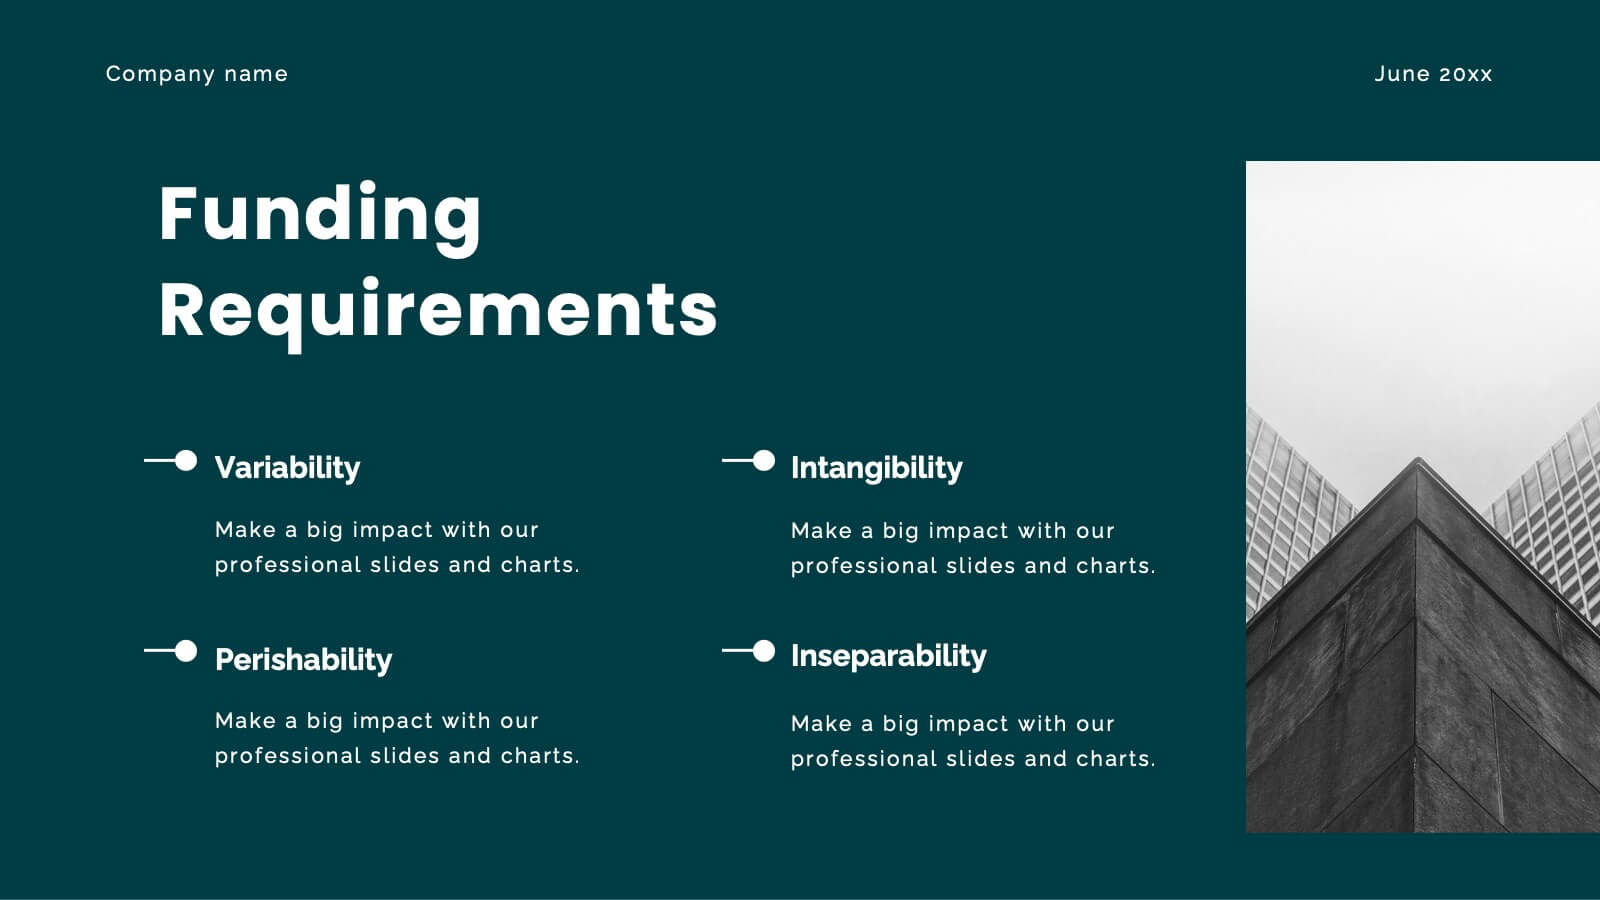
Unleash your potential with this powerful pitch deck template! Tailored for presenting innovative business ideas, it features slides for company overview, market opportunity, competitive landscape, and financial projections. Clearly communicate your value proposition and impress investors with professional design and concise content. Compatible with PowerPoint, Keynote, and Google Slides for seamless presentations on any platform.


6 slides
Detailed Scope Definition and Planning Presentation
Lay out each project stage with the Detailed Scope Definition and Planning Presentation. Featuring a labeled A–E progression with circular milestone visuals, this template helps communicate scope clarity and step-by-step planning. Ideal for strategic presentations, it supports PowerPoint, Keynote, and Google Slides for full compatibility.


7 slides
Leadership Qualities Infographic
Strengthen your leadership presentations with our Leadership Qualities infographic, fully compatible with Powerpoint, Keynote, and Google Slides. This infographic is meticulously designed for trainers, coaches, and management professionals keen on illustrating the core attributes that define effective leadership. Our Leadership Qualities infographic provides a vivid portrayal of essential leadership traits, from communication and decision-making to empathy and resilience. It's an excellent resource for workshops, seminars, and courses focused on leadership development. The visual elements are crafted to highlight the contrasts between various leadership styles and the impacts of different leadership behaviors on team dynamics. By using this infographic, you'll be able to foster a deeper understanding of what makes a great leader in the eyes of their team and organization. It's a powerful visual aid that can help initiate discussions on personal development and team-building strategies. Incorporate it into your educational materials to underscore the value of strong leadership in achieving organizational success.


6 slides
Experience-Based Smile Indicator Slide
Visualize customer sentiment with the Experience-Based Smile Indicator Slide Presentation. Featuring a clean horizontal scale of five emotive icons—from delighted to dissatisfied—this slide is ideal for summarizing user experience, support ratings, or service feedback. Fully customizable in PowerPoint, Keynote, and Google Slides, it's a smart, visual way to display satisfaction levels.


5 slides
Business Planning and Execution Presentation
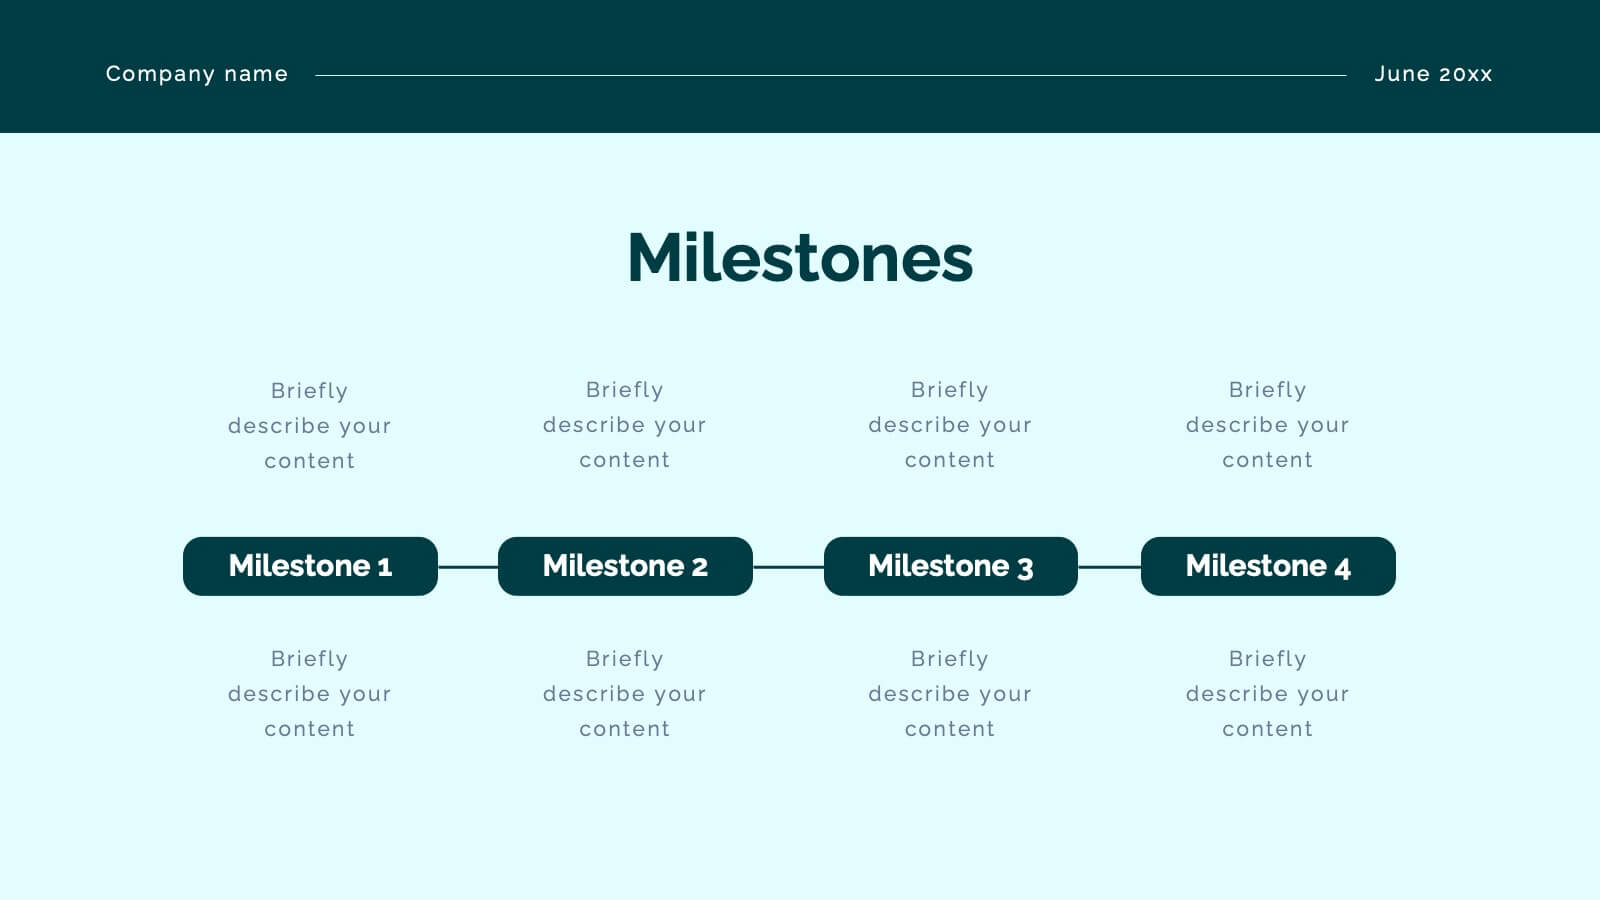
Align your business objectives and execution plan with this modern, arrow-themed presentation slide. Featuring four sequential sections with bold icons and customizable titles, this layout is perfect for showcasing milestones, KPIs, or phases of a strategic process. Designed for clarity and impact, it's compatible with PowerPoint, Keynote, and Google Slides.


2 slides
Engaging Opening Introduction Presentation
Make a lasting first impression with this Engaging Opening Introduction Slide. Designed for professional presentations, networking events, and business pitches, this slide offers a modern, structured layout with a dynamic image section and clear text area. Fully customizable in PowerPoint, Keynote, and Google Slides, you can easily adjust colors, fonts, and content to match your brand.


4 slides
Sales Performance Heat Map Overview Presentation
Get a quick visual pulse on your data with the Sales Performance Heat Map Overview Presentation. Ideal for showing activity levels or trends across time, this slide uses a gradient color scale to help teams identify high and low performance instantly. Fully editable in Canva, PowerPoint, Keynote, and Google Slides—great for sales managers, team leads, and marketing analysts.


5 slides
Banking and Rewards Credit Card Presentation
Highlight the value of credit card programs and customer incentives with this engaging rewards-themed infographic layout. The dynamic card and path visuals help illustrate benefits, user behavior, or loyalty stages effectively. Perfect for banking institutions, fintech startups, or rewards program pitches. Fully customizable in PowerPoint, Keynote, and Google Slides.


5 slides
Internal Communication Flow Chart Presentation
Visualize key communication channels within your organization using this internal communication flow chart. With a clean radial layout, this template helps you illustrate how information travels between departments or roles. Ideal for HR teams, managers, or consultants. Fully editable in Canva, PowerPoint, and Google Slides for seamless customization.


4 slides
Simple Title Page Design Presentation
Make a memorable first impression with a clean, modern title design that instantly draws attention. Ideal for creative portfolios, business reports, or marketing decks, this layout combines strong typography with sleek visuals for a professional look. Fully editable in PowerPoint, Keynote, and Google Slides for complete flexibility.


4 slides
Healthcare Impact on Breast Cancer Day Presentation
Educate and inspire with the Healthcare Impact on Breast Cancer Day Presentation. This thoughtfully designed layout uses meaningful visuals to highlight data, awareness efforts, and key messages around breast cancer healthcare. Ideal for awareness campaigns, health reports, or nonprofit presentations. Fully editable in PowerPoint, Google Slides, Keynote, and Canva.


7 slides
Business Structure Infographic
Understanding a business's organizational structure is pivotal for effective operations, strategy, and growth. Our business structure infographic, colored in shades of blue, white, green, and yellow, lays out these intricacies in a visually compelling manner. Whether you're showcasing hierarchies, operational roles, or departmental divides, this infographic captures it all. Tailored for business students, entrepreneurs, and corporate trainers, this tool simplifies complex concepts. Seamlessly integrated with PowerPoint, Keynote, and Google Slides, it provides a dynamic aid to ensure your presentations are both enlightening and engaging.


6 slides
Commercial Real Estate Infographics
Explore the world of Commercial Real Estate with our customizable infographic template. This template is fully compatible with popular presentation software like PowerPoint, Keynote, and Google Slides, allowing you to easily customize it to illustrate and communicate various aspects of commercial real estate. The Commercial Real Estate infographic template offers a visually engaging platform to outline the different types of commercial properties, investment strategies, market trends, and the benefits of investing in commercial real estate. Whether you're a real estate professional, investor, business owner, or simply interested in the world of commercial properties, this template provides a user-friendly canvas to create informative presentations and educational materials. Deepen your knowledge of Commercial Real Estate with this SEO-optimized infographic template, thoughtfully designed for clarity and ease of use. Customize it to showcase property types (e.g., office, retail, industrial), financing options, risk management, and the potential for income and growth, ensuring that your audience gains valuable insights into this lucrative sector. Start crafting your personalized infographic today to explore the realm of Commercial Real Estate.


6 slides
5-Level Risk Assessment Diagram Presentation
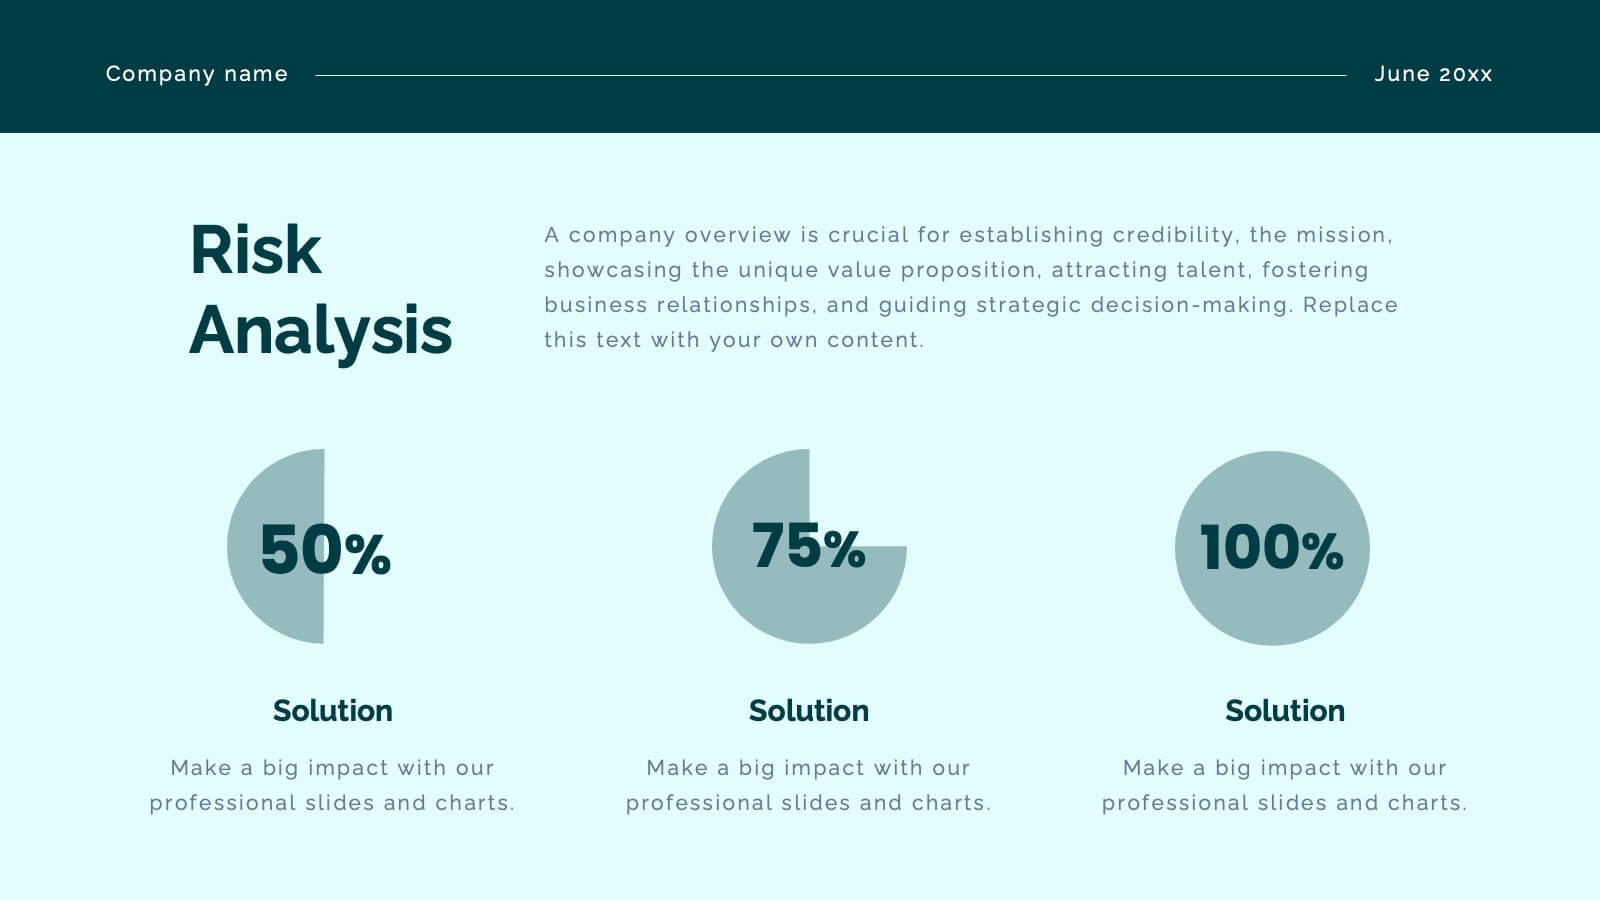
Simplify complex risk analysis with a clean, layered design that walks your audience through five key levels of impact and probability. Perfect for corporate reports, project management, or strategic planning, this presentation ensures clarity and engagement. Fully compatible with PowerPoint, Keynote, and Google Slides for easy customization.


5 slides
Meeting Minutes and Notes Presentation
Keep every discussion organized and every detail accounted for with this clean and structured layout. Perfect for summarizing key decisions, attendees, and next steps, it helps teams capture essential meeting insights efficiently. This easy-to-edit template works flawlessly with PowerPoint, Keynote, and Google Slides for a polished professional presentation.