


Features
- 3 Unique slides
- Fully editable and easy to edit in Microsoft Powerpoint, Keynote and Google Slides
- 16:9 widescreen layout
- Clean and professional designs
- Export to JPG, PDF or send by email


Do you have any questions?
Recommend


5 slides
Wedding Itinerary Infographics
A Wedding Itinerary is a detailed schedule or timeline that outlines the events and activities planned for a wedding day. These infographic templates aim to assist couples in creating a visually appealing and informative itinerary for their wedding events. These infographics are perfect for preparing a presentation for guests, sharing details with the wedding party, or showcasing wedding planning services, this template will help you create a memorable and well-organized wedding experience. This is compatible with PowerPoint, Keynote, and Google Slides making it easily editable to personalize the template with your information.


6 slides
Business Model Hexagon Infographic Presentation
Break down complex strategies with the Business Model Hexagon Infographic Presentation. This sleek, six-part hexagonal layout is perfect for illustrating interconnected components like operations, value propositions, and customer segments. Fully editable and easy to customize in PowerPoint, Keynote, or Google Slides—ideal for startups, consultants, and corporate teams.


6 slides
Travel Tips Infographic
By following travel tips, you can enhance your travel experience, mitigate potential challenges, and make the most of your adventures. This infographic template is designed to provide travelers with essential tips and guidelines for a successful and enjoyable trip. Whether you're planning a vacation, business trip, or backpacking adventure, this infographic offers valuable information to help you make the most out of your travel experience. This template is a valuable tool for enhancing travel experiences and ensuring a smooth and memorable trip. Compatible with Powerpoint, Keynote, and Google Slides.


22 slides
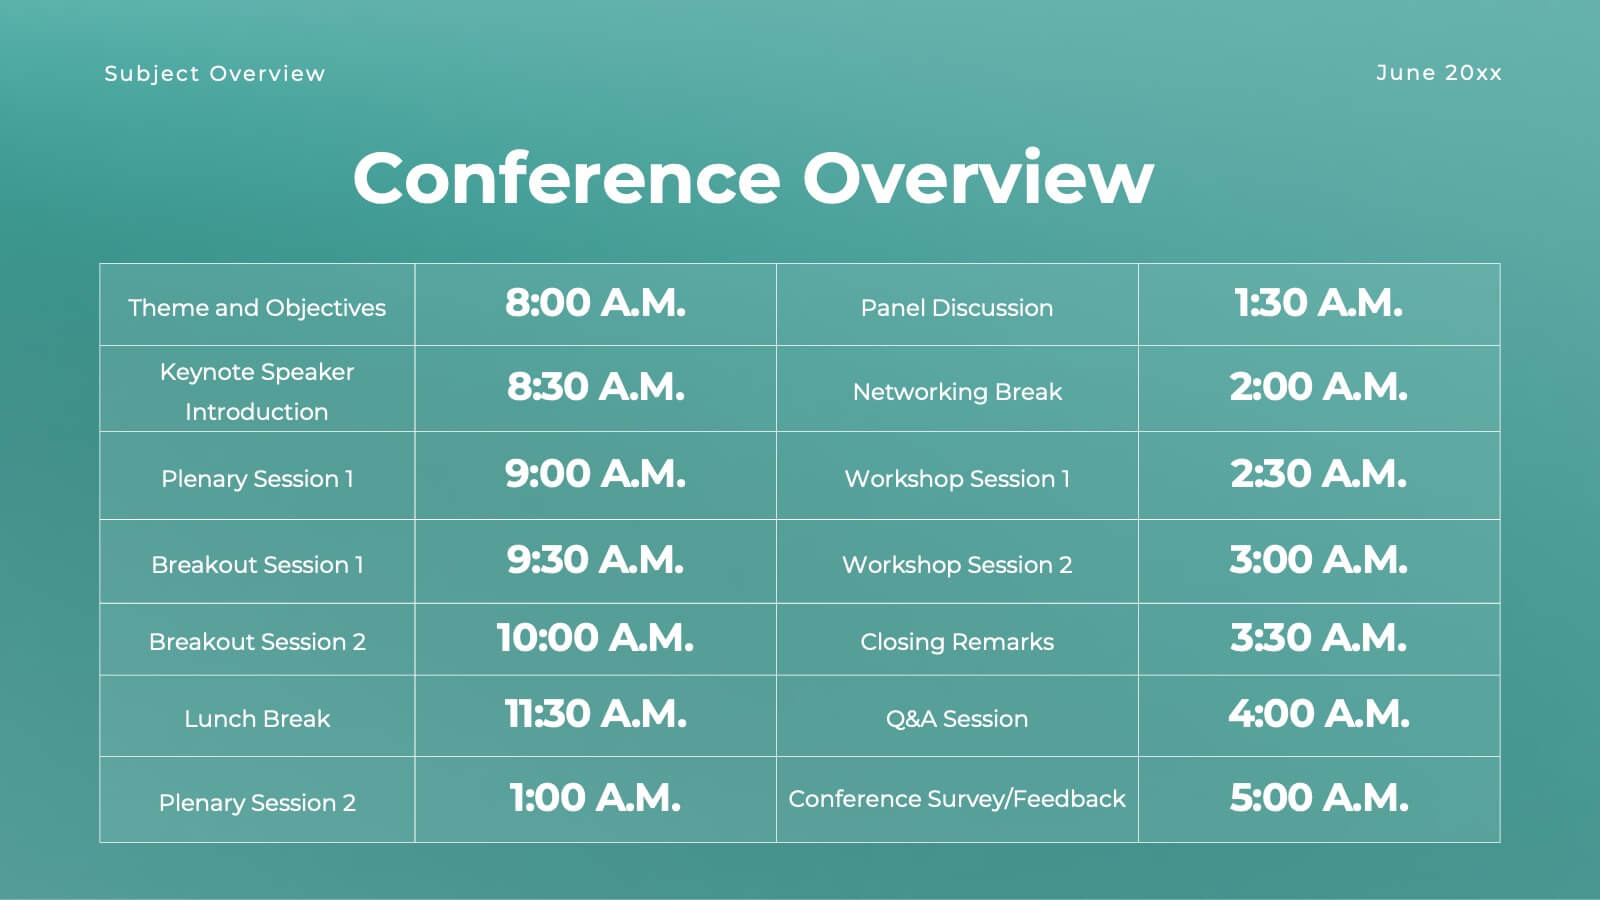
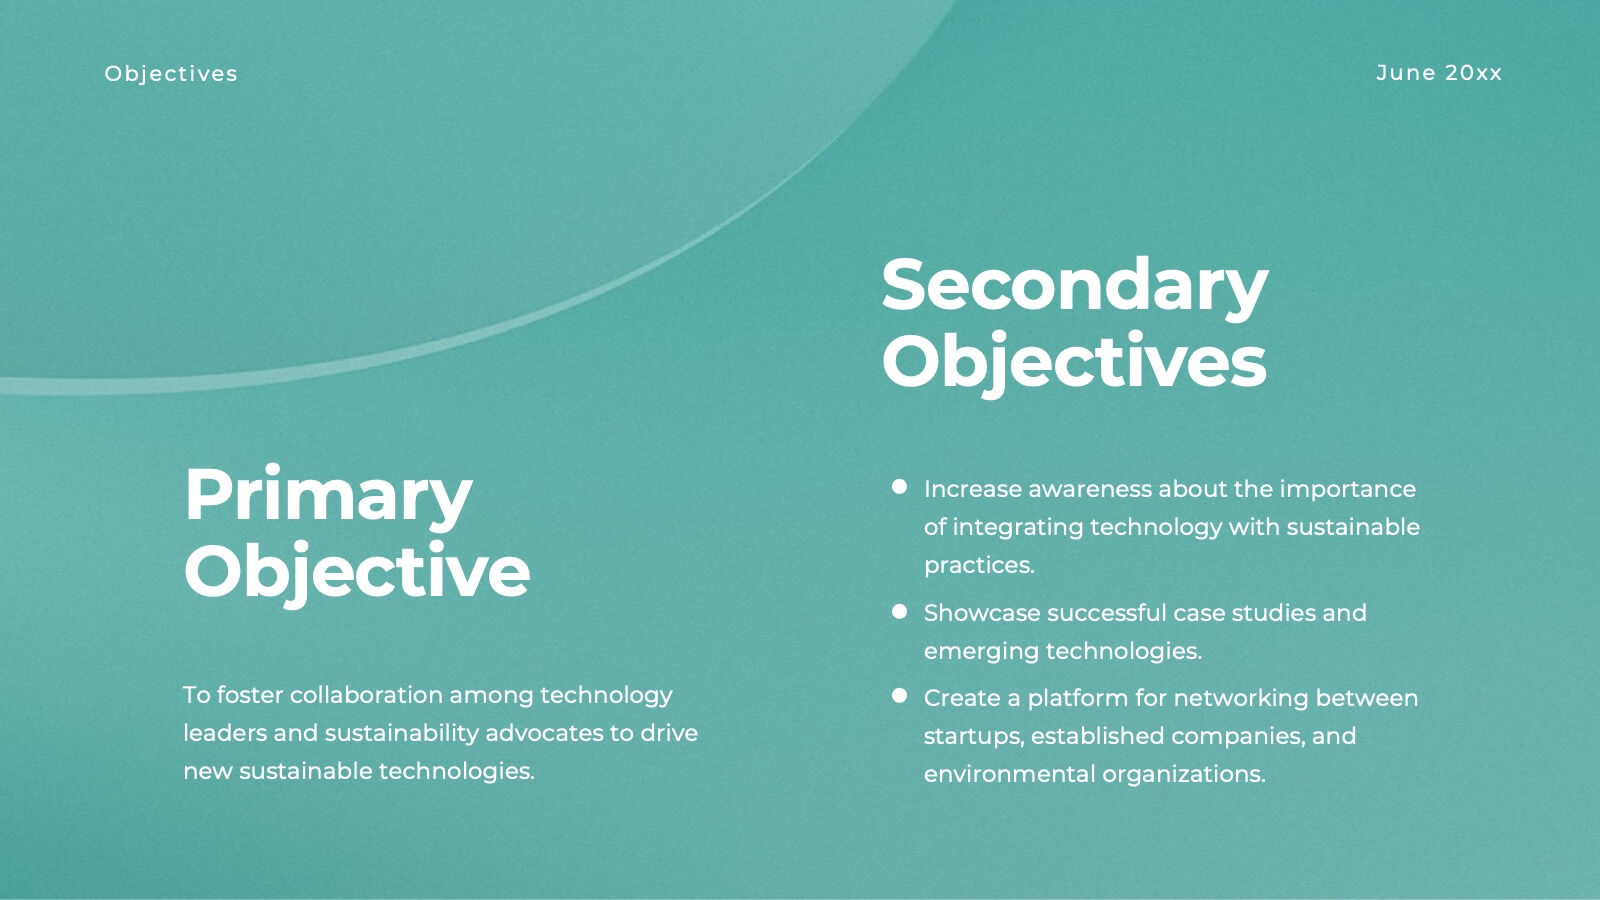
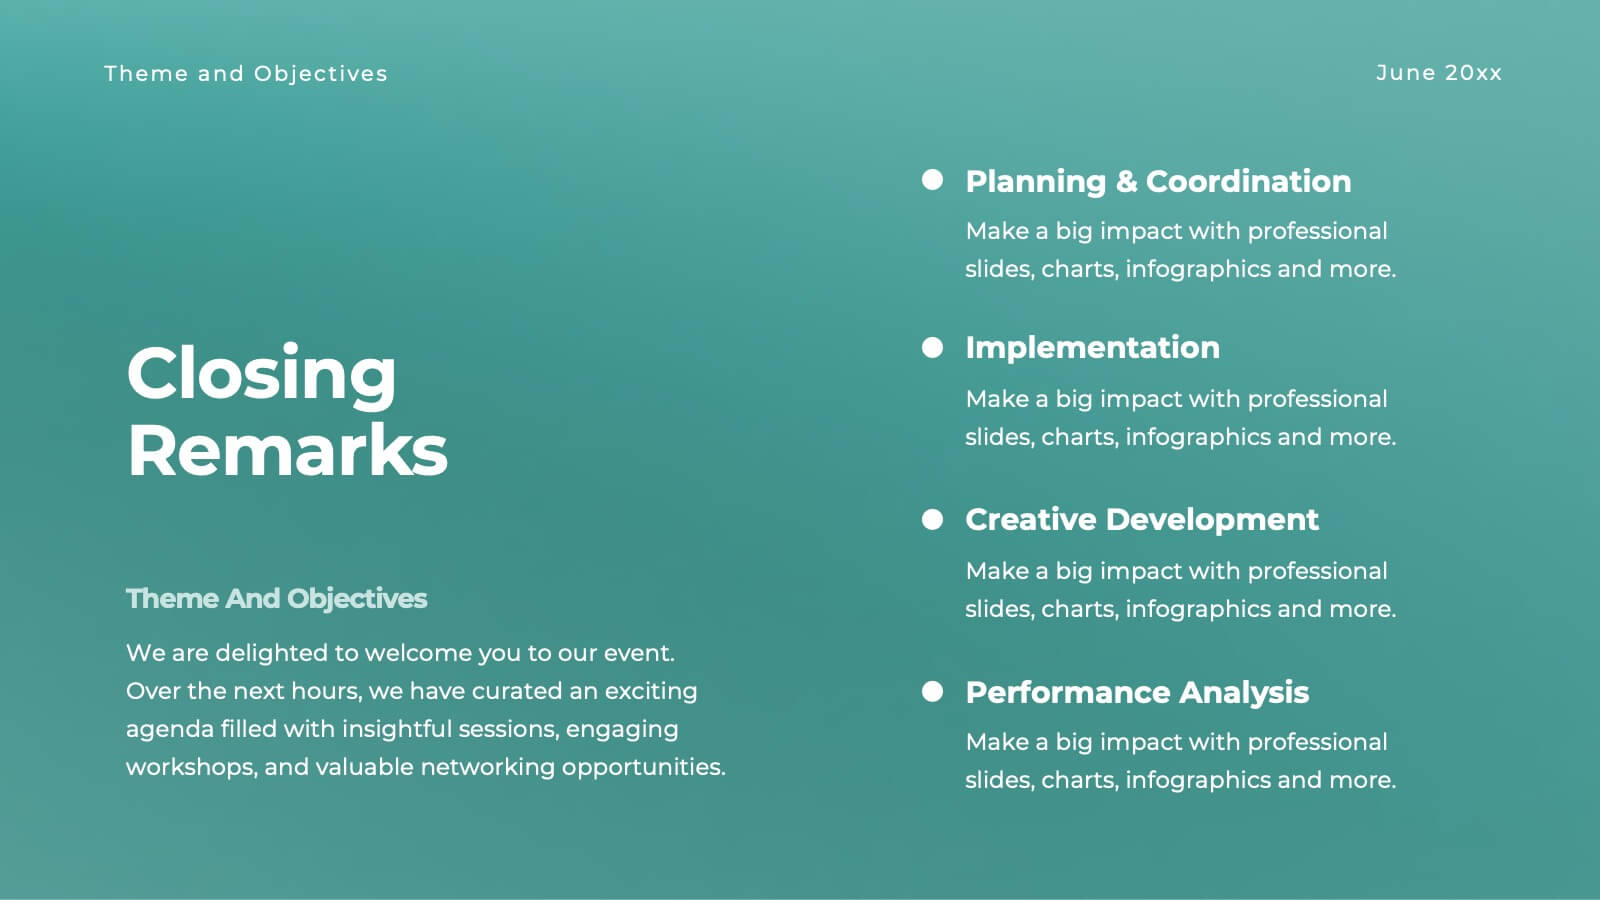
Halo Small Business Pitch Deck Presentation
Streamline your business presentations with this versatile pitch deck template! Ideal for conferences and meetings, it includes slides for objectives, session details, keynote speakers, and panel discussions. Keep your audience engaged with professional design and clear, structured content. Compatible with PowerPoint, Keynote, and Google Slides for seamless presentations on any platform.


4 slides
Workforce Skills Gap Analysis
Spot the gap. Bridge the skills. This Workforce Skills Gap Analysis slide helps visualize the journey from your team’s current capabilities to their desired performance level, with a clear action plan in between. Fully editable and works seamlessly in PowerPoint, Keynote, and Google Slides.


7 slides
SWOT Analysis Marketing Infographic Presentation
SWOT Analysis is a simple, but powerful strategic planning method. It helps identify your company’s strengths, weaknesses, opportunities and threats as you plan a course for the future. This template includes everything you need for your next project, including data and insight about your business. This template comes with 7 slides. It includes a title for each infographic and allows you to build your swot charts, add icons and convert the text into bullet points. You have complete control over all elements within each slide and can easily add, delete or modify content at any time!


34 slides
Founder Startup
A Founder Startup, is a newly established business venture that is typically founded by one or more individuals or groups with an innovative idea, concept, or product. This template is designed to help you create a professional and compelling presentation that showcases your startup and its founders in a impactful way. Compatible with PowerPoint, Keynote, and Google Slides. Included in this template are a variety of pre-designed slides that will help cover different aspects of your startup, such as team introduction, overview, vision and mission, product or service description, market analysis, financials, and more.


7 slides
Big Data Analytic Infographics
Big Data are the large and complex data sets that are difficult to process and analyze using traditional data processing methods. This template will allow you to visualize key data points and insights in an appealing and easy to digest way. Your information is presented in a clear manner with a variety of graphs, to convey the fundamentals of big data analytics. Customize this infographic with your own data in the bullet points and graphics. Quickly edit text and colors for your next presentation. All the slide in this template are fully editable in Powerpoint, Keynote, and Google Slides.


4 slides
Regional Analytics for North America Map Presentation
Visualize key performance metrics by region with the Regional Analytics for North America Map Presentation. This slide layout combines stacked bar visuals with a detailed map, allowing you to compare data points across multiple regions. Ideal for reporting trends, KPIs, or market analysis. Fully editable in Canva, PowerPoint, and Google Slides.


26 slides
Dax Presentation Template
Dax is a professional and clean template that was created to make your presentations stand out. It has a vibrant color scheme and engaging graphics that are easy to edit. The clean look has plenty of room for you to display your content, and this high-quality design will make an impression in your meeting or presentation for your targeted audience. It also allows you to present your content in a way that is professional and engaging. Its vibrant style also makes it stand out from other presentations. This template is suitable for all types of businesses. Don't think twice this one if for you!


8 slides
Tourism Strategy and Location Guide Presentation
Planning a strategy that inspires wanderlust? This sleek presentation template helps organize global tourism goals with location-based insights, iconic visuals, and easy-to-edit layout sections. Perfect for destination marketing, regional analysis, or travel business pitches. Fully compatible with PowerPoint, Keynote, and Google Slides for effortless editing and impactful delivery.


6 slides
Organizational Strategy via Mind Mapping
Clarify your corporate vision with the Organizational Strategy via Mind Mapping Presentation. This infographic-style slide uses a head silhouette and segmented arc to represent five strategic focus areas (A–E), making it perfect for showcasing alignment across departments, initiatives, or leadership goals. Fully customizable in PowerPoint, Keynote, and Google Slides for versatile strategic presentations.


7 slides
5G Benefits Infographic
Step into the ultra-fast world of 5G with our vibrant 5G benefits infographic. Set against a lively pink backdrop with bursts of other vivid colors, this infographic captures the essence of dynamism and speed. Sleek icons paired with concise descriptions highlight the myriad advantages of 5G, from lightning-fast downloads to broader bandwidth. This modern, innovative infographic is ideal for telecom companies, tech enthusiasts, businesses leveraging 5G, and educators discussing modern communication technologies. Designed for adaptability, it's compatible with PowerPoint, Keynote, and Google Slides.


7 slides
Innovation Strategy Infographic Presentation
An Innovation Infographic presents information related to innovation, including why it is important, and how it can be managed in different contexts. Innovation is the process of developing new ideas and products that create value and drive progress. This template is designed to help you effectively communicate the importance of innovation and provide tips and strategies for managing it. This template includes seven customizable layouts and charts, and allows you to include your own images. The template also includes editable text boxes and bullet points to present your information.


7 slides
Cloud Services Infographic Presentation
A Cloud Infographic is a type of visual representation that uses graphic design elements and data to explain and illustrate the concept of cloud computing. This cloud infographic template uses diagrams, charts, and other graphical elements to showcase the benefits and features of cloud computing. This can be used for businesses, education, and individuals to understand and promote the concept of cloud computing. This Cloud template has been designed in a simple but effective style that allows you to focus on your content. This template is designed for powerpoint, keynote and google slides.


26 slides
Kasra Presentation Template
Fitness is an important part of good health. It improves your quality of life and may keep you from getting sick by helping to strengthen your immune system, prevent heart disease and reduce the risk of diabetes and much more. The Kasra template will help you deliver your message with an impact. Whether you're selling your product, promoting an event, or creating a landing page, this template features the necessary components to capture your audience's attention. This provides you with a powerful platform to engage others, illustrate key messages and demonstrate deep insight into an issue.


7 slides
E-Learning System Infographic
E-Learning, short for electronic learning, refers to a learning system or educational approach that utilizes electronic technology, particularly the internet and digital devices, to deliver educational content and facilitate learning. This infographic template is crafted to guide and inspire educators, learners, and e-learning enthusiasts alike. Explore the facets that make up a successful e-learning ecosystem, providing a roadmap for seamless digital education delivery. Compatible with Powerpoint, Keynote, and Google Slides. This infographic is your guide to navigating the digital educational landscape.