


Features
- 6 Unique slides
- Fully editable and easy to edit in Microsoft Powerpoint, Keynote and Google Slides
- 16:9 widescreen layout
- Clean and professional designs
- Export to JPG, PDF or send by email


Do you have any questions?
Recommend


6 slides
Framework for Business Hierarchies Presentation
Clearly define organizational layers with the Framework for Business Hierarchies Presentation. This pyramid-style layout is perfect for illustrating chain-of-command, leadership structures, or functional roles from executive to operational levels. The template features color-coded tiers, editable icons, and fully customizable text to suit your business model. Ideal for PowerPoint, Canva, Keynote, and Google Slides.


26 slides
Entrepreneurship 101 Professional Presentation
This template offers a modern, professional framework for presentations about Entrepreneurship 101. It combines a clean, contemporary design with a palette of cool blues and muted reds, setting a tone that's both creative and serious—just right for the innovative spirit of entrepreneurship. Within its slides, you'll find all the tools needed to outline the essentials of starting a new business, from identifying opportunities to understanding market trends. Perfect for aspiring entrepreneurs, business school classes, or startup workshops, the template includes varied slide types: team introductions, big ideas, comparative analyses, and growth charts. The slides also feature infographics for brainstorming sessions, process flows for business operations, and timeline representations for strategic planning. Designed for adaptability, the template works seamlessly with PowerPoint, Keynote, and Google Slides, ensuring your entrepreneurial vision can be shared with clarity and impact.


7 slides
Healthy Food Infographic
Healthy food is of paramount importance for overall well-being and a good quality of life. This infographic template aims to promote understanding and adoption of a healthy diet through a visually appealing and informative layout. This template is designed to showcase a balanced and nutritious diet by educating individuals on healthy food choices, portion control, and incorporating superfoods into their meals. This infographic is fully customizable and compatible with Powerpoint, Keynote, and Google Slides. This allows you to easily customize, add visuals, and design as per your needs and preferences.


6 slides
Business Advancement Metrics Presentation
Get ready to visualize your wins! This presentation template brings clarity to your metrics, helping you showcase business growth and performance benchmarks with sleek, stacked visuals. Perfect for tracking KPIs, performance analysis, or advancement trends. Fully compatible with PowerPoint, Keynote, and Google Slides for easy editing and seamless presentation delivery.


23 slides
Kale Market Research Presentation
Elevate your market research presentation with this sleek template! Includes sections for introduction, objectives, data collection, analysis, key findings, and recommendations. Perfect for presenting insights, implications, and future research directions. Compatible with PowerPoint, Keynote, and Google Slides, ensuring a visually appealing and professional look. Make your data shine!


5 slides
Competitor Comparison Infographics
A Comparison Infographic is a type of visual representation that displays the similarities and differences between two or more items, concepts, or ideas. This template is perfect to help viewers easily make informed decisions based on the comparison. These infographics are visual representations of data that are used to compare two or more things. These infographics can be used to highlight the differences or similarities between different products, services, companies, or any other entities that can be compared. Included are charts, graphs, tables, and other visual elements to help present information in a clear manner.


6 slides
Asia Map Population Infographic
Explore the demographic dynamics of Asia with our collection of infographic slides, designed to illustrate the population statistics across the continent. These templates are an essential tool for educators, demographers, and business analysts, providing detailed visualizations of population distribution, density, and growth trends. Each infographic combines the map of Asia with engaging graphical elements such as bar graphs, pie charts, and statistical callouts that emphasize key data points like total population, urban versus rural distribution, and demographic forecasts. The color-coding and spatial arrangements on the map effectively highlight variations and trends across different countries and regions, making complex data easy to understand and visually compelling. Fully customizable, these templates allow you to adjust the data presentation to suit specific needs or focuses, such as comparing population growth rates or highlighting demographic challenges. Whether used in presentations, reports, or educational materials, these slides offer a comprehensive and accessible way to communicate the demographic landscape of Asia.


4 slides
Team Planning and Event Calendar
Turn chaos into coordination with this visual-first layout that simplifies how your team plans, tracks, and communicates project milestones. Each calendar block highlights key players, deadlines, and status updates—perfect for keeping everyone aligned and informed at a glance. Fully compatible with PowerPoint, Keynote, and Google Slides.


6 slides
Europe Education Map Infographics
Explore our versatile Europe Education Map infographic template, a valuable resource for visualizing the educational landscape across the continent of Europe. This template is fully compatible with popular presentation software such as PowerPoint, Keynote, and Google Slides, allowing you to effortlessly customize it to meet your specific needs. The Europe Education Map infographic template provides a solid foundation for illustrating data related to educational institutions, literacy rates, and academic trends throughout Europe. Whether you're an educator, researcher, or interested in European education, this template offers a user-friendly platform to create informative presentations and educational materials. Impress your audience with this SEO-optimized Europe Education Map infographic template, designed for clarity and ease of use. Customize it to showcase educational opportunities, achievements, and regional insights, making it a valuable asset for your projects and presentations. Begin crafting your personalized infographic today!


6 slides
Three-Part Comparative Venn Layout Presentation
Showcase relationships, overlaps, and distinctions across three core elements with this elegant petal-style Venn layout. Perfect for comparing strategies, audiences, or product features. Each section includes customizable labels and icons. Fully editable in PowerPoint, Keynote, and Google Slides—ideal for business analysis, educational presentations, and marketing plans.


23 slides
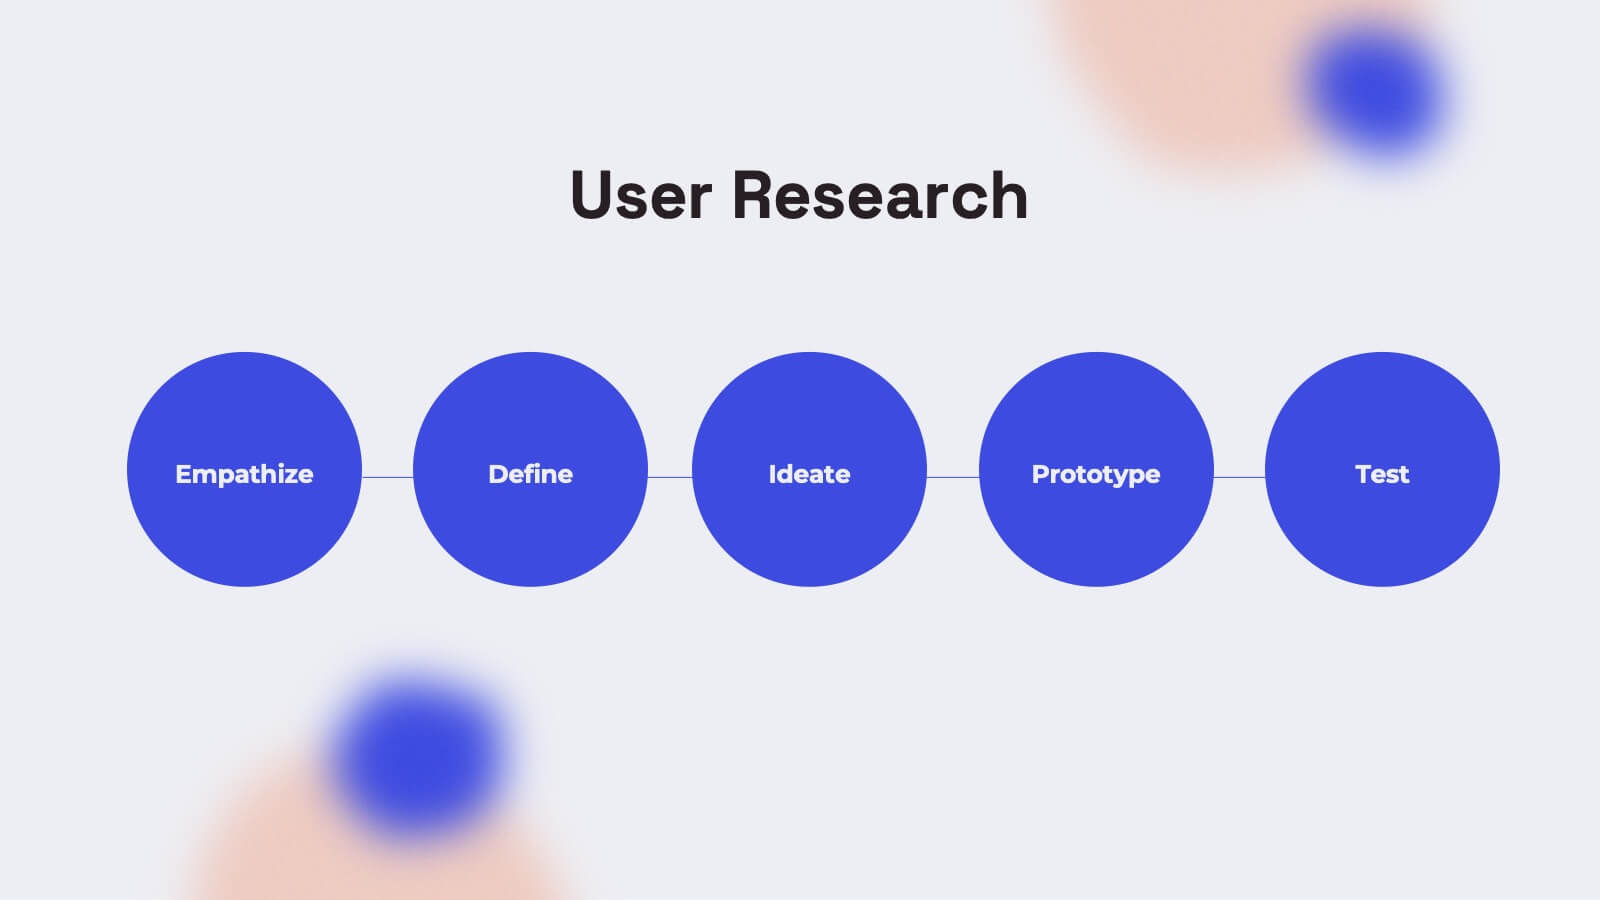
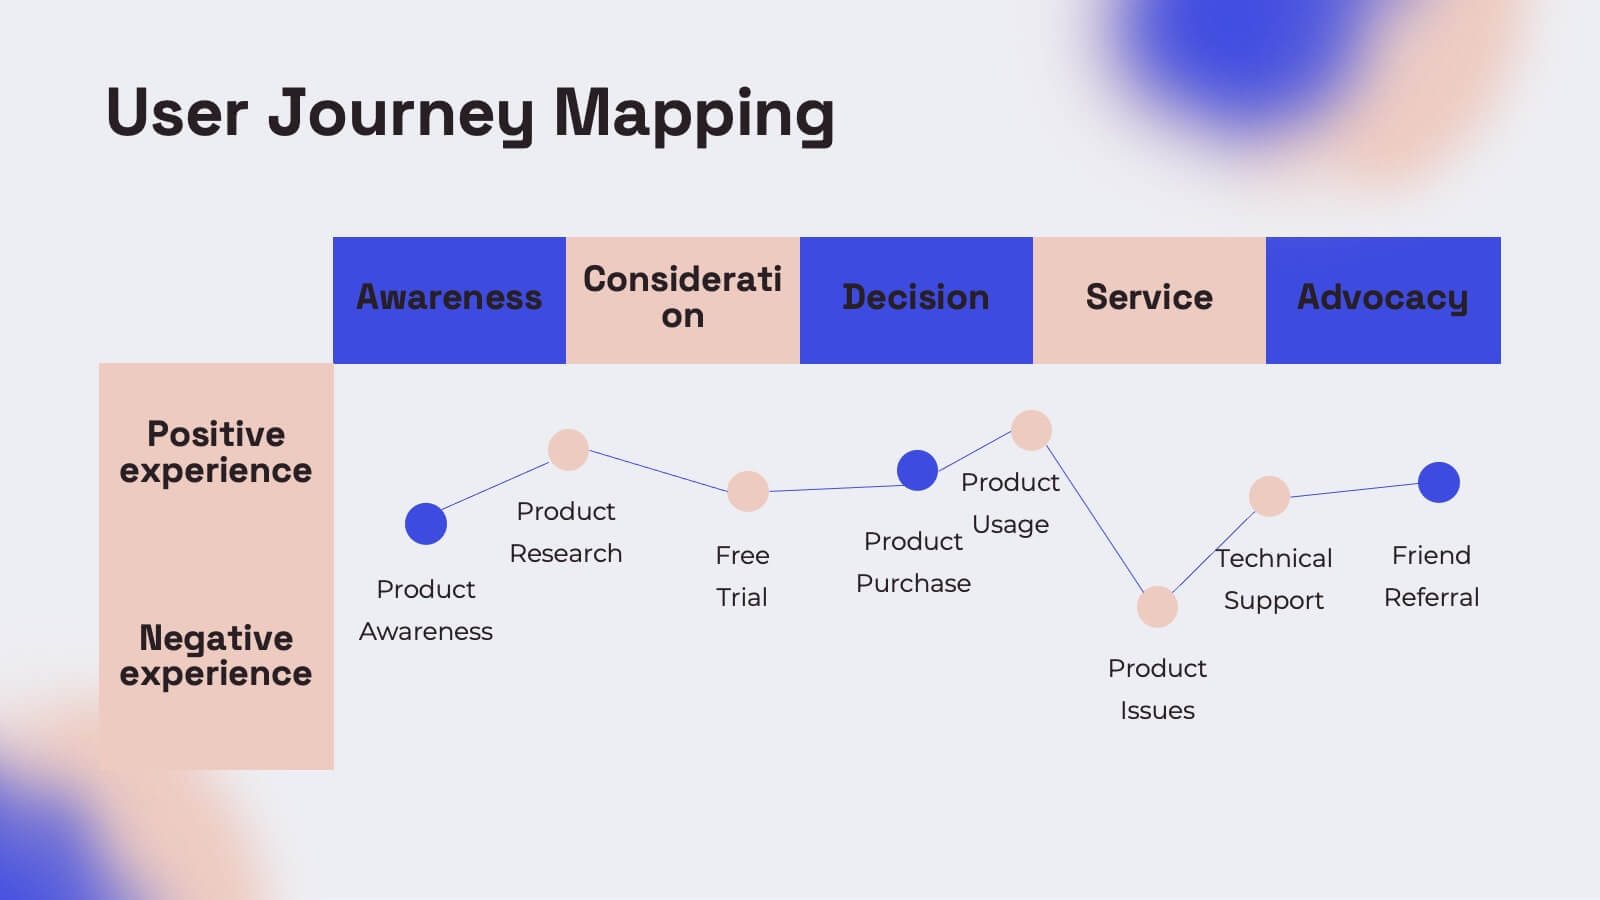
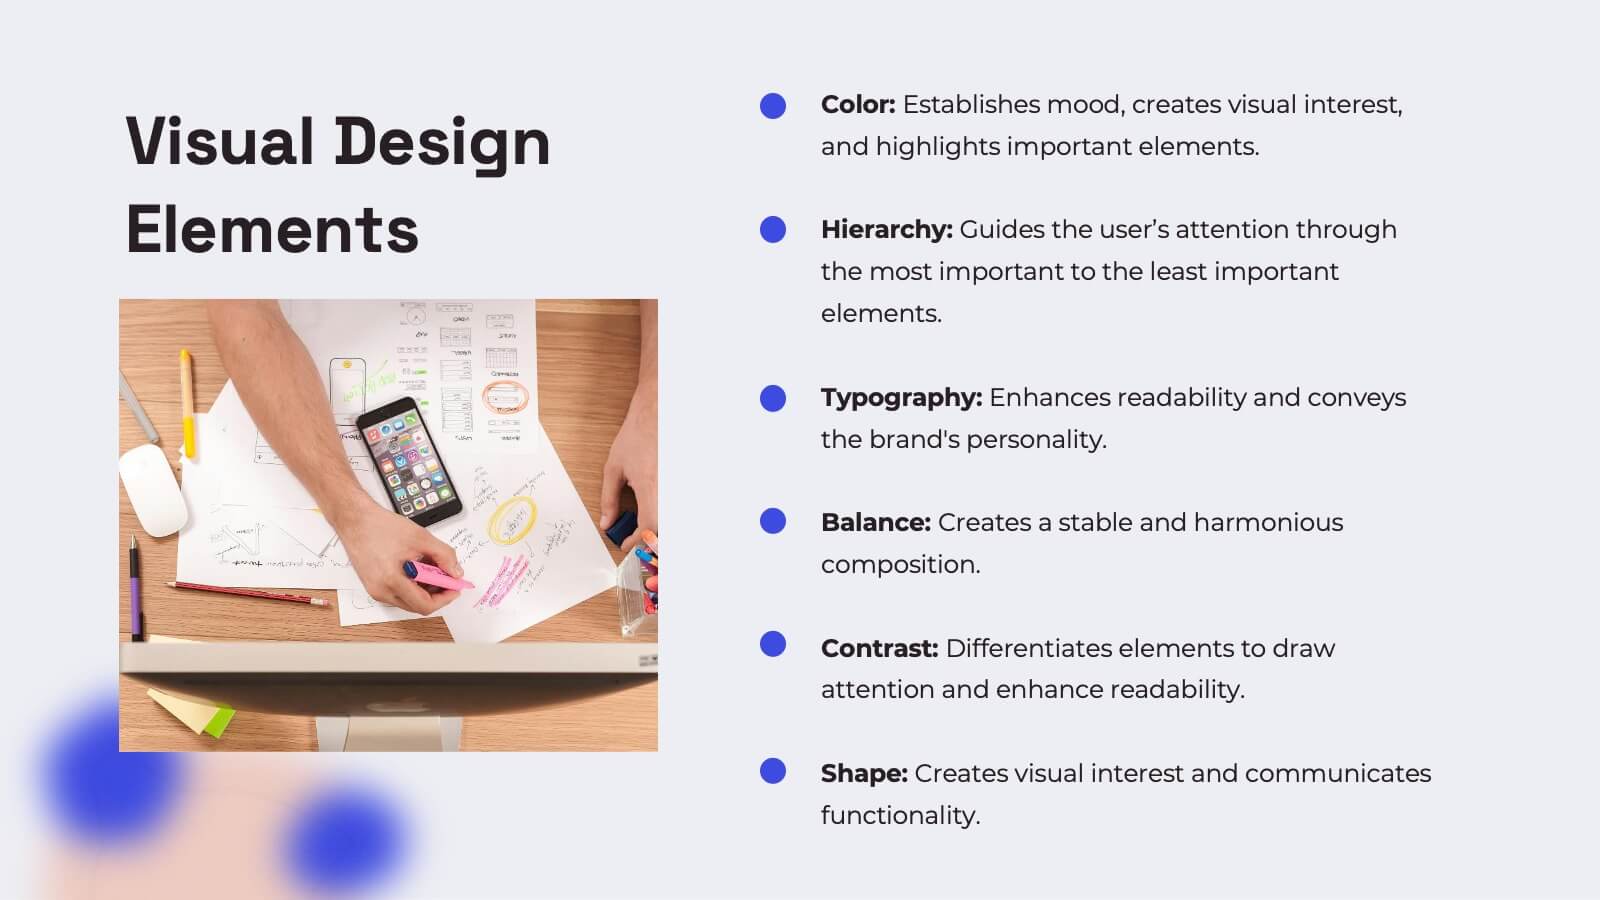
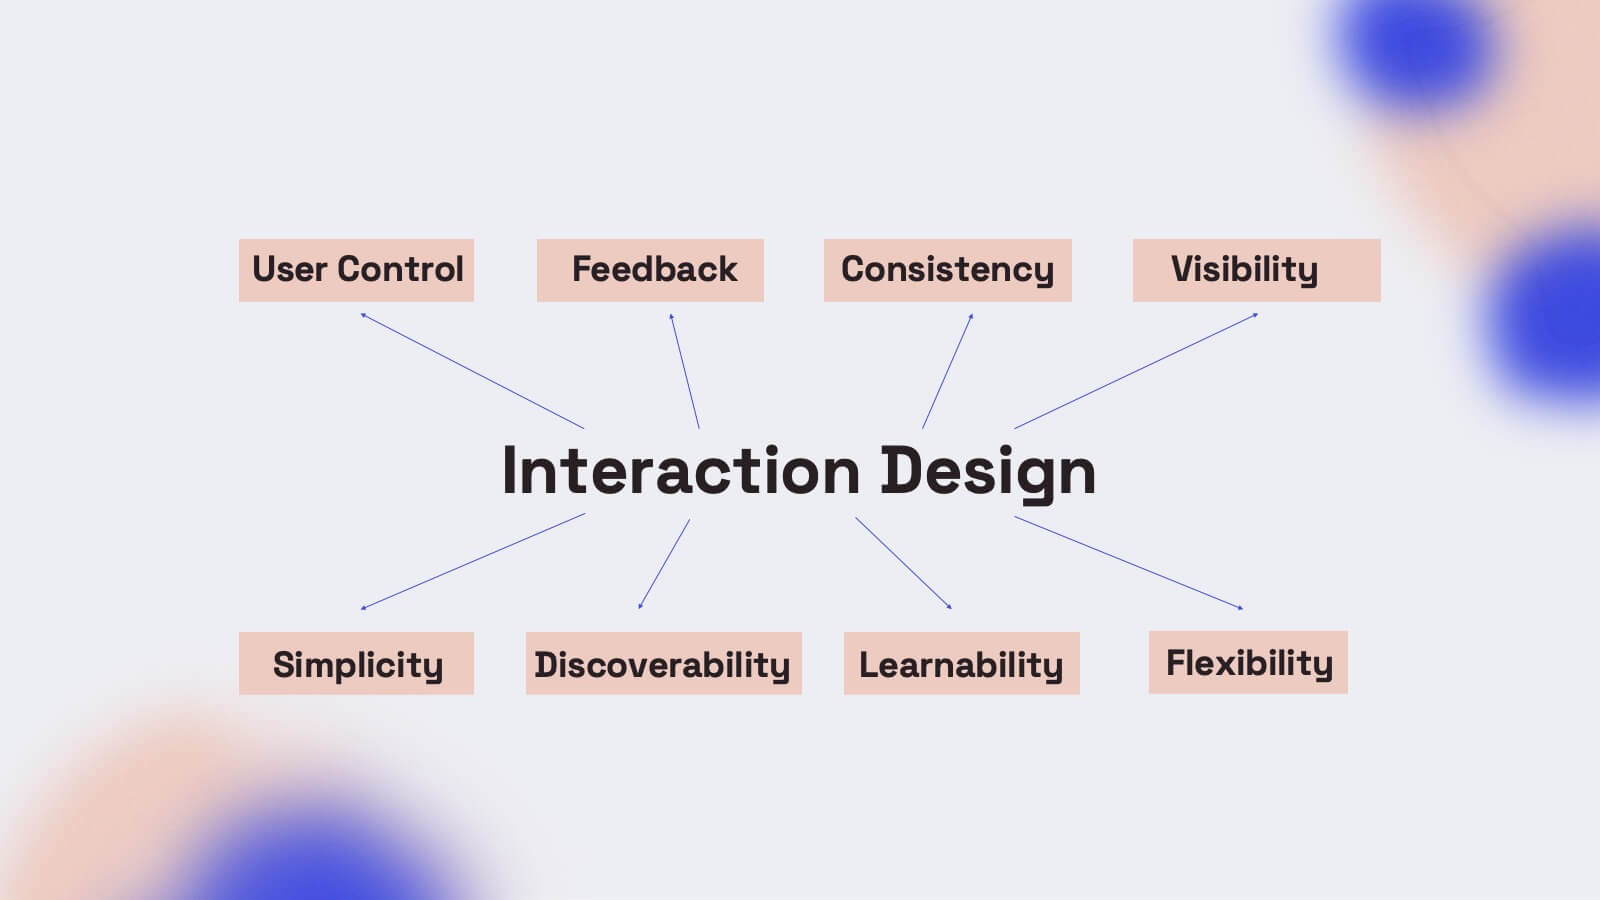
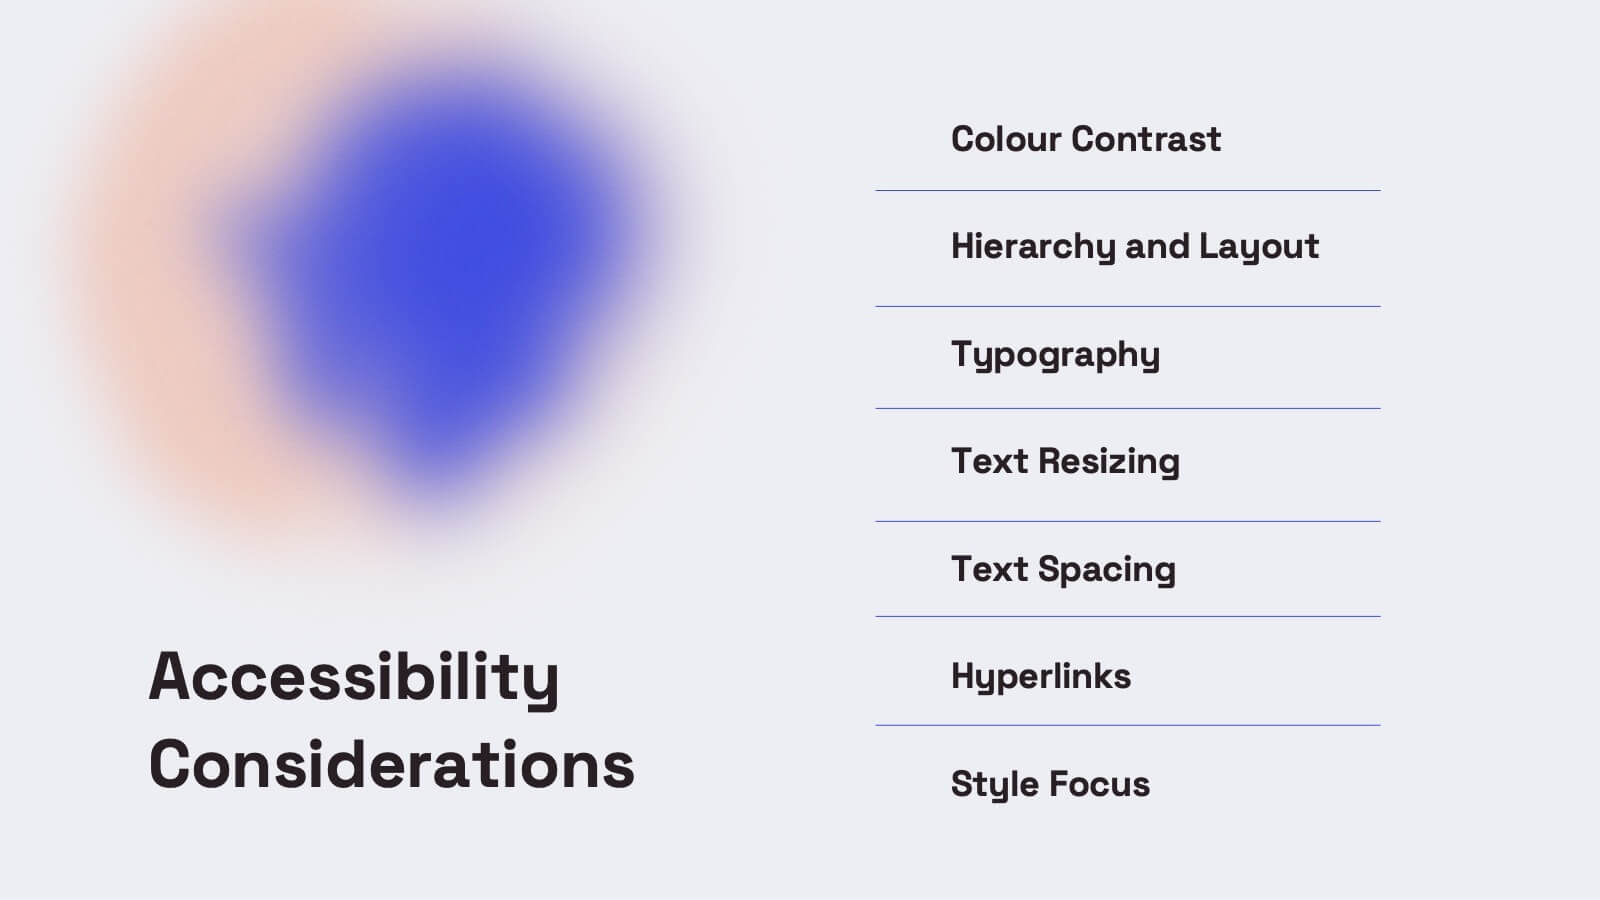
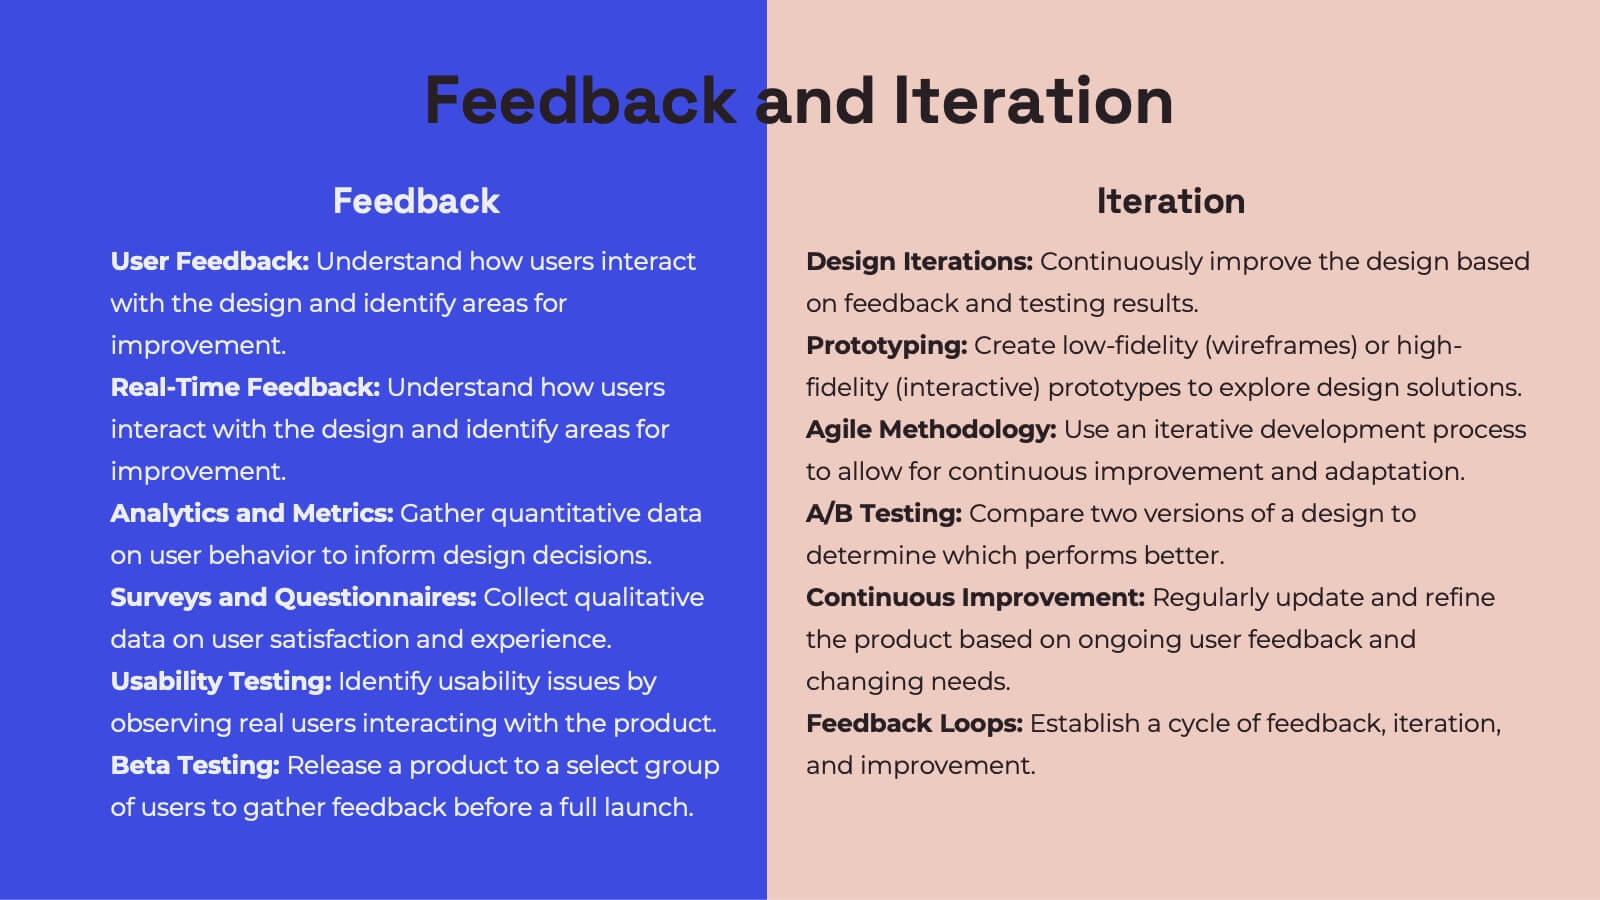
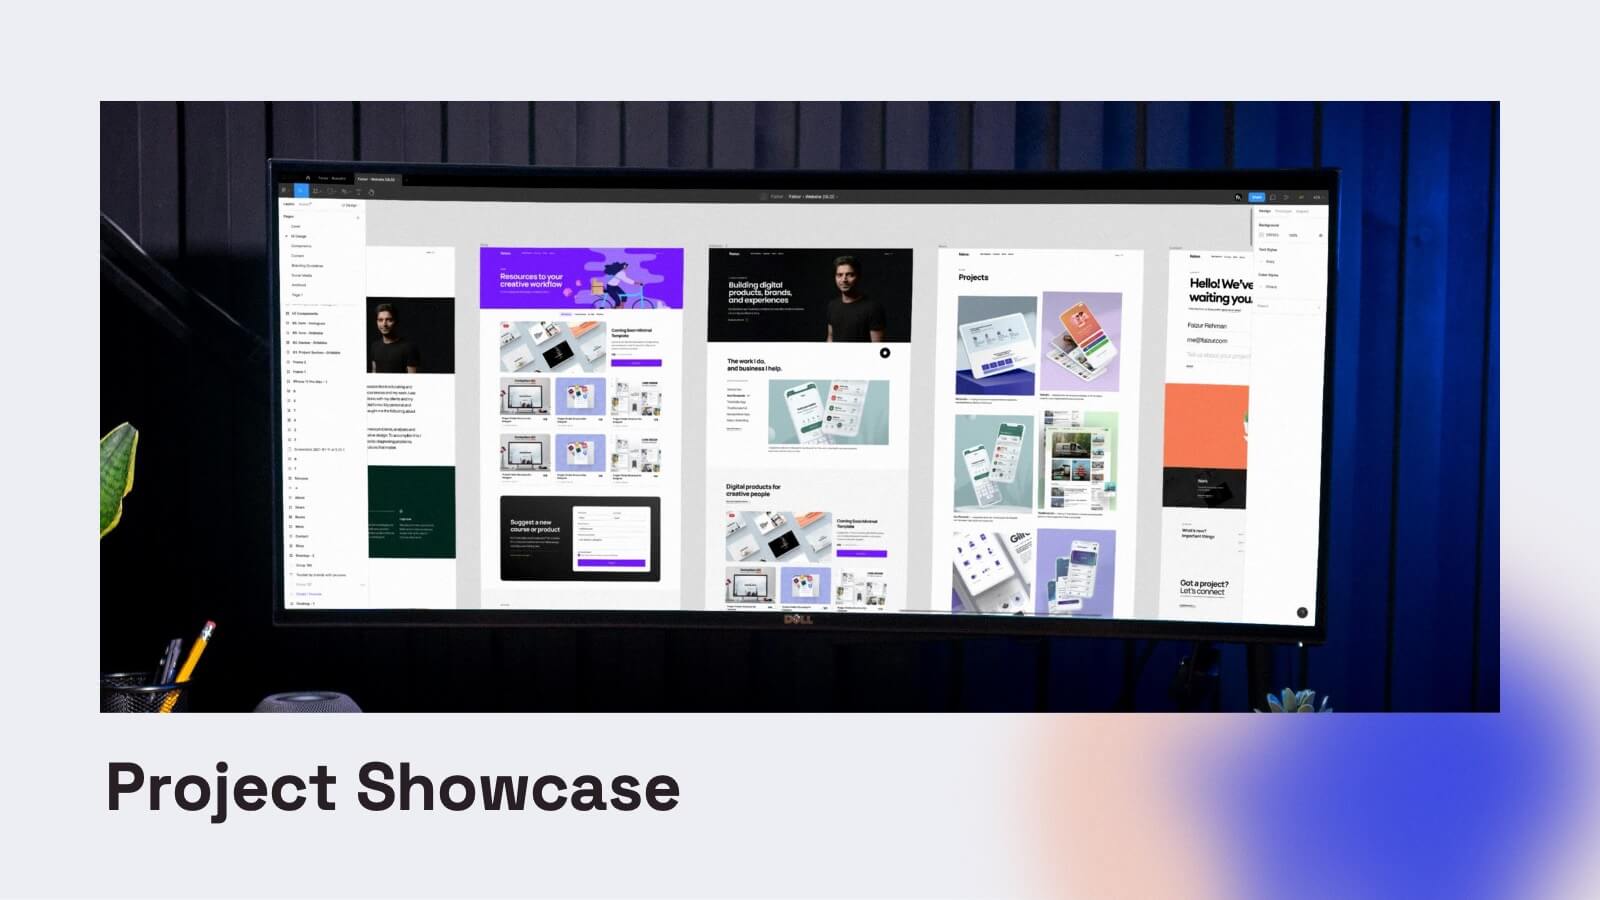
Gemini UX Design Presentation
Enhance your UX presentations with this vibrant and user-friendly template. Designed to cover every aspect of UX design, from user research and personas to wireframes and prototyping, this template ensures a comprehensive and engaging delivery. Its modern design and structured layout make your insights clear and impactful. Compatible with PowerPoint, Keynote, and Google Slides, it's perfect for any platform.


6 slides
6-Step Business Process Presentation
Clearly map out workflows with this 6-step business process presentation. Ideal for project managers and strategists, this horizontal timeline helps break complex tasks into digestible phases. With editable icons, color highlights, and step-by-step layout, it's easy to customize in PowerPoint, Keynote, or Google Slides for any professional setting.


6 slides
TAM SAM SOM Market Infographic
TAM, SAM, and SOM are terms used in business and marketing to represent different levels of market potential and segmentation. This Infographic is a visual representation that explains the concepts of Total Addressable Market (TAM), Serviceable Available Market (SAM), and Serviceable Obtainable Market (SOM) in the context of business and market analysis. This template will encourage your audience to share this infographic to help make informed decisions about market strategies and growth potential. Compatible with Powerpoint, Keynote, and Google Slides. Summarize the benefits of the TAM SAM SOM in market analysis concepts.


6 slides
Work from Home Best Practices Presentation
The "Work from Home Best Practices" presentation template is thoughtfully designed to display metrics and insights for remote work effectiveness. Each slide provides visual elements like bar graphs, line charts, and icon grids to represent various data points such as weekly activity percentage, hours worked, and number of projects managed. This setup is ideal for illustrating best practices and benchmarks in remote work environments, enabling clear communication of goals, achievements, and areas for improvement. The template uses a clean and professional layout with plenty of space for customization, making it a versatile tool for remote teams looking to optimize their workflows and productivity.


5 slides
Butterfly Chart Data Visualization Presentation
The "Butterfly Chart Data Visualization" presentation template is designed for comparative analysis across multiple options, facilitating easy visualization of data such as performance metrics, survey results, or any other quantifiable comparison. Each option is presented with dual opposing bars extending from a central axis, making it effortless to compare two datasets side by side for each category. This layout helps highlight differences and similarities effectively, ideal for presentations that require detailed analysis and clear visual distinctions between data points.


20 slides
Obscuran Sales Performance Report Presentation
Take your sales analysis to the next level with this sleek and professional presentation template. Designed to highlight key areas such as sales objectives, process, performance metrics, competitive analysis, pricing strategy, and future opportunities. This modern layout ensures clarity and impact, making it perfect for sales teams, managers, and stakeholders. Fully customizable and compatible with PowerPoint, Keynote, and Google Slides.


5 slides
Education Jobs Infographics
Education Jobs encompass a wide range of roles and responsibilities focused on providing education, training, and support to learners of all ages. This template is designed to showcase the diverse range of careers available in the education sector. Use this template to inform and inspire individuals interested in pursuing a career in education, whether as teachers, administrators, counselors, researchers, or other specialized roles. With its visually engaging design and comprehensive information, this template will help your audience navigate the world of education jobs and make informed career decisions.