


Features
- 4 Unique slides
- Fully editable and easy to edit in Microsoft Powerpoint, Keynote and Google Slides
- 16:9 widescreen layout
- Clean and professional designs
- Export to JPG, PDF or send by email


Do you have any questions?
Recommend


6 slides
Growth Through Lifelong Learning Presentation
Visualize personal or organizational development with this creative lifelong learning slide. Featuring a human head silhouette and puzzle piece graphics, it's perfect for illustrating stages of learning, training programs, or growth mindset principles. Fully editable in PowerPoint, Keynote, and Google Slides—ideal for educators, coaches, or corporate development professionals.


3 slides
Visual Breakdown with Tree Diagram Format Presentation
Illustrate growth stages, concepts, or layered development with the Visual Breakdown with Tree Diagram Format Presentation. This creative design uses three tree icons—seedling, sapling, and mature tree—to represent progression or hierarchy. Ideal for timelines, product evolution, or strategic planning. Fully editable in PowerPoint, Keynote, and Google Slides.


7 slides
Matrix Diagram Infographic Presentation Template
A matrix diagram, also known as a matrix chart or matrix plot, is a type of chart that is used to compare and contrast different elements or variables. It is typically represented as a grid or table with rows and columns. This template will help show you how different things are related to each other. Use this template to compare and contrast things like products or tasks. It includes grids and tables that you can fill in with your own information. Add your own pictures and colors to make it look more appealing. This template is perfect for your school projects or work presentations.


10 slides
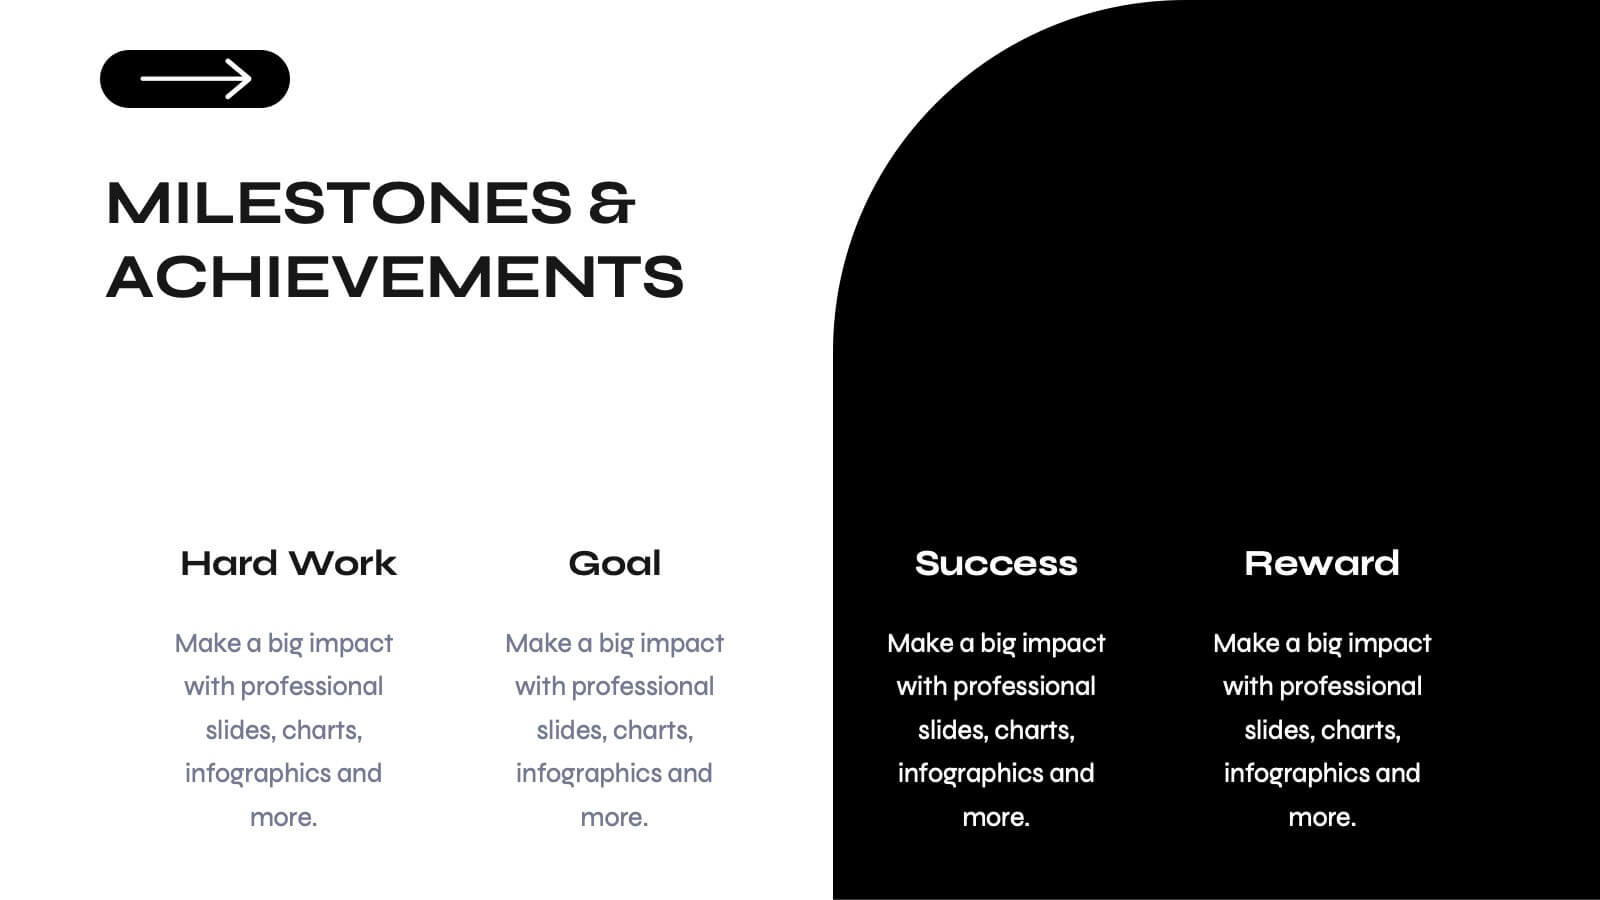
Performance-Based Goal Achievement Presentation
Showcase milestones and celebrate wins with the Performance-Based Goal Achievement slide. This visual roadmap uses a trophy icon and progress ribbon banners to represent four sequential accomplishments or KPIs. Each step is fully editable—perfect for tracking sales targets, employee achievements, or strategic benchmarks. Clean design, color-coded sections, and dark or light mode options make it ideal for presentations in PowerPoint, Keynote, and Google Slides.


6 slides
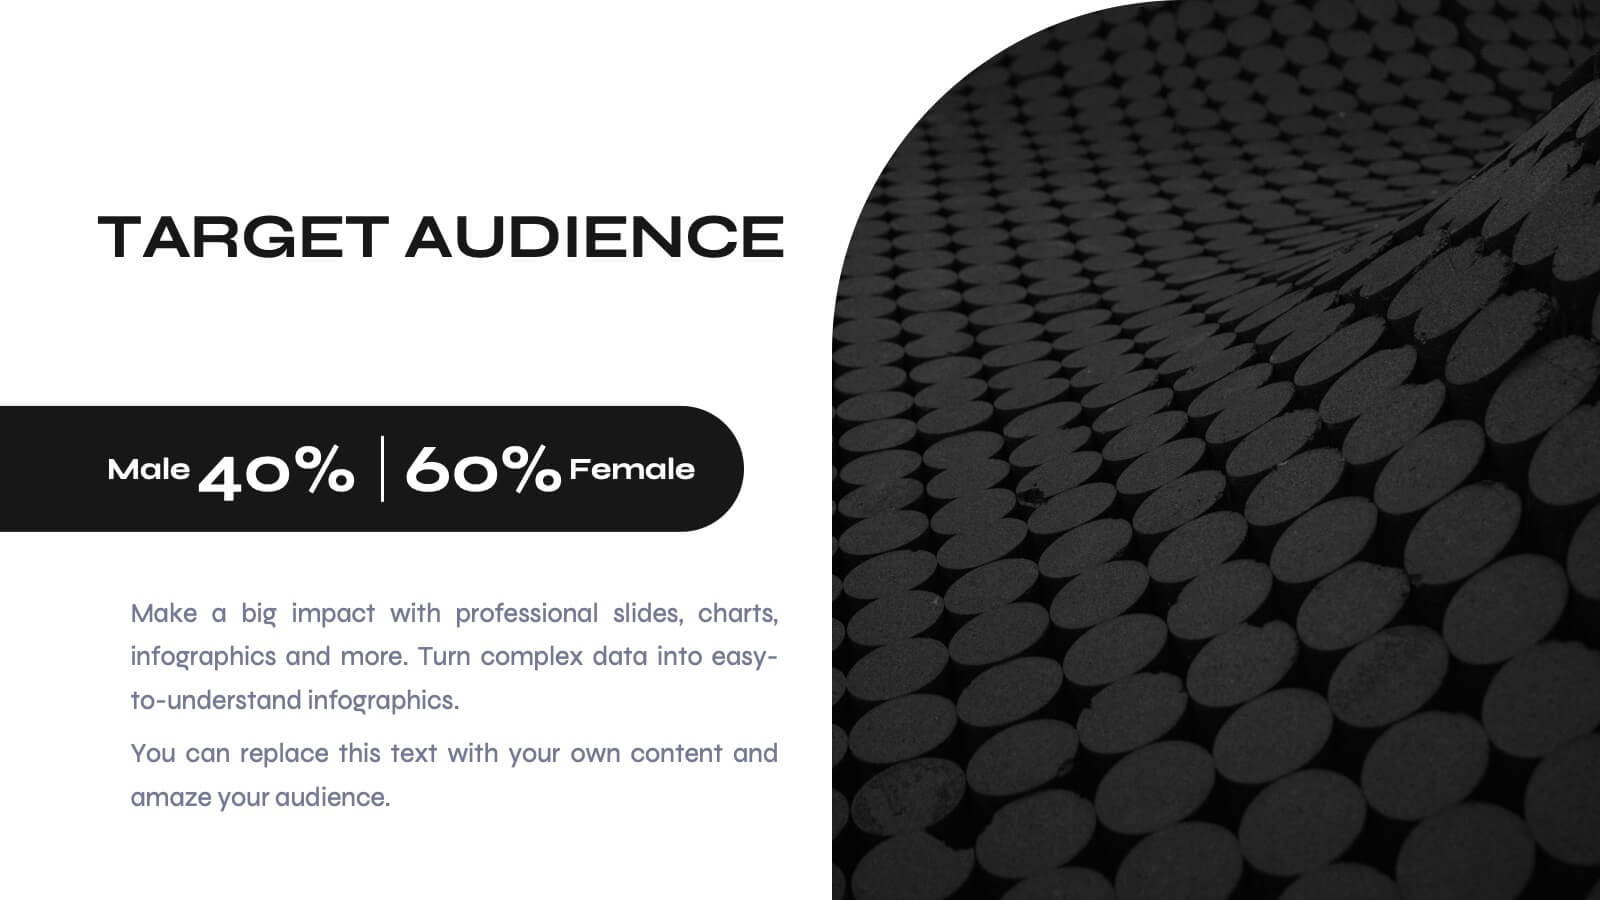
Workforce Development Strategy Presentation
Enhance your workforce development strategies with our "Workforce Development Strategy Presentation" template. This infographic effectively displays essential workforce statistics and initiatives, organizing data into visually distinct segments for clarity. It covers various demographics and departmental roles, color-coded to differentiate data points like gender distribution and participation rates. Ideal for HR professionals and corporate trainers, this template supports strategic decisions in talent management and training. It simplifies complex information, making it accessible for all stakeholders. Compatible with PowerPoint, Keynote, and Google Slides, this template is essential for delivering impactful and strategic human resource presentations.


23 slides
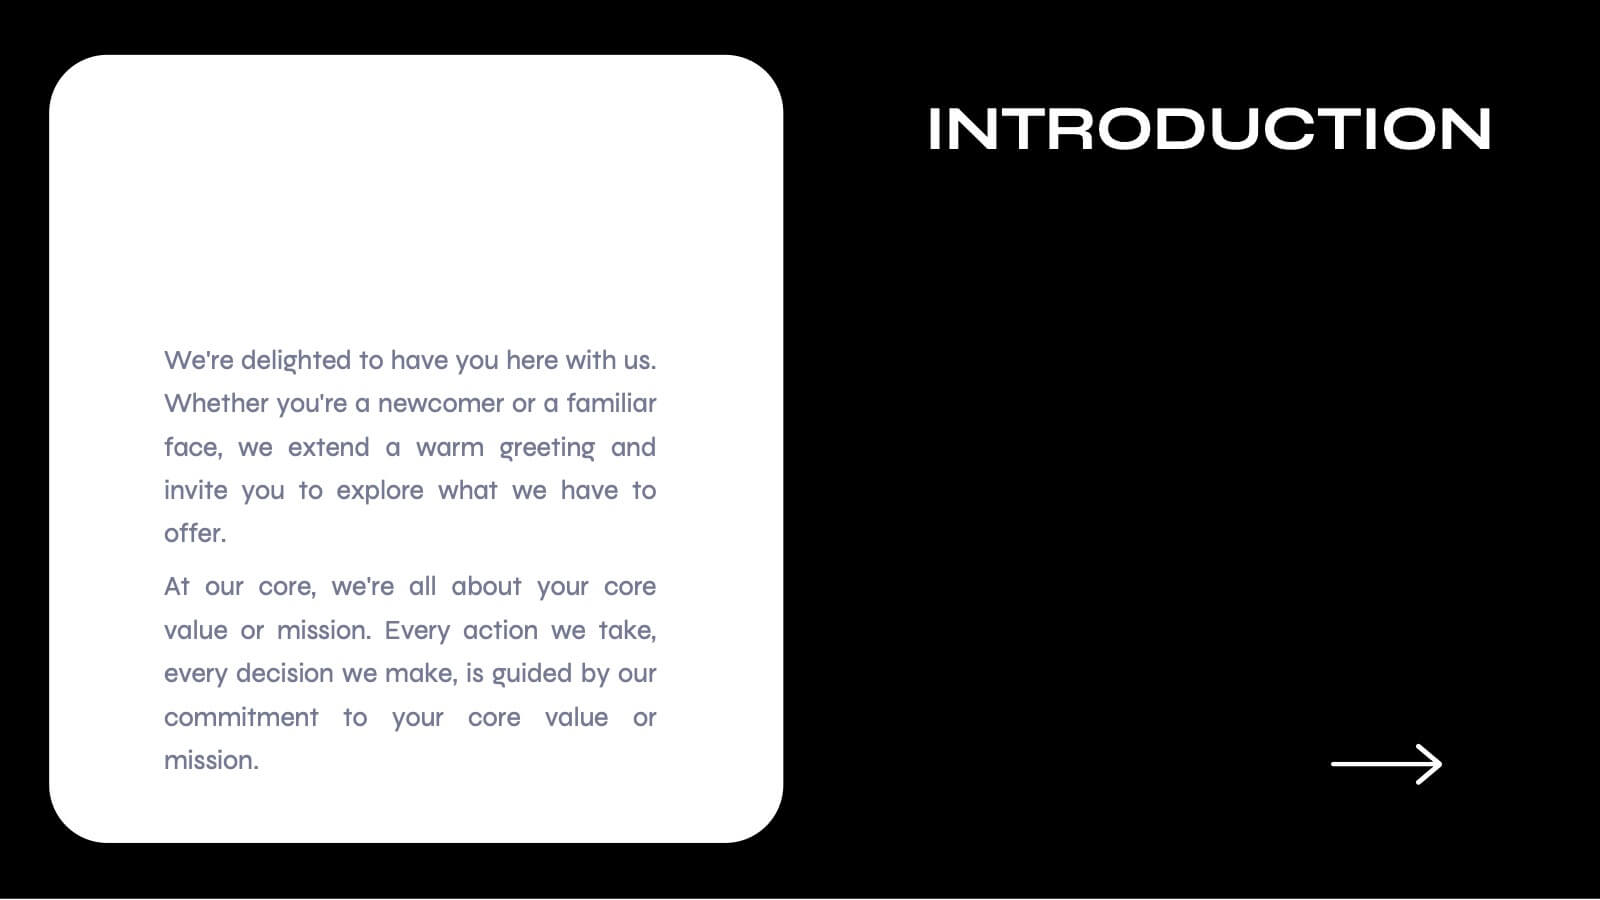
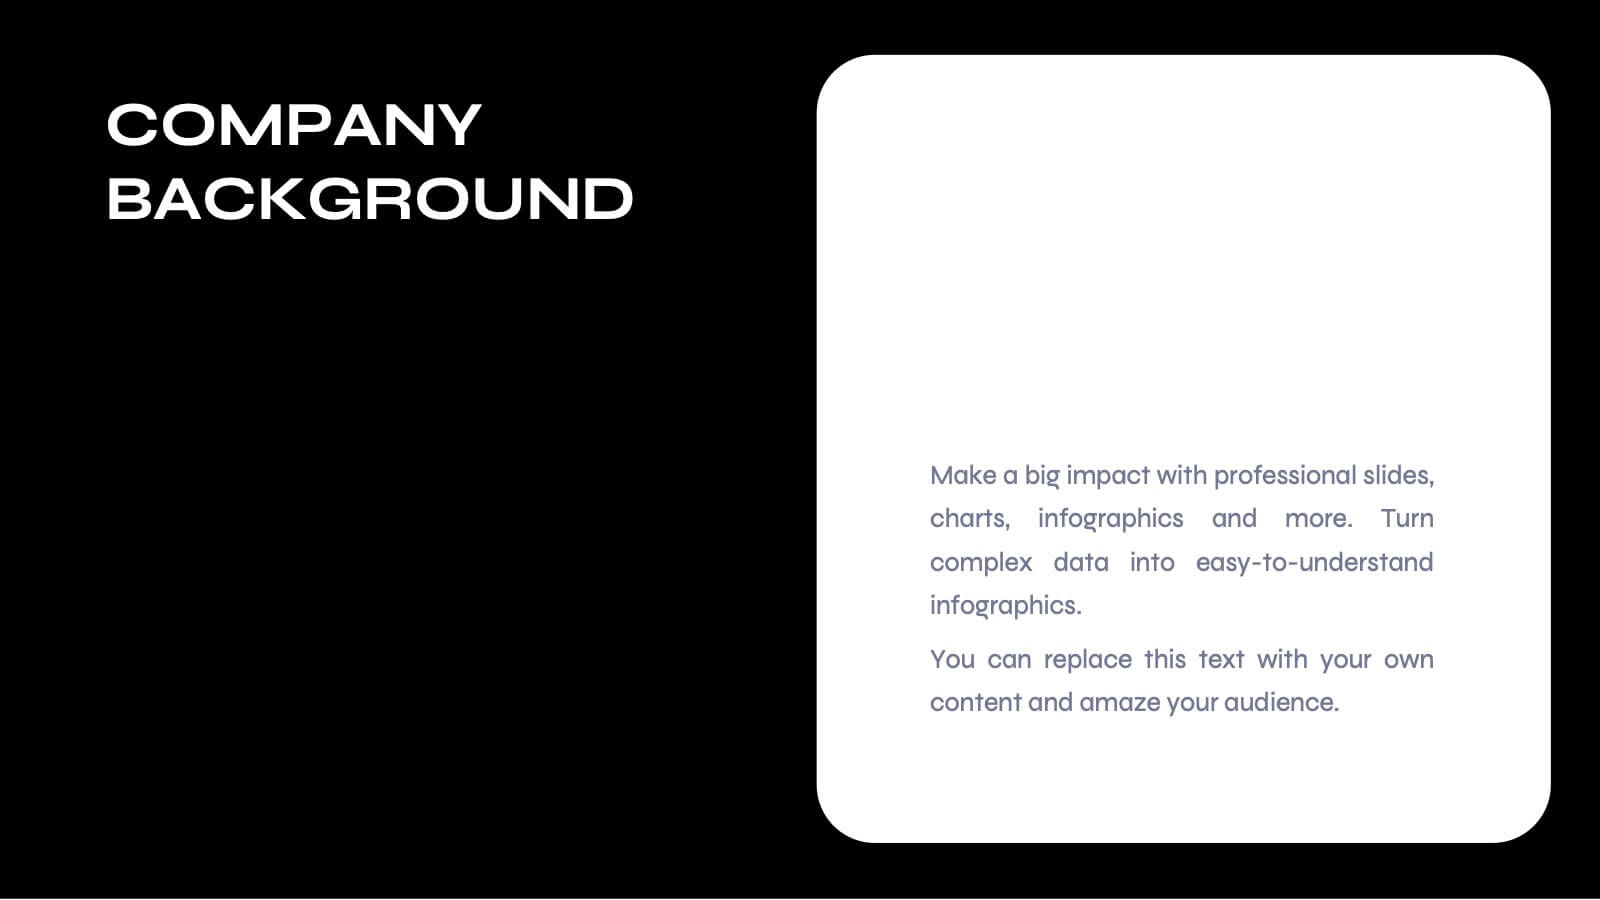
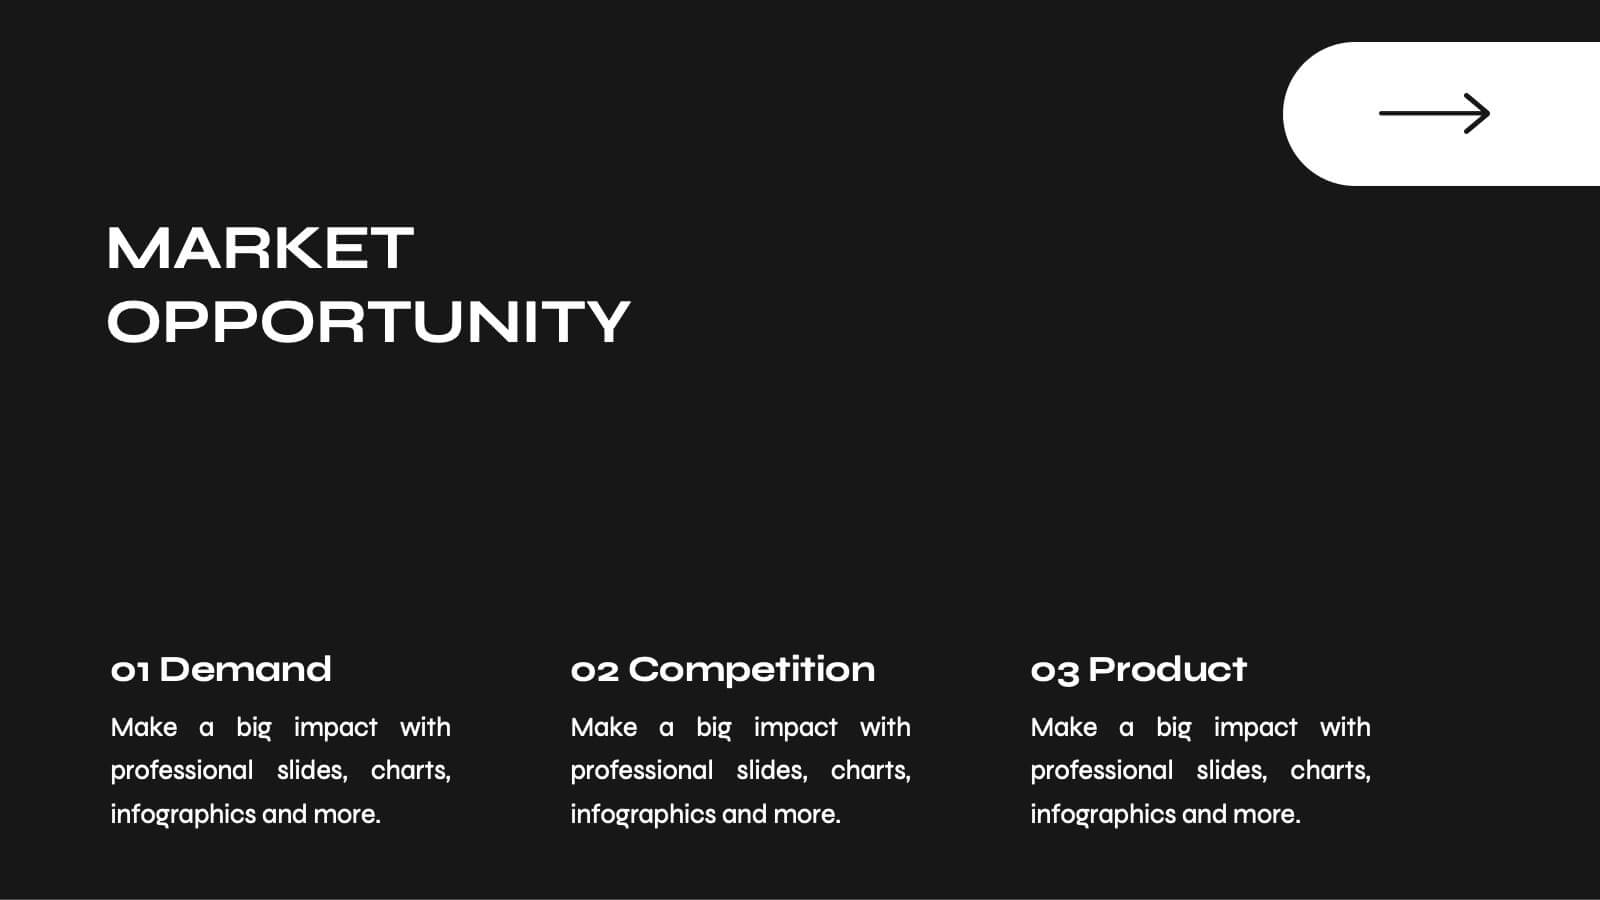
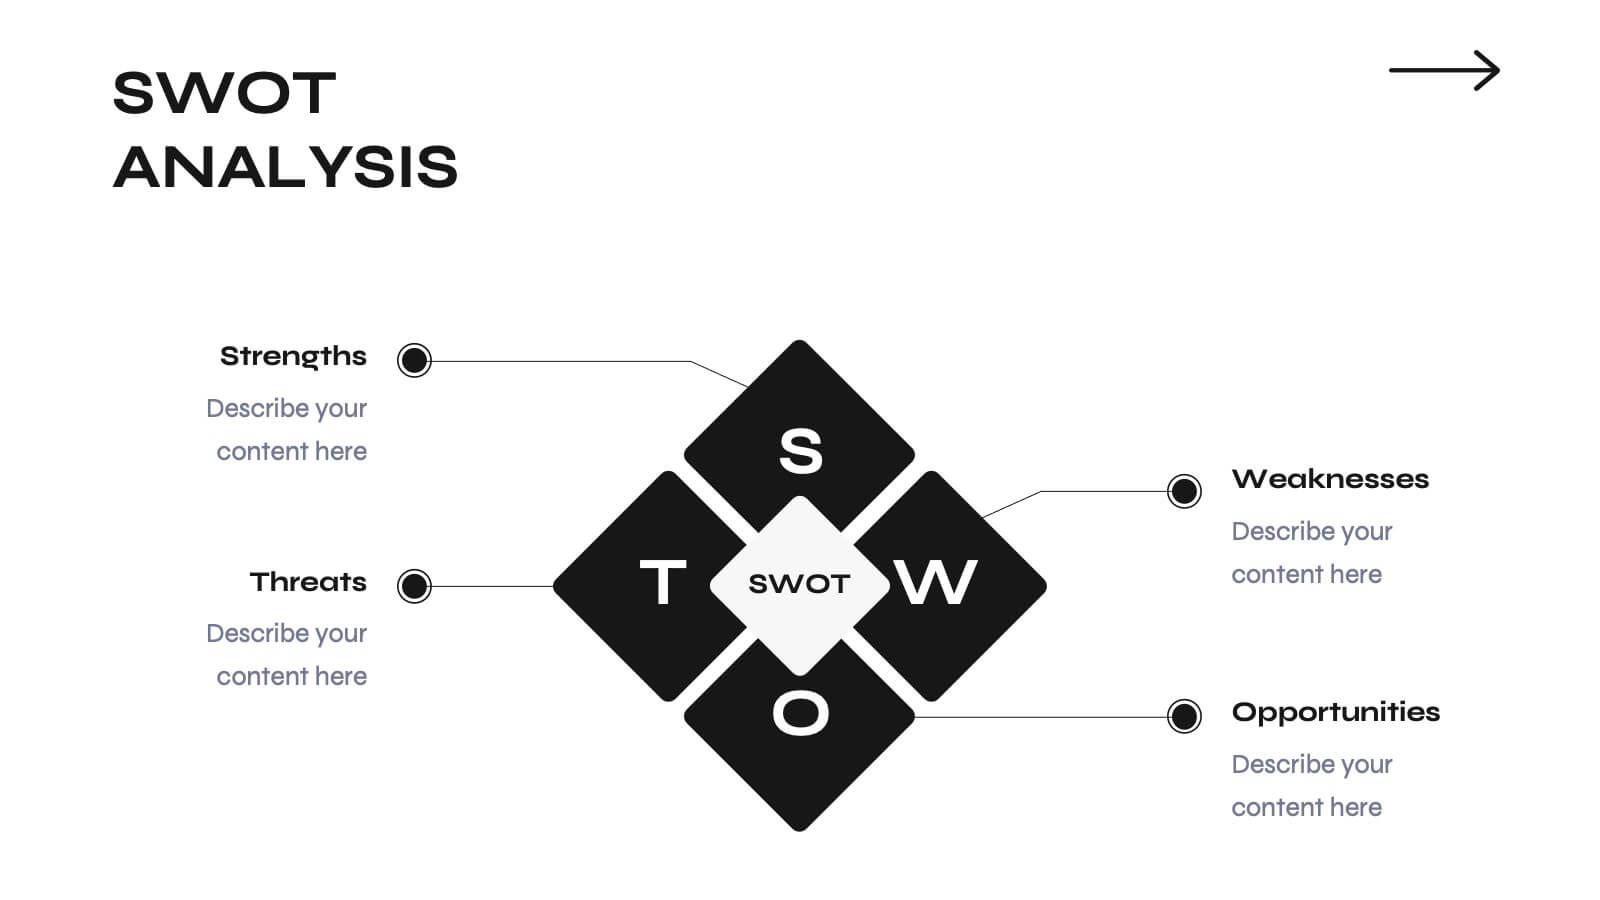
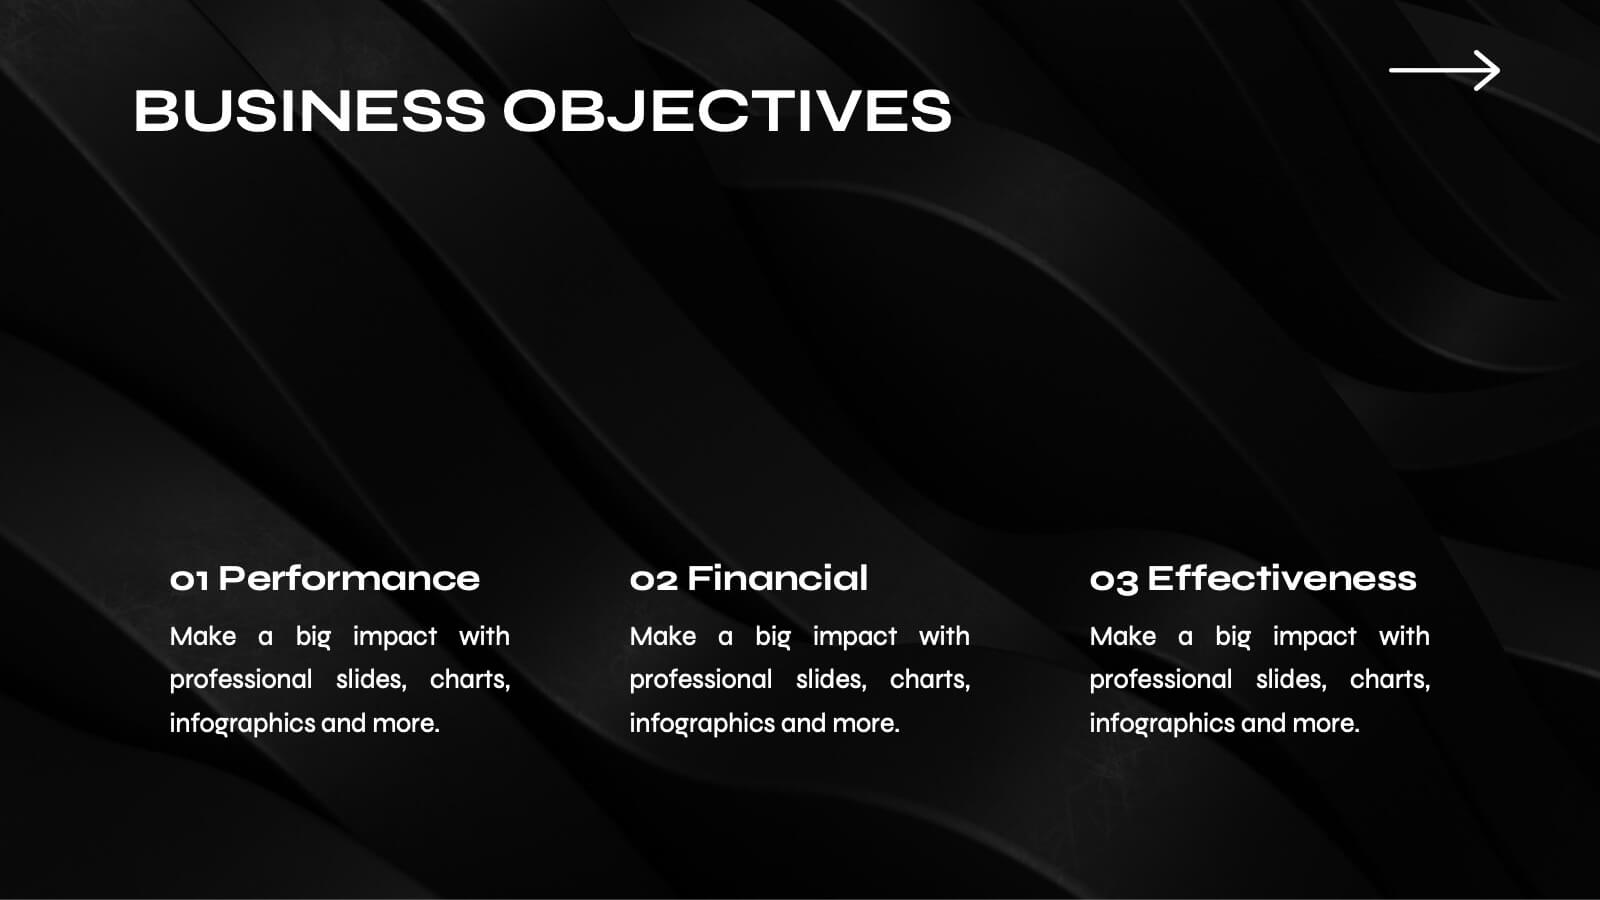
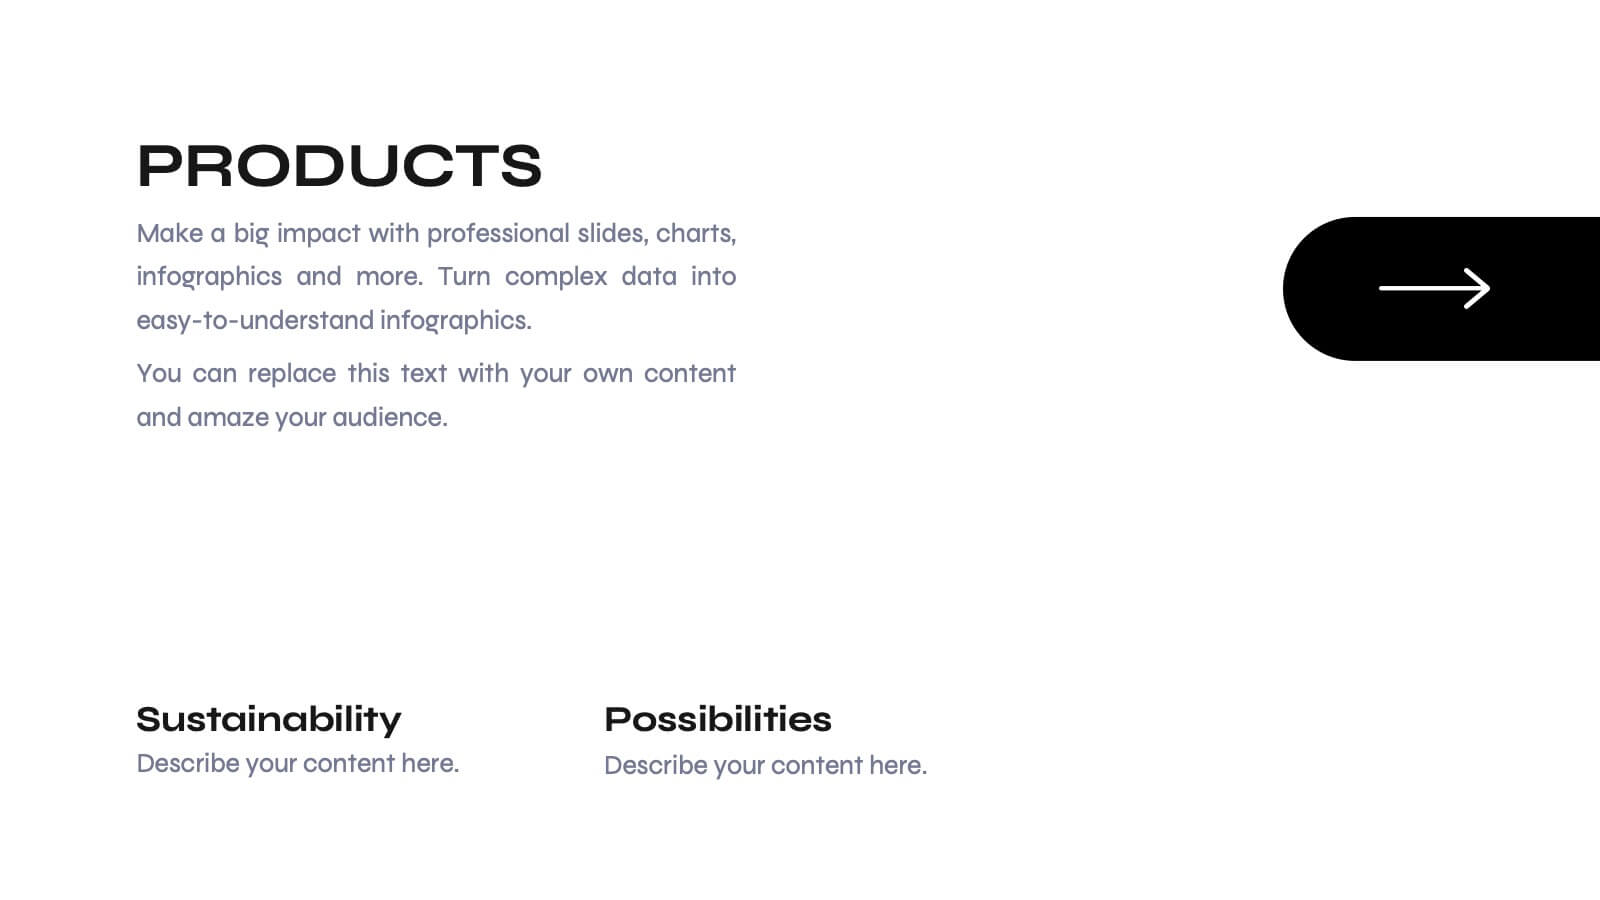
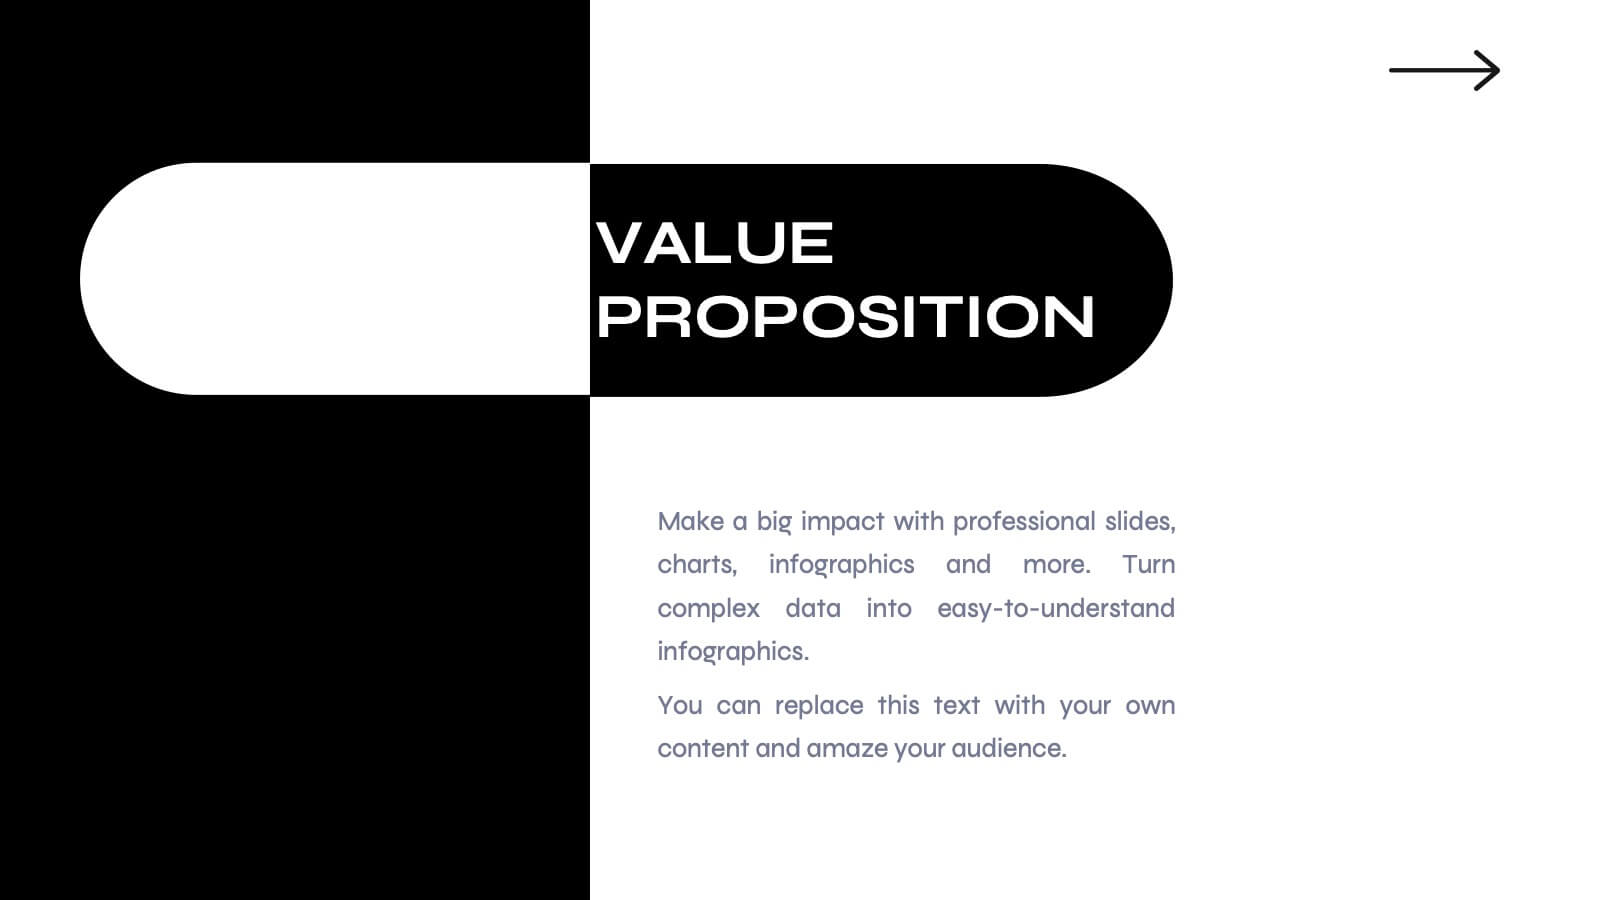
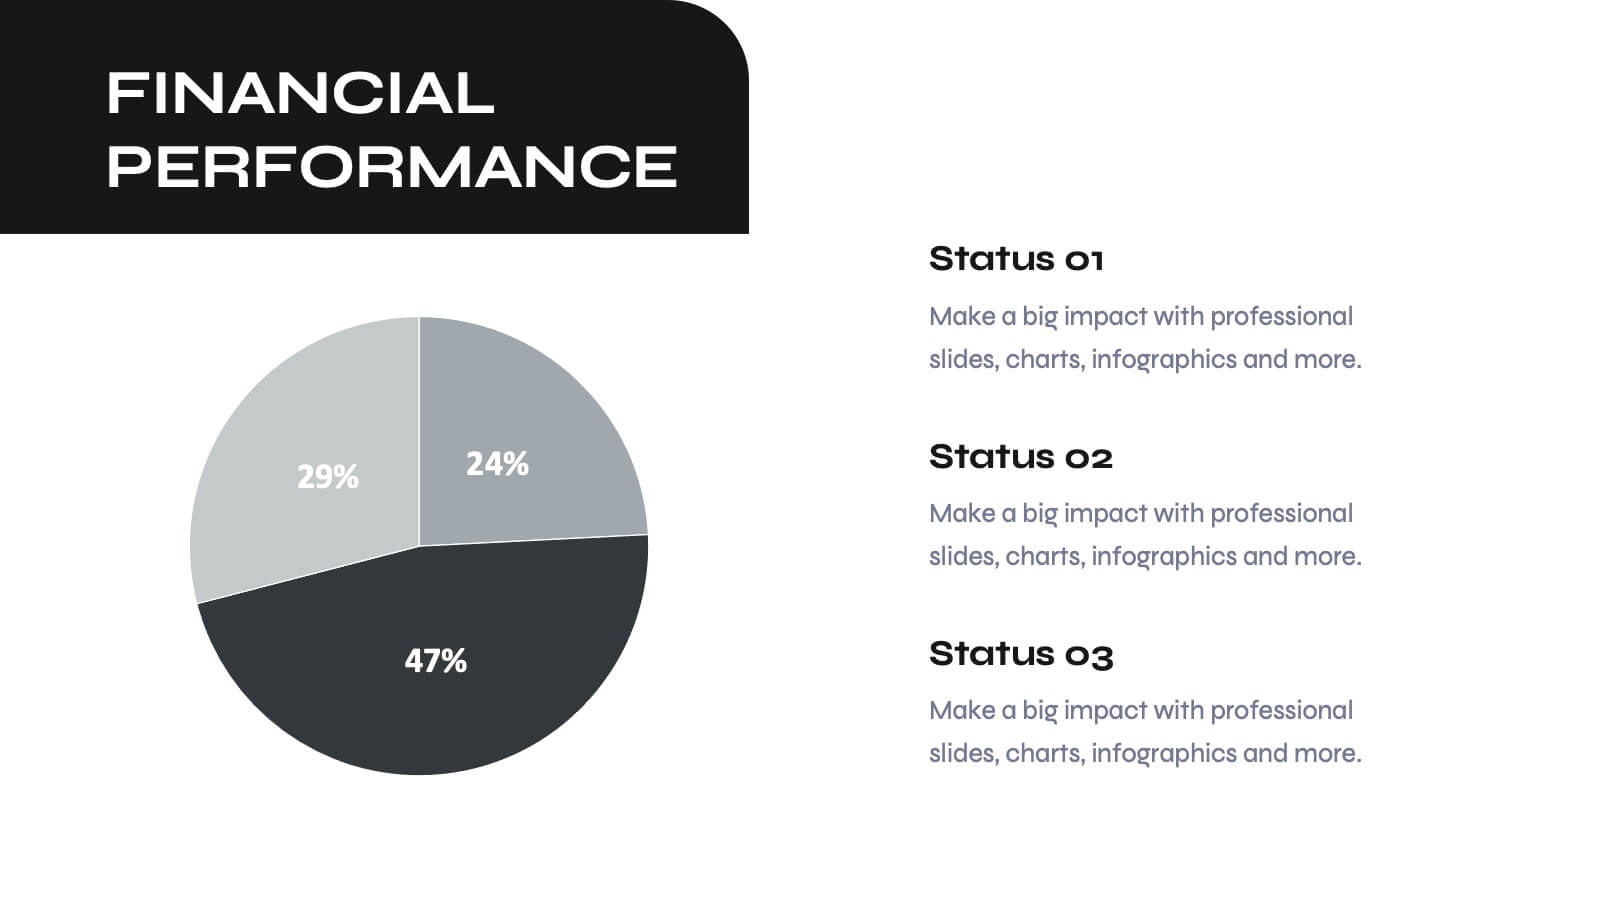
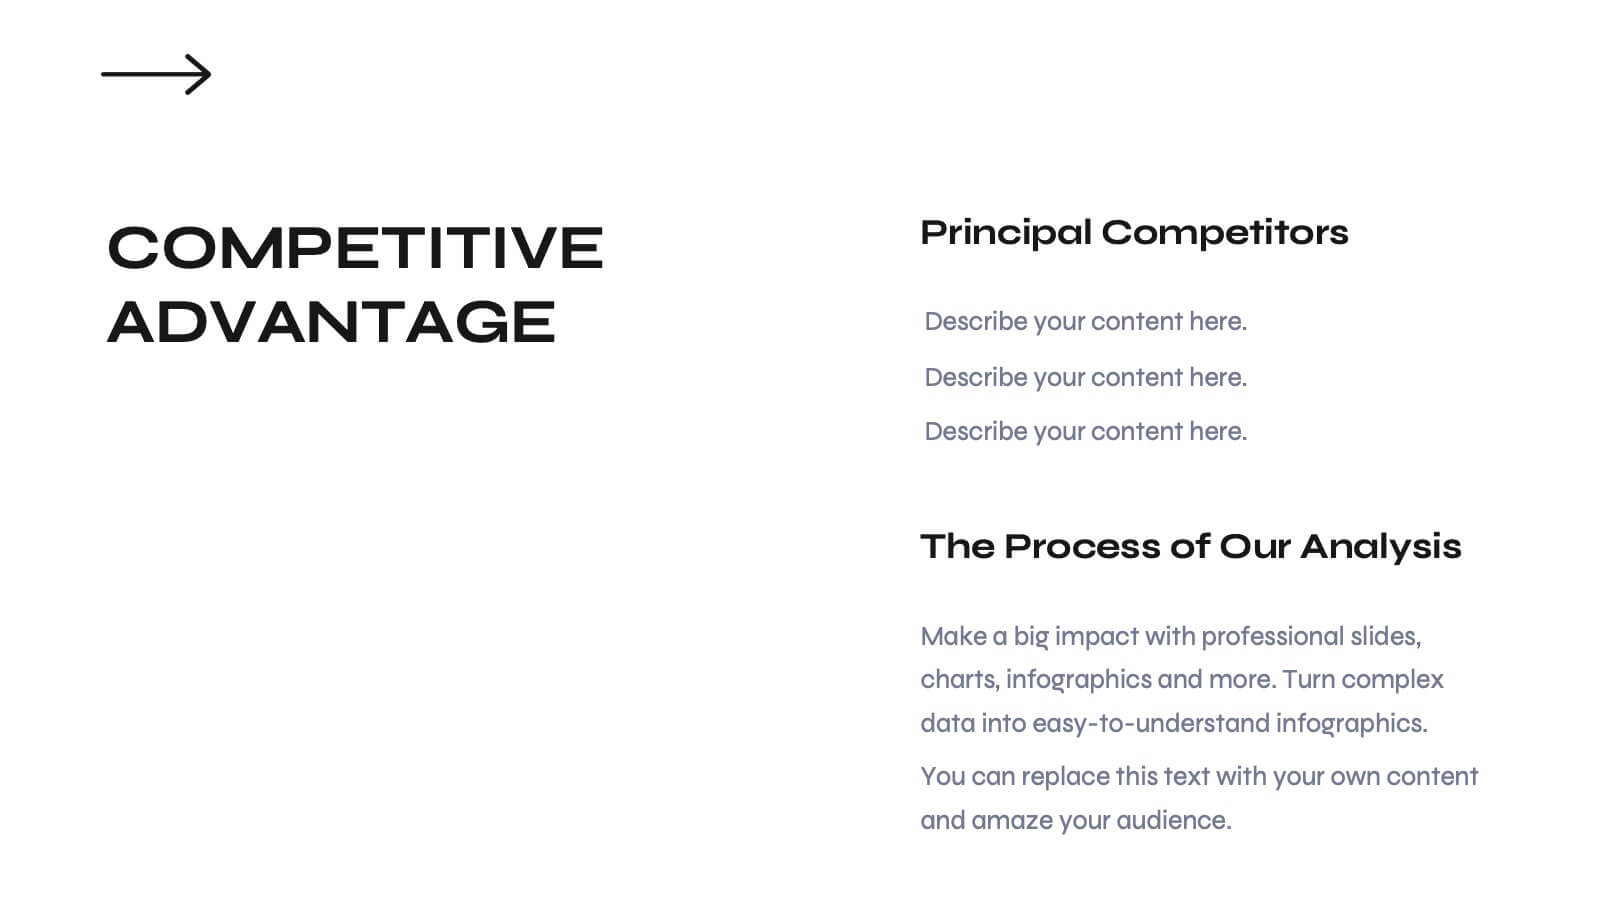
Odyssey Small Business Pitch Deck Presentation
Elevate your business pitch with this sleek, monochrome presentation template. Perfect for presenting company backgrounds, market opportunities, and financial performance, it features a minimalist design that enhances clarity and impact. Highlight your value proposition and strategic plans to captivate investors. Compatible with PowerPoint, Keynote, and Google Slides, it ensures seamless presentations on any platform.
8 slides
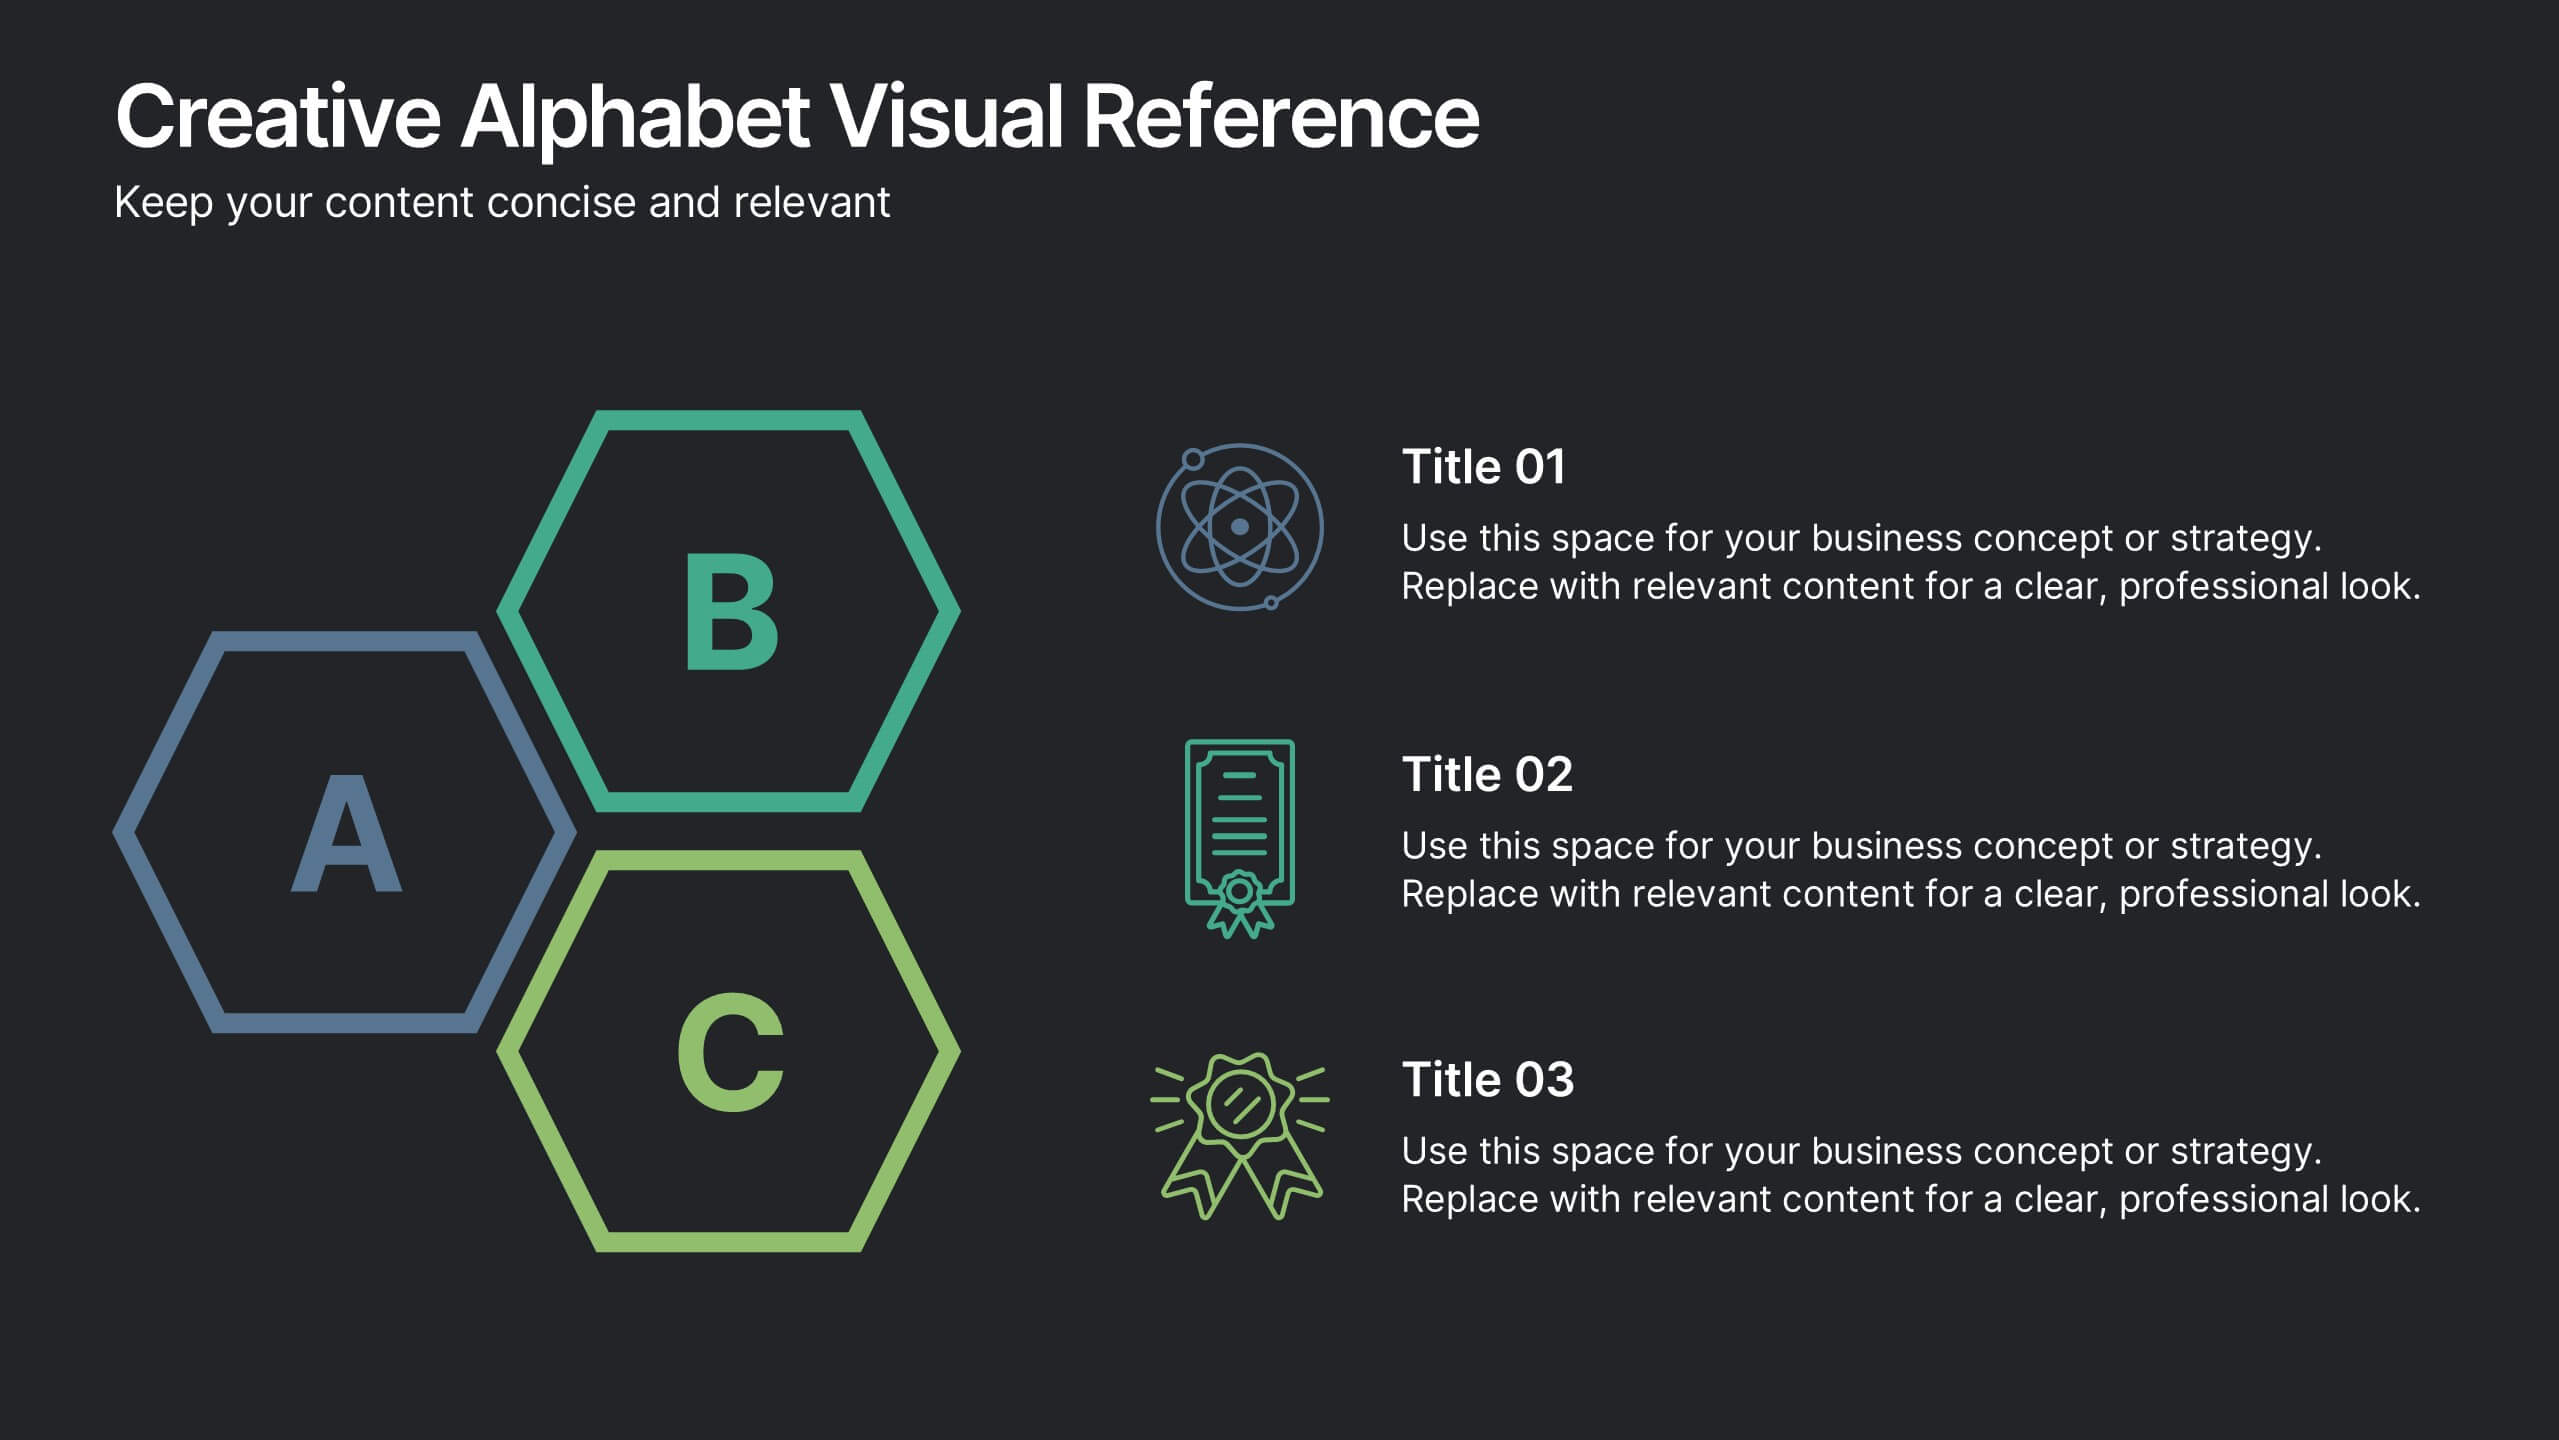
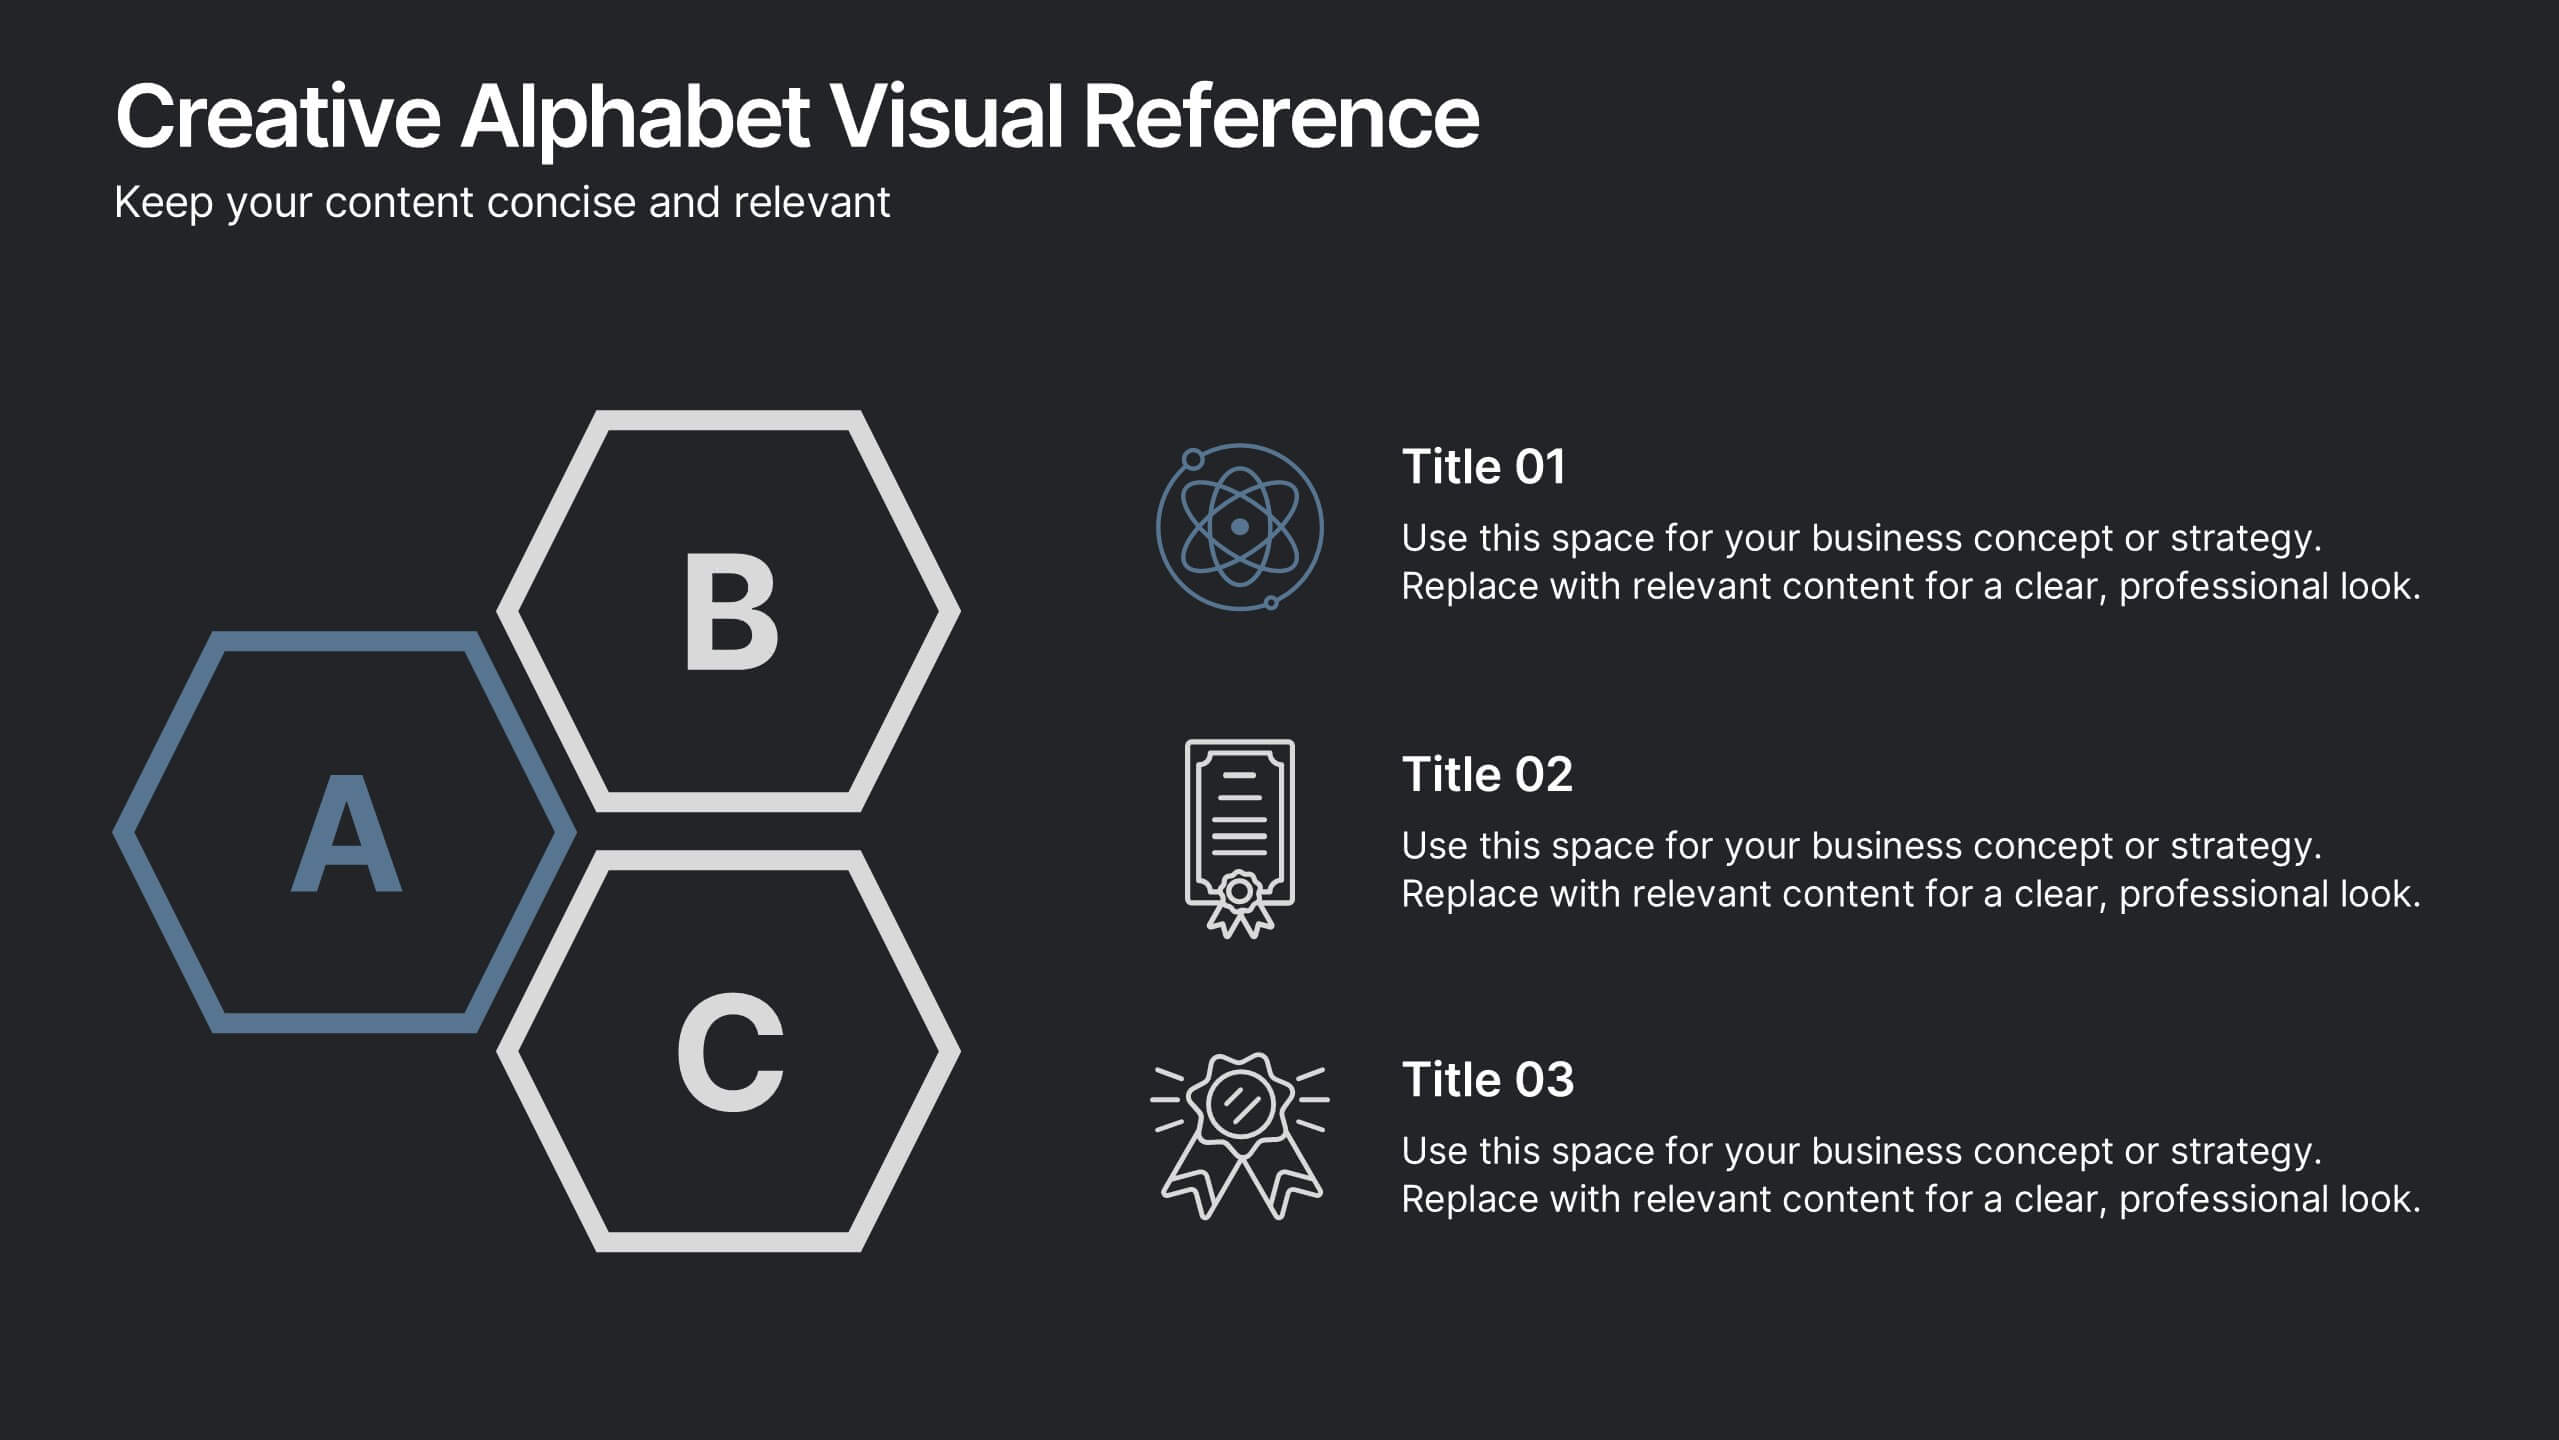
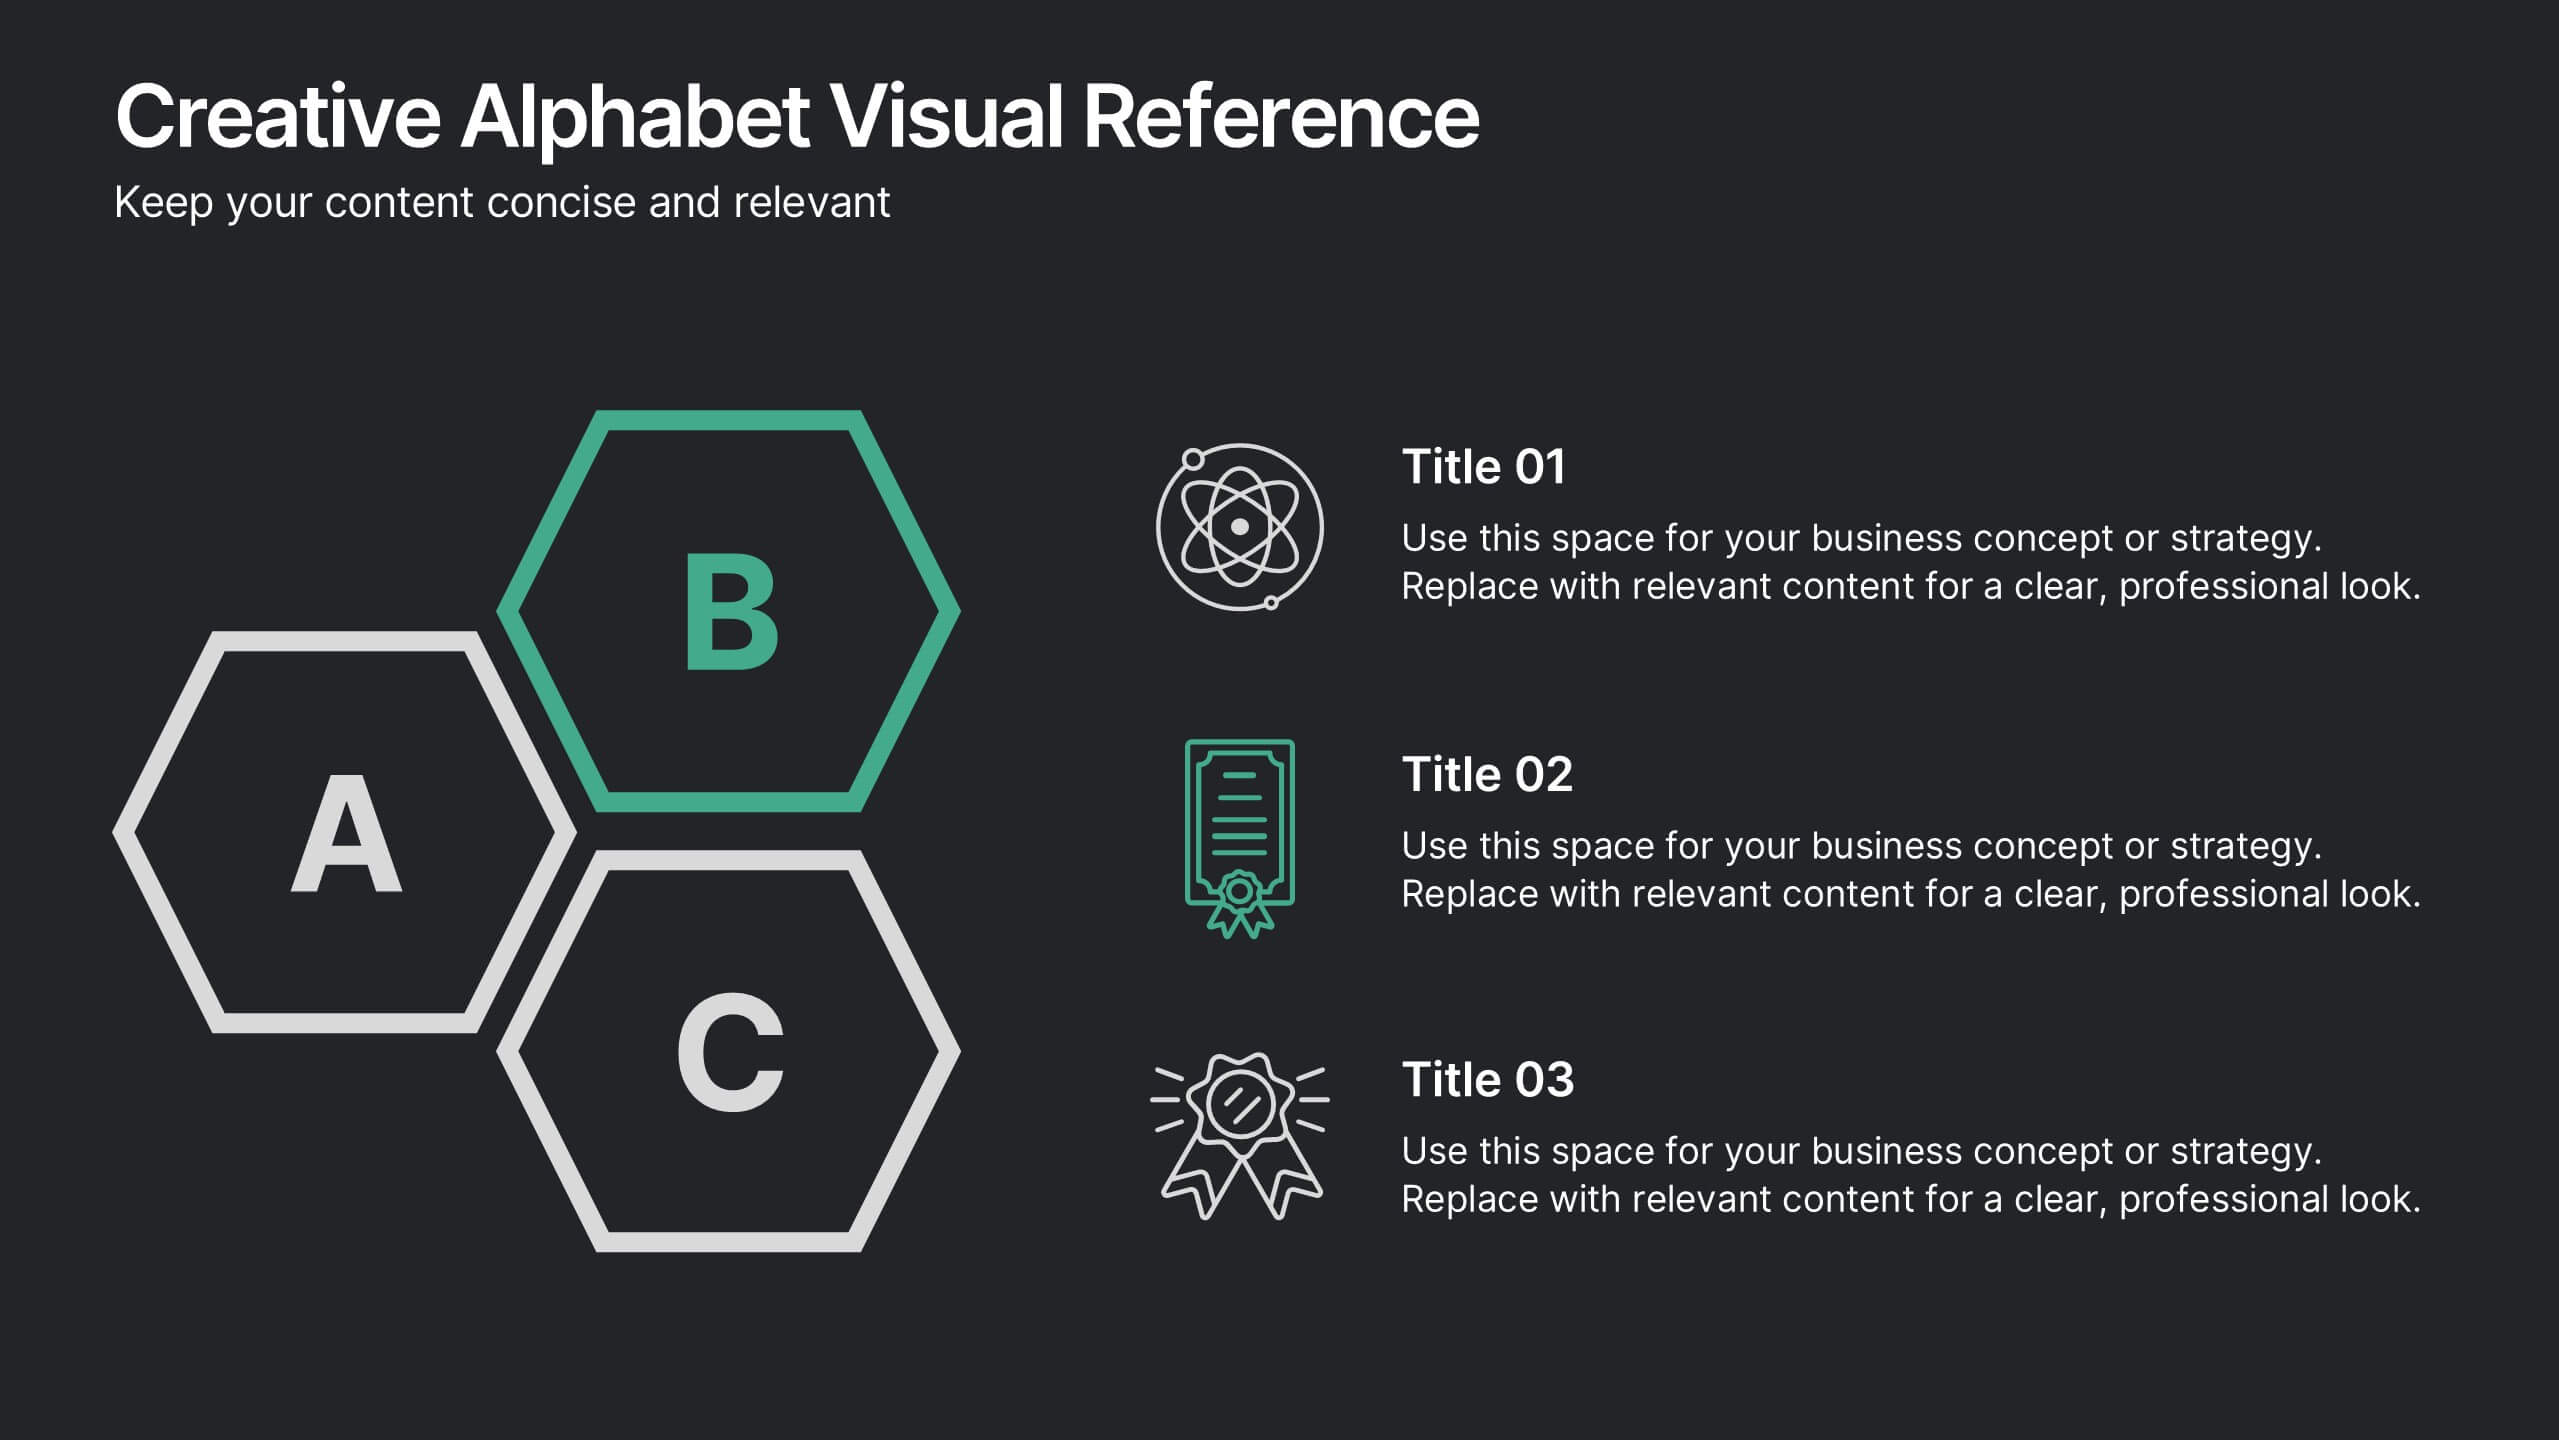
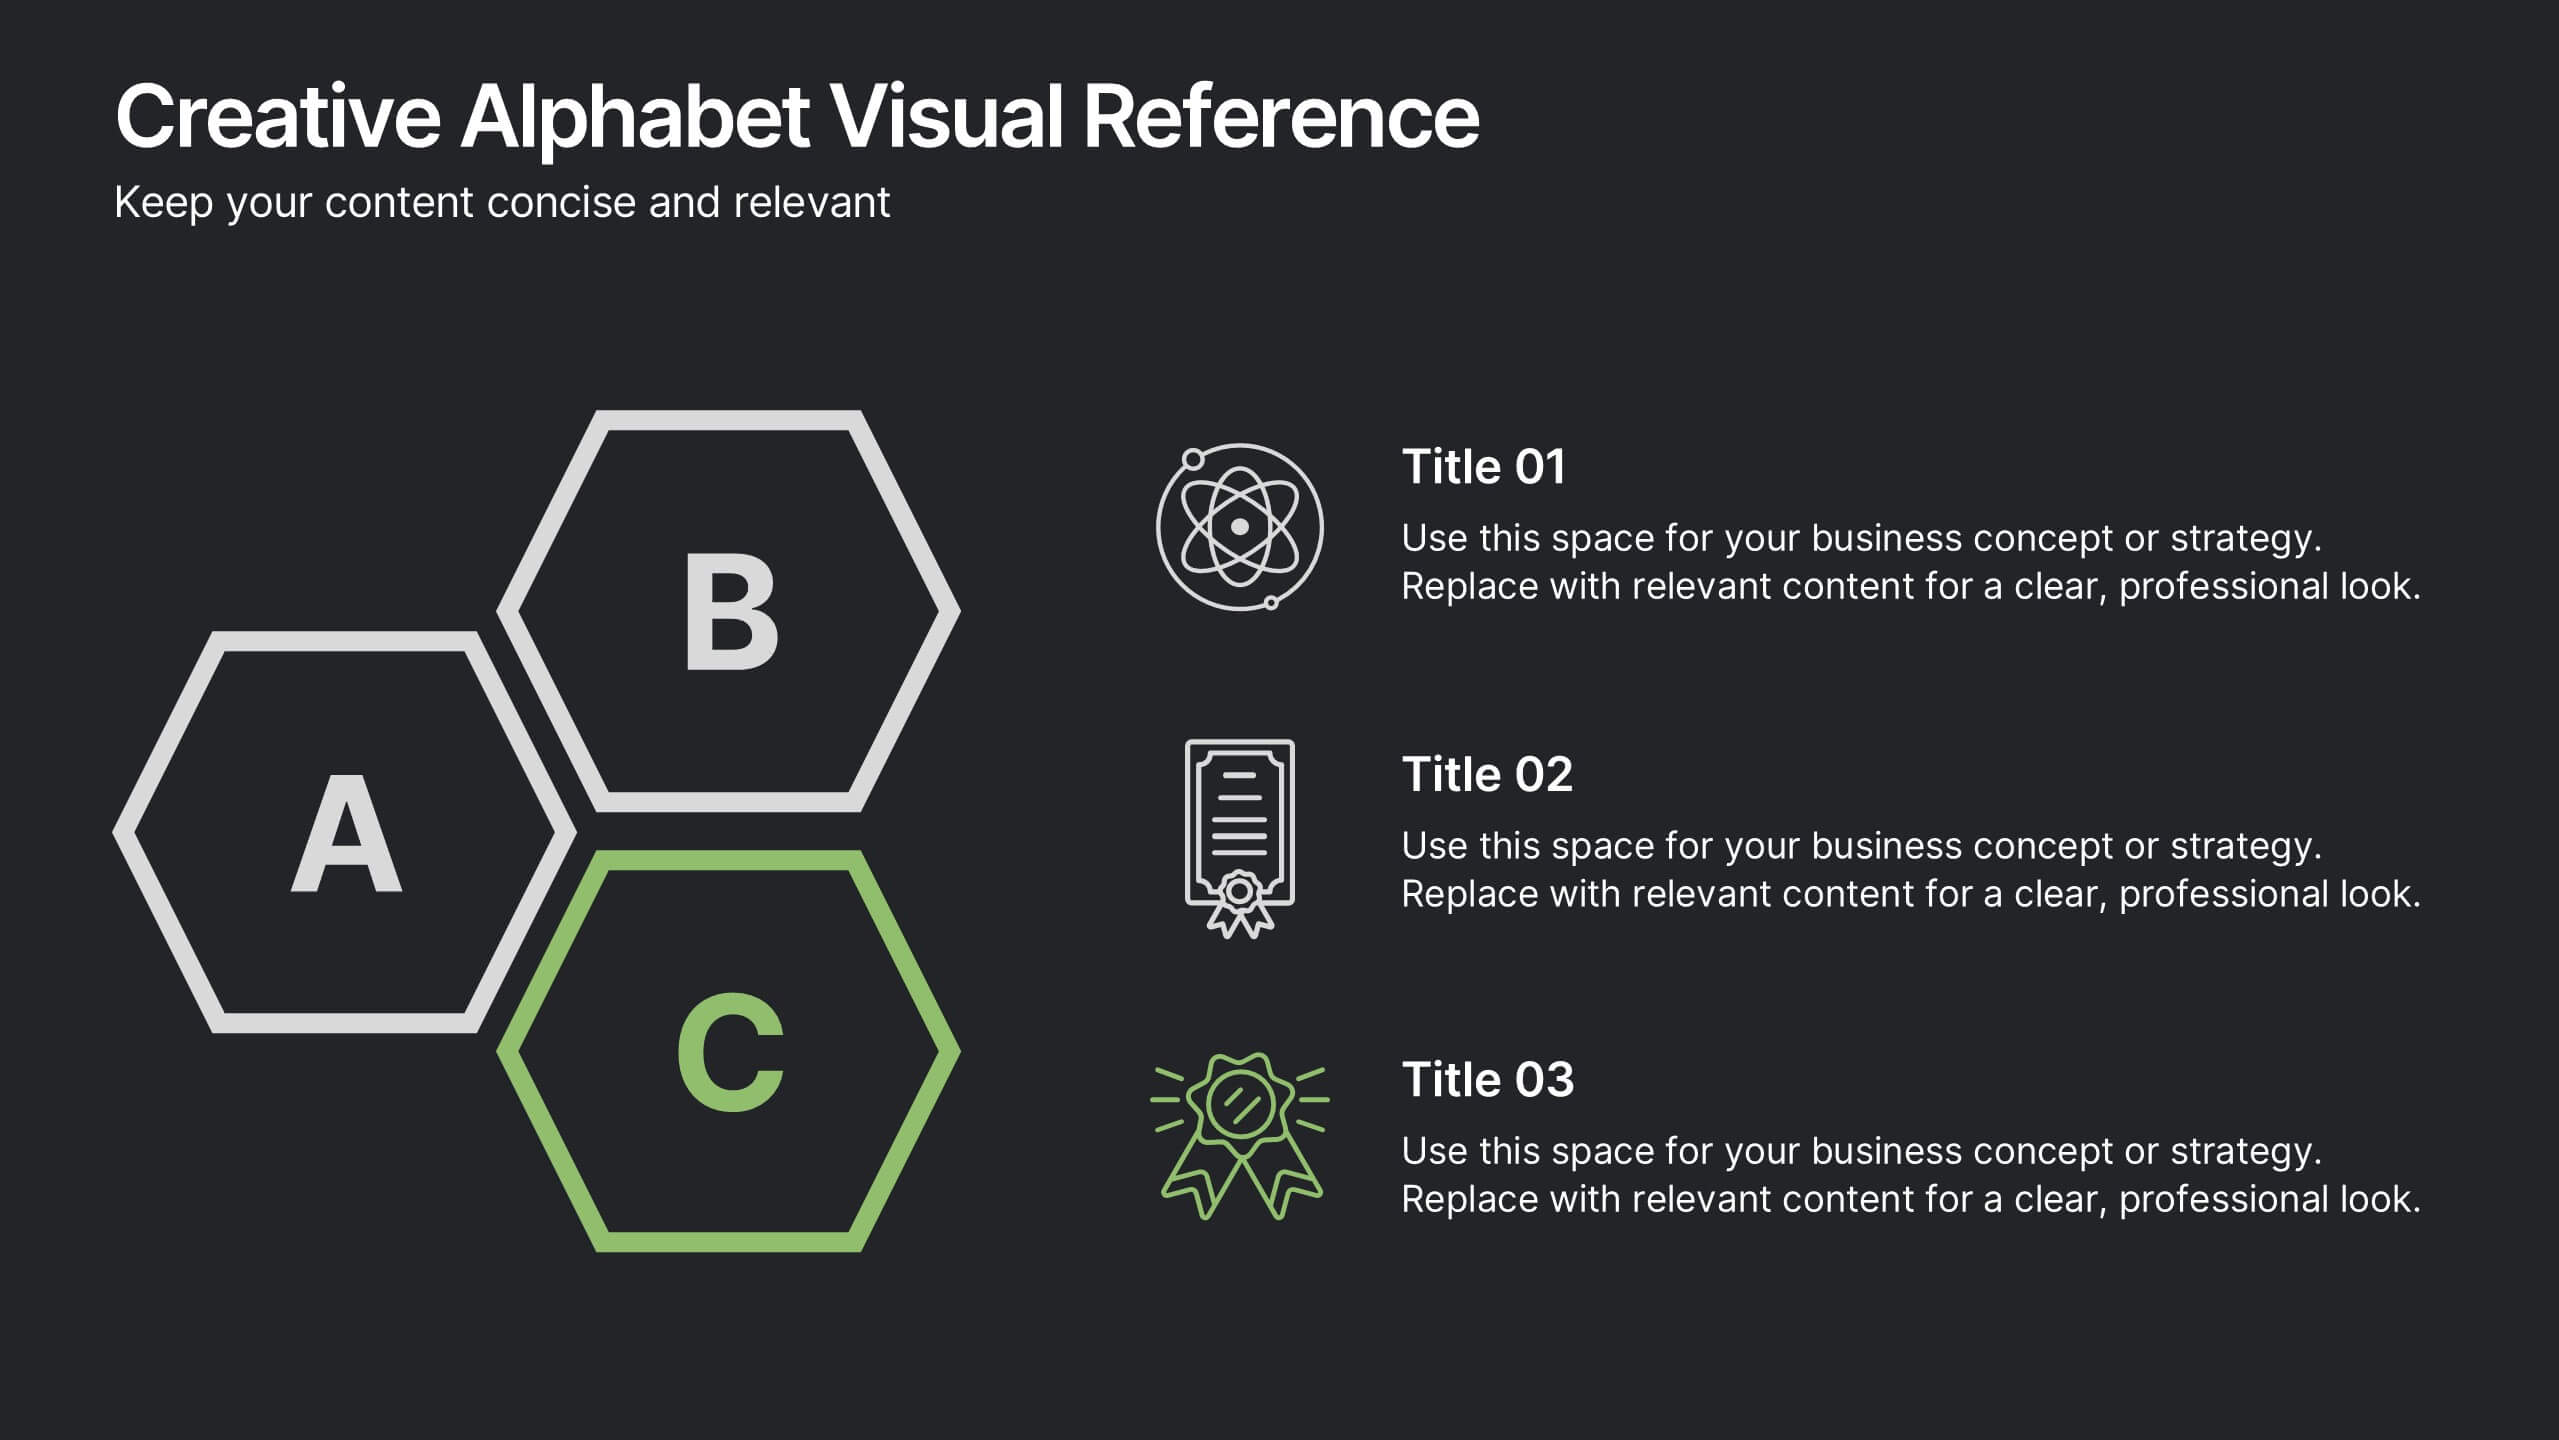
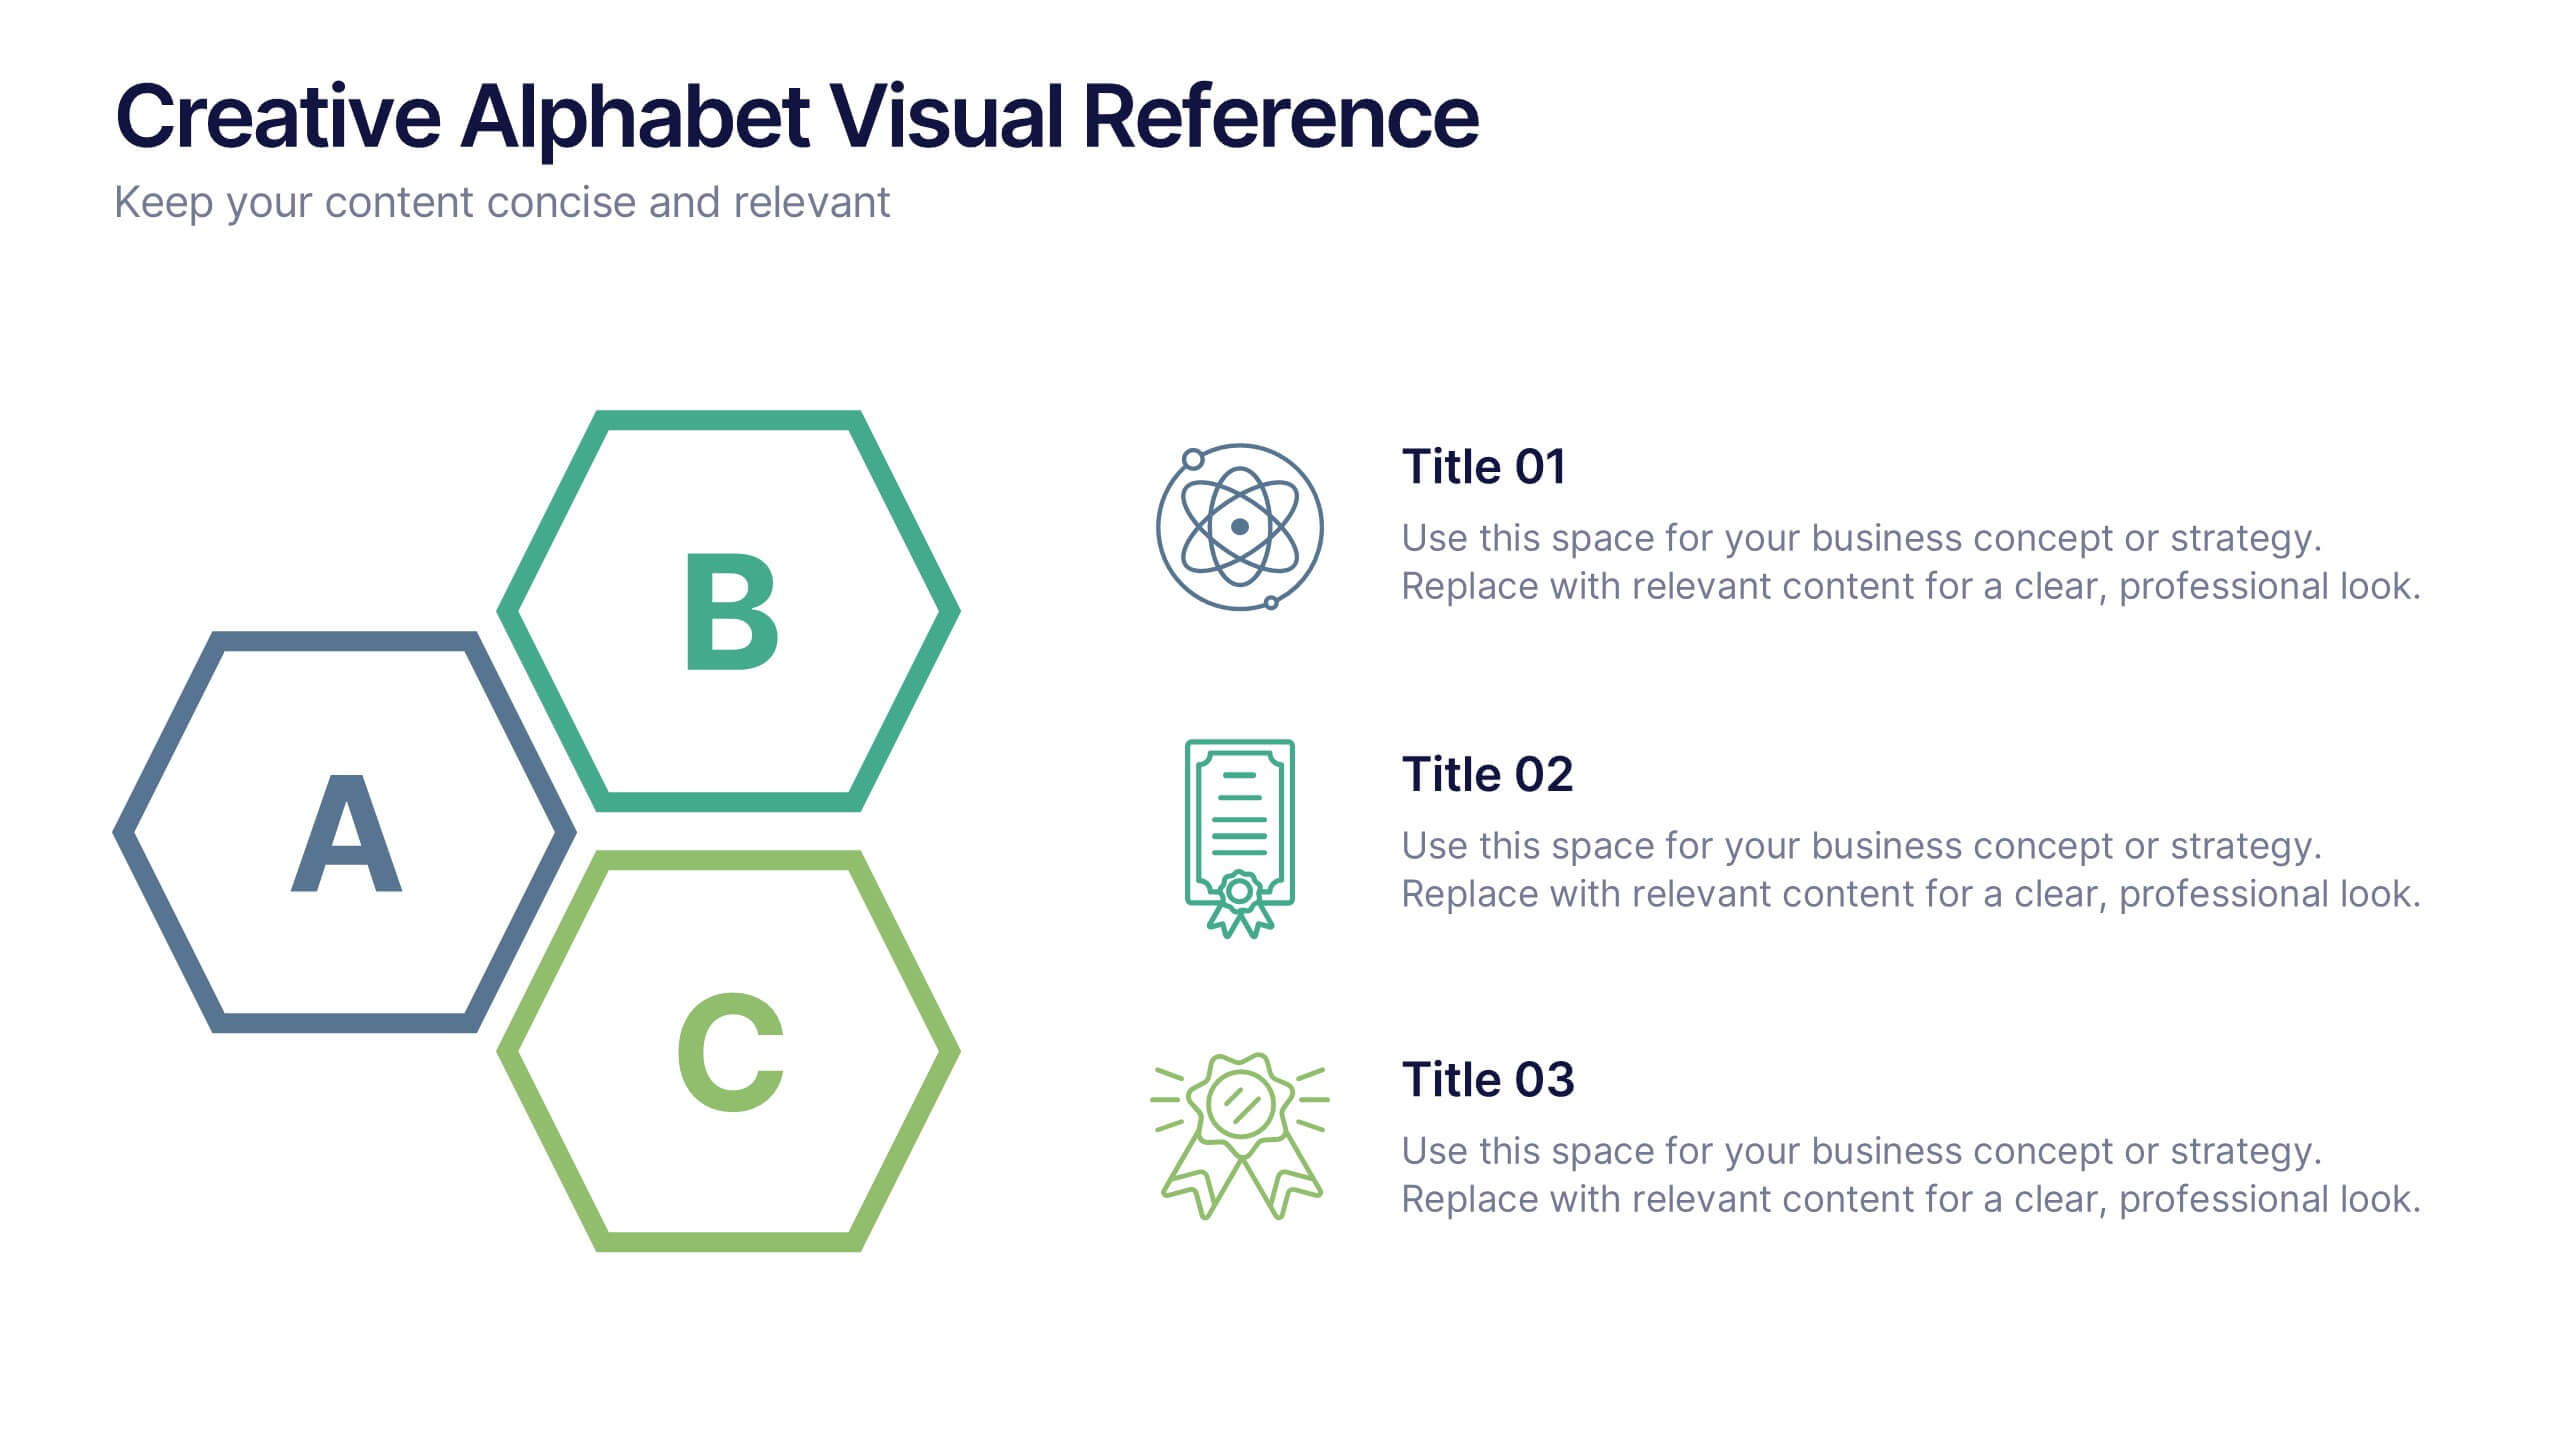
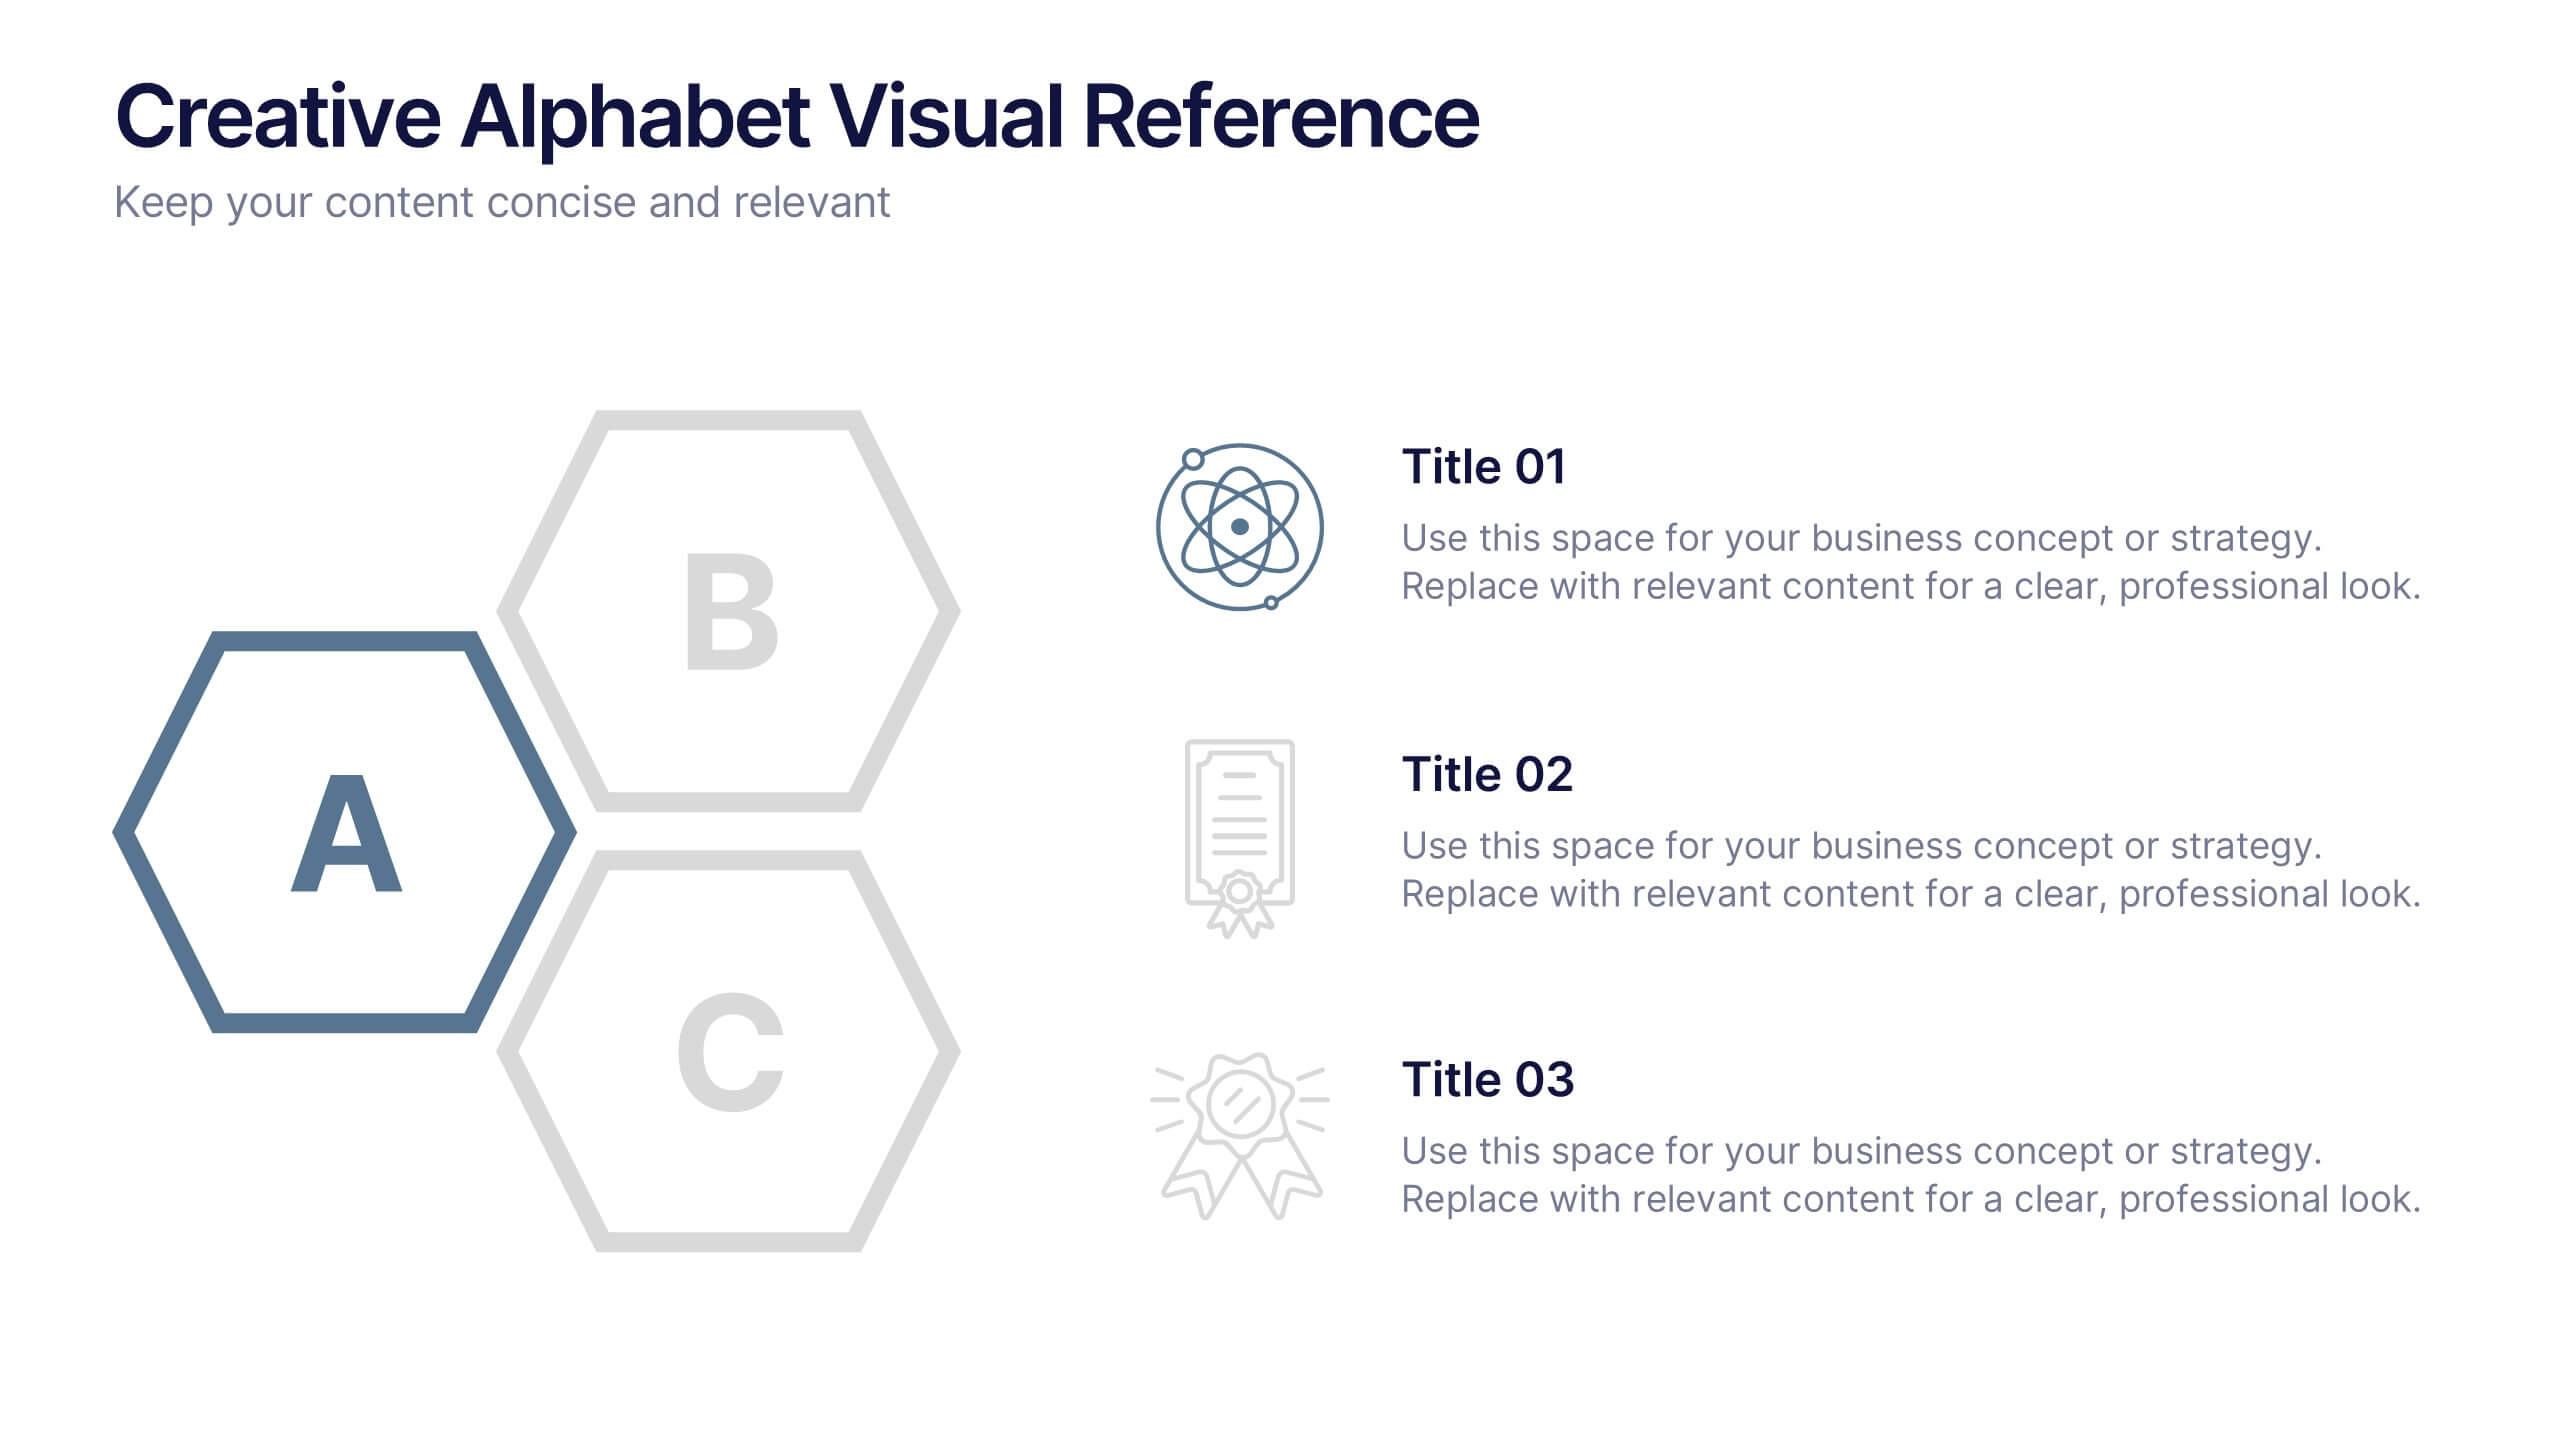
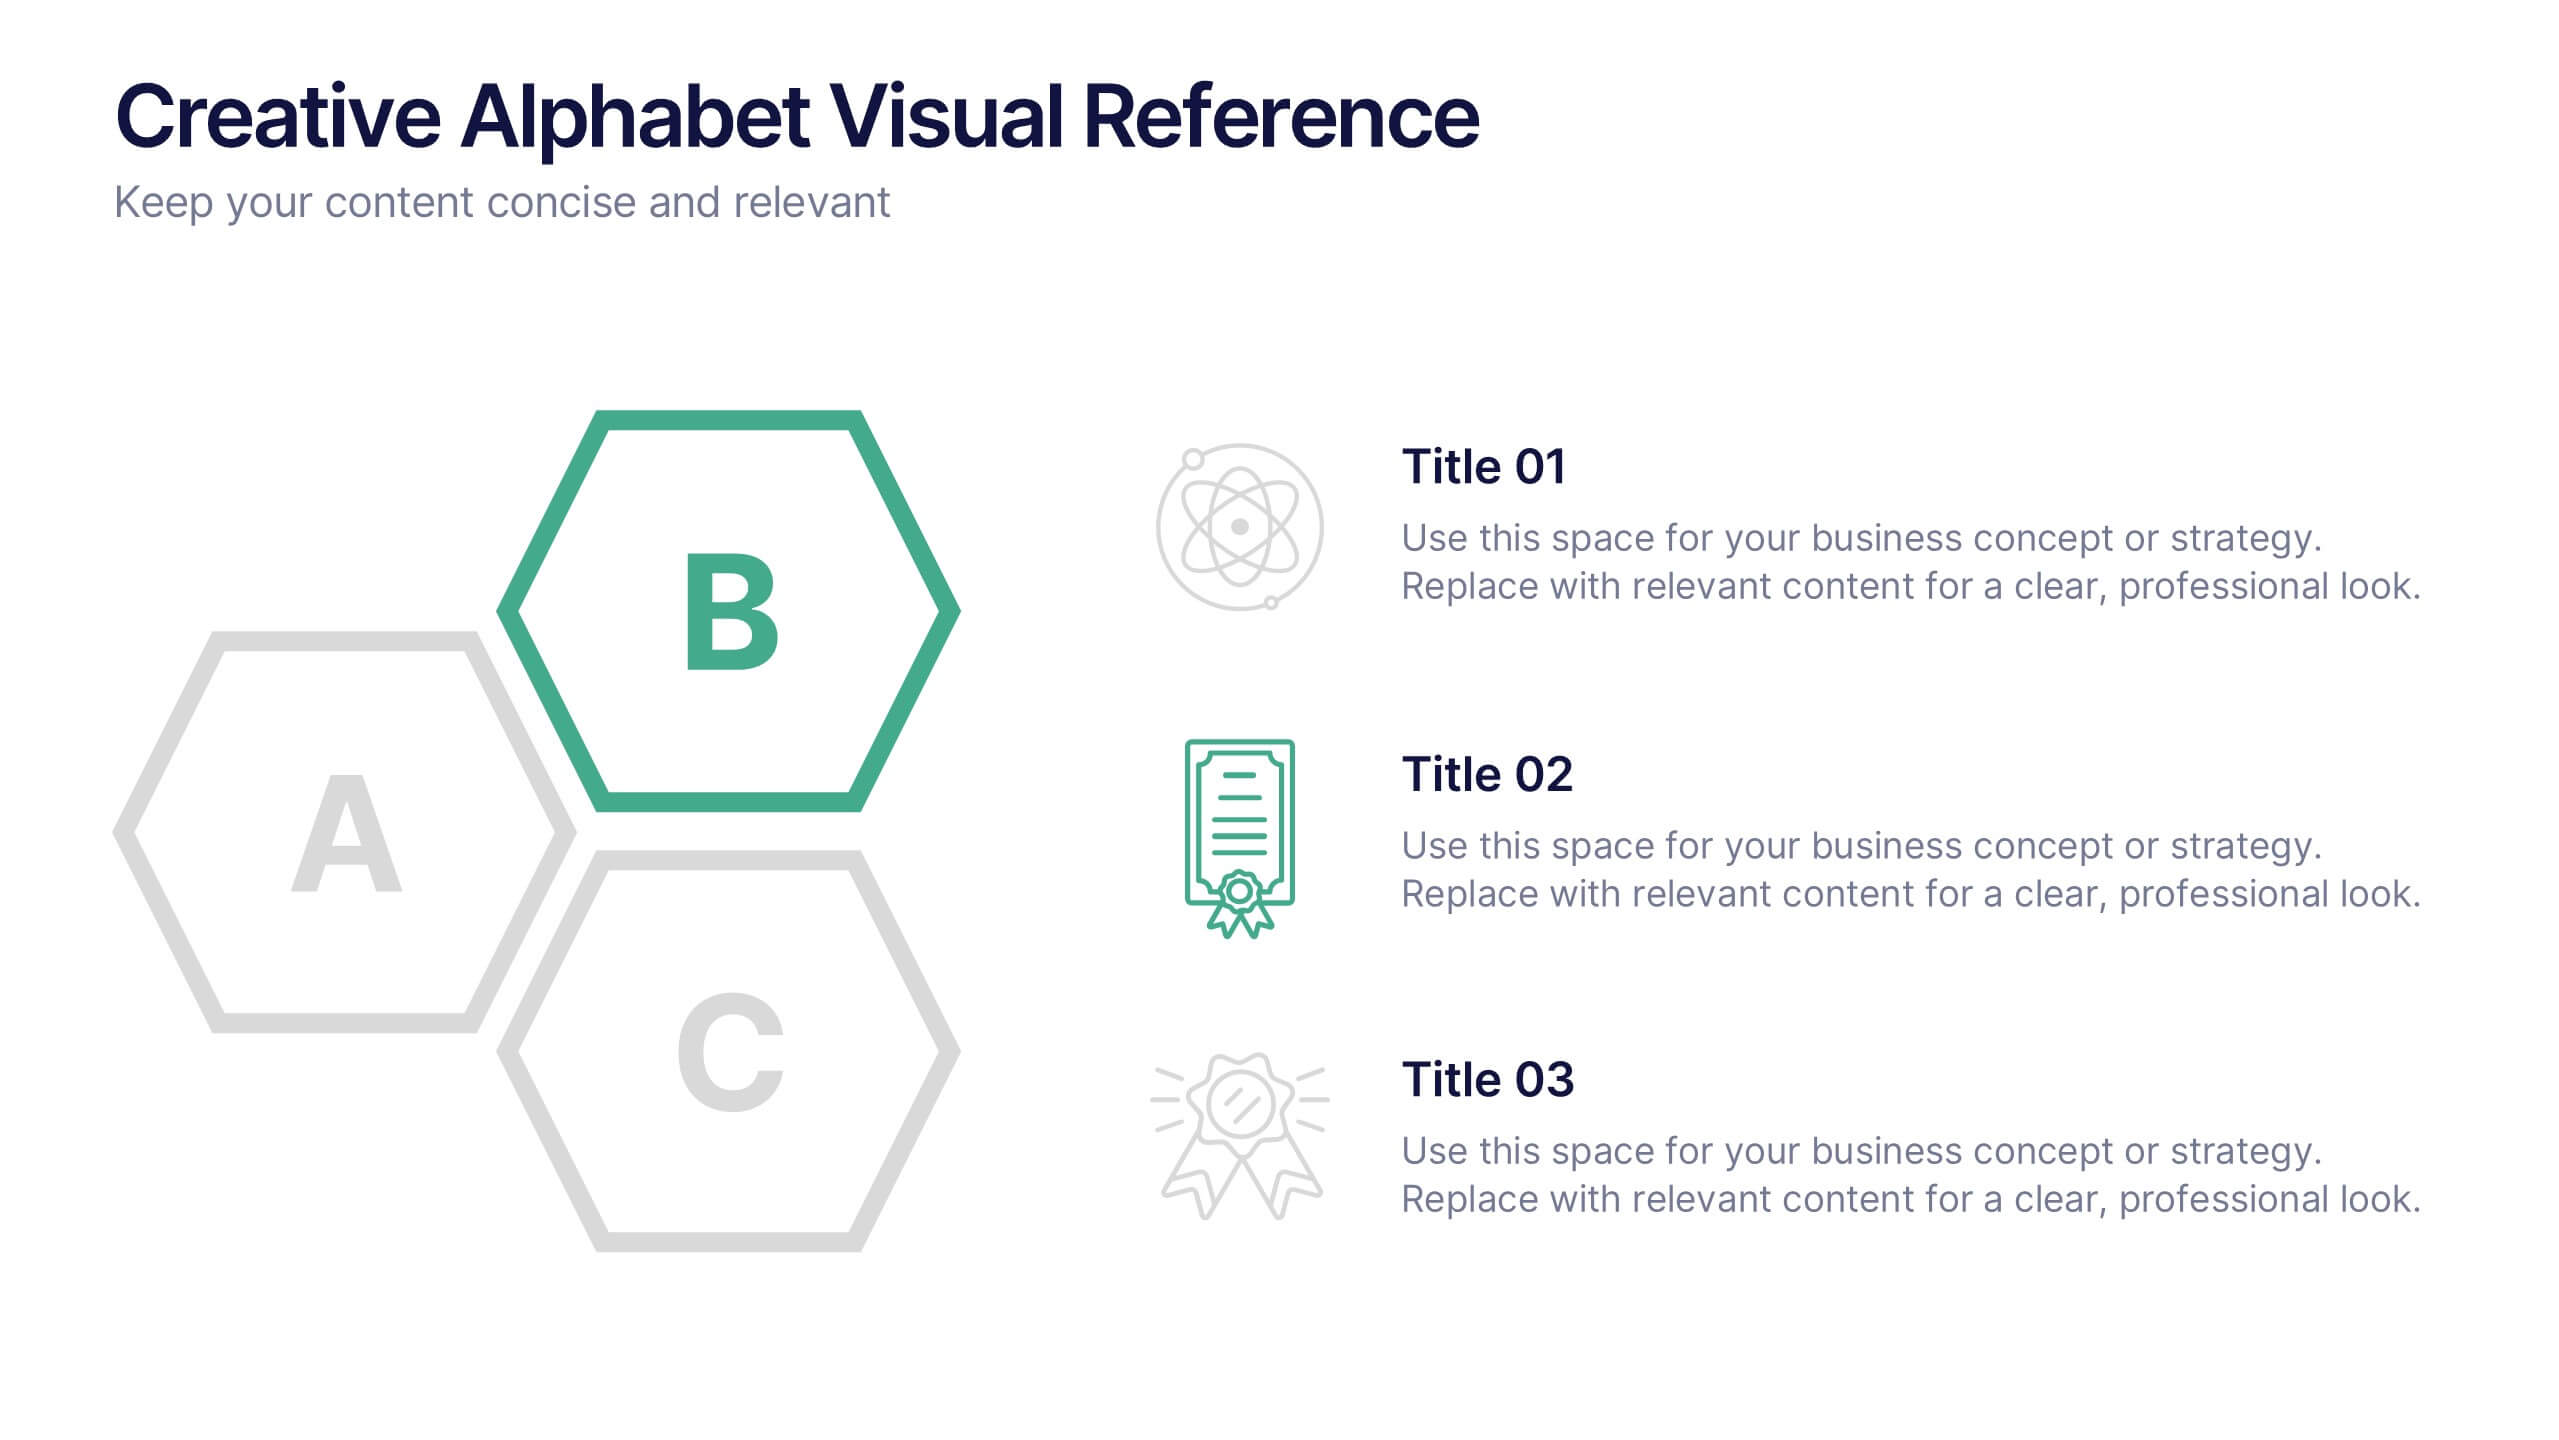
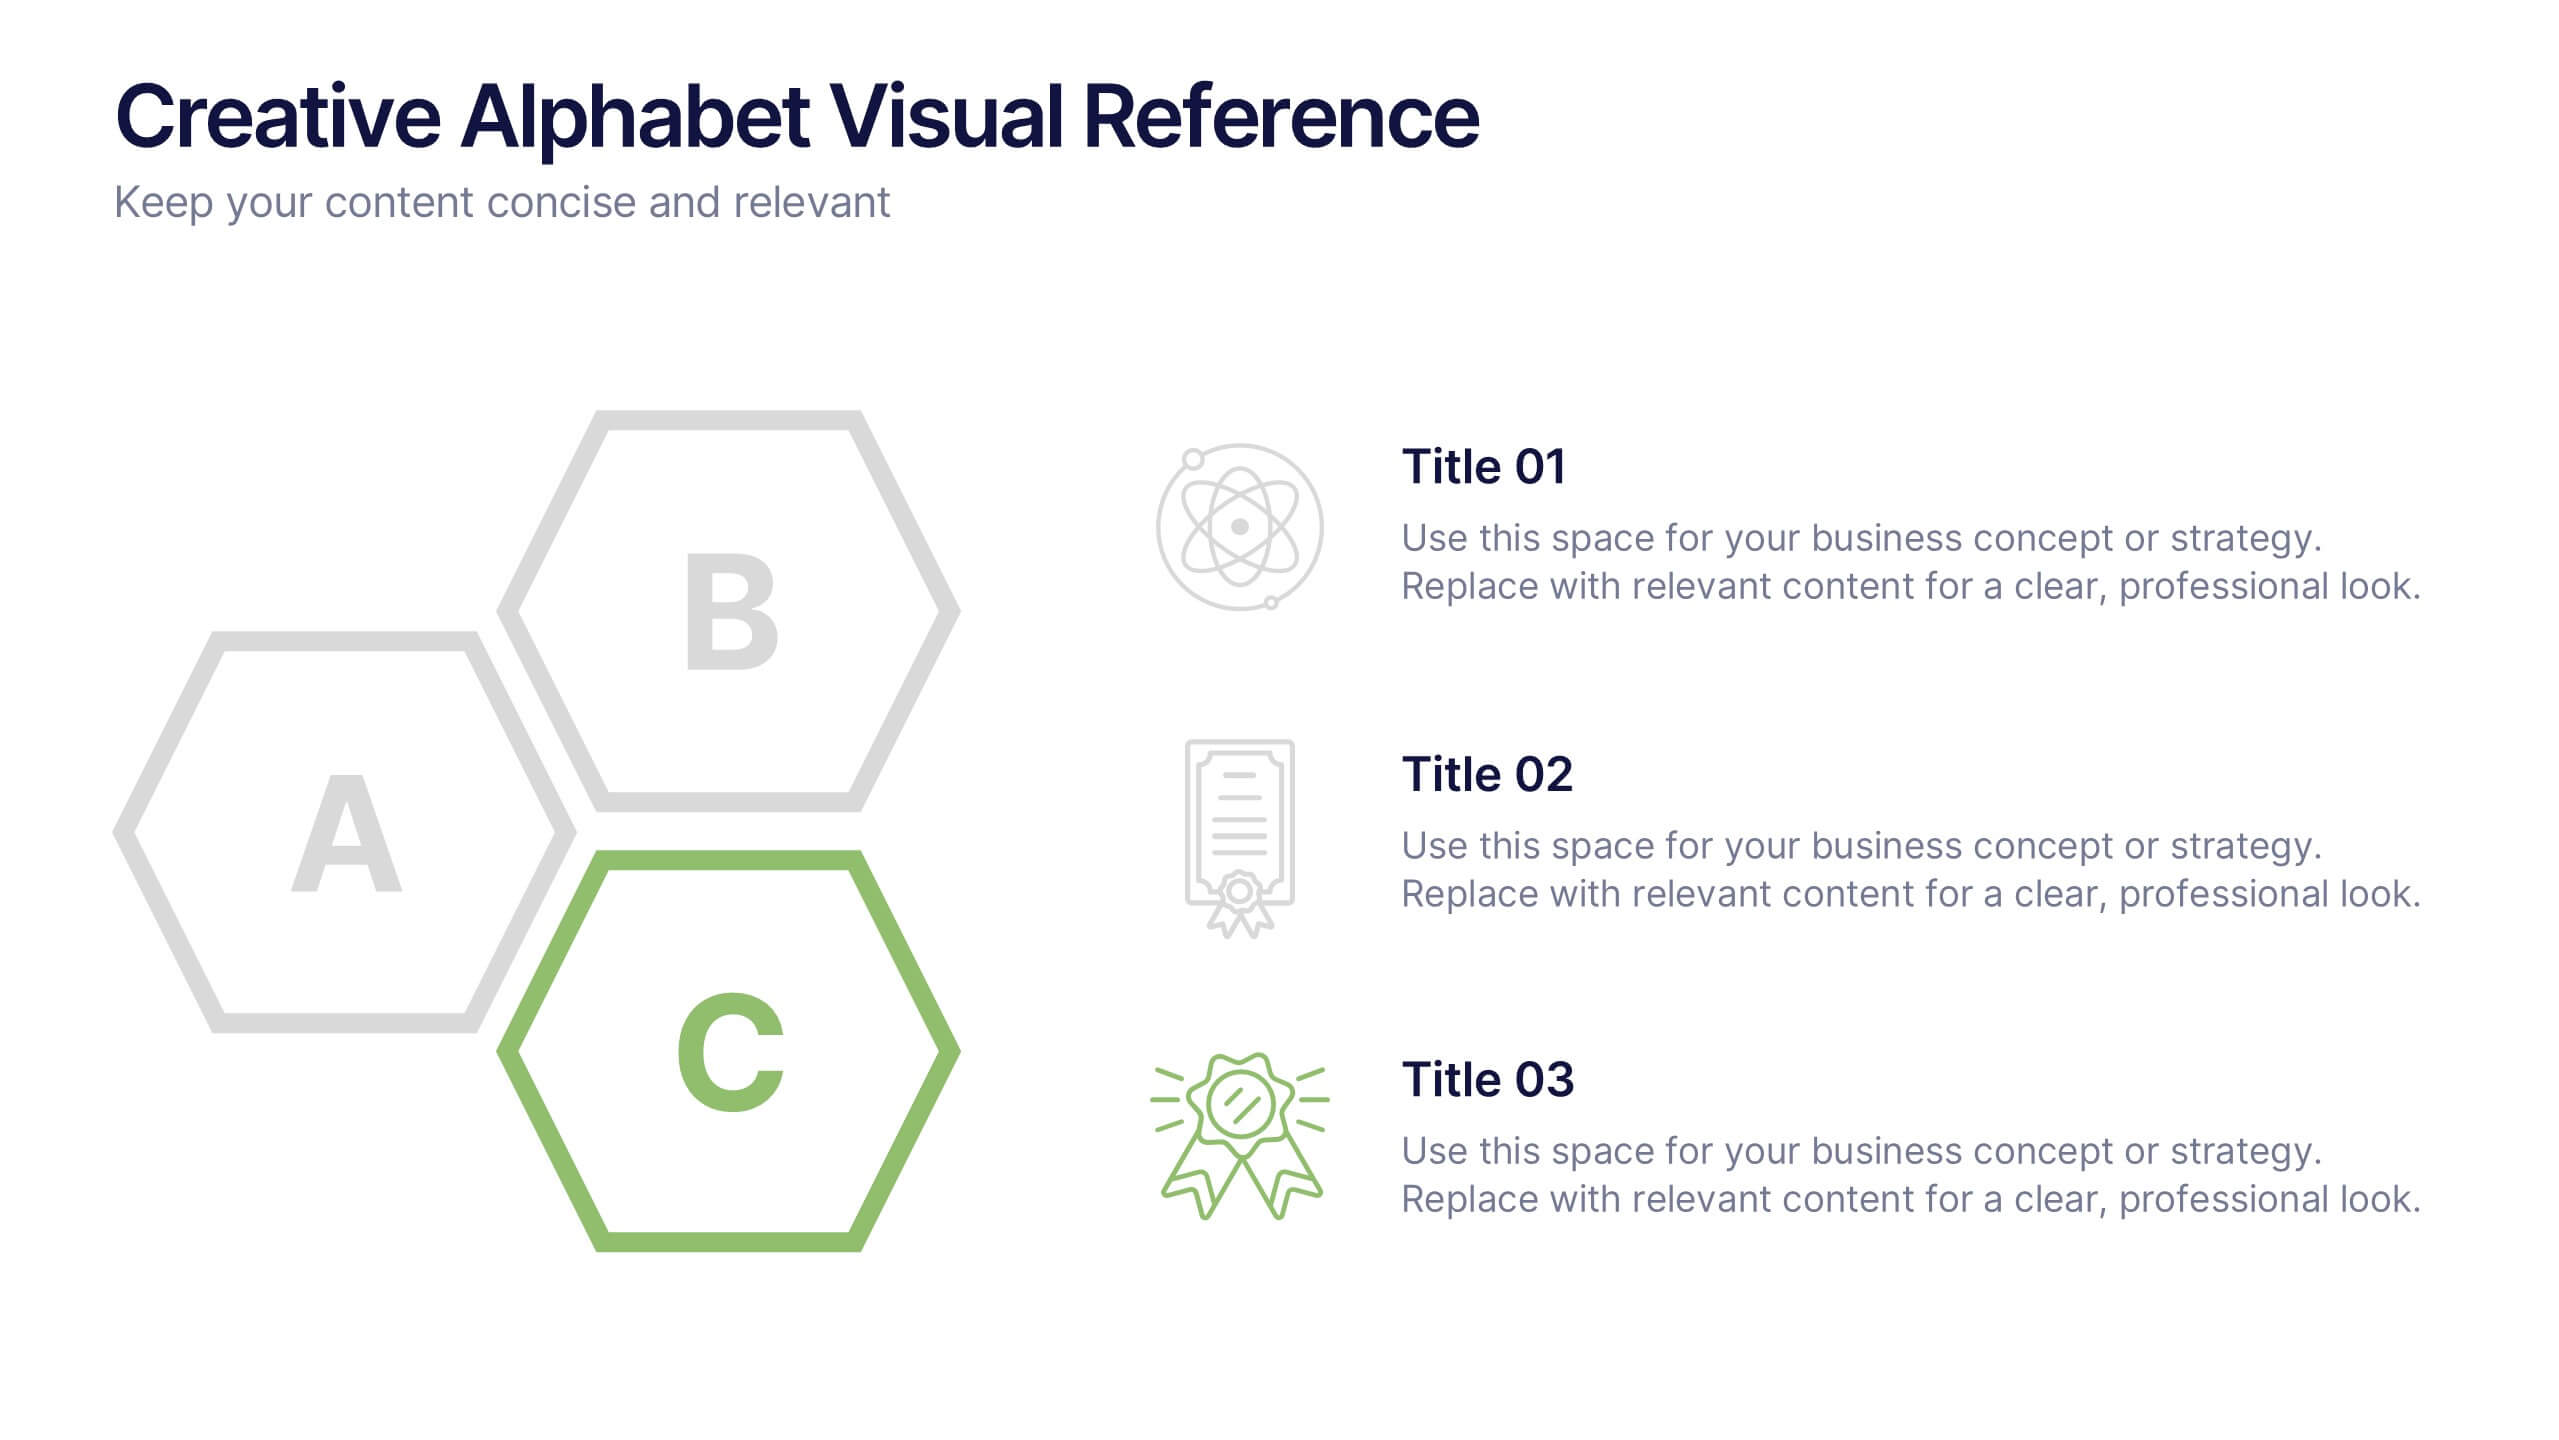
Creative Alphabet Visual Reference Presentation
This creative presentation uses a bold A–B–C visual structure to highlight key points in a clean, modern layout. Ideal for overviews, comparisons, or step-by-step frameworks. Fully customizable in Canva, it balances design and clarity—perfect for business strategies, education, or visual storytelling with strong alphabetical cues and icon integration.


12 slides
Strategic Planning with Strategy Wheel Presentation
Visualize your roadmap with this sleek strategy wheel template. Perfect for showcasing up to six strategic stages, this layout highlights progression while keeping your content organized and engaging. Ideal for business plans, project development, or performance cycles. Fully editable in PowerPoint, Keynote, and Google Slides.


12 slides
Health and Safety Compliance Strategy Presentation
Ensure your organization meets regulatory standards with the Health and Safety Compliance Strategy presentation. This sleek, diamond-based layout breaks down key safety elements into five visually engaging segments, ideal for outlining compliance measures, emergency protocols, training requirements, risk assessments, and inspection plans. Each icon-based section includes editable titles and text boxes for quick customization. Designed to keep information clear and actionable, this template is perfect for corporate safety briefings, internal audits, or HR presentations. Fully compatible with PowerPoint, Keynote, and Google Slides.


5 slides
Large-Scale Data Strategy Template Presentation
Present your data strategy with clarity using this four-step triangle layout. Each triangle highlights a key phase, ideal for outlining processes like planning, cloud adoption, integration, and scalability. Clean icons and a modern design enhance communication. Fully editable and compatible with PowerPoint, Keynote, and Google Slides for flexible use.


5 slides
Risk Assessment Heat Map Presentation
Evaluate risks effectively with a structured heat map. This Risk Assessment Heat Map helps visualize potential threats by mapping probability and impact levels. Ideal for risk management, business continuity planning, and decision-making. Fully customizable and compatible with PowerPoint, Keynote, and Google Slides for professional and seamless integration.


20 slides
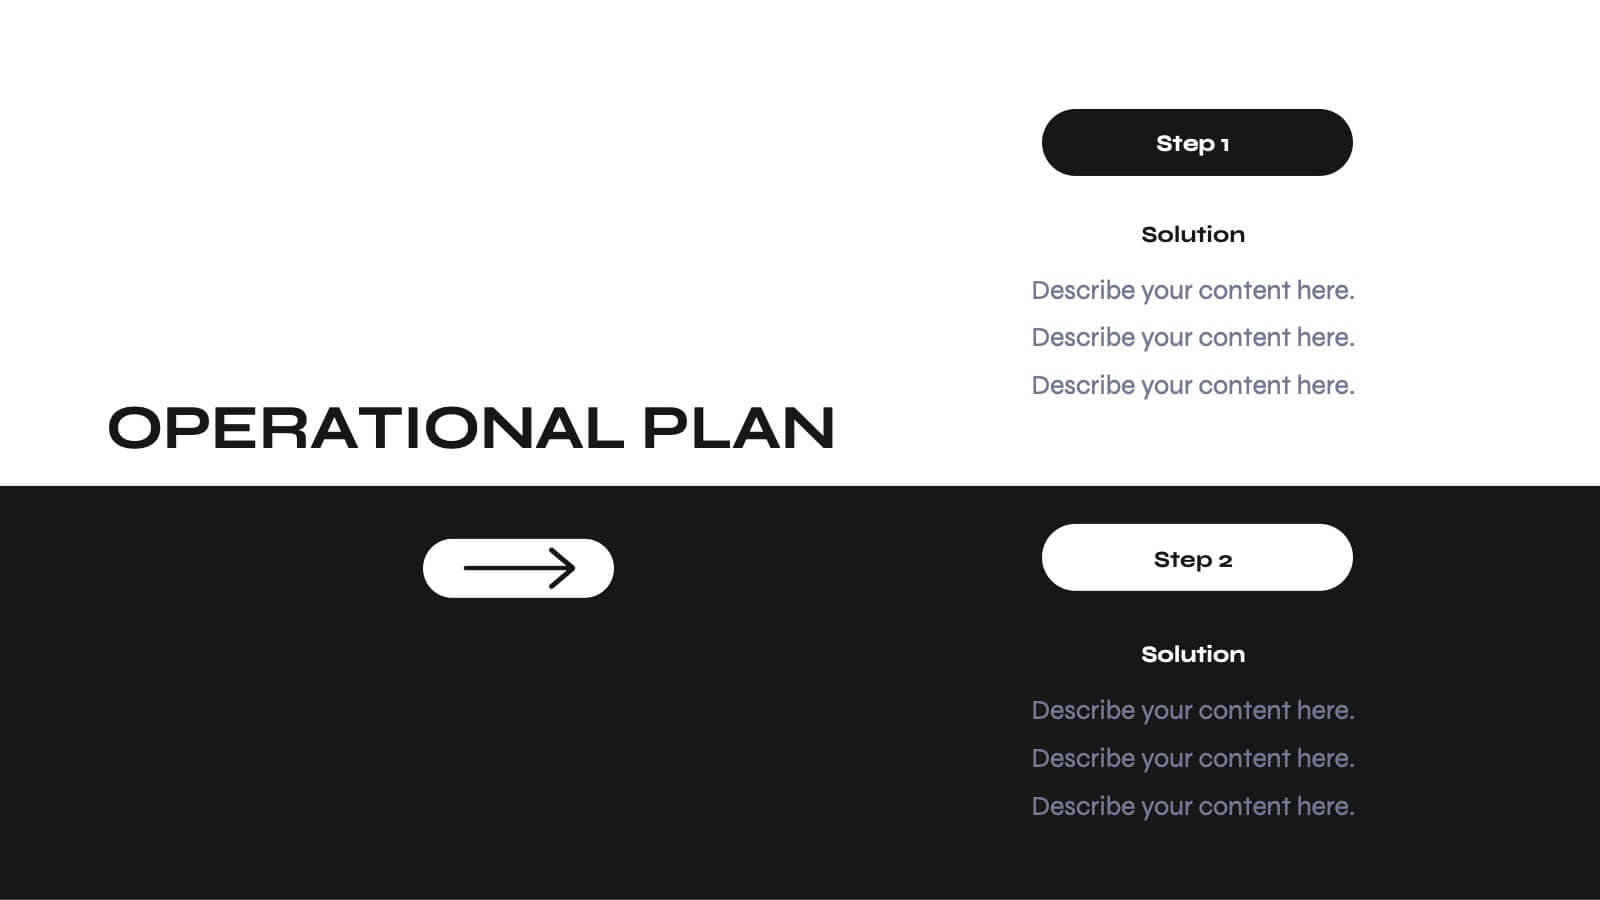
Faelight Project Proposal Presentation
A professional project proposal template for showcasing company overview, objectives, scope of work, timelines, and budget breakdowns. Includes sections for client testimonials, pricing structures, and risk mitigation strategies. Fully customizable for various industries and ideal for pitching new projects. Compatible with PowerPoint, Keynote, and Google Slides for seamless presentations.


6 slides
Butterfly Chart Data Visualization
Present complex comparisons with visual elegance using the Butterfly Chart Data Visualization Presentation. This eye-catching format displays six key data points split symmetrically across two wings—perfect for showcasing contrasts like pros vs. cons, before vs. after, or product comparisons. Each section is color-coded and paired with editable text areas for clarity. Ideal for reports, strategy meetings, and decision-making decks. Fully compatible with PowerPoint, Keynote, and Google Slides for effortless customization.


5 slides
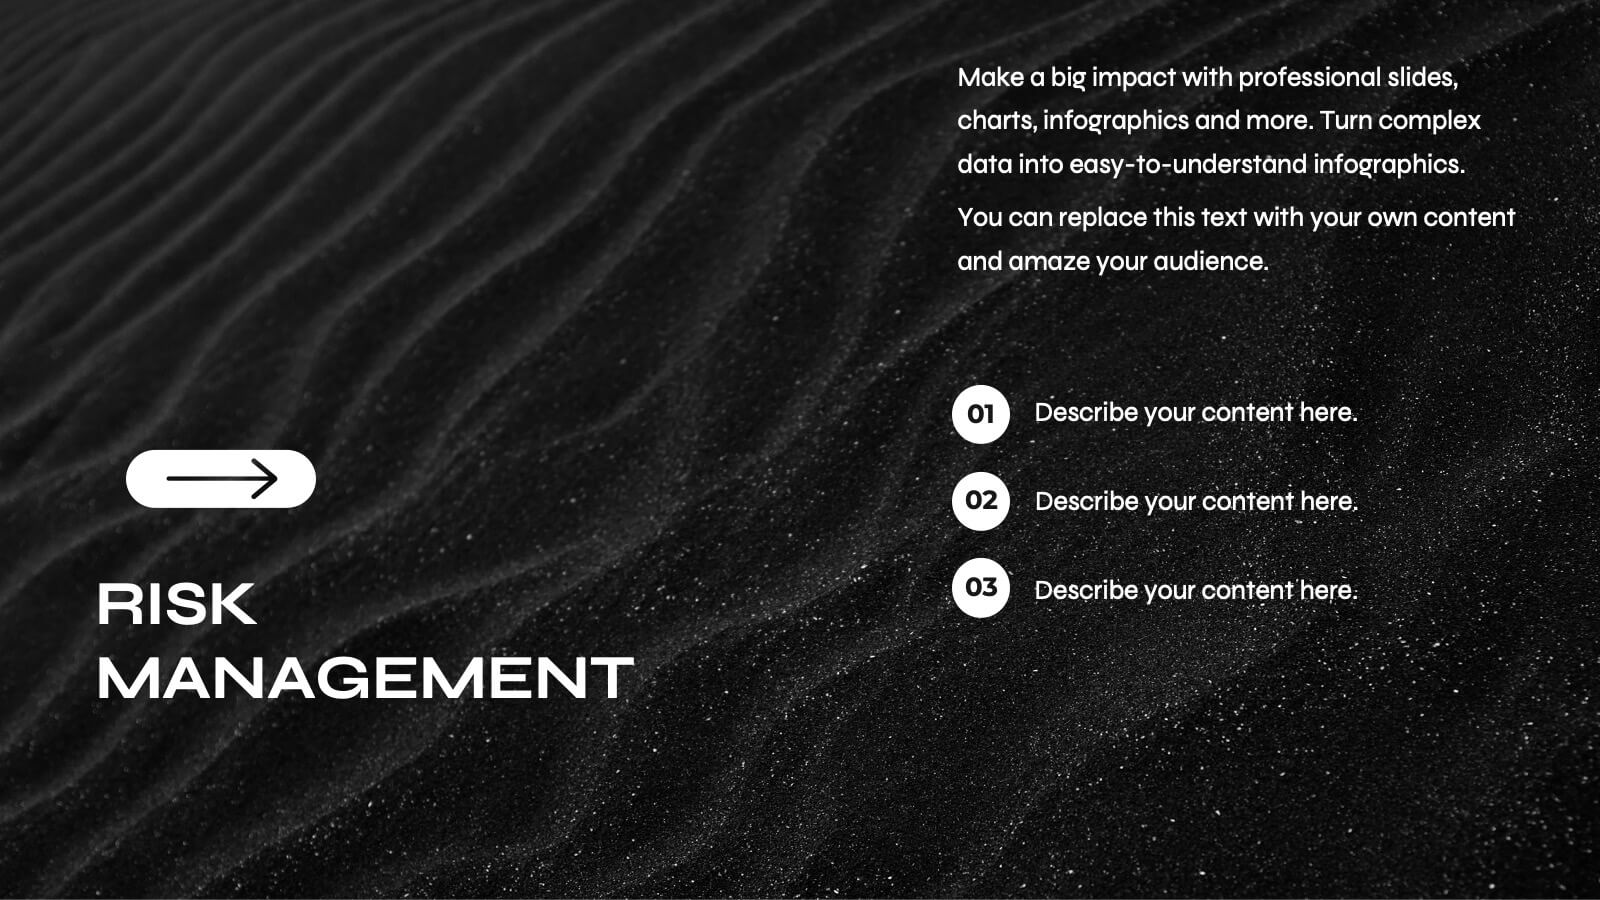
5-Level Risk Management Plan Presentation
Turn complex strategies into clear, visual steps with this sleek layered layout designed for analyzing and mitigating potential risks. Each level helps you outline priorities, assess impact, and communicate safety measures effectively. Fully compatible with PowerPoint, Keynote, and Google Slides, making customization fast, professional, and presentation-ready.


4 slides
Business Travel Logistic Plan Presentation
Make your business journey feel as smooth as your next flight! This infographic presentation template helps visualize logistics, travel routes, and resource allocation for corporate trips. Great for mapping key points and planning operations clearly. Fully editable and compatible with PowerPoint, Keynote, and Google Slides for easy customization and sharing.


23 slides
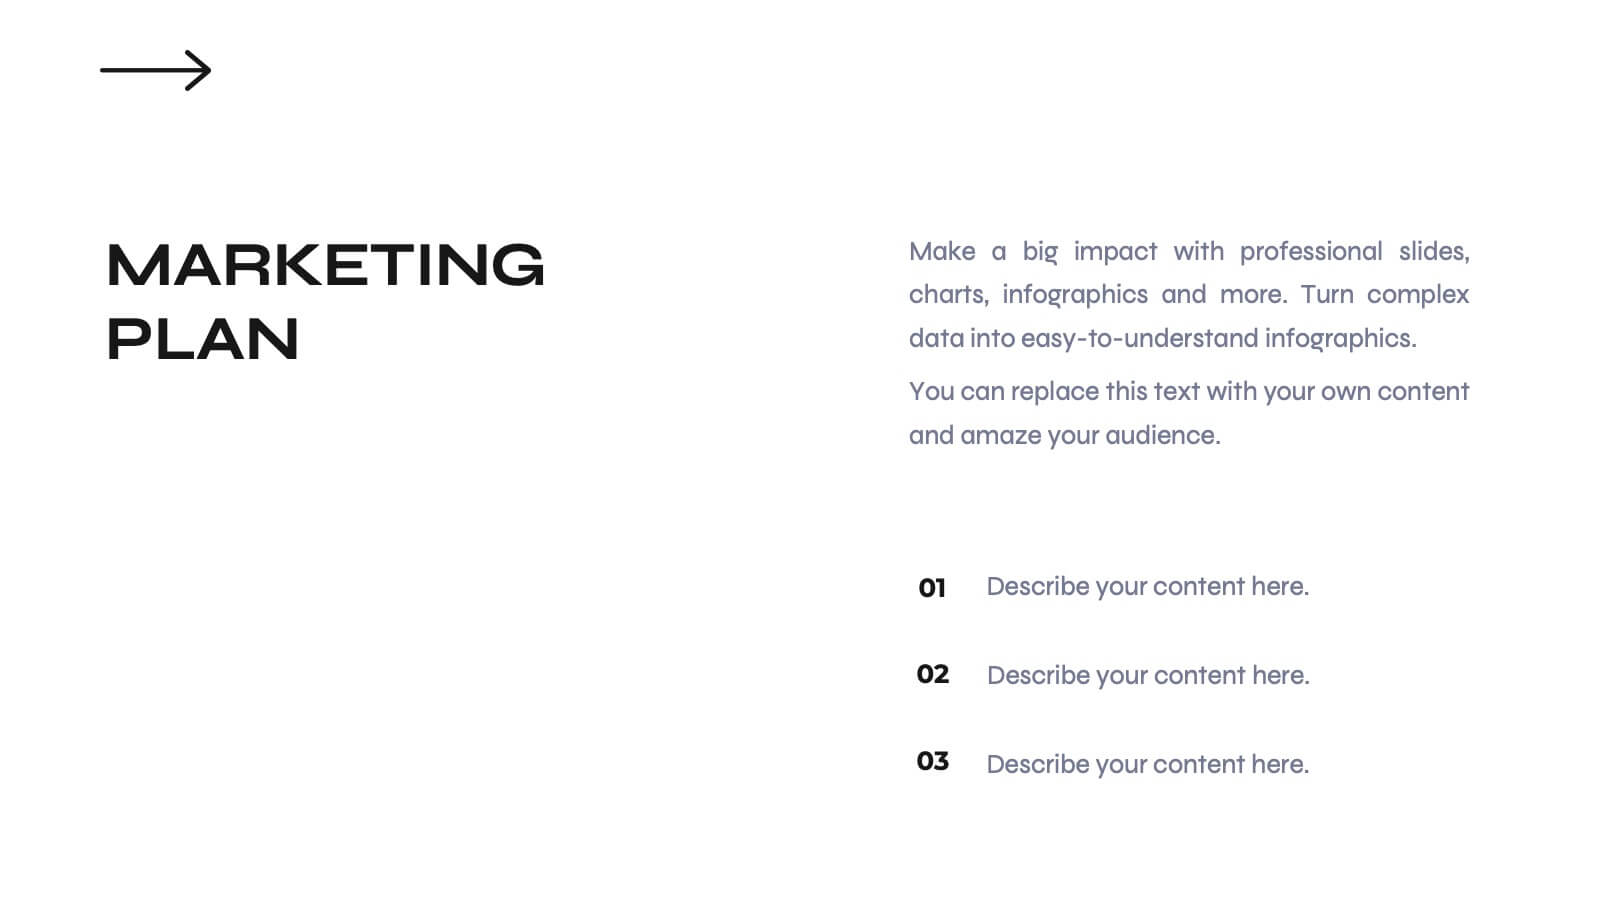
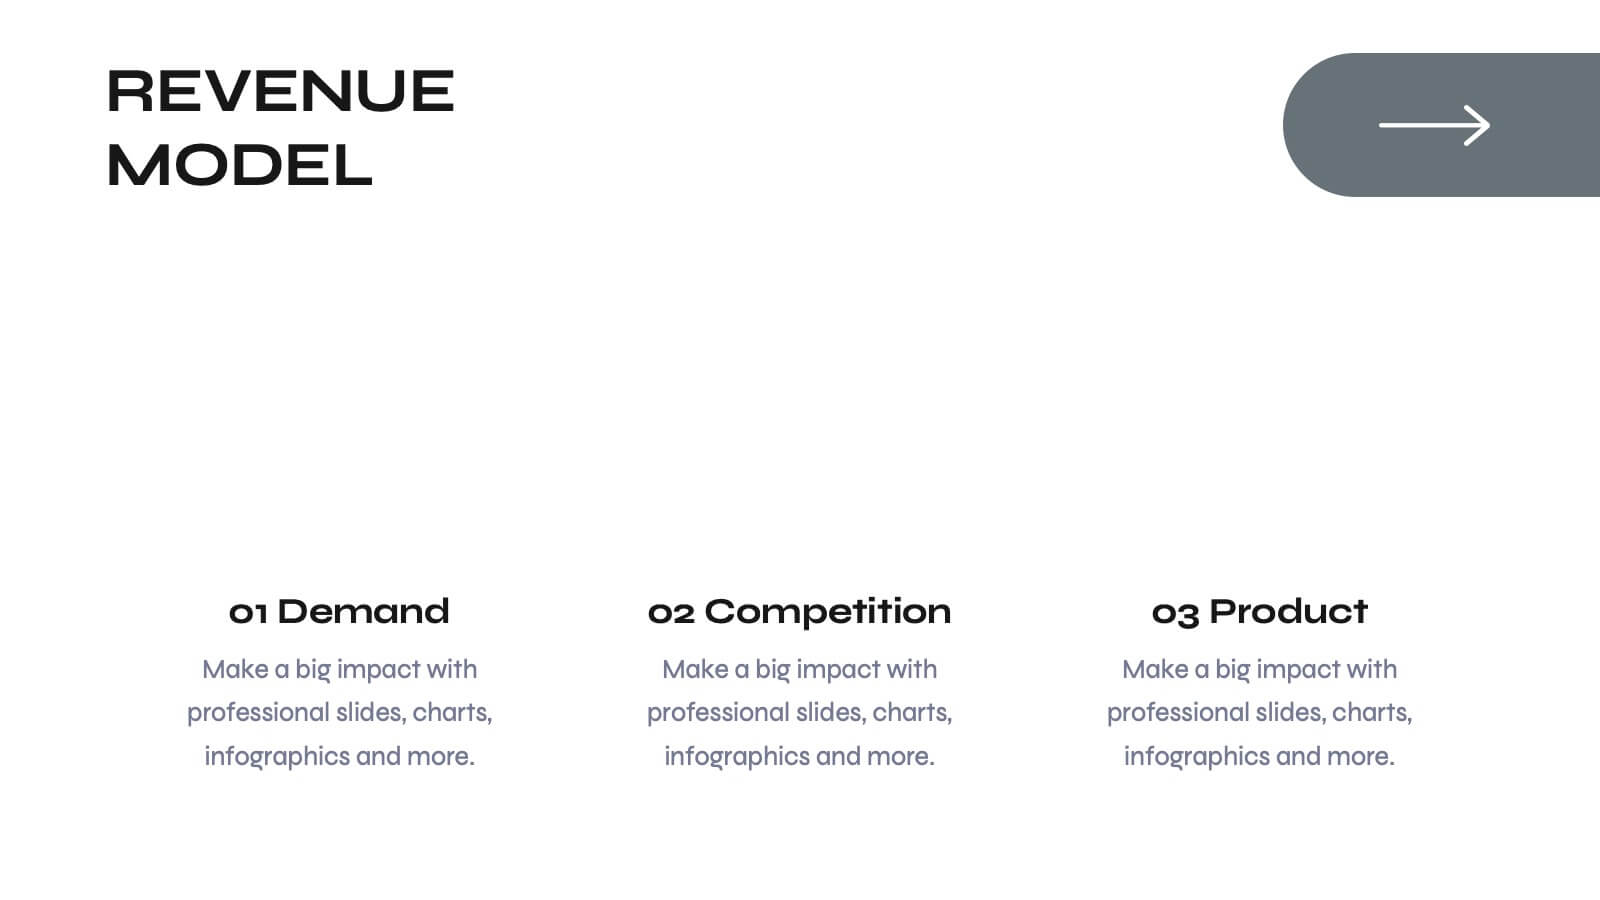
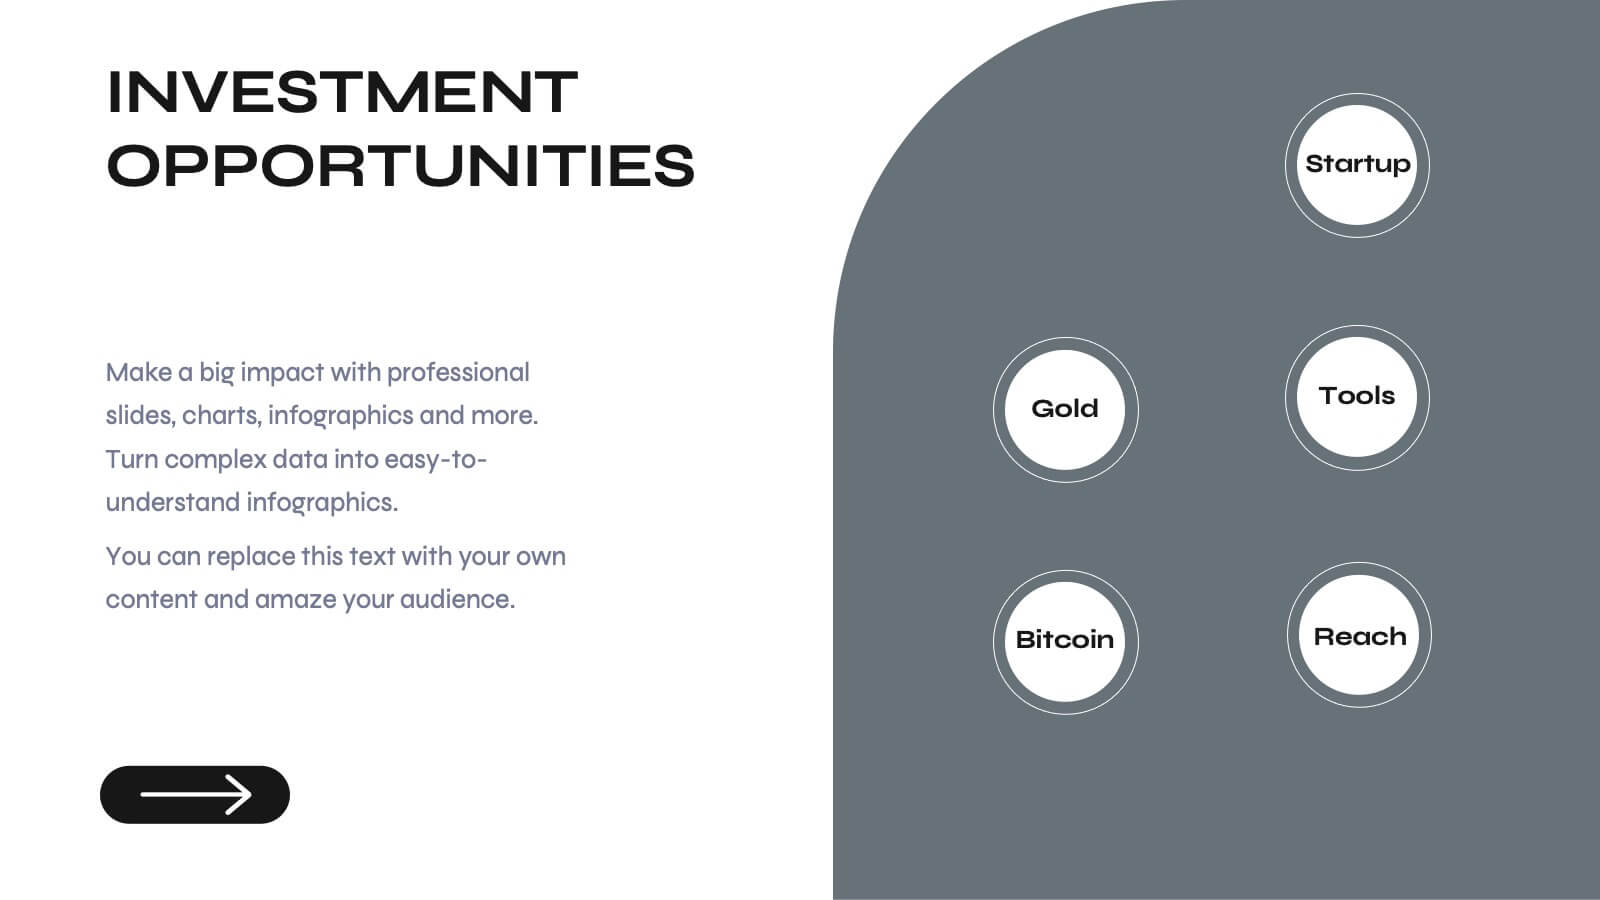
Phantasia Sales Pitch Deck Presentation
Impress stakeholders and close deals effectively with this sleek and dynamic pitch deck template. With structured slides for company overview, problem statements, and market opportunities, you can present your solutions with clarity and impact. Showcase your business model, revenue streams, and unique selling propositions to stand out in a competitive landscape. This template also includes slides for financial projections, growth strategies, and funding requirements, making it an excellent choice for entrepreneurs, sales teams, and business leaders. The modern design ensures your data is engaging and easy to follow, keeping your audience focused on your message. Fully editable and compatible with PowerPoint, Google Slides, and Keynote, this template provides the customization options you need to align with your branding and goals. Perfect for delivering professional and persuasive presentations.


6 slides
Real Estate Property Market Overview Presentation
Present key property market insights using this structured, easy-to-follow layout. The slide features six labeled sections flanking a central house graphic—ideal for highlighting data points, regional comparisons, or investment factors. Fully customizable in Canva, PowerPoint, and Google Slides, making it perfect for real estate reports, pitches, or client presentations.