


Features
- 23 Unique Slides
- Fully editable and easy to edit in Microsoft Powerpoint, Keynote and Google Slides
- 16:9 widescreen layout
- Clean and professional designs
- Export to JPG, PDF or send by email


Do you have any questions?
Recommend


6 slides
Quality Control Six Sigma Process Presentation
Bring clarity and energy to your workflow with this clean visual guide that outlines each phase of a structured improvement cycle. It helps communicate steps, responsibilities, and progress in a polished, professional way your audience can follow instantly. Fully compatible with PowerPoint, Keynote, and Google Slides.


5 slides
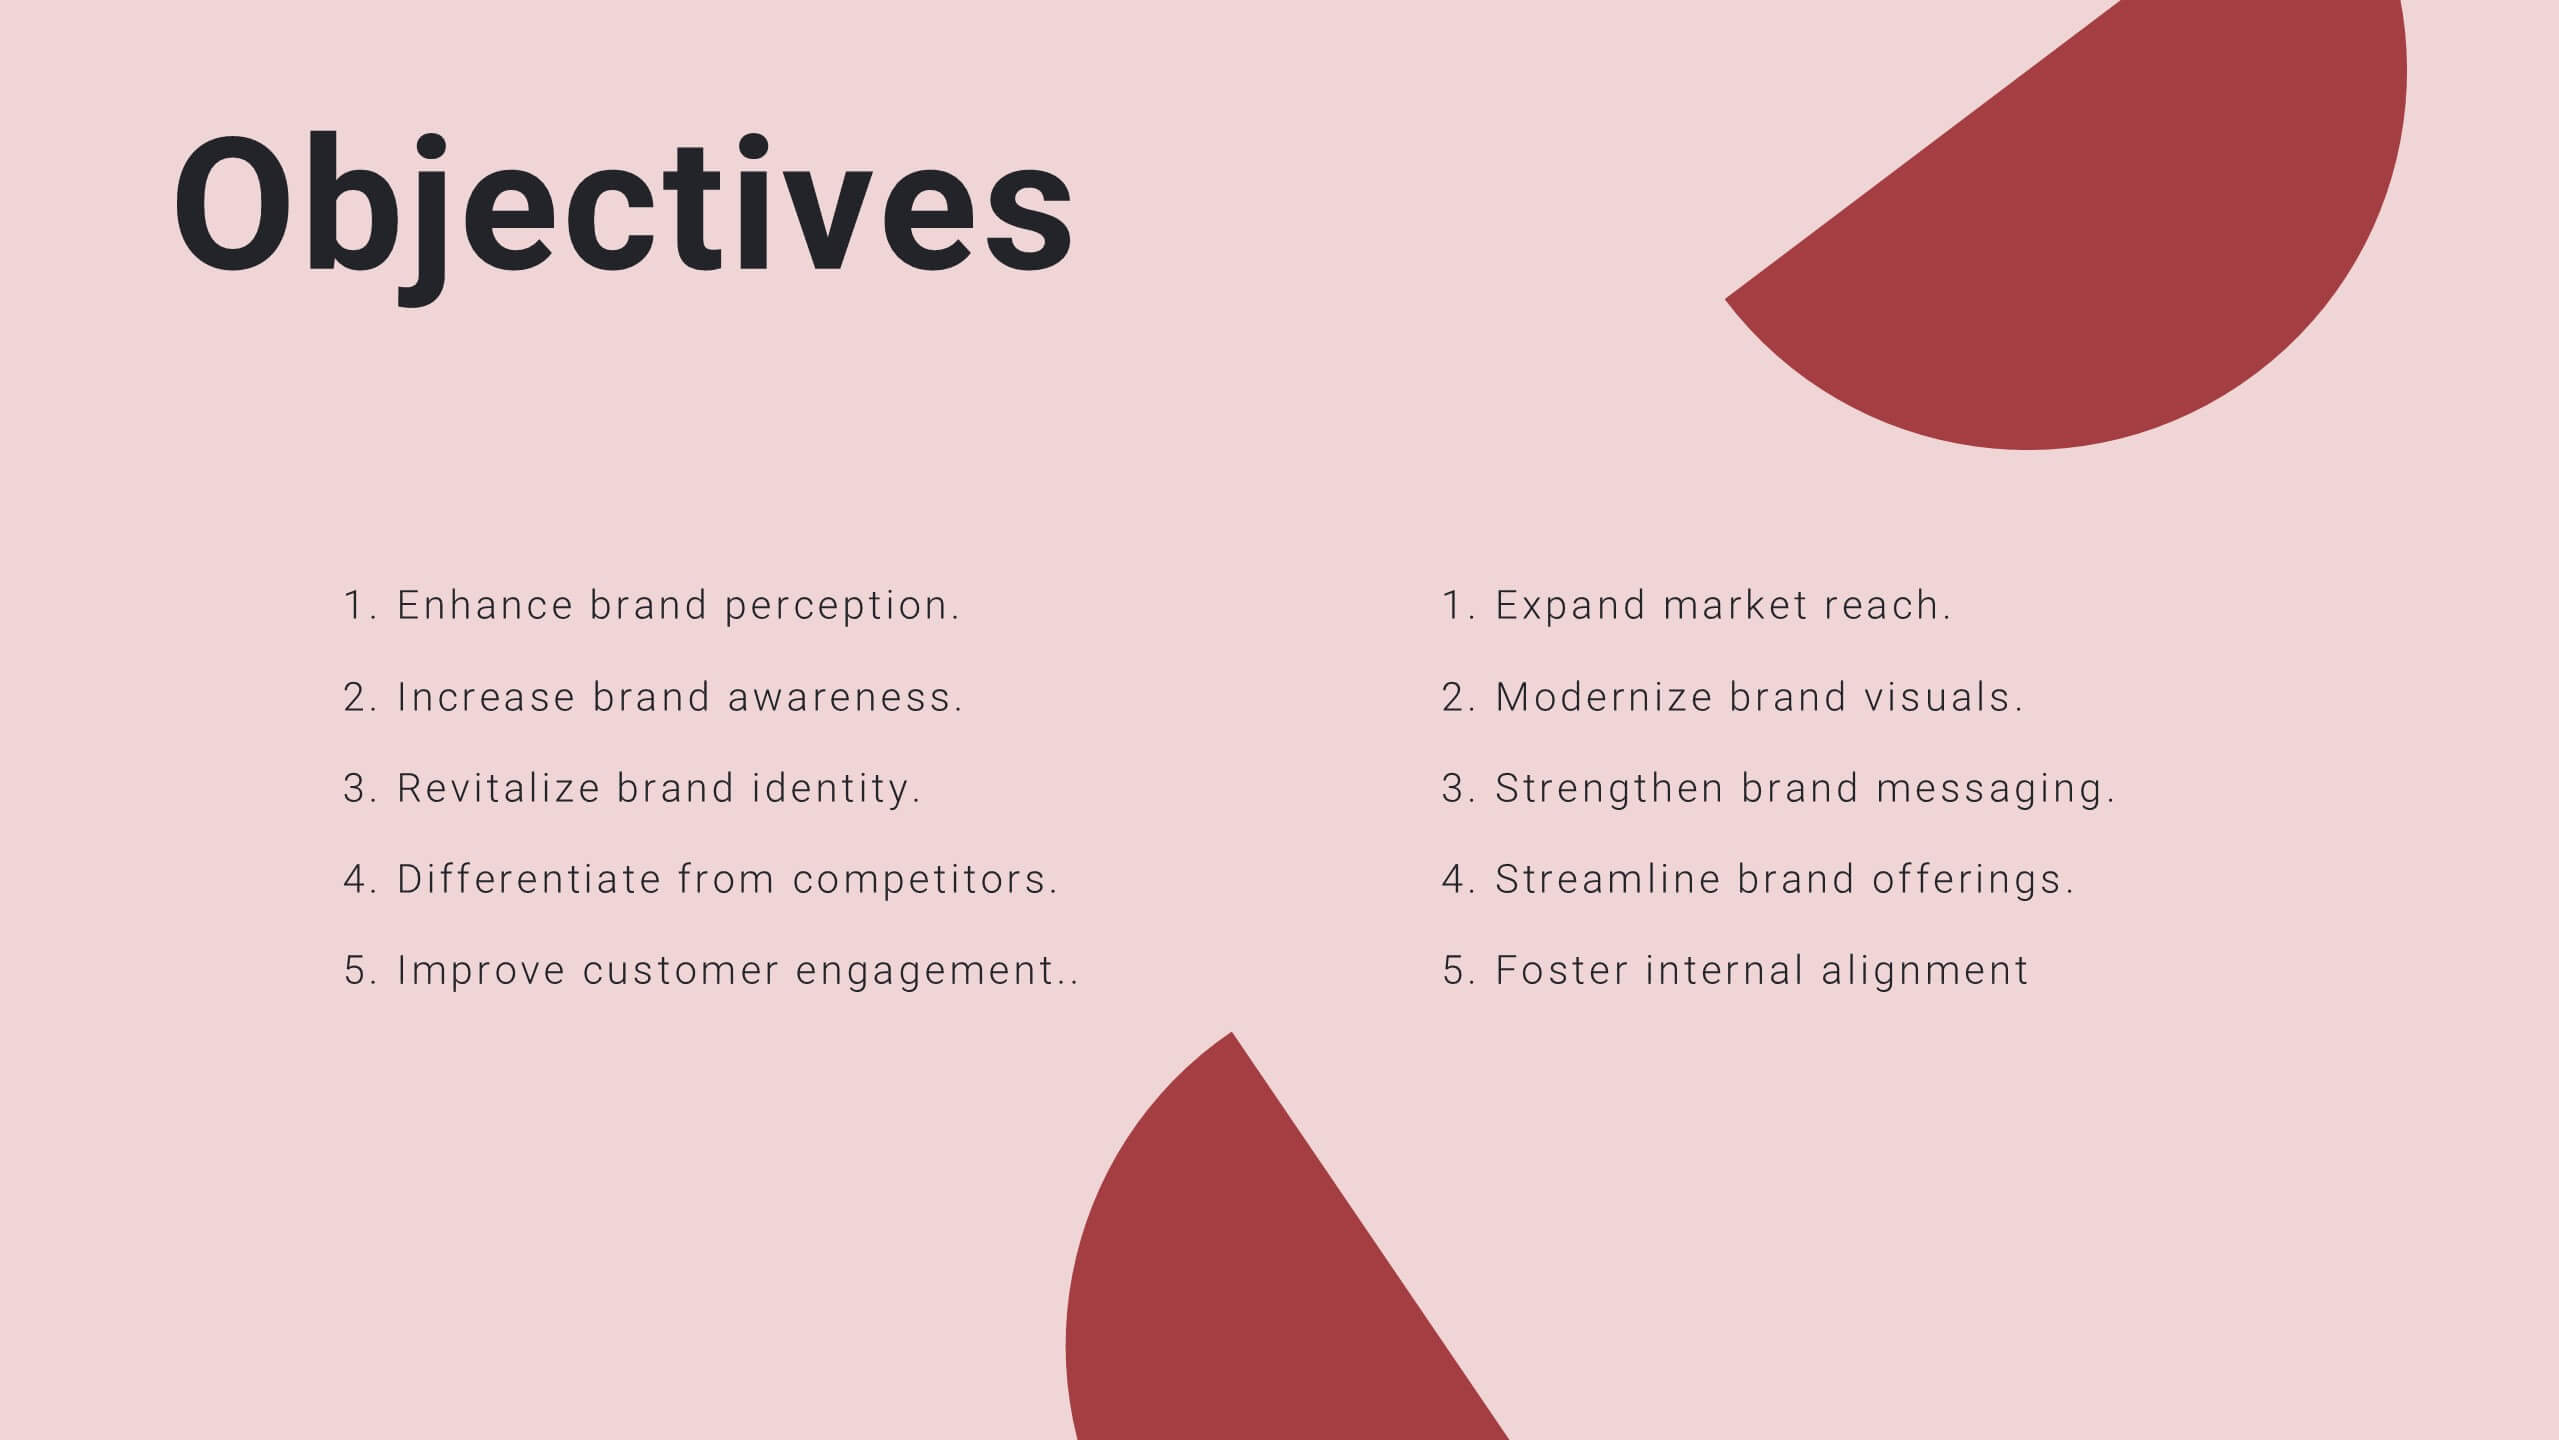
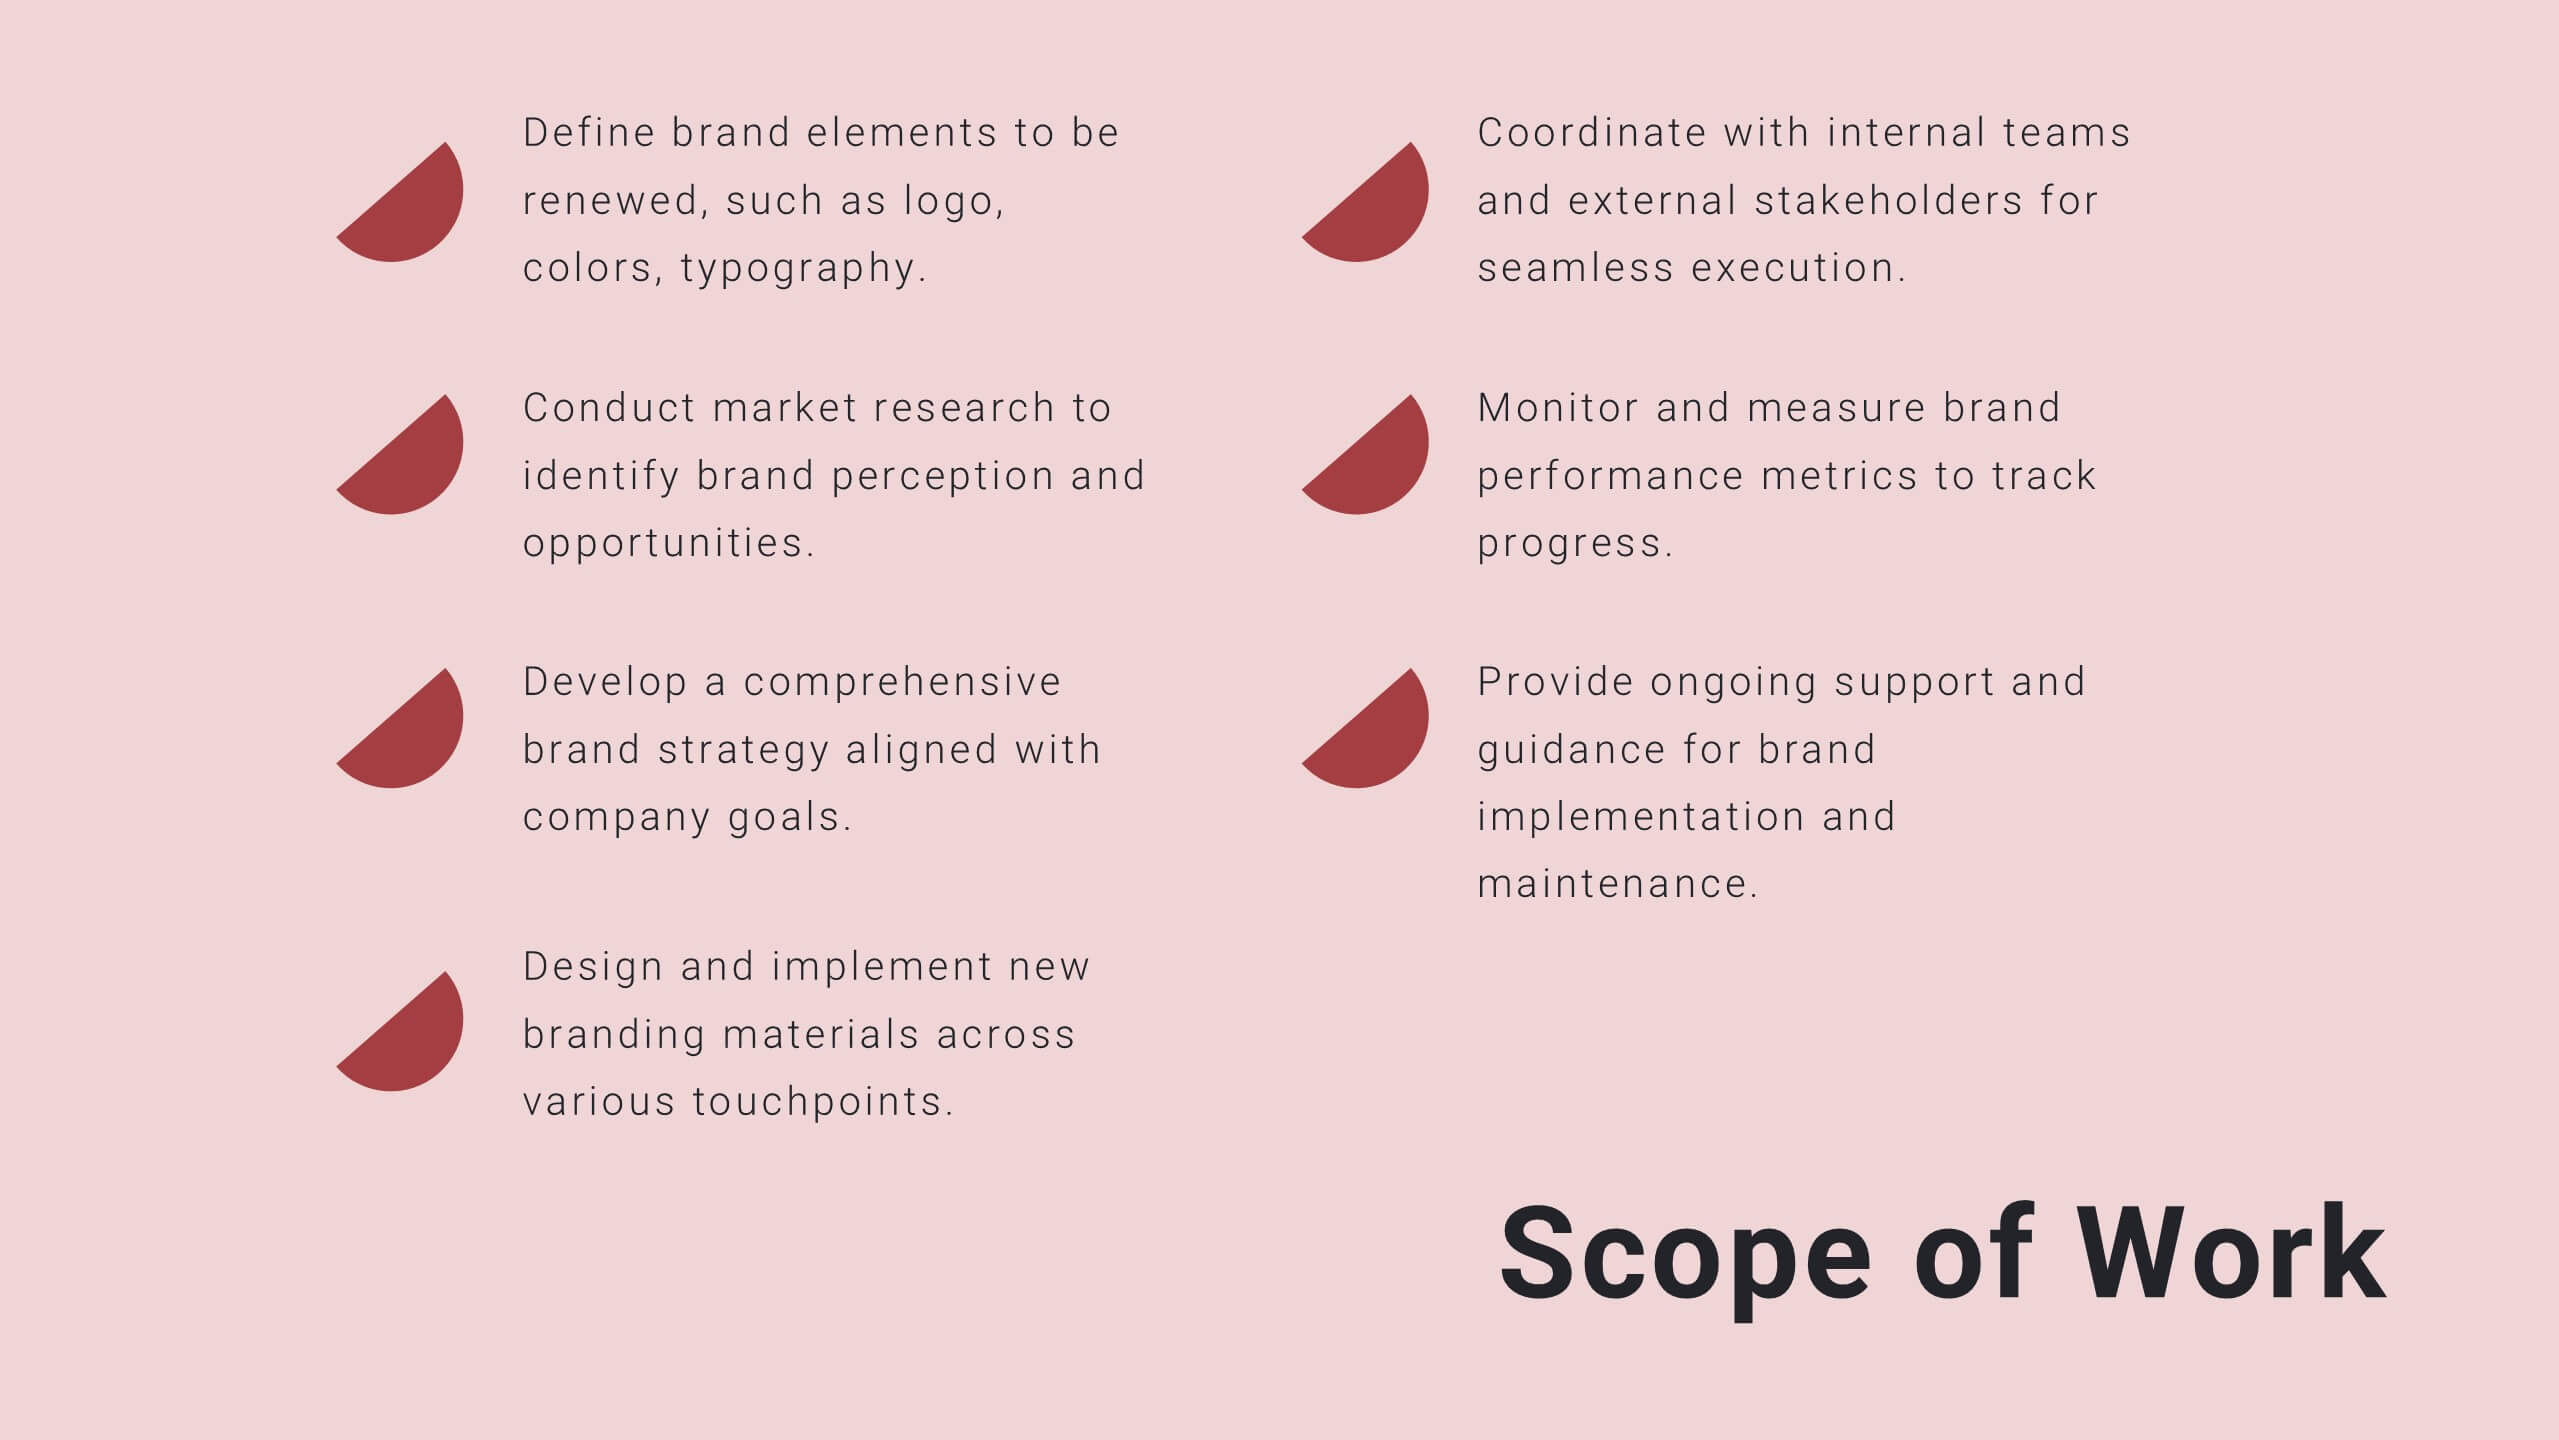
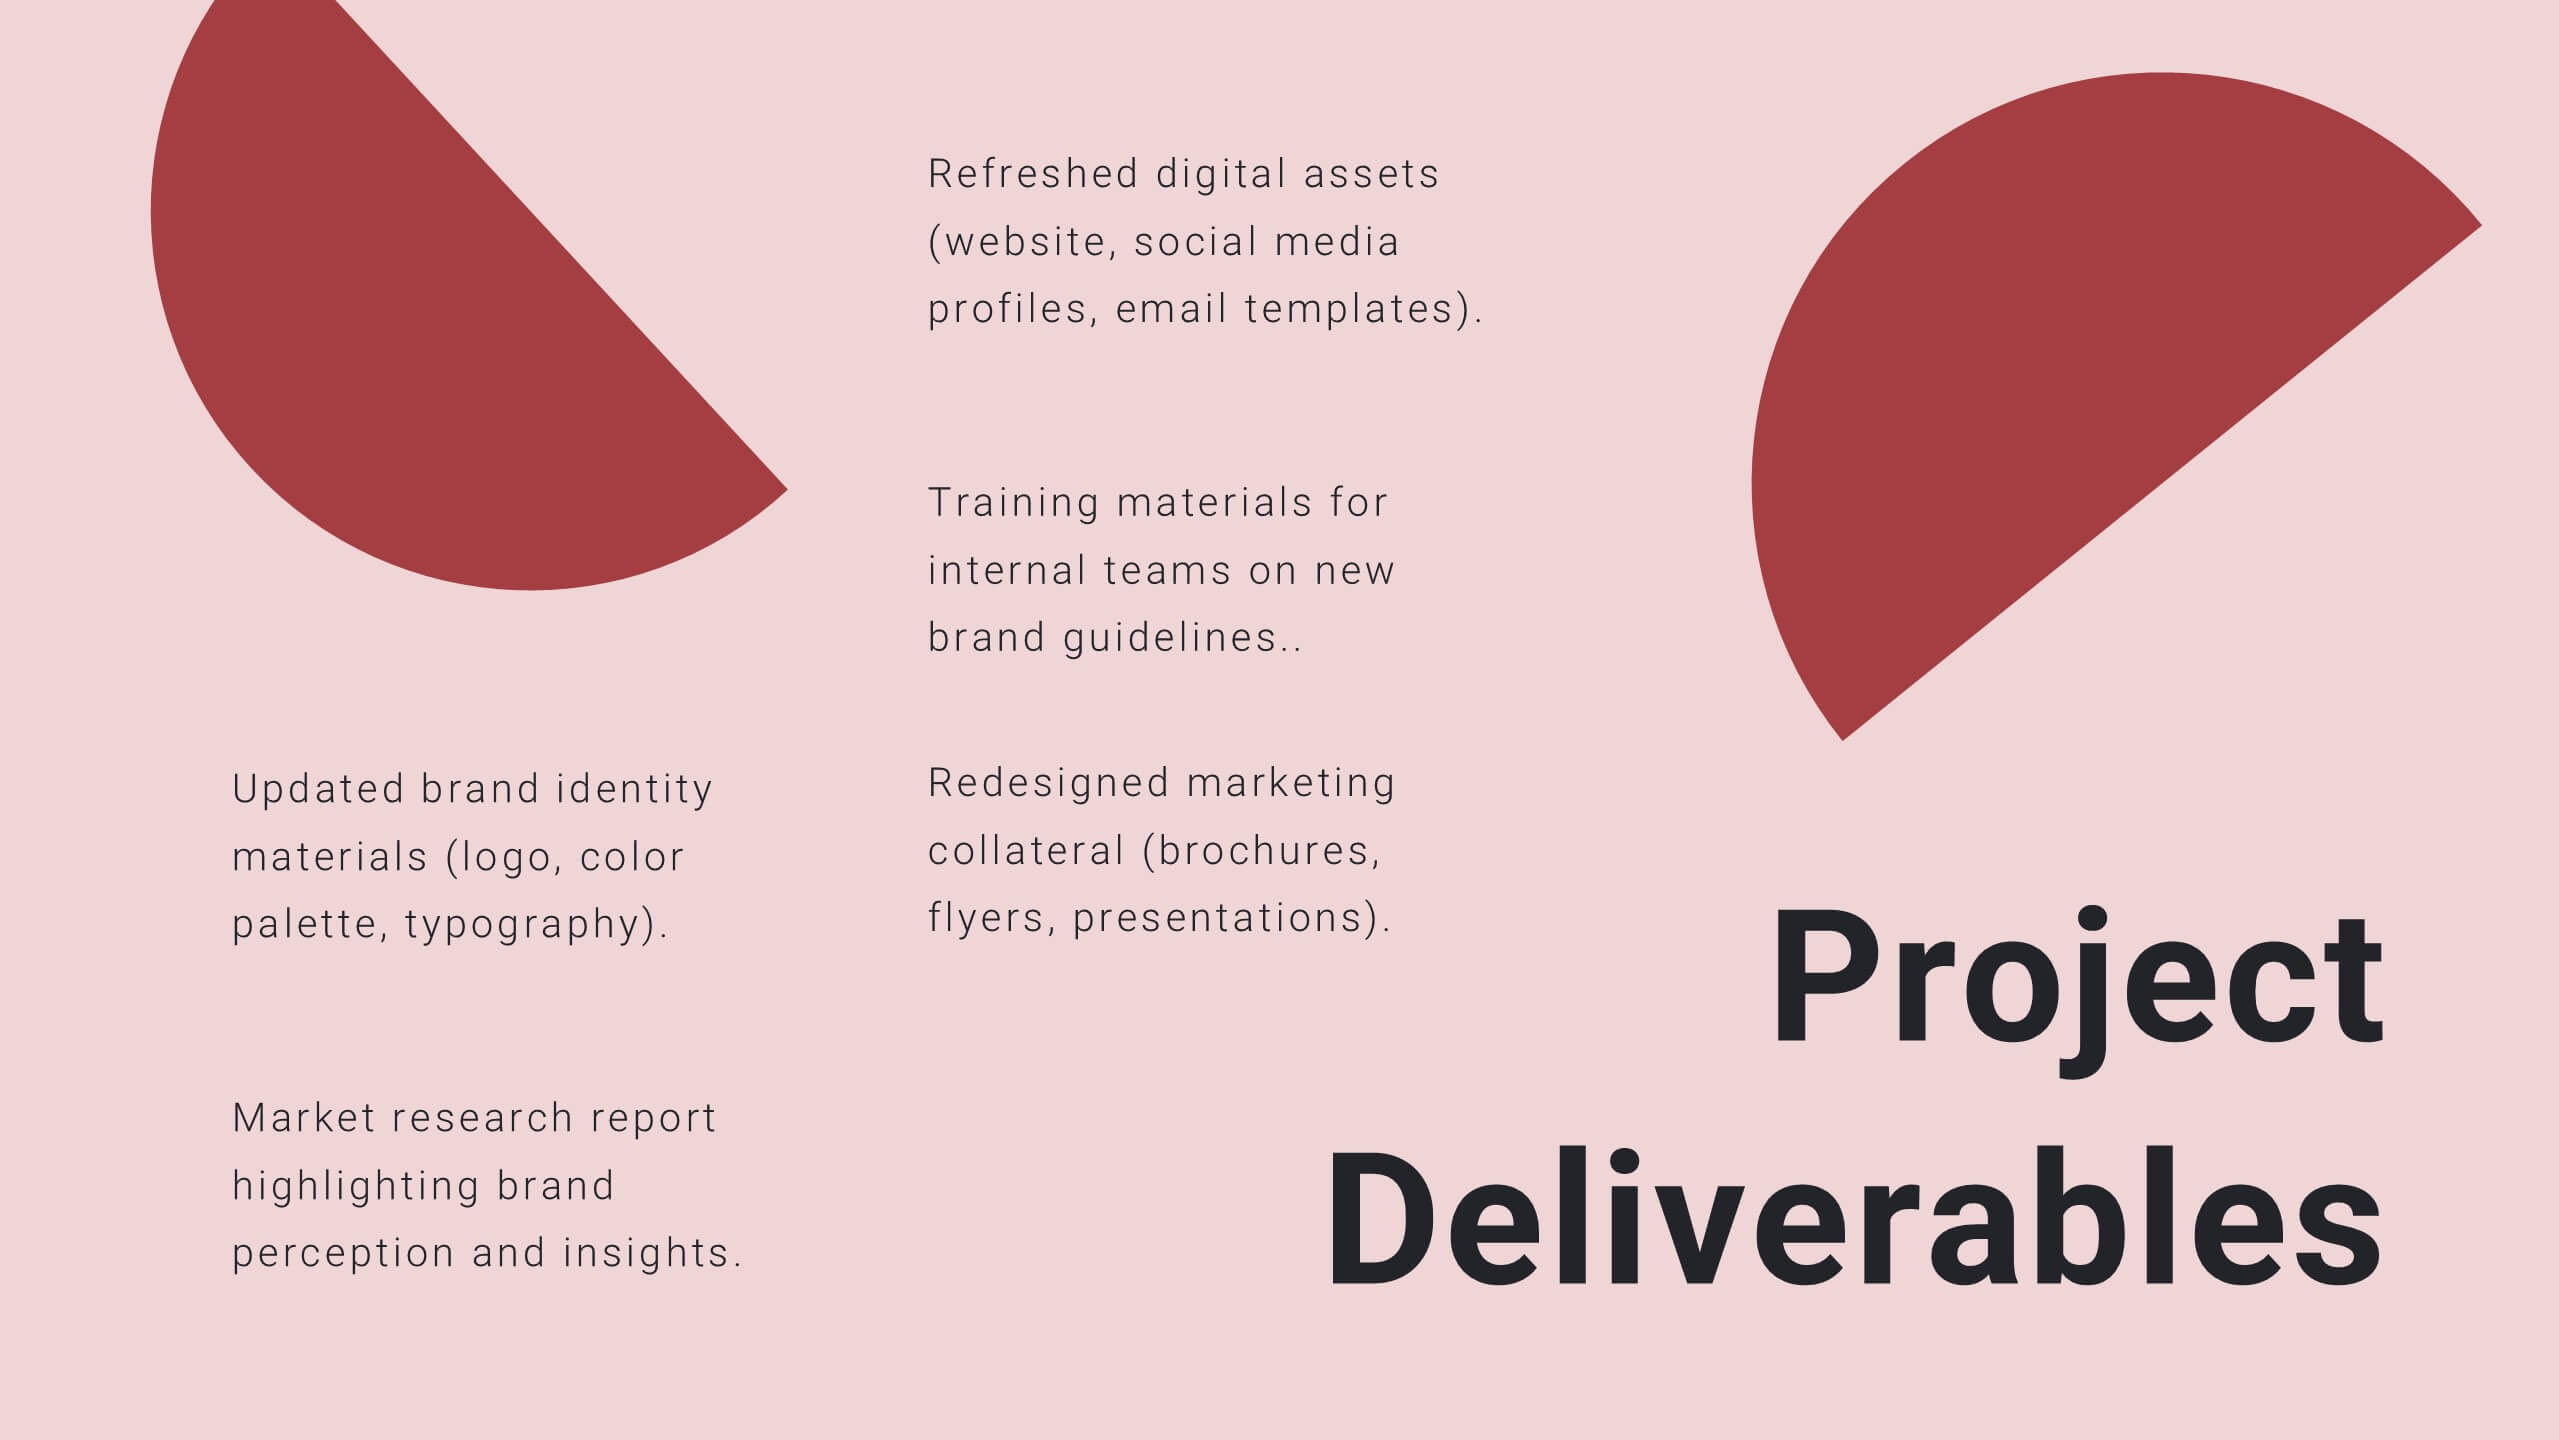
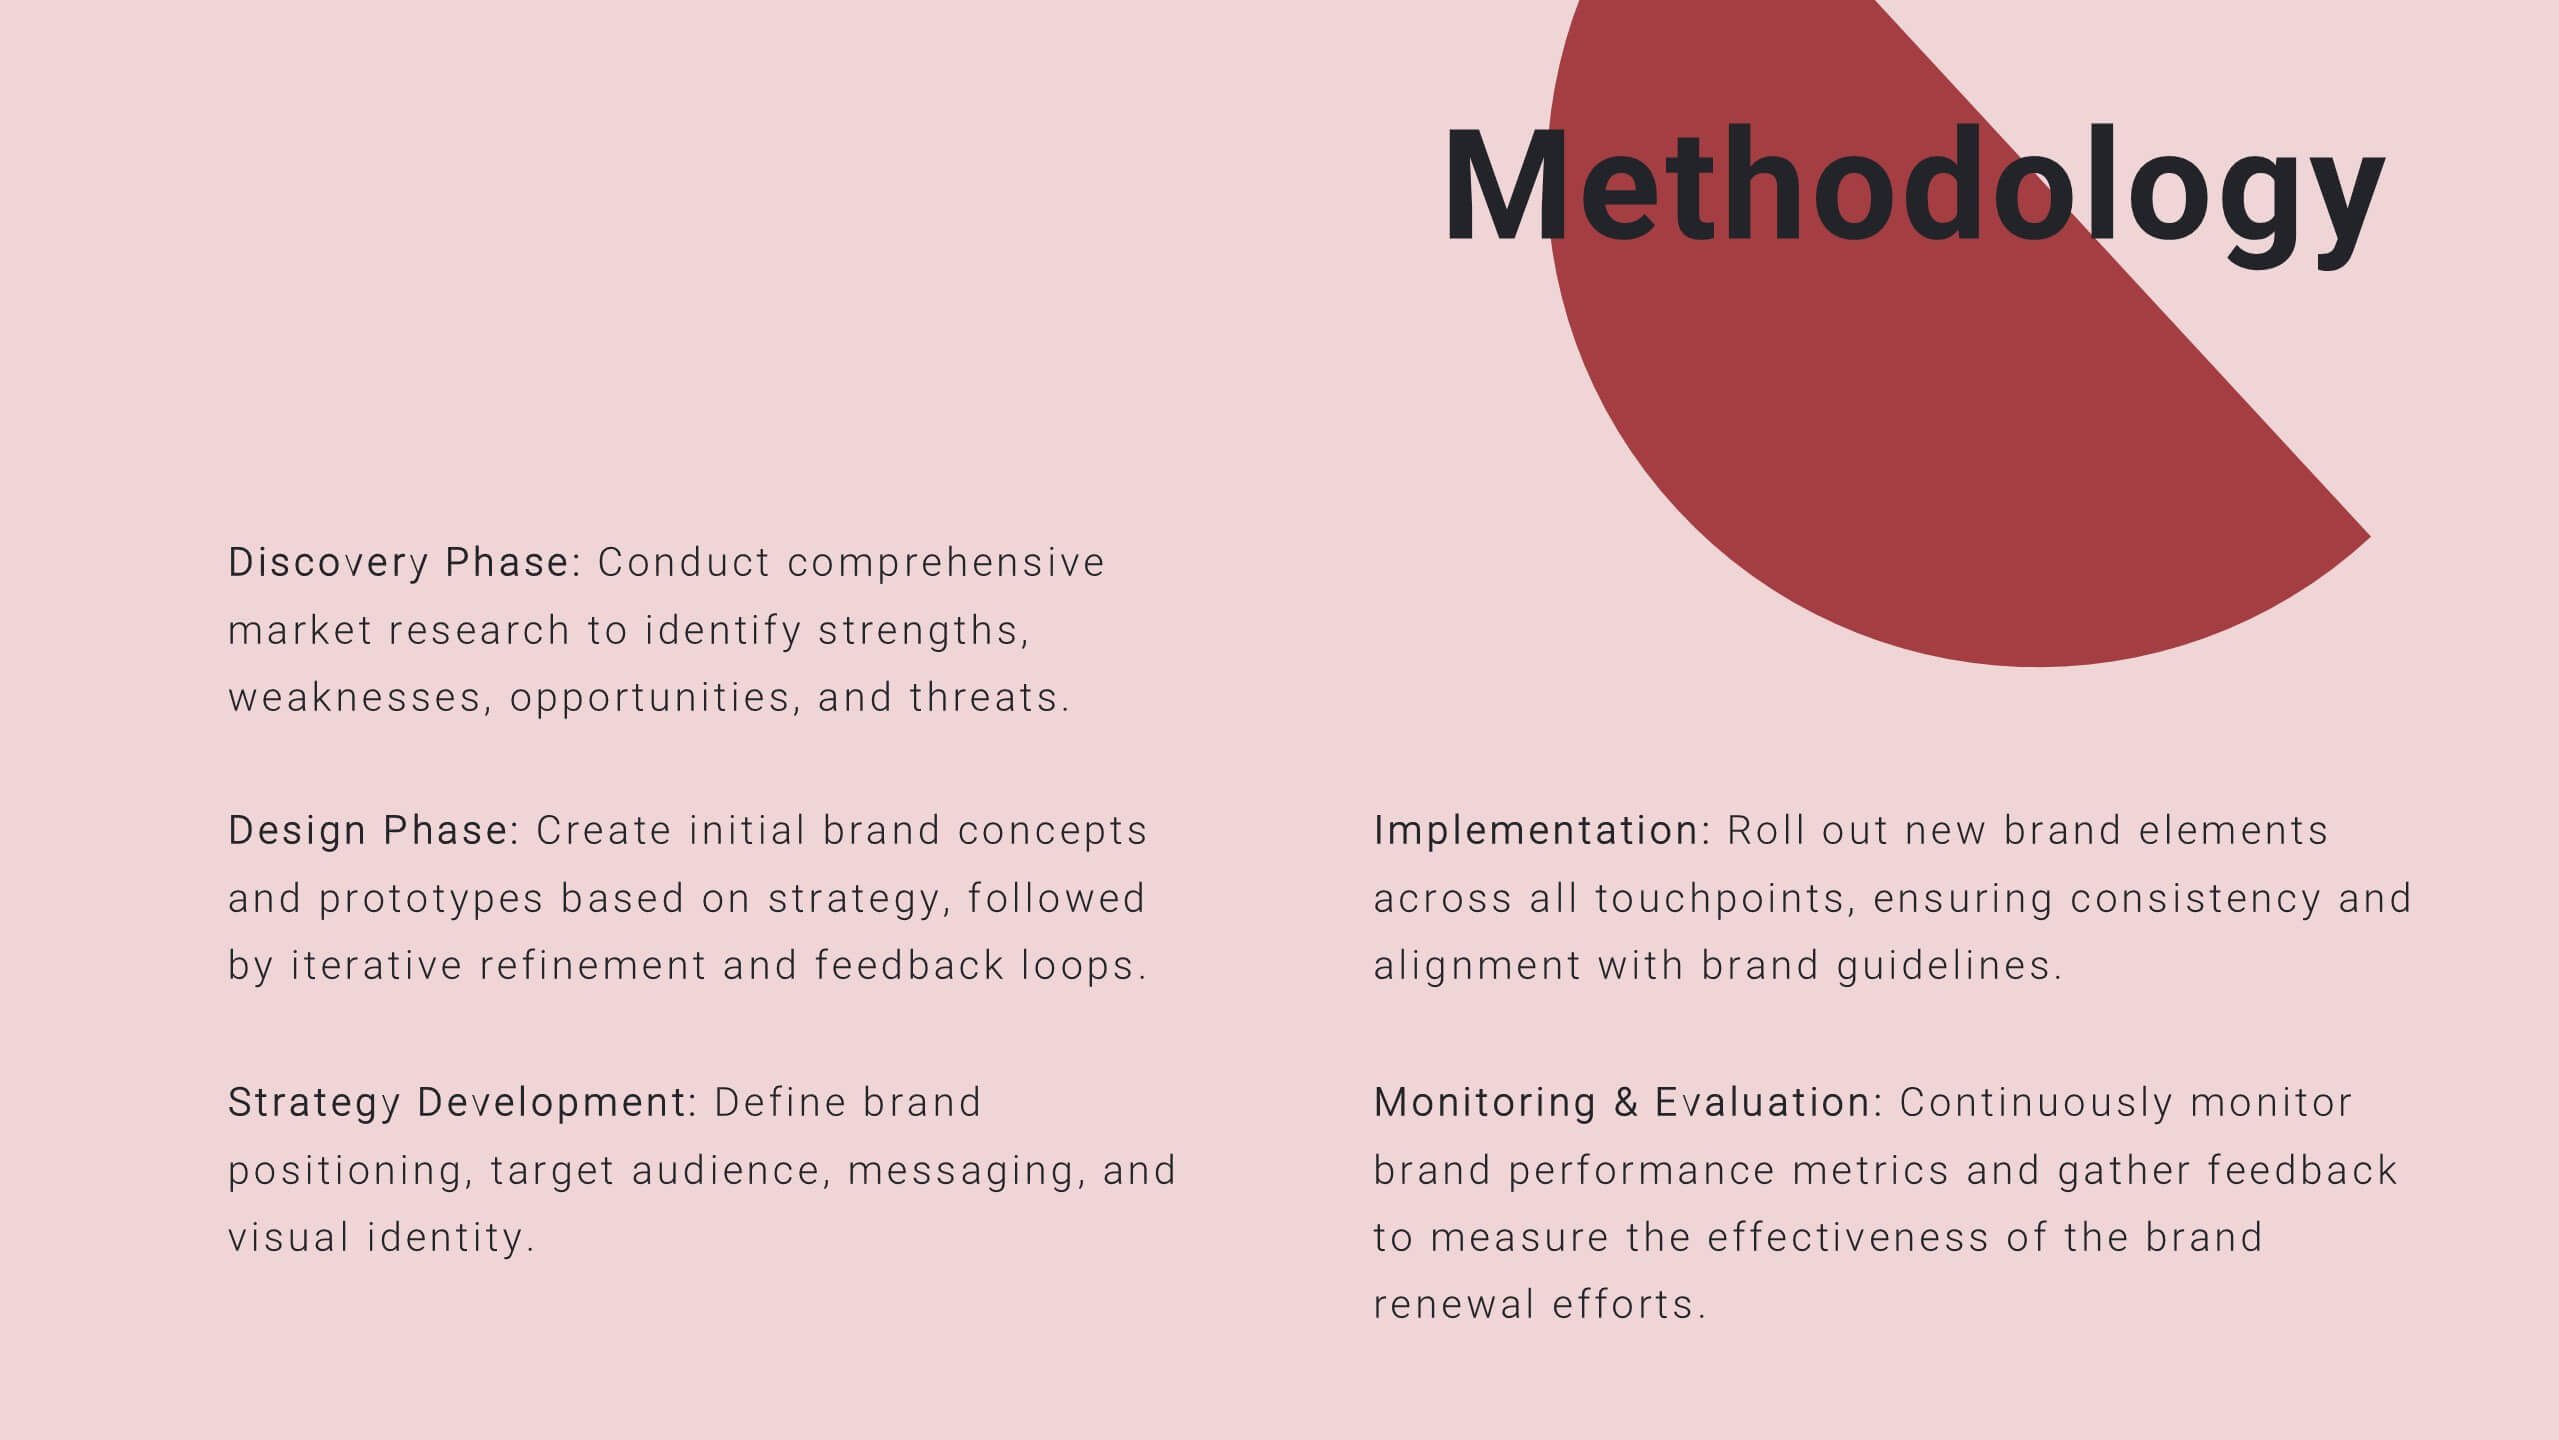
Business Objectives and Strategic Goals Presentation
Clarify your roadmap to success with this visually structured Business Objectives and Strategic Goals slide. Featuring five segmented goal icons arranged in a semi-circle layout, this template is perfect for strategic planning, quarterly reports, and team briefings. Each section allows space to detail your specific objectives with matching visuals for easy comprehension. Fully editable in PowerPoint, Keynote, and Google Slides.


10 slides
4 Stages of Strategic Execution Process Presentation
Clarify your strategy with the 4 Stages of Strategic Execution Process Presentation. This visually layered circle layout walks your audience through each key stage of execution—ideal for planning, operations, and team alignment. Each step is color-coded and fully editable, ensuring your message stays focused. Compatible with PowerPoint, Keynote, Google Slides, and Canva.


21 slides
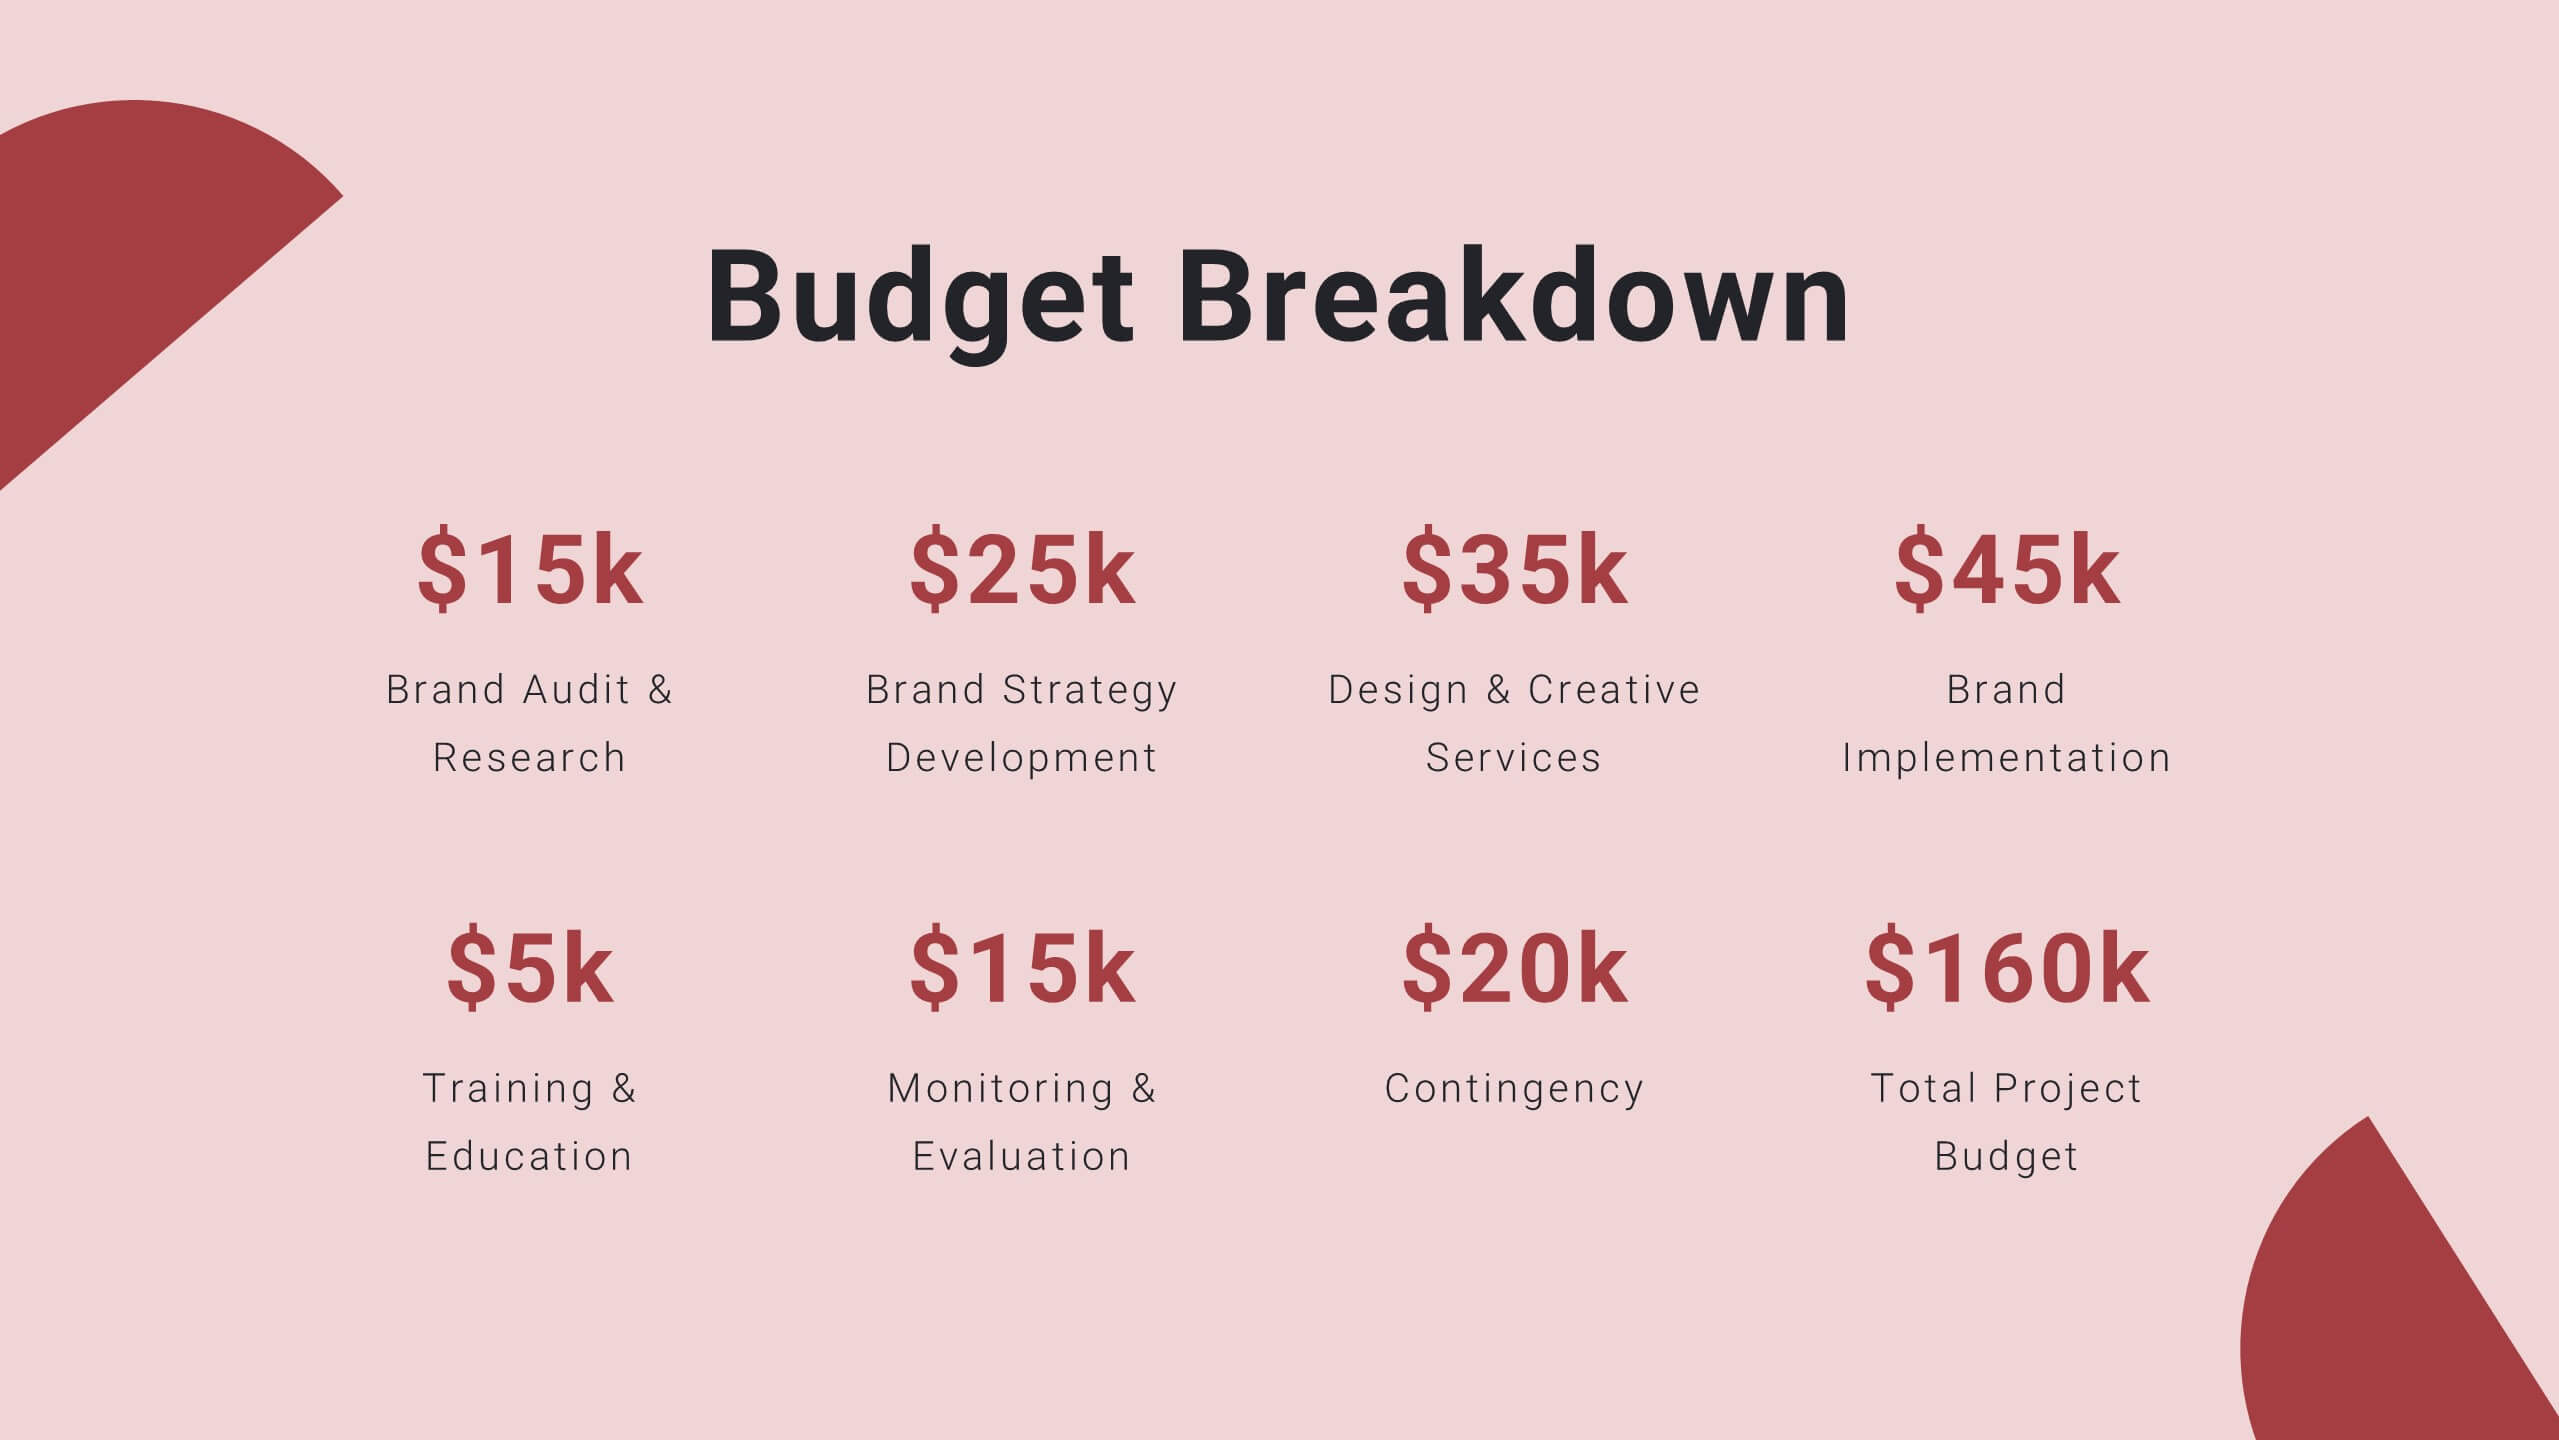
Twilight Project Milestones Report Presentation
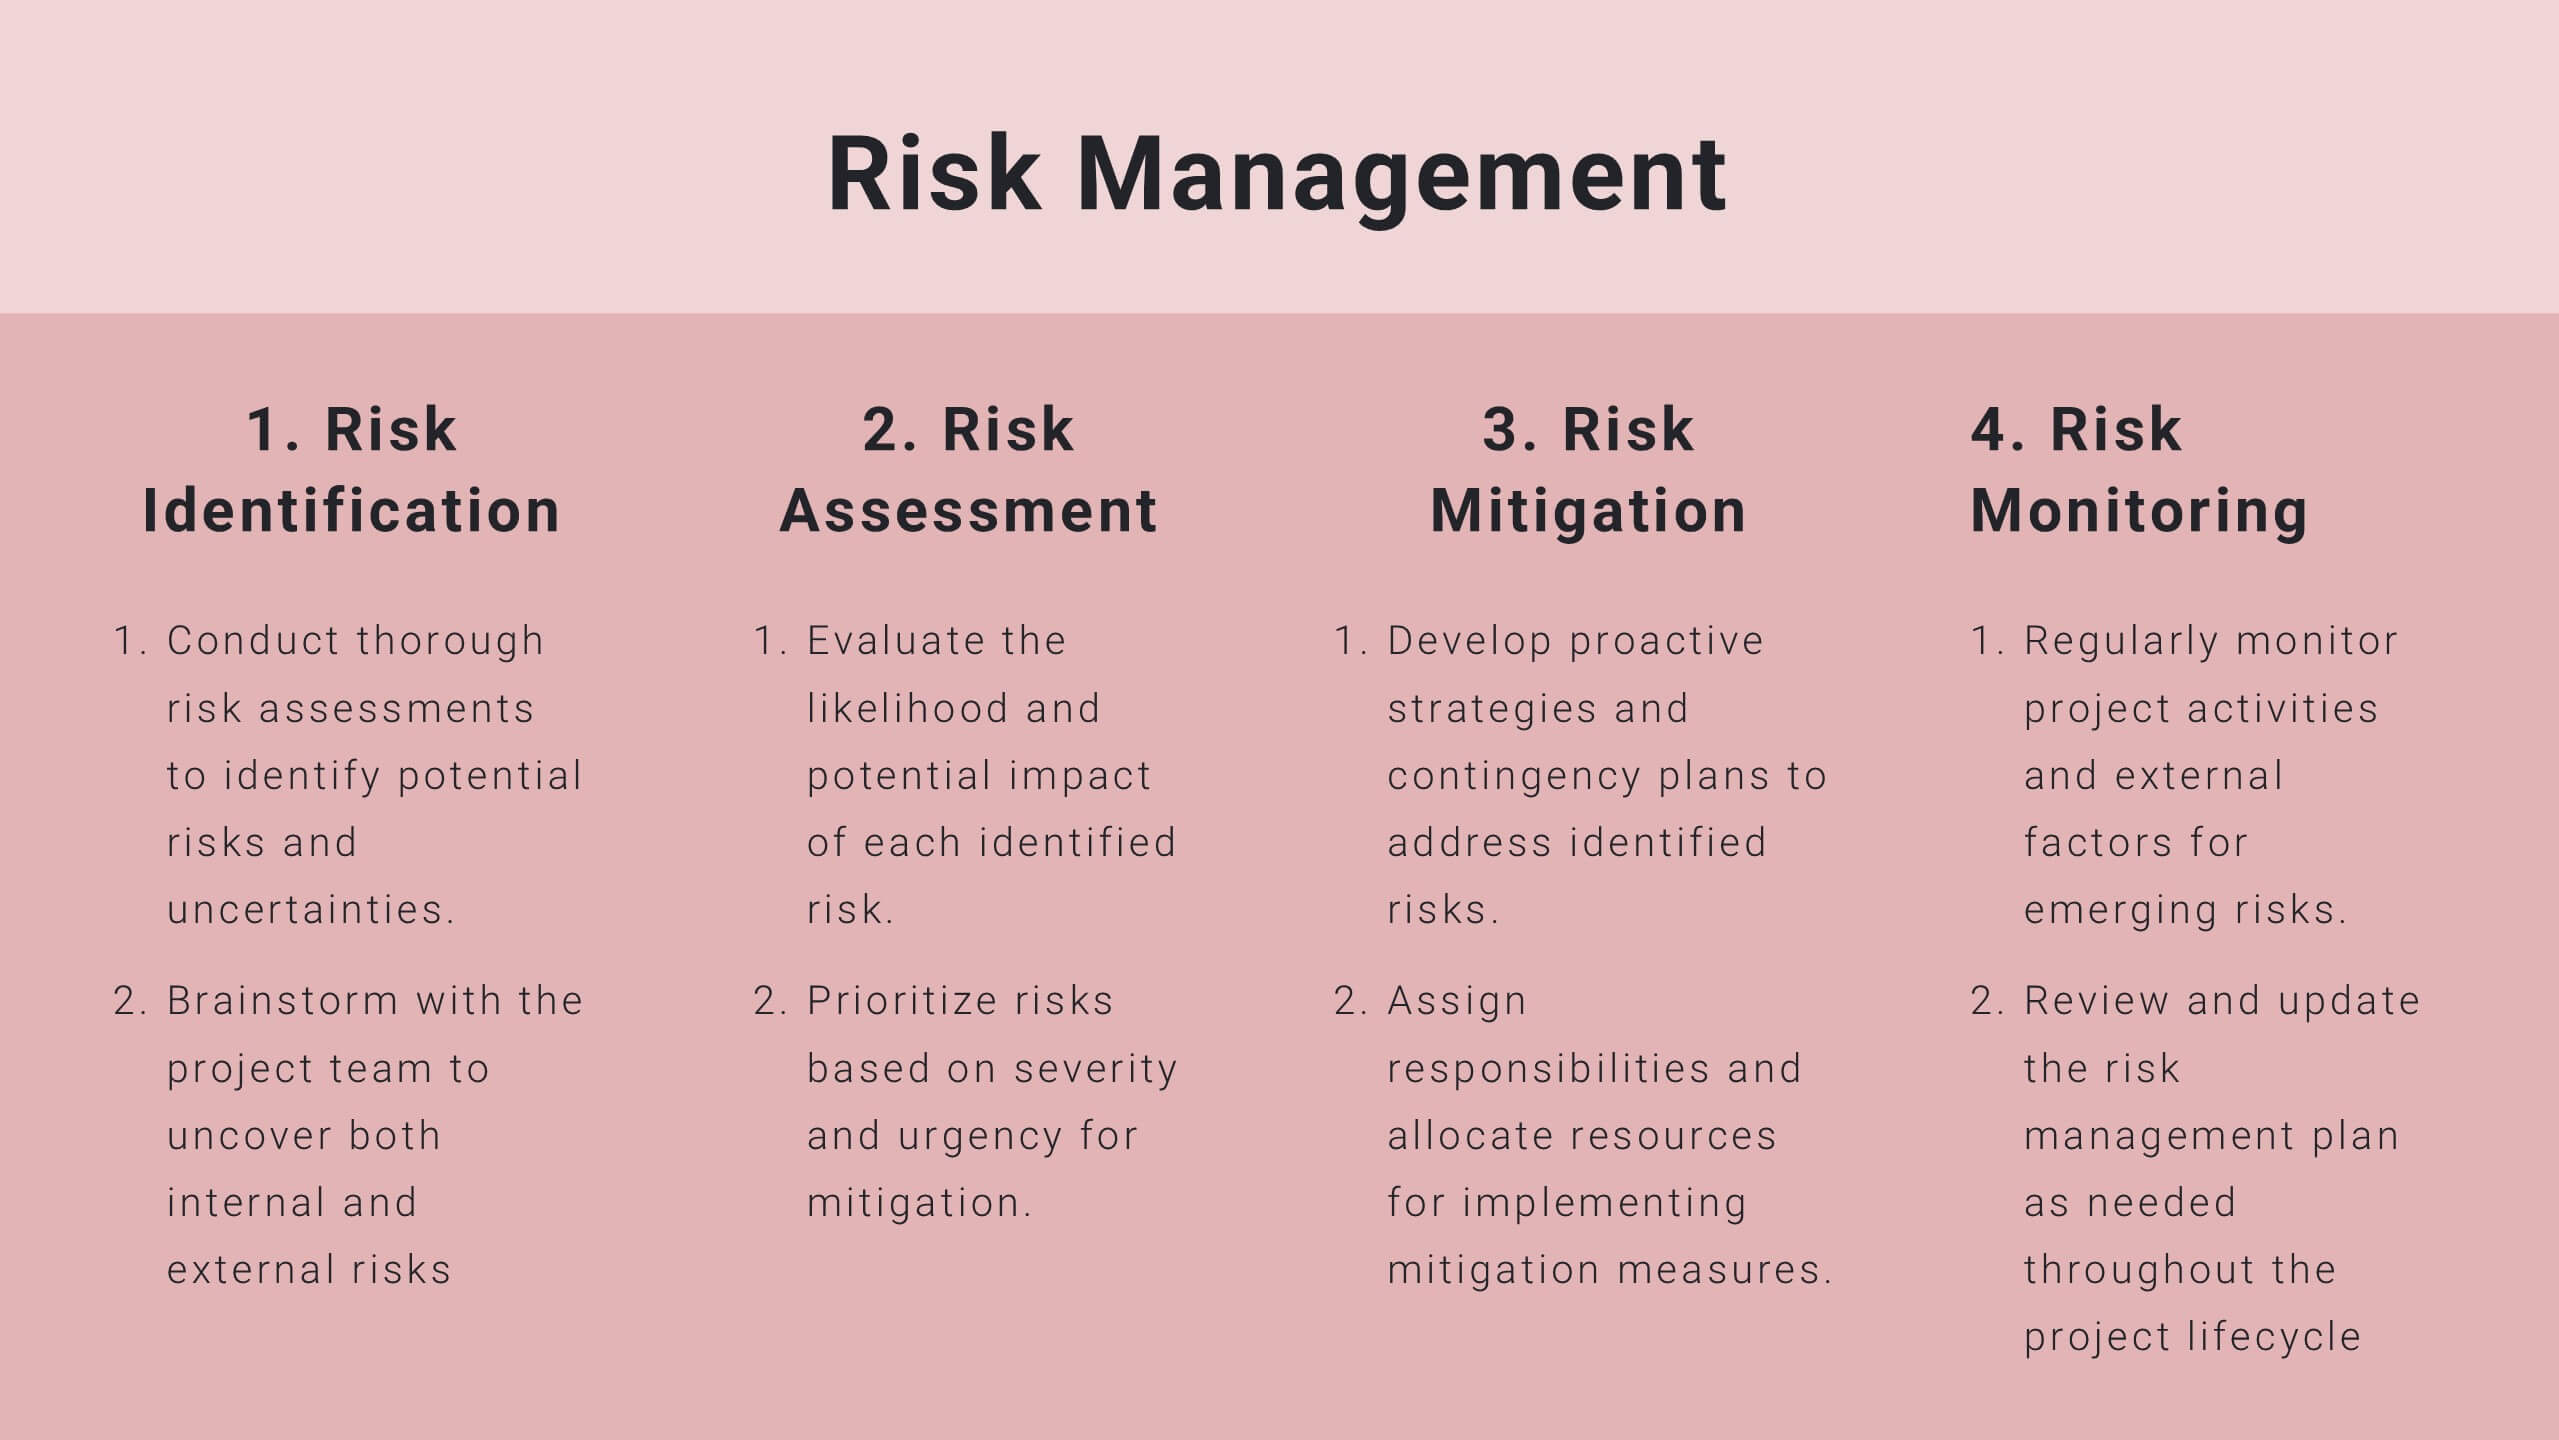
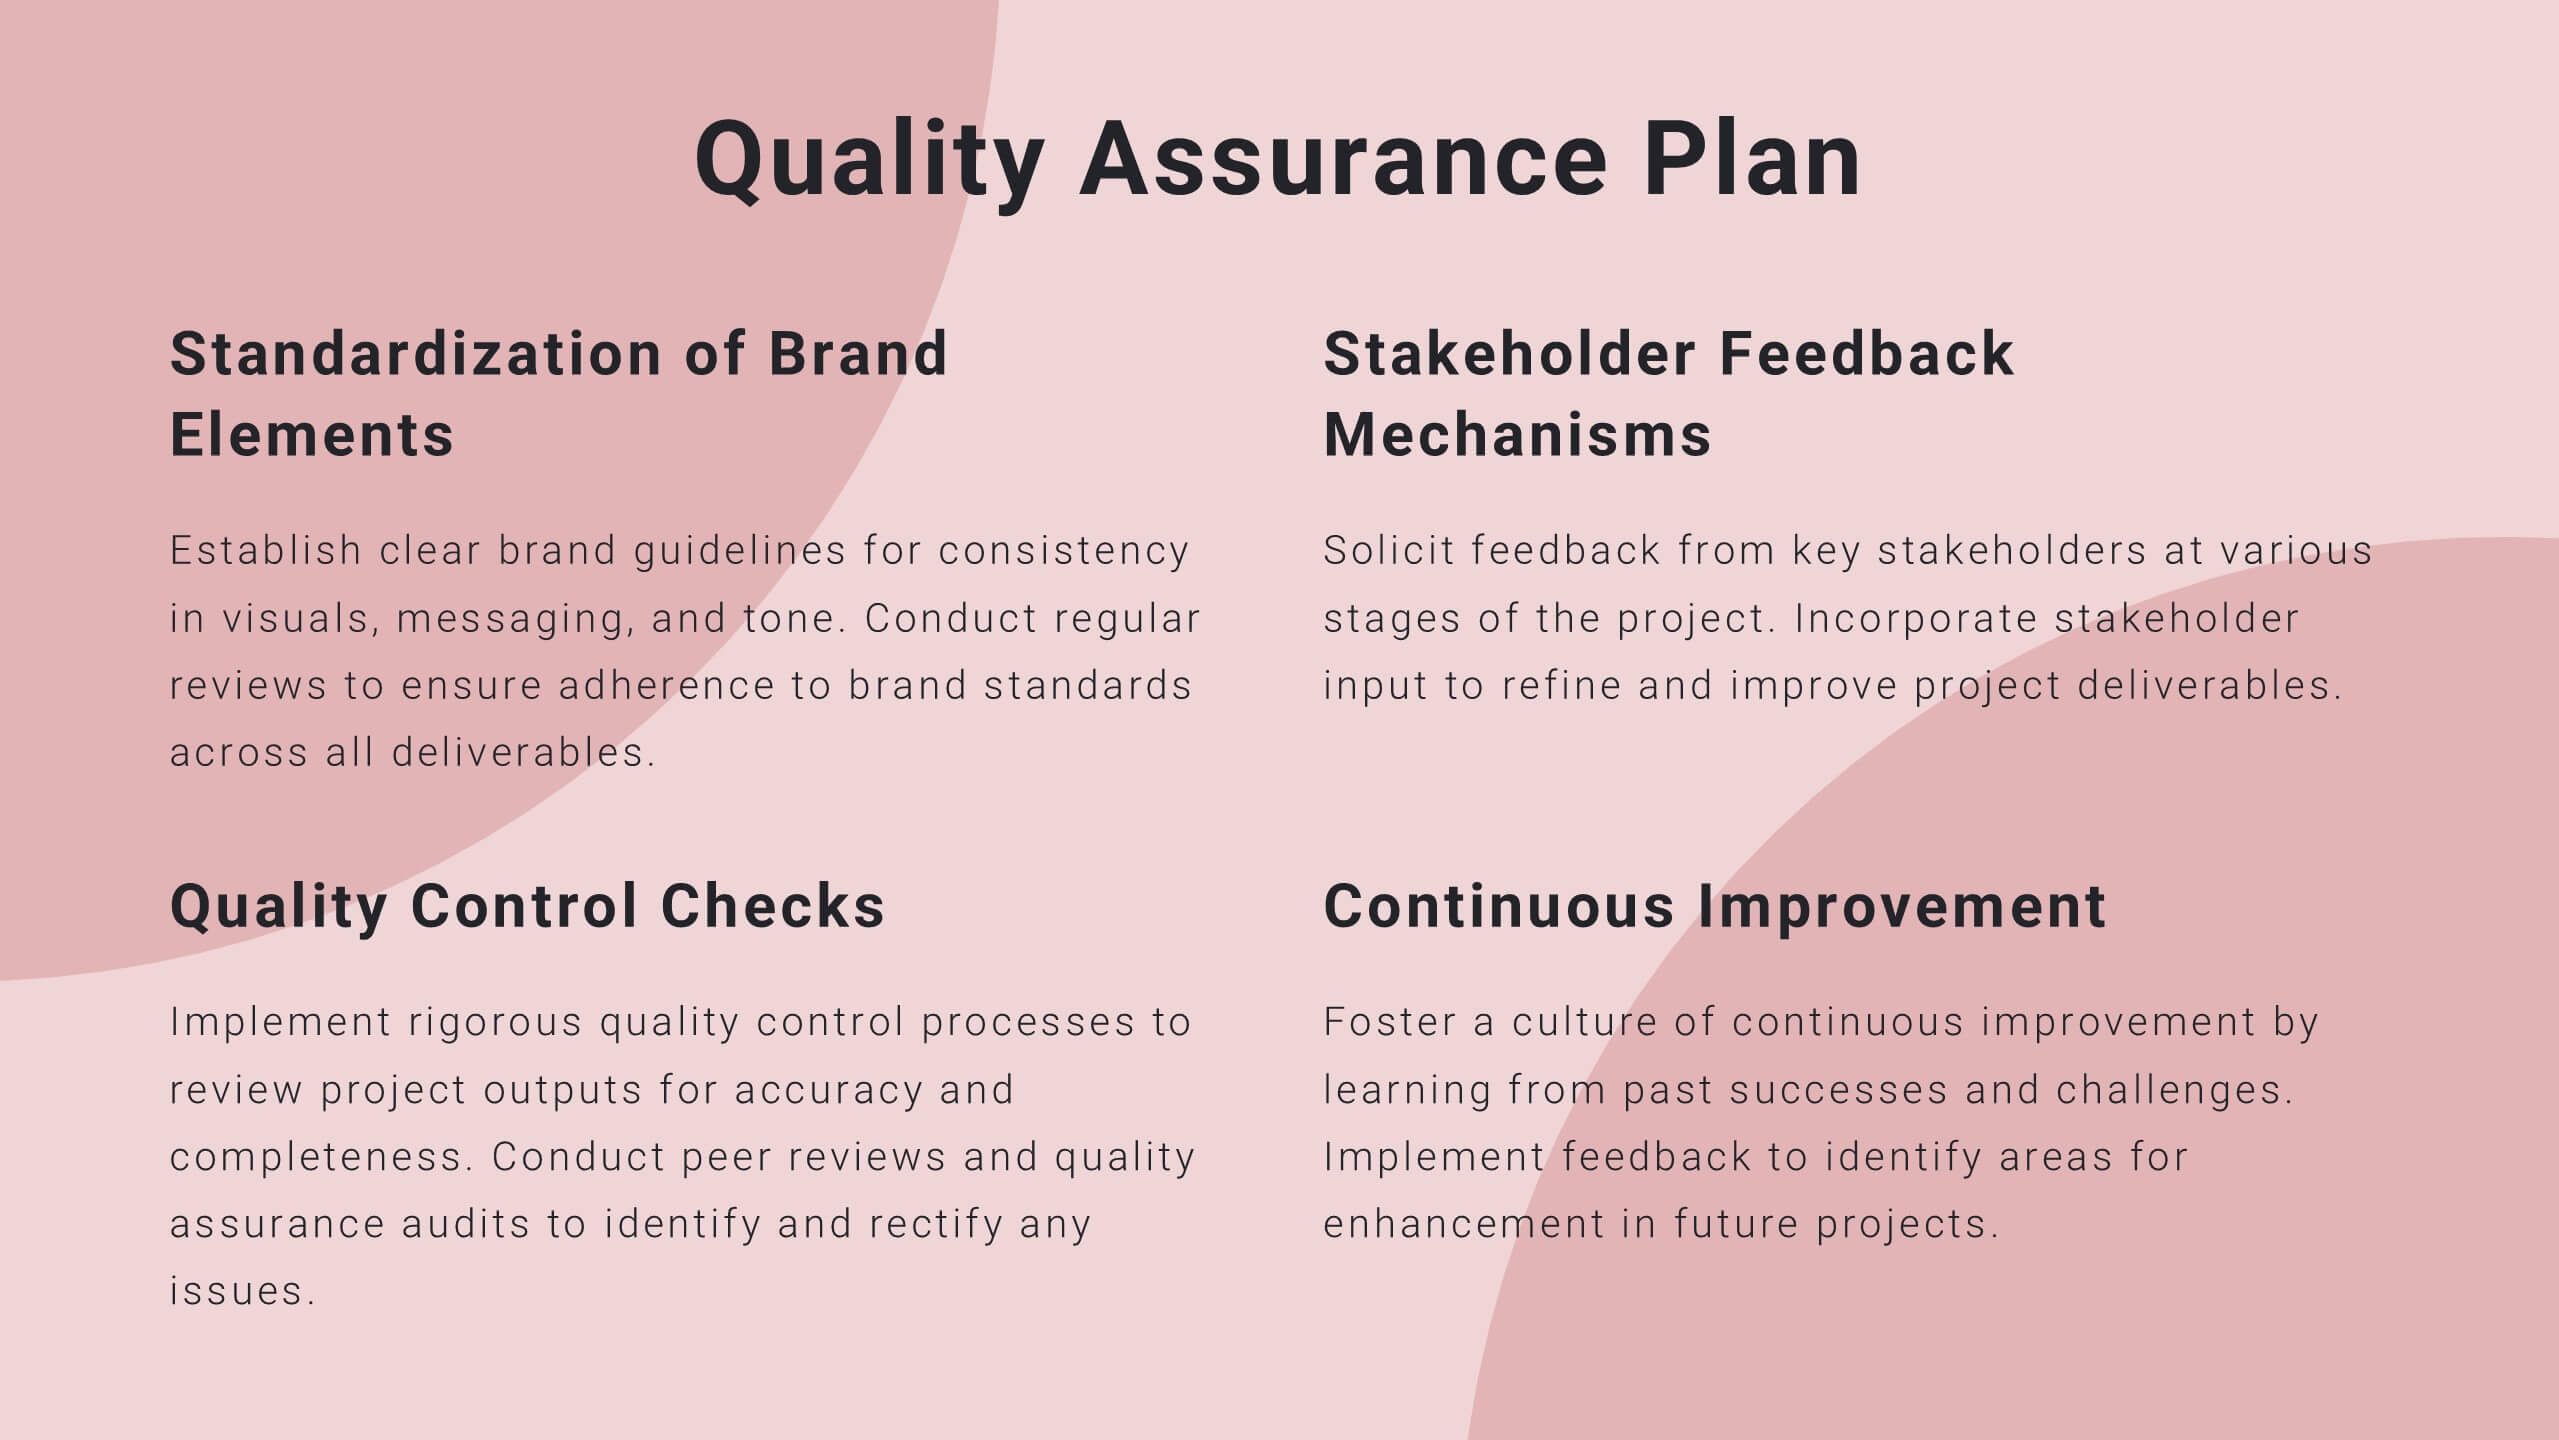
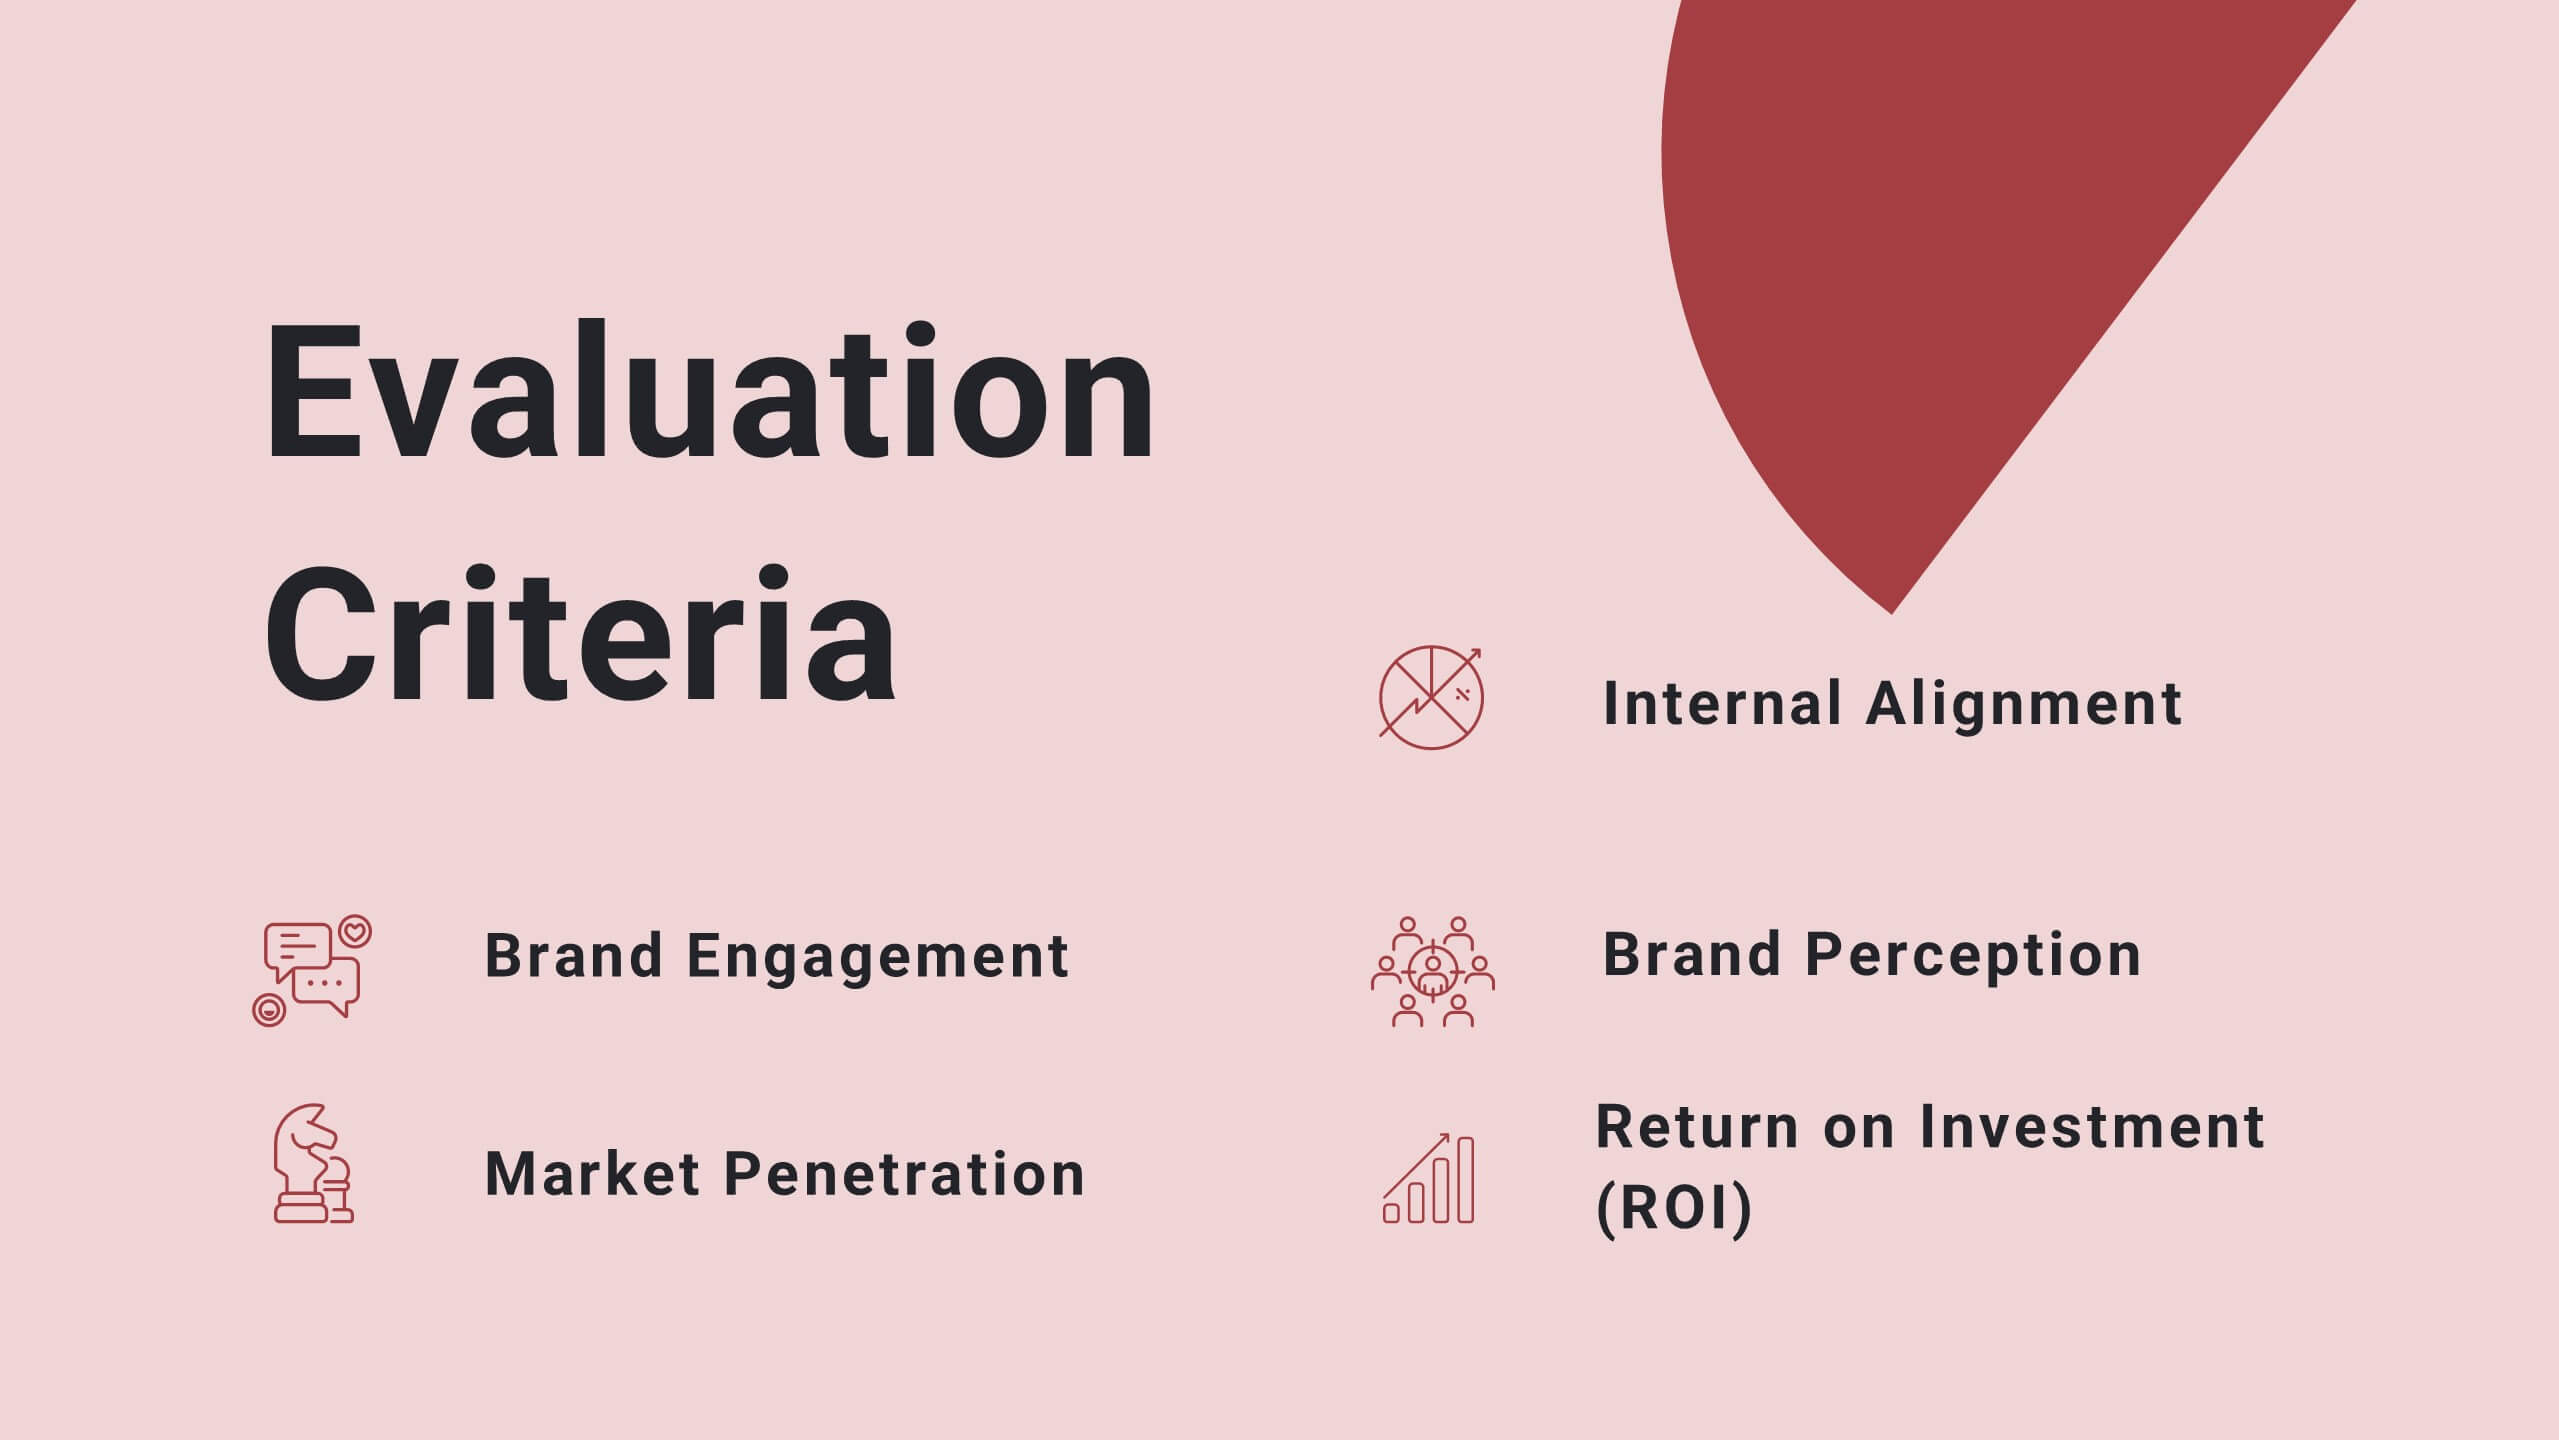
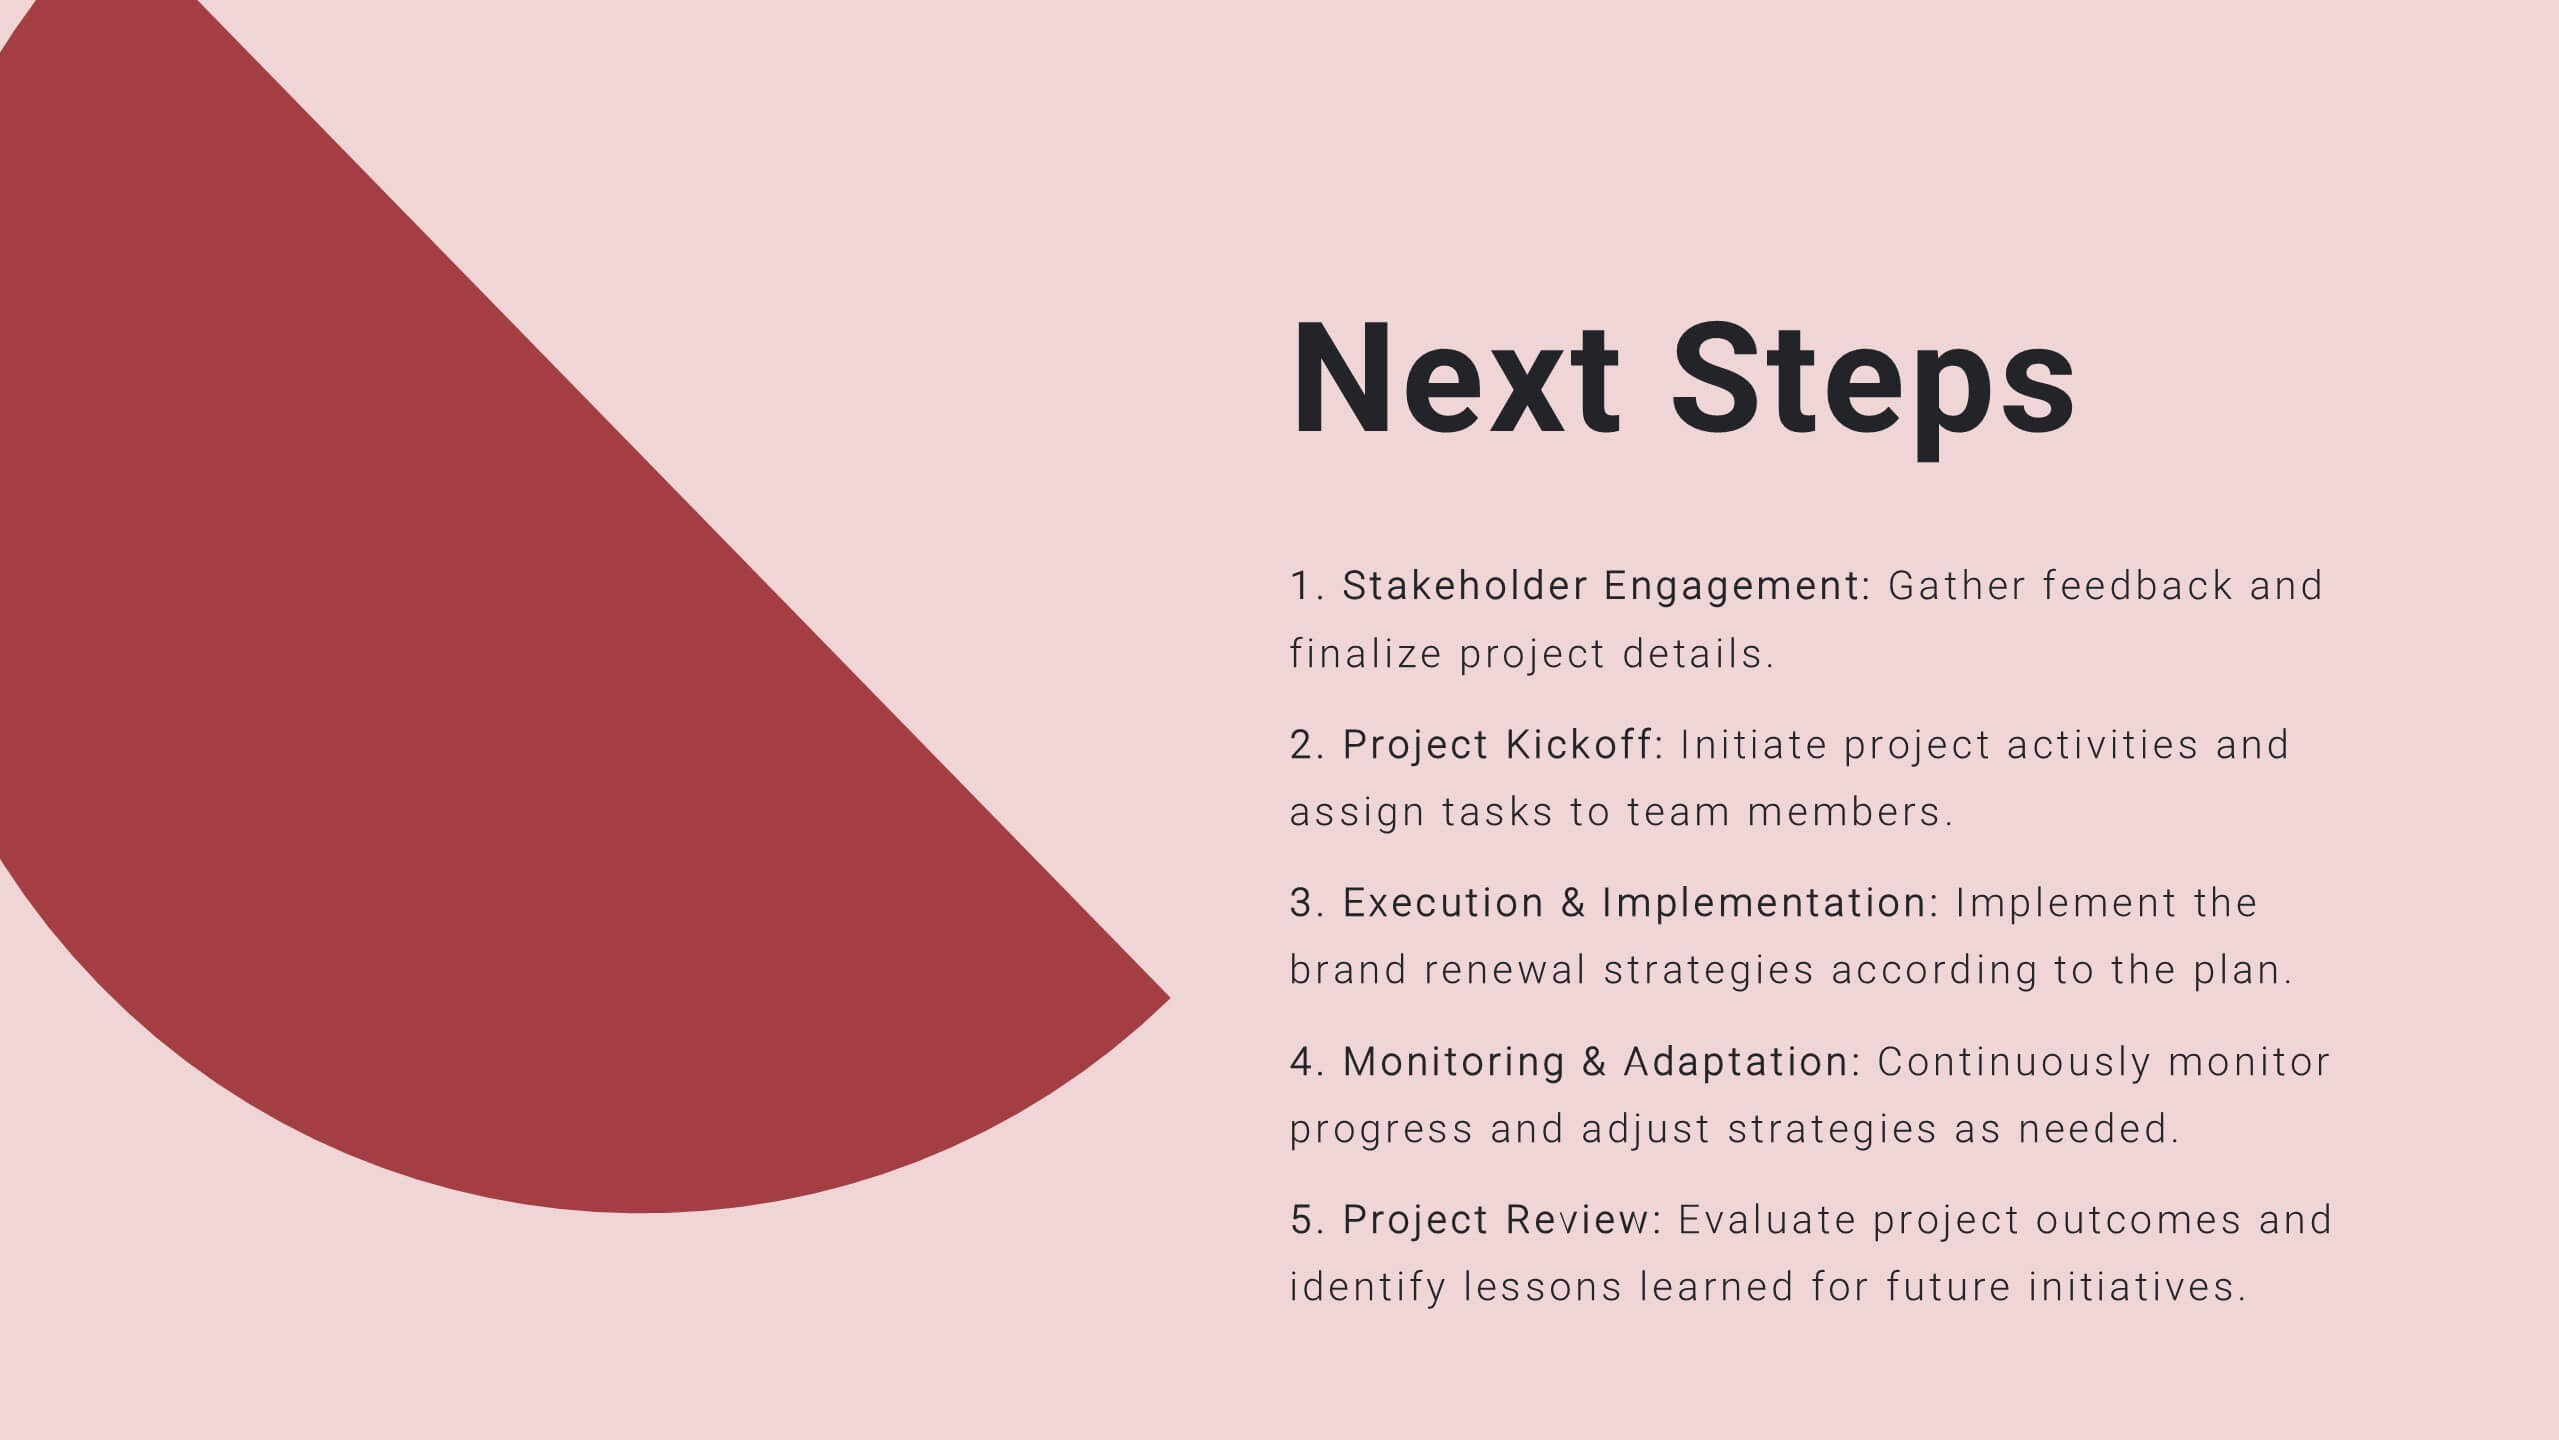
Present your project milestones and plan with clarity using this sleek project proposal template! It includes sections for objectives, timelines, budget breakdowns, and risk management. Perfect for organizing and presenting complex project plans, it’s fully customizable and compatible with PowerPoint, Keynote, and Google Slides, ensuring a professional presentation every time.


6 slides
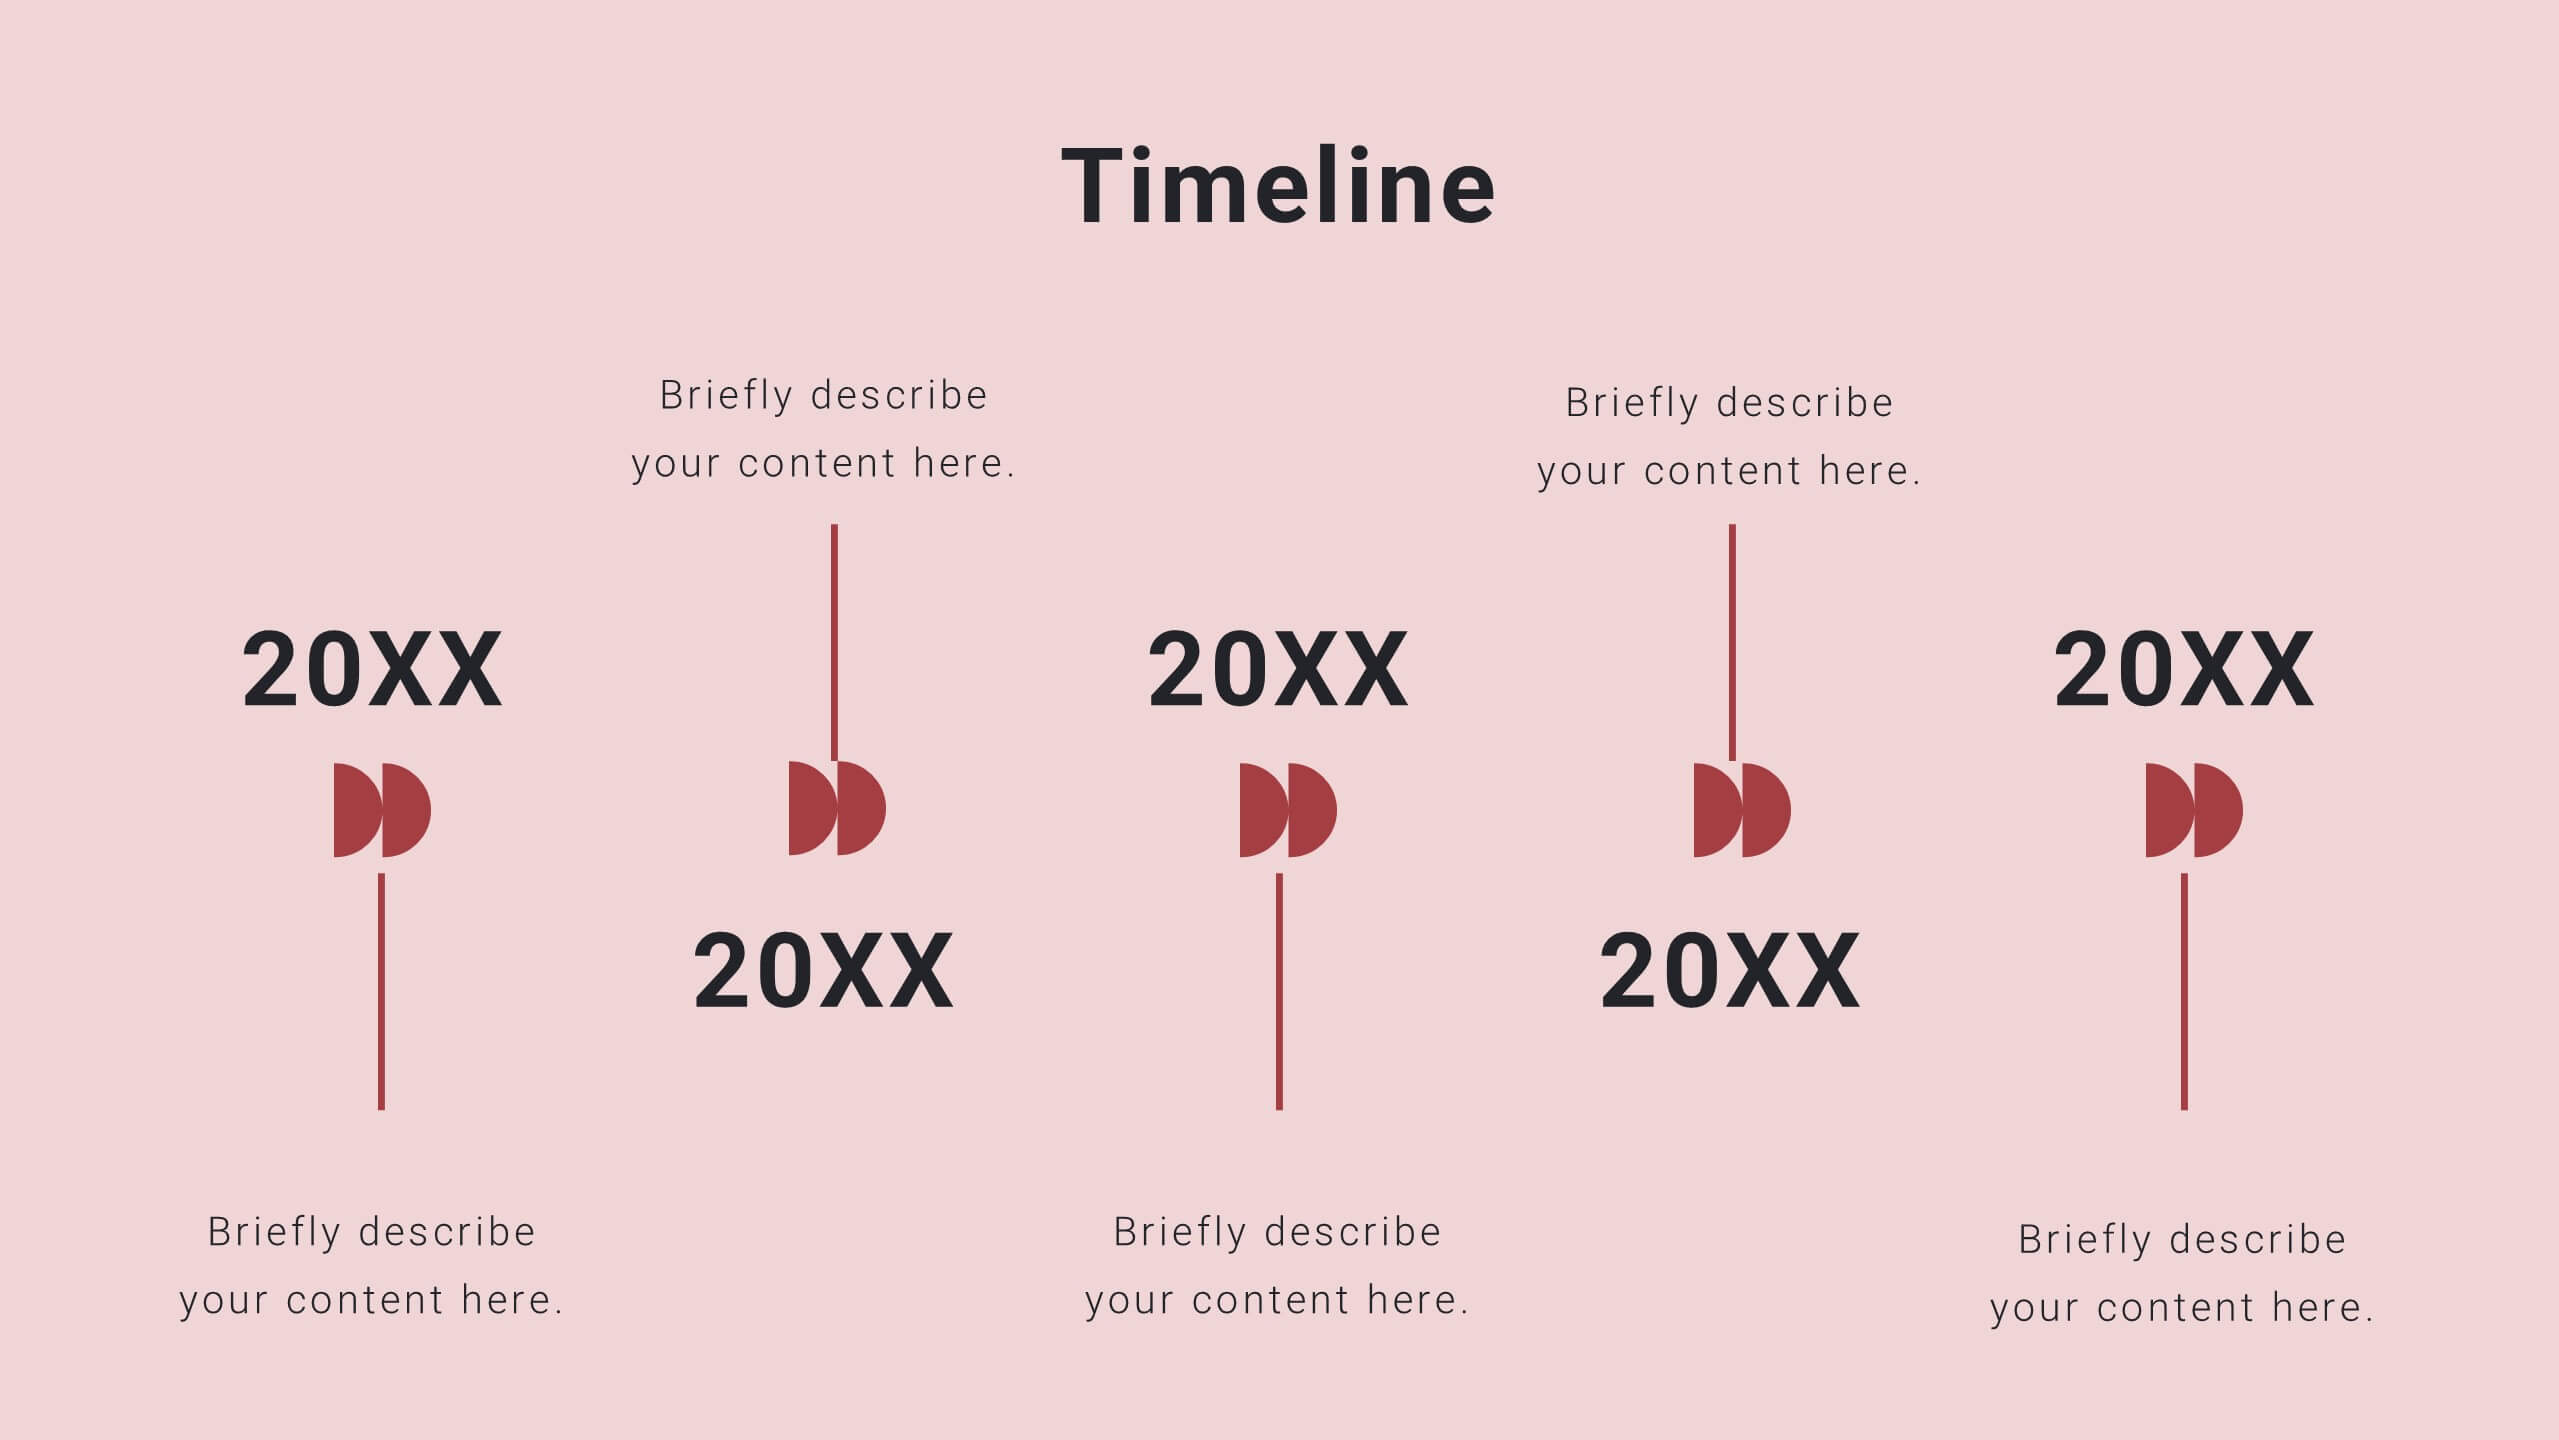
12-Month Business Timeline Presentation
Jump into a year of planning with a crisp, colorful layout that makes every month feel organized and actionable. This presentation helps you map goals, deadlines, and initiatives across all four quarters, offering a clear structure for business planning and progress tracking. Fully compatible with PowerPoint, Keynote, and Google Slides.


4 slides
Data Analytics Heat Map Presentation
Turn complex data into clear insights with this dynamic heat map template! Ideal for visualizing trends, risks, or performance metrics, this design enhances decision-making at a glance. With fully customizable elements, it simplifies data analysis for business, finance, or research. Compatible with PowerPoint, Keynote, and Google Slides for seamless use.


6 slides
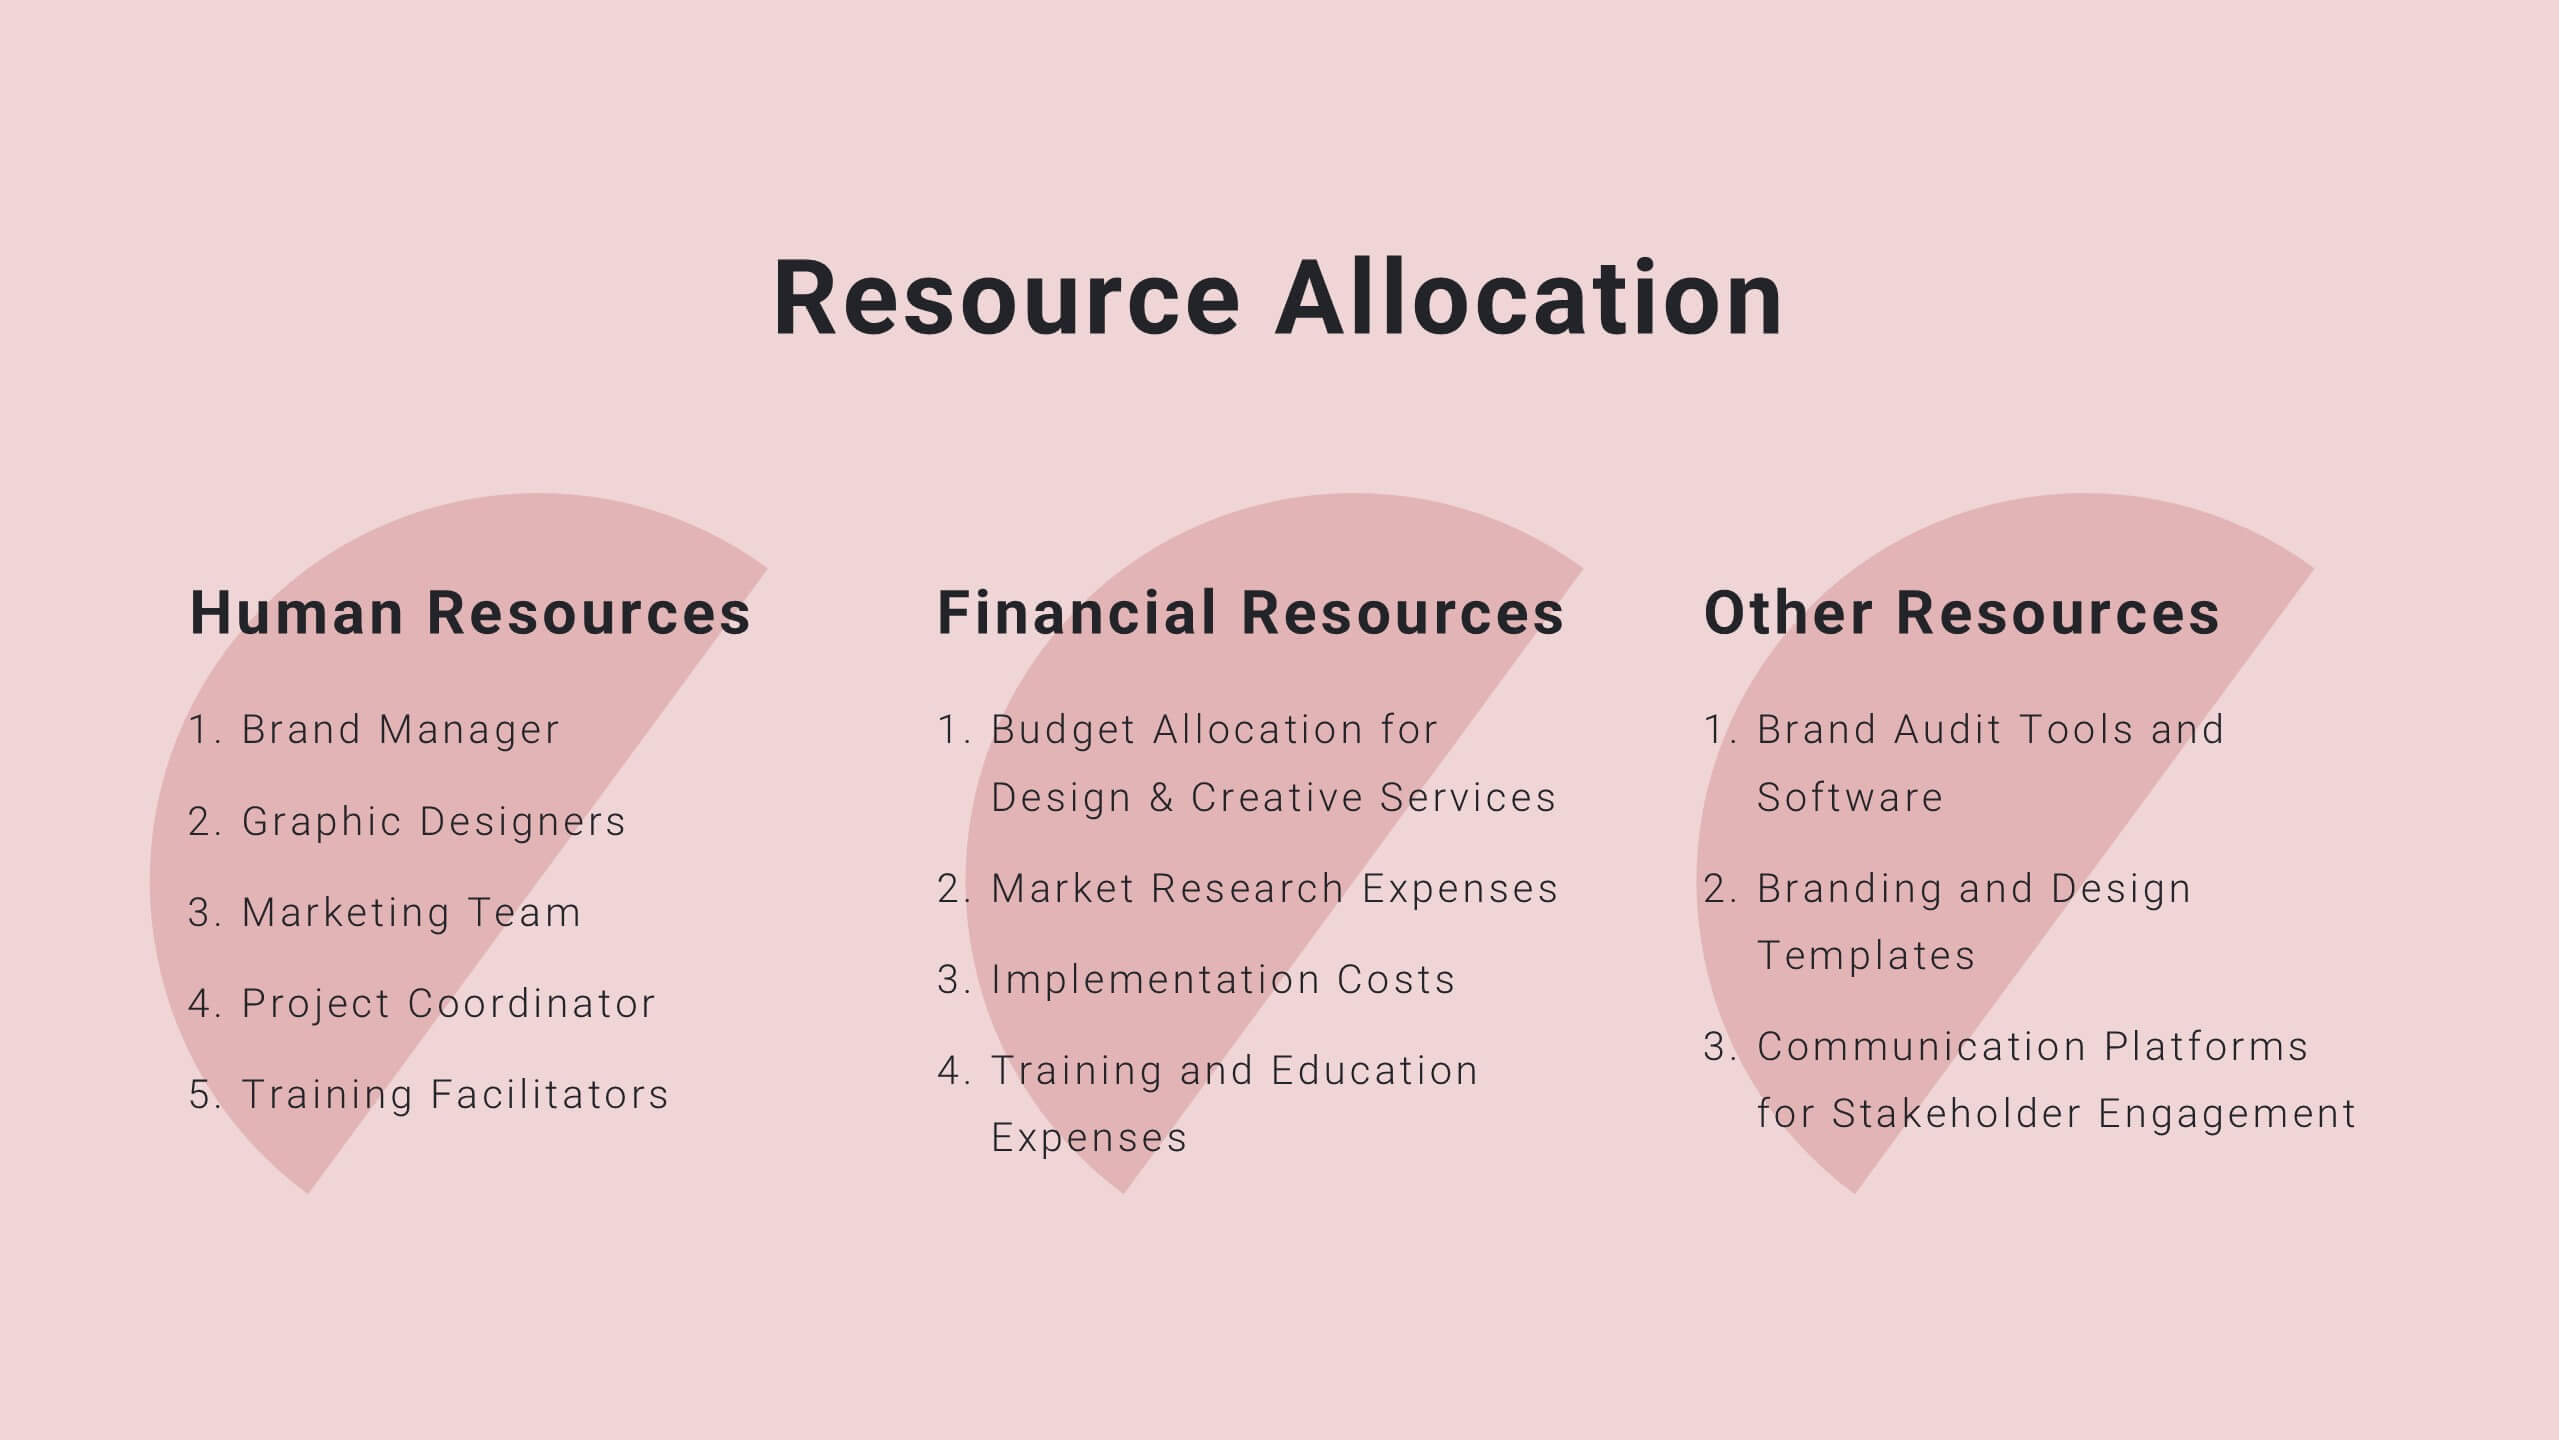
Leadership Vision and Strategy Presentation
Present your organization’s goals with this leadership vision and strategy template, designed with a hierarchy graphic to represent team structure and growth. Perfect for strategic planning, leadership meetings, and corporate presentations. Fully editable in Canva, PowerPoint, or Google Slides, making it easy to customize colors, text, and layout to fit your brand.


7 slides
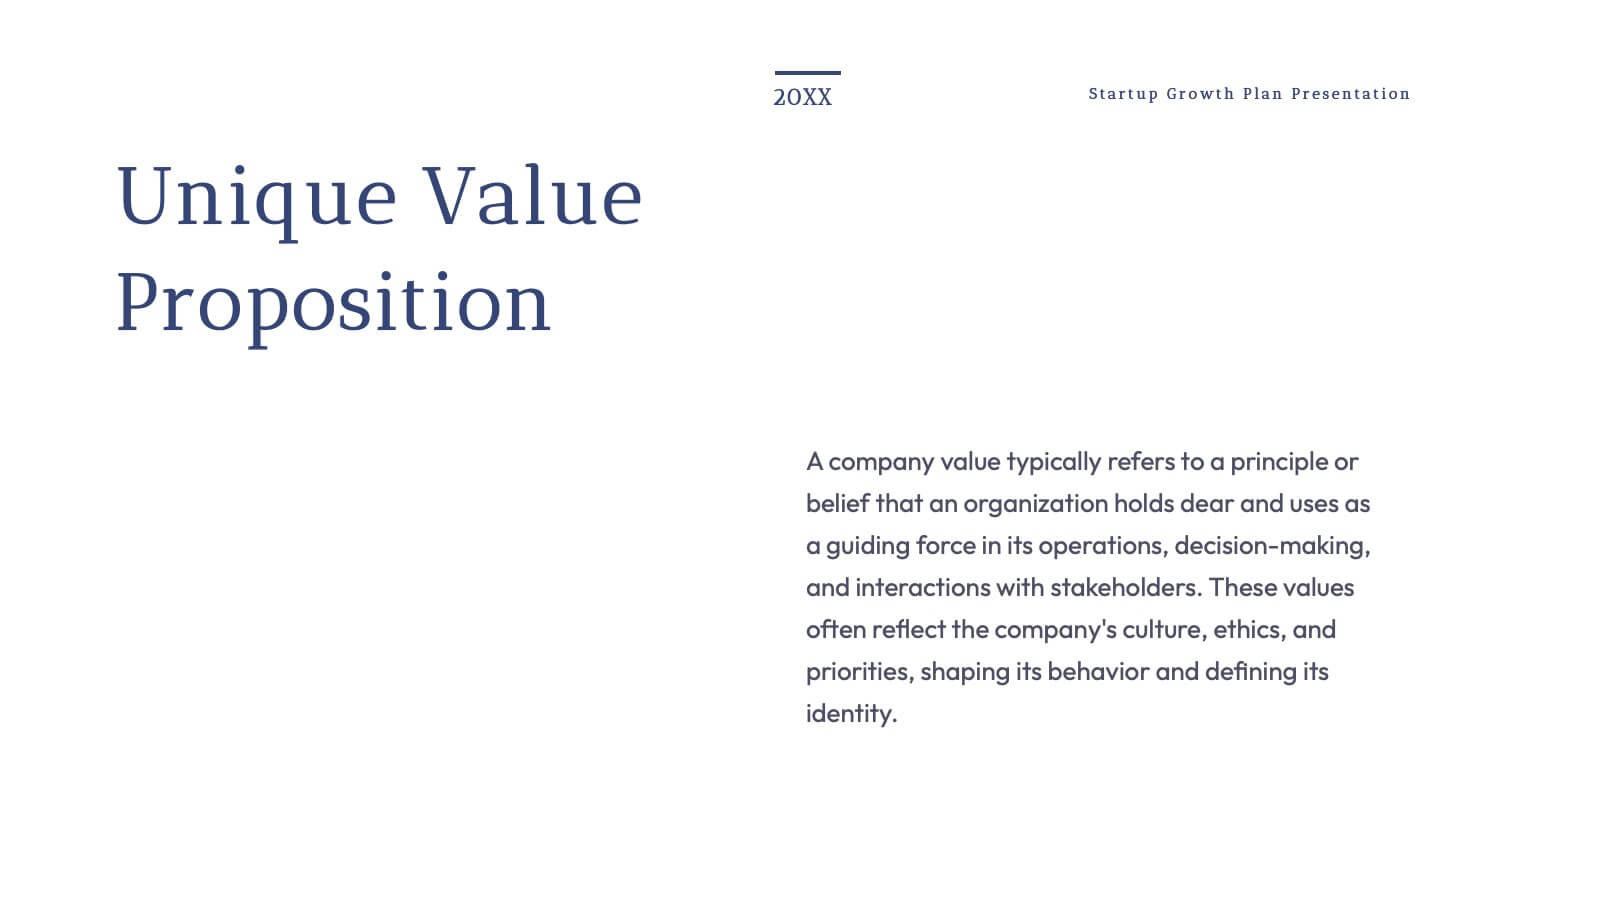
Core Business Values Slide Presentation
Show what your company stands for with a bold, structured layout that highlights the principles driving your success. This presentation is ideal for communicating organizational values, culture, and goals in a professional, visually balanced way. Fully editable and compatible with PowerPoint, Keynote, and Google Slides for easy customization.


5 slides
Overcoming Strategic Business Challenges Presentation
Break down complex obstacles with this step-by-step "Overcoming Strategic Business Challenges" presentation. Featuring a stair-like 3D visual with figures symbolizing progress and setbacks, each slide is divided into four clear milestones. Ideal for showcasing pain points, strategic pivots, or recovery plans. Customize each step with your insights in PowerPoint, Keynote, or Google Slides.


6 slides
Staff Integration and Onboarding Journey Presentation
Streamline your onboarding process with the Staff Integration and Onboarding Journey Presentation. This clean, step-by-step layout uses human icons to represent each phase of a new hire's journey—from orientation to full integration. Ideal for HR professionals, it’s fully editable in Canva, PowerPoint, Keynote, or Google Slides for easy customization.


5 slides
Annual Overview Report Template Presentation
Bring your yearly achievements to life with this sleek and structured layout designed for clarity and impact. Ideal for summarizing company performance, milestones, and future goals, it organizes data into easy-to-follow visuals. Fully editable and compatible with PowerPoint, Keynote, and Google Slides for a smooth presentation experience.


5 slides
Quarterly Action Planning Roadmap Presentation
Stay organized with the Quarterly Action Planning Roadmap Presentation. This clear, grid-based layout is perfect for mapping out priorities, goals, and deliverables across four quarters. Ideal for business planning, team tracking, and strategic reviews. Fully editable in PowerPoint, Keynote, Google Slides, and Canva for flexible customization.


8 slides
30-60-90 Day Business Plan Presentation
Set clear goals and track progress effortlessly with this 30-60-90 day business plan template! Designed for professionals, managers, and entrepreneurs, this structured layout helps outline priorities, set milestones, and ensure a smooth transition from planning to execution. Fully customizable and compatible with PowerPoint, Keynote, and Google Slides for seamless presentations.


21 slides
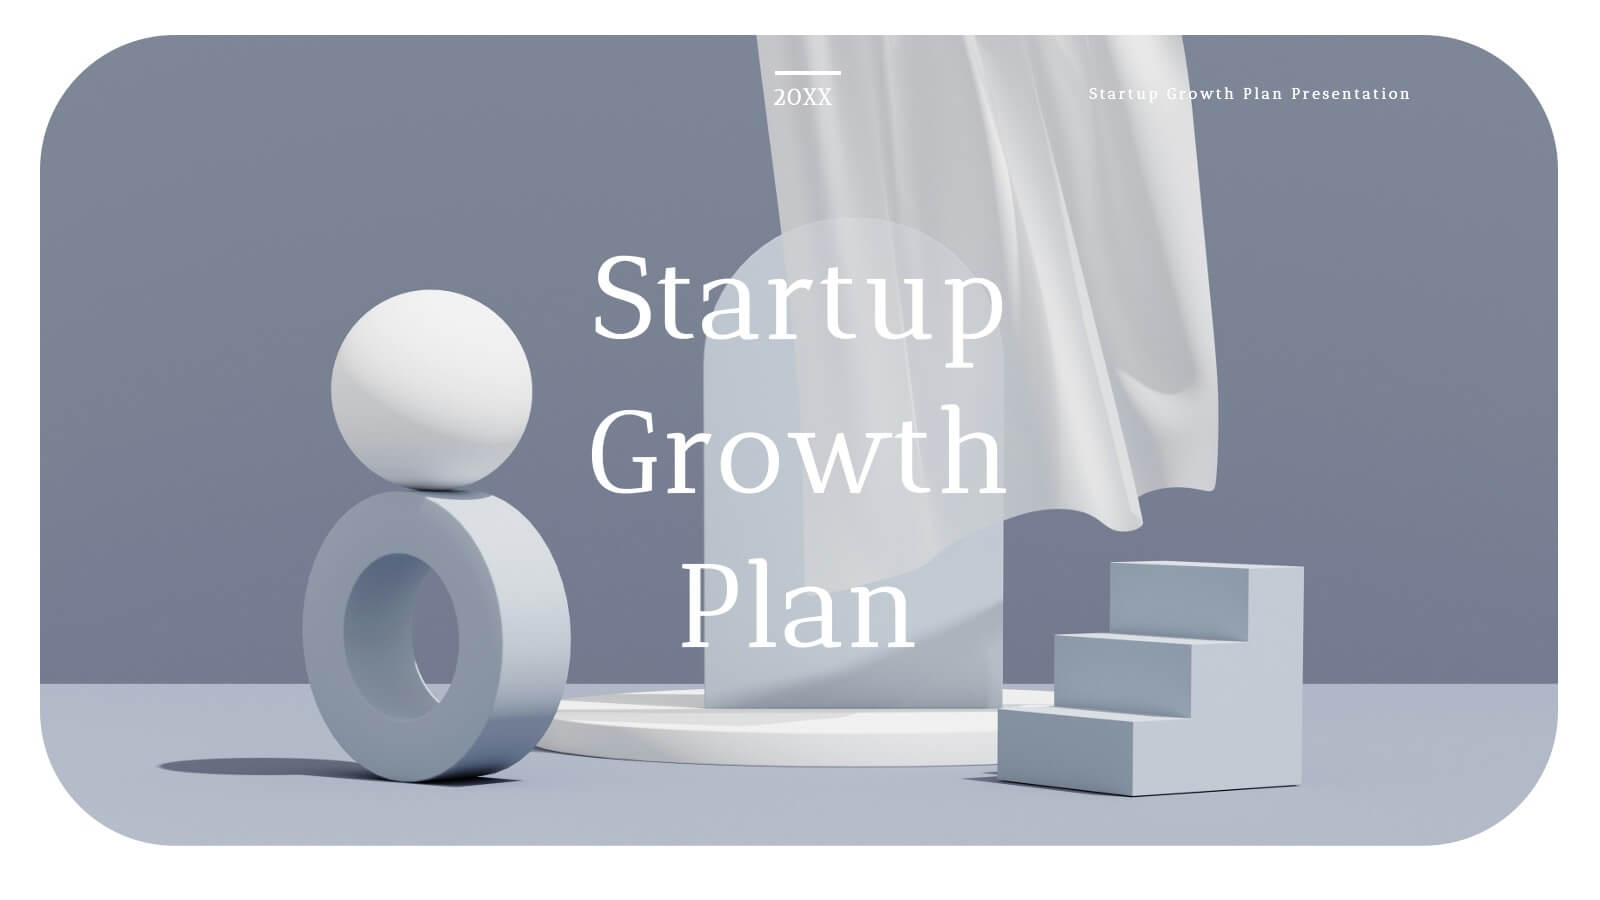
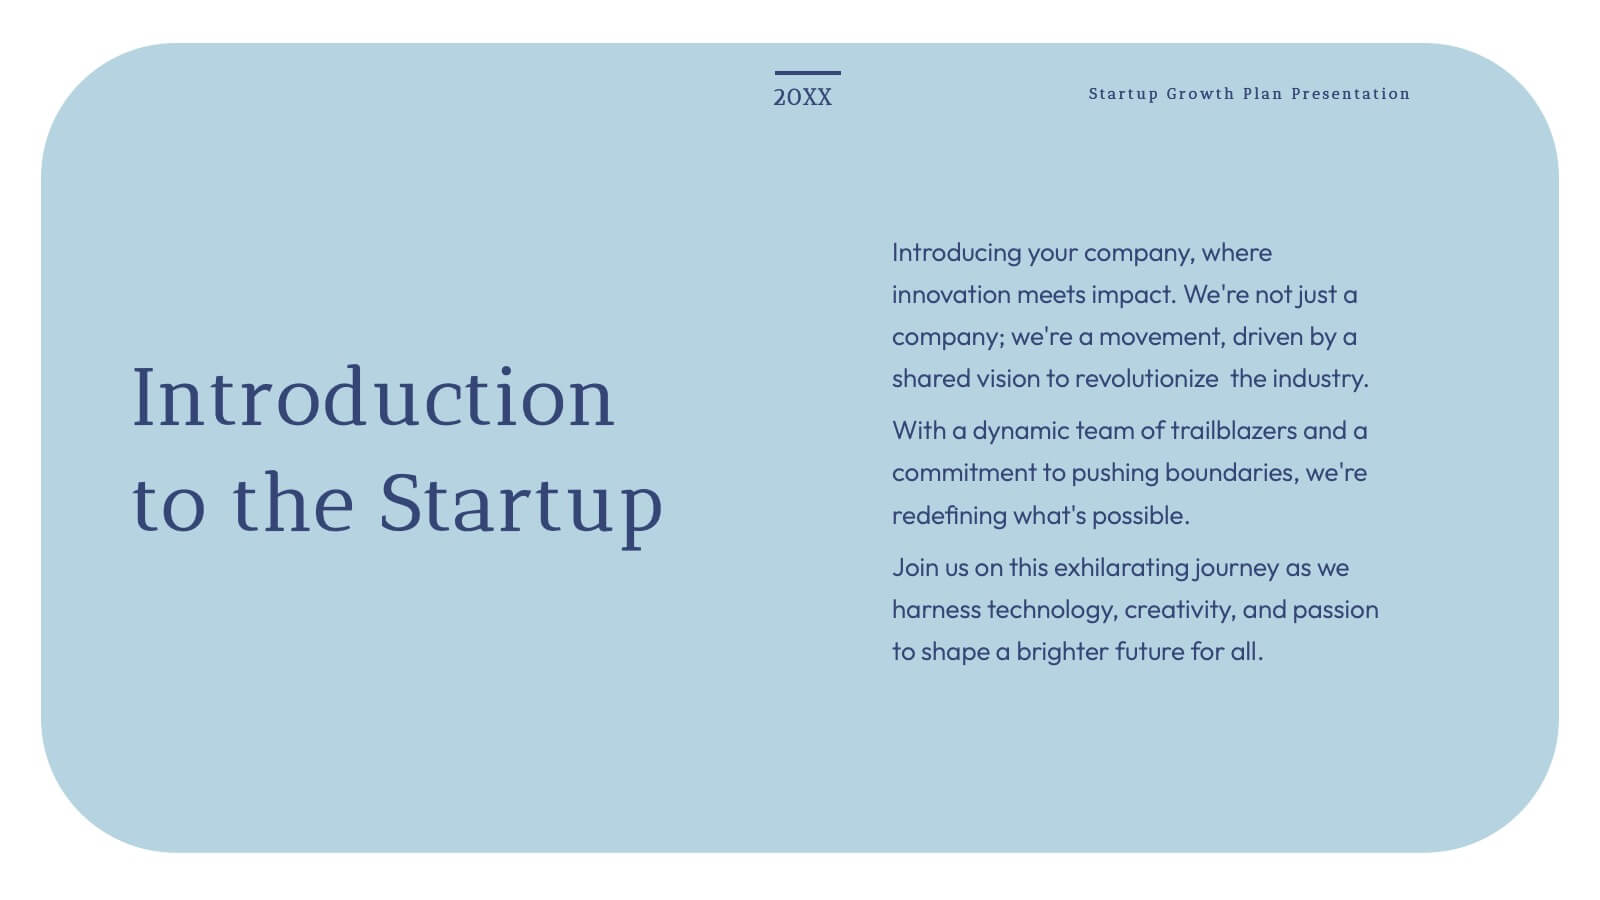
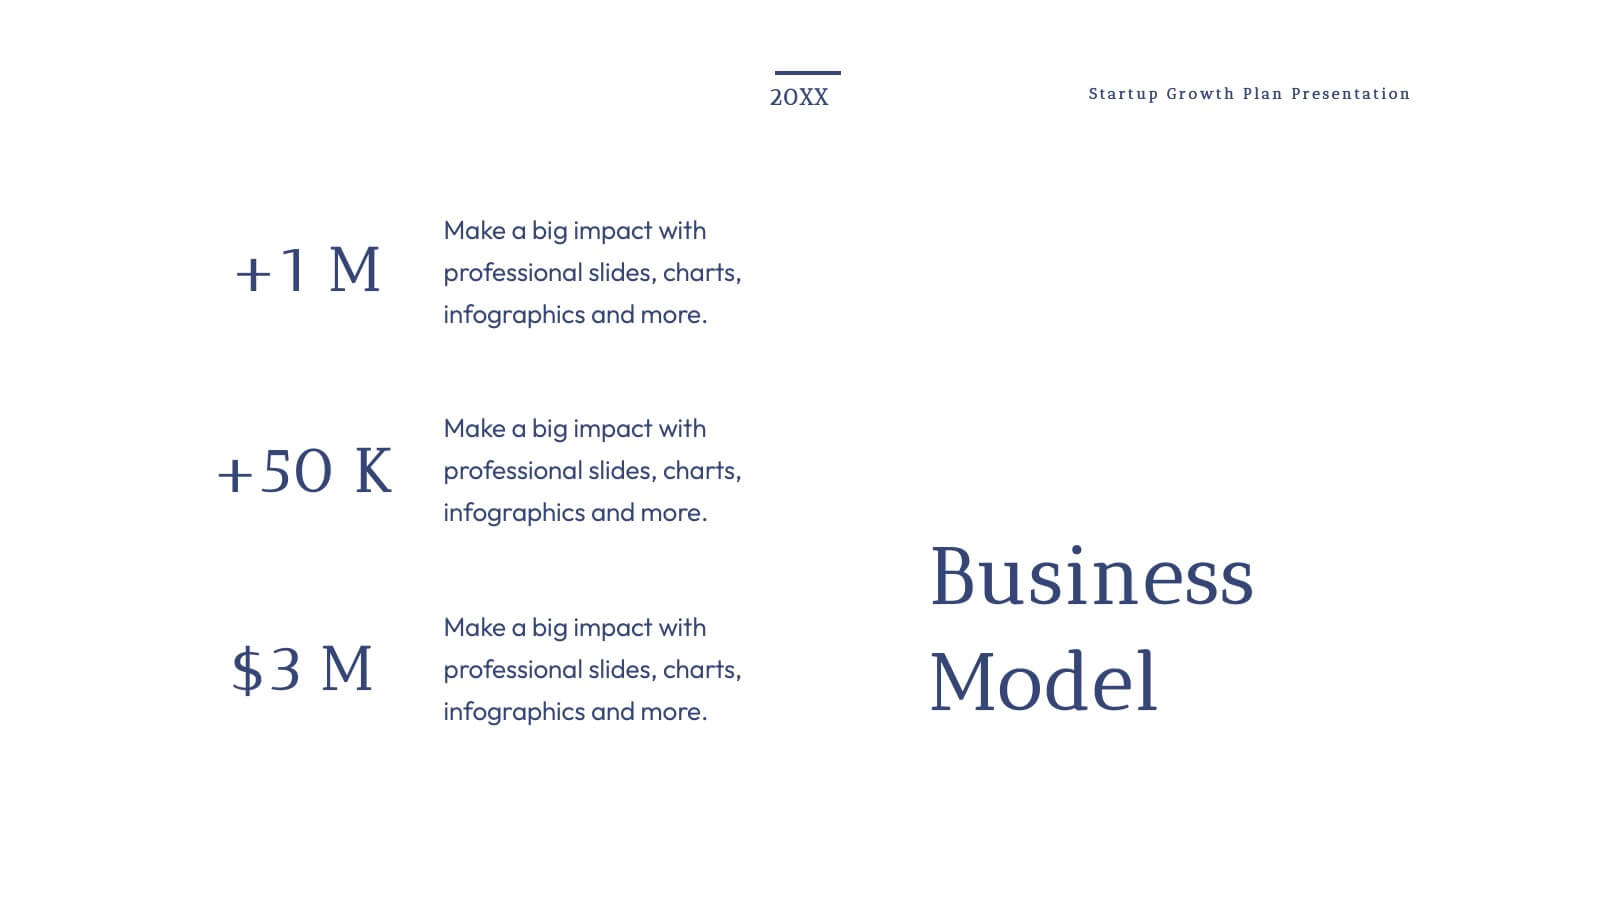
Fluorion Startup Strategy Presentation
Kickstart your business with this modern and professional Startup Strategy Presentation Template. Designed to help entrepreneurs, startups, and business owners present their vision, goals, and strategies effectively. This template includes 21 fully customizable slides covering essential sections such as mission and vision, market analysis, business model, financial overview, and growth plan. Compatible with PowerPoint, Keynote, and Google Slides for seamless editing and presentation.


21 slides
Eldritch Product Roadmap Presentation
The Product Roadmap Presentation Template features 21 modern slides, including product overviews, features, pain points, technical specs, and marketing strategies. Its sleek gray-yellow design ensures professionalism. Perfect for startups or businesses, it’s fully customizable and compatible with PowerPoint, Keynote, and Google Slides, ideal for impactful product-focused presentations.


5 slides
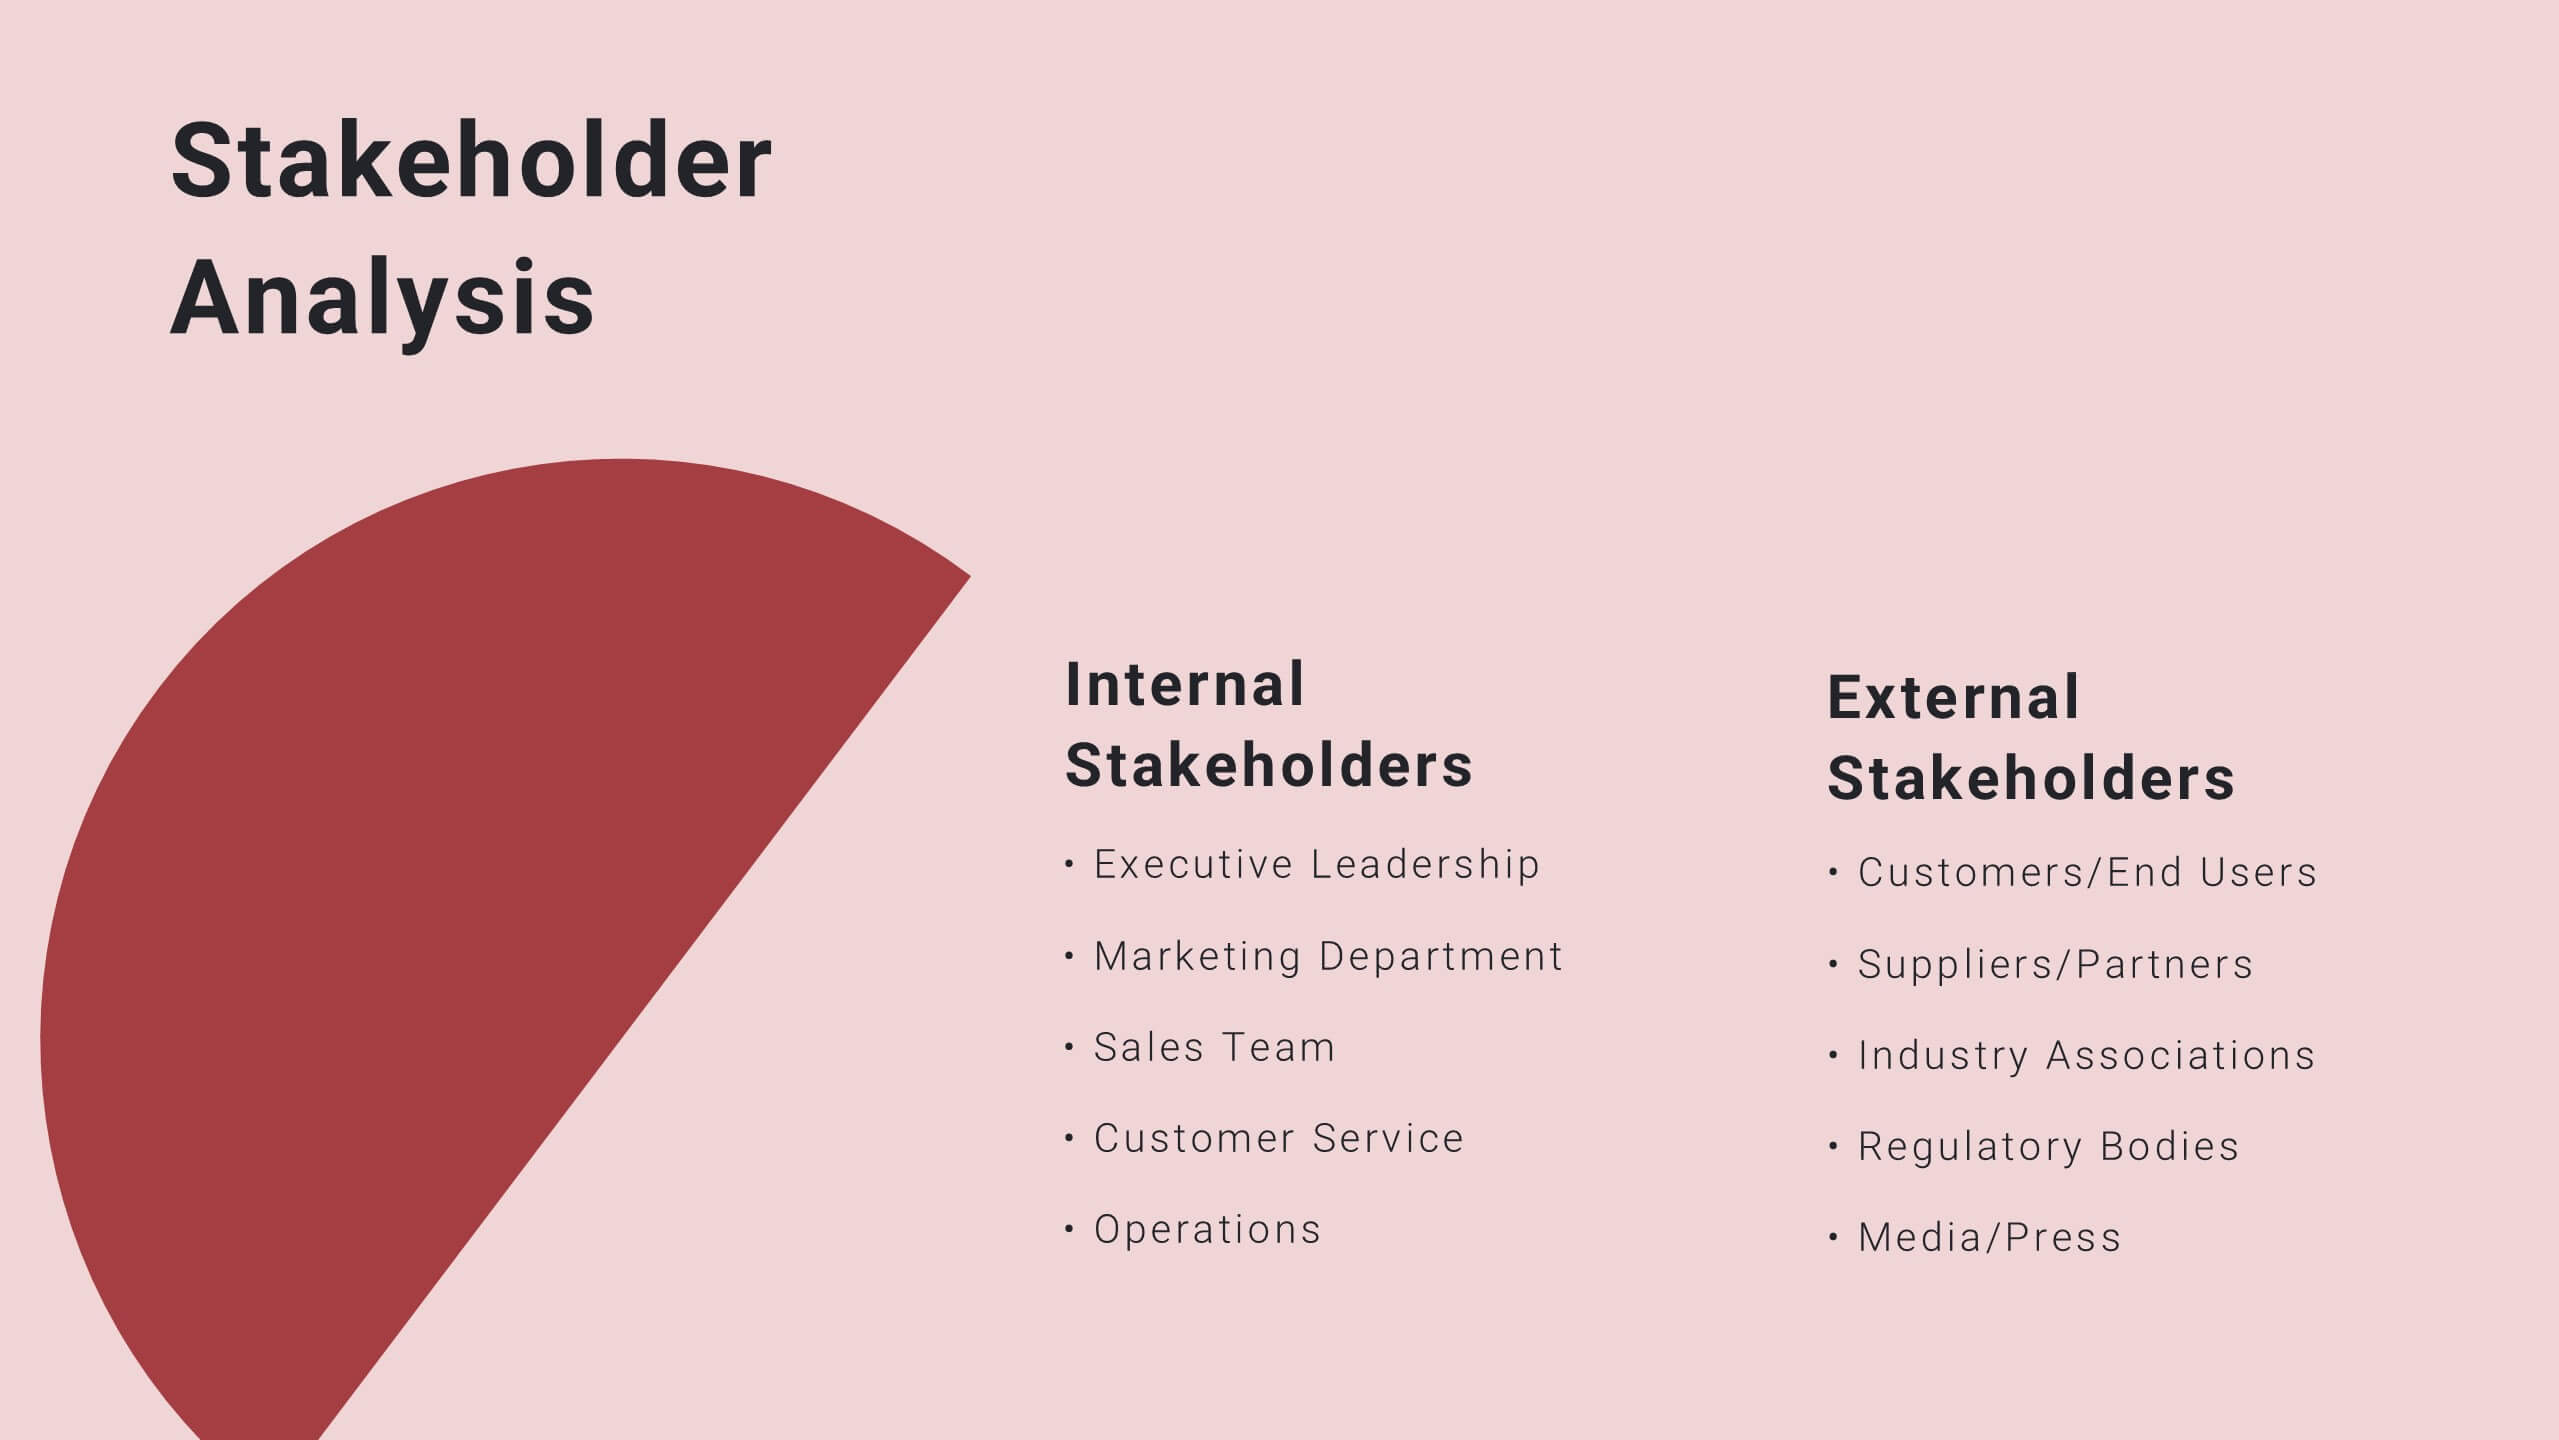
Team Roles and Collaboration Flow Presentation
Visualize how your team works together using the Team Roles and Collaboration Flow Presentation. This slide layout is designed to showcase key roles, responsibilities, and communication paths across sequential stages. Ideal for project managers, HR professionals, and team leads who need to define workflows clearly. Fully customizable in PowerPoint, Keynote, Canva, and Google Slides.


5 slides
Performance Metrics Dashboard Presentation
Turn complex data into clear, engaging visuals with a clean, modern dashboard layout that highlights performance results at a glance. Perfect for tracking KPIs, progress, and team outcomes, this template brings structure and clarity to reports. Easily editable in PowerPoint, Keynote, and Google Slides for professional presentations.