


Features
- 4 Unique slides
- Fully editable and easy to edit in Microsoft Powerpoint, Keynote and Google Slides
- 16:9 widescreen layout
- Clean and professional designs
- Export to JPG, PDF or send by email


Do you have any questions?
Recommend


6 slides
WFH Tools and Productivity Tips
Level up your work-from-home game with this modern visual wheel that breaks down essential tools and actionable tips to boost productivity. Perfect for remote teams, solo entrepreneurs, or virtual training sessions, this layout keeps key info easy to digest and visually engaging. Fully compatible with PowerPoint, Keynote, and Google Slides.


7 slides
Artificial Intelligence Uses Infographic
Artificial Intelligence (AI) is no longer just a concept of sci-fi narratives but an integral part of our daily lives. Our compelling infographic, set against a clean white backdrop with contrasting hues of blue, provides a captivating look into the myriad uses of AI. From healthcare innovations to smart home solutions, our visually engaging template breaks down complex AI applications into digestible information bites. Ideal for educators, tech enthusiasts, and businesses, it's a versatile tool designed for multiple presentation platforms, including PowerPoint, Keynote, and Google Slides.


4 slides
Task Delegation via RACI Model
Simplify task delegation and boost accountability with this clean RACI-based layout—perfect for clarifying roles and responsibilities across teams. Whether you're planning a project or tracking execution, this slide makes it easy to map who’s in charge, consulted, or informed. Fully compatible with PowerPoint, Keynote, and Google Slides.


10 slides
Project Responsibility Chart Presentation
Streamline your project management with our Project Responsibility Chart template. Designed to clarify roles and tasks across your team, this color-coded chart ensures transparency and efficiency. Ideal for project leads to assign duties clearly and effectively. The template supports PowerPoint, Keynote, and Google Slides, making it versatile for any team environment.


5 slides
Search Engine Ranking Presentation
The Search Engine Ranking Presentation template is designed to clearly communicate strategies for improving search engine optimization (SEO). This template visually outlines key concepts in SEO such as enhancing site visibility, optimizing content, reducing bounce rates, and improving branding through intuitive graphical elements and concise bullet points. Each section of the template focuses on a specific aspect of SEO strategy, such as "Improved," "Reduce," "Increase," and "Branding," making it an invaluable tool for marketers looking to present actionable insights. This presentation is perfect for SEO specialists, digital marketers, and content managers aiming to educate teams or clients on the intricacies of boosting online presence effectively.

20 slides
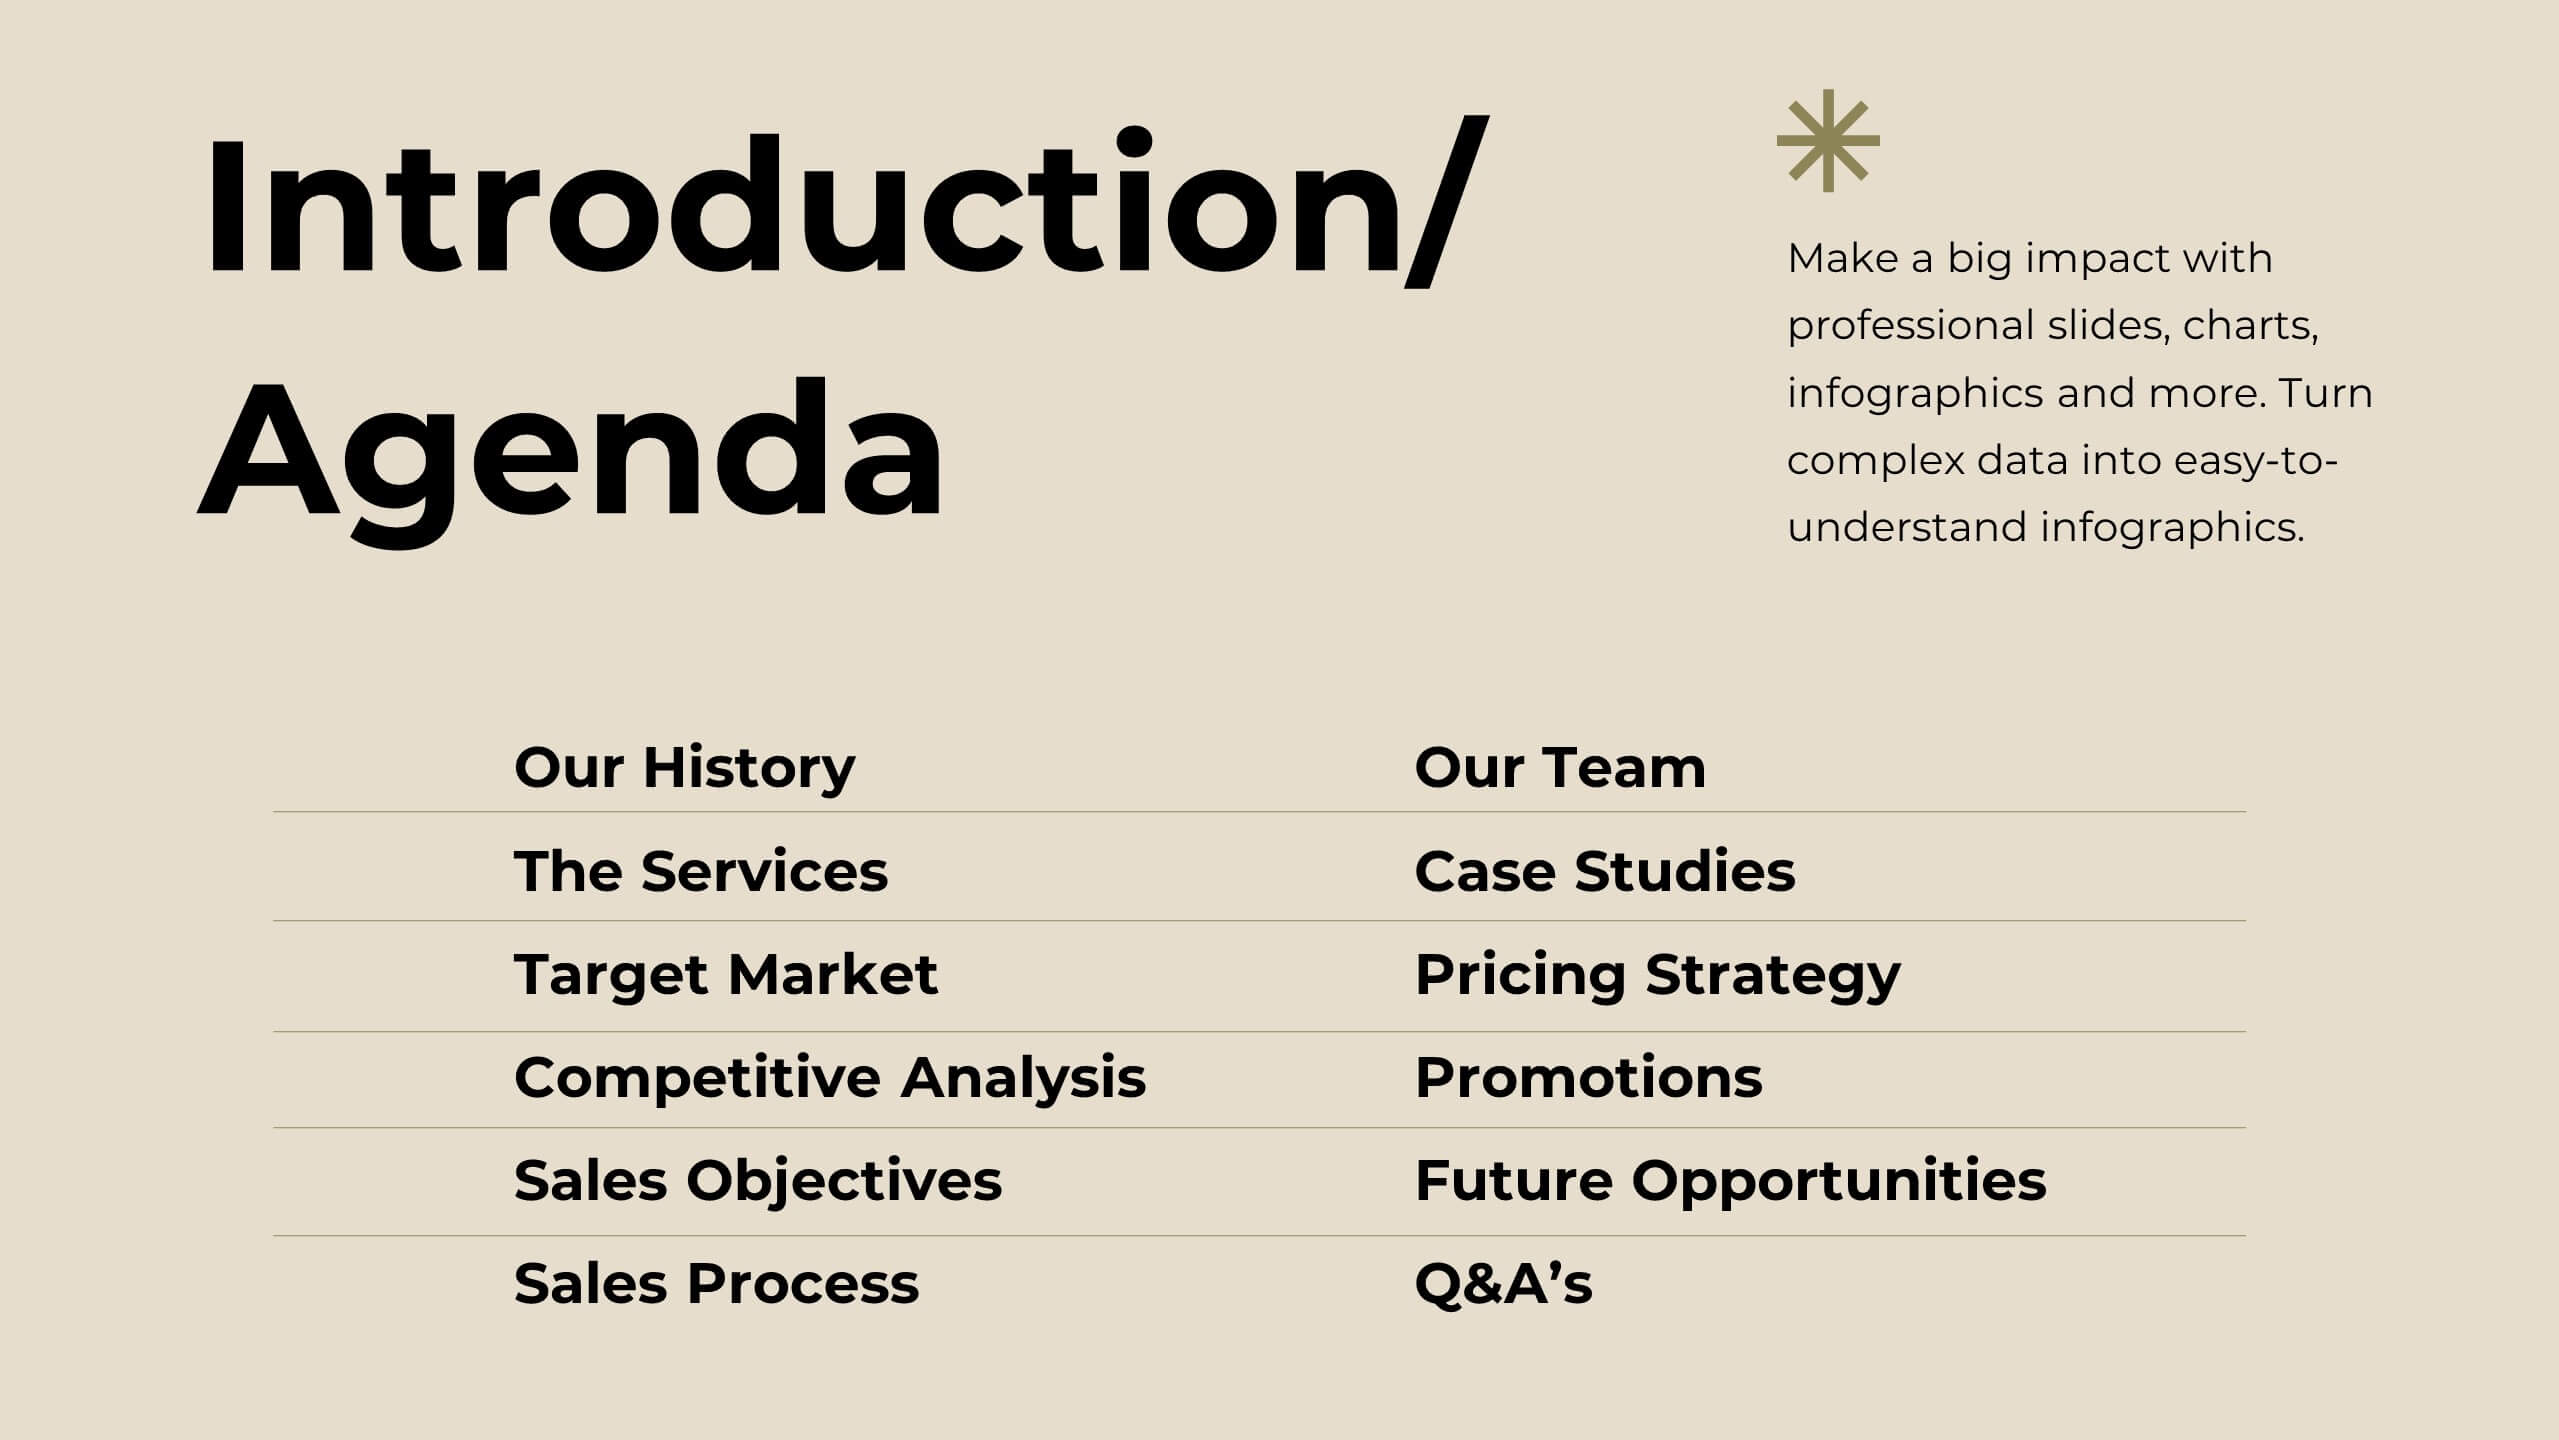
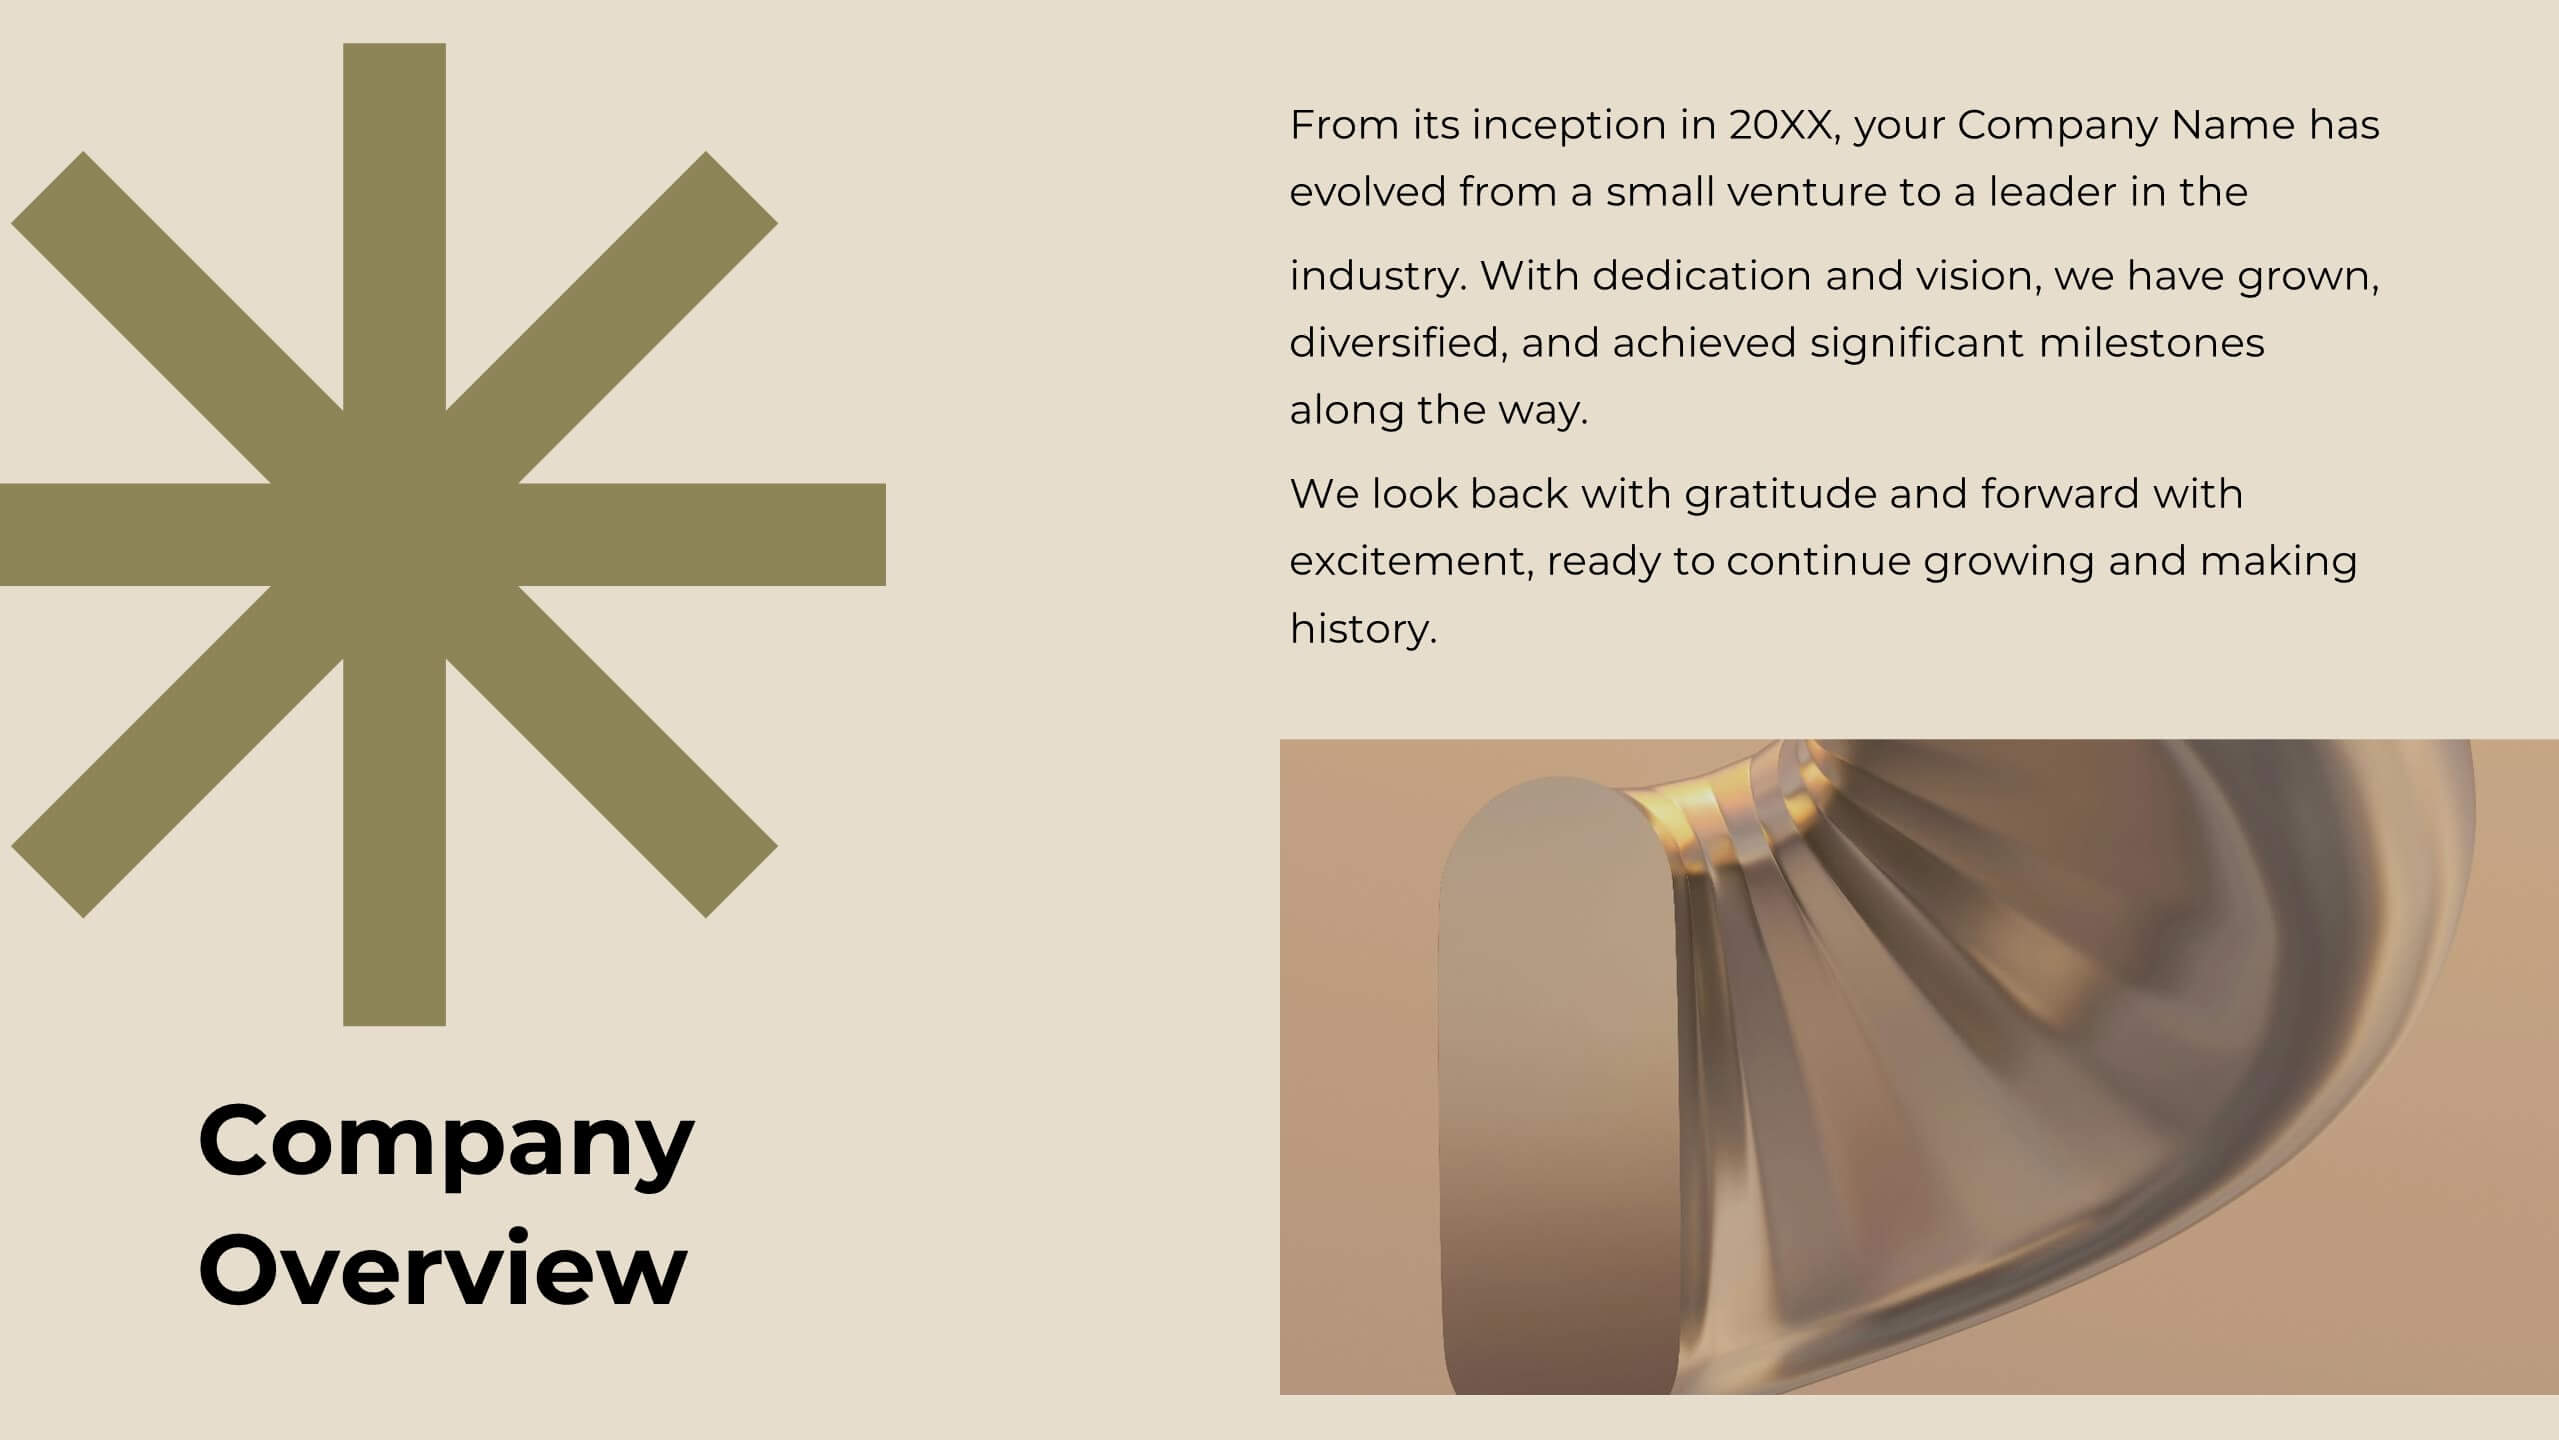
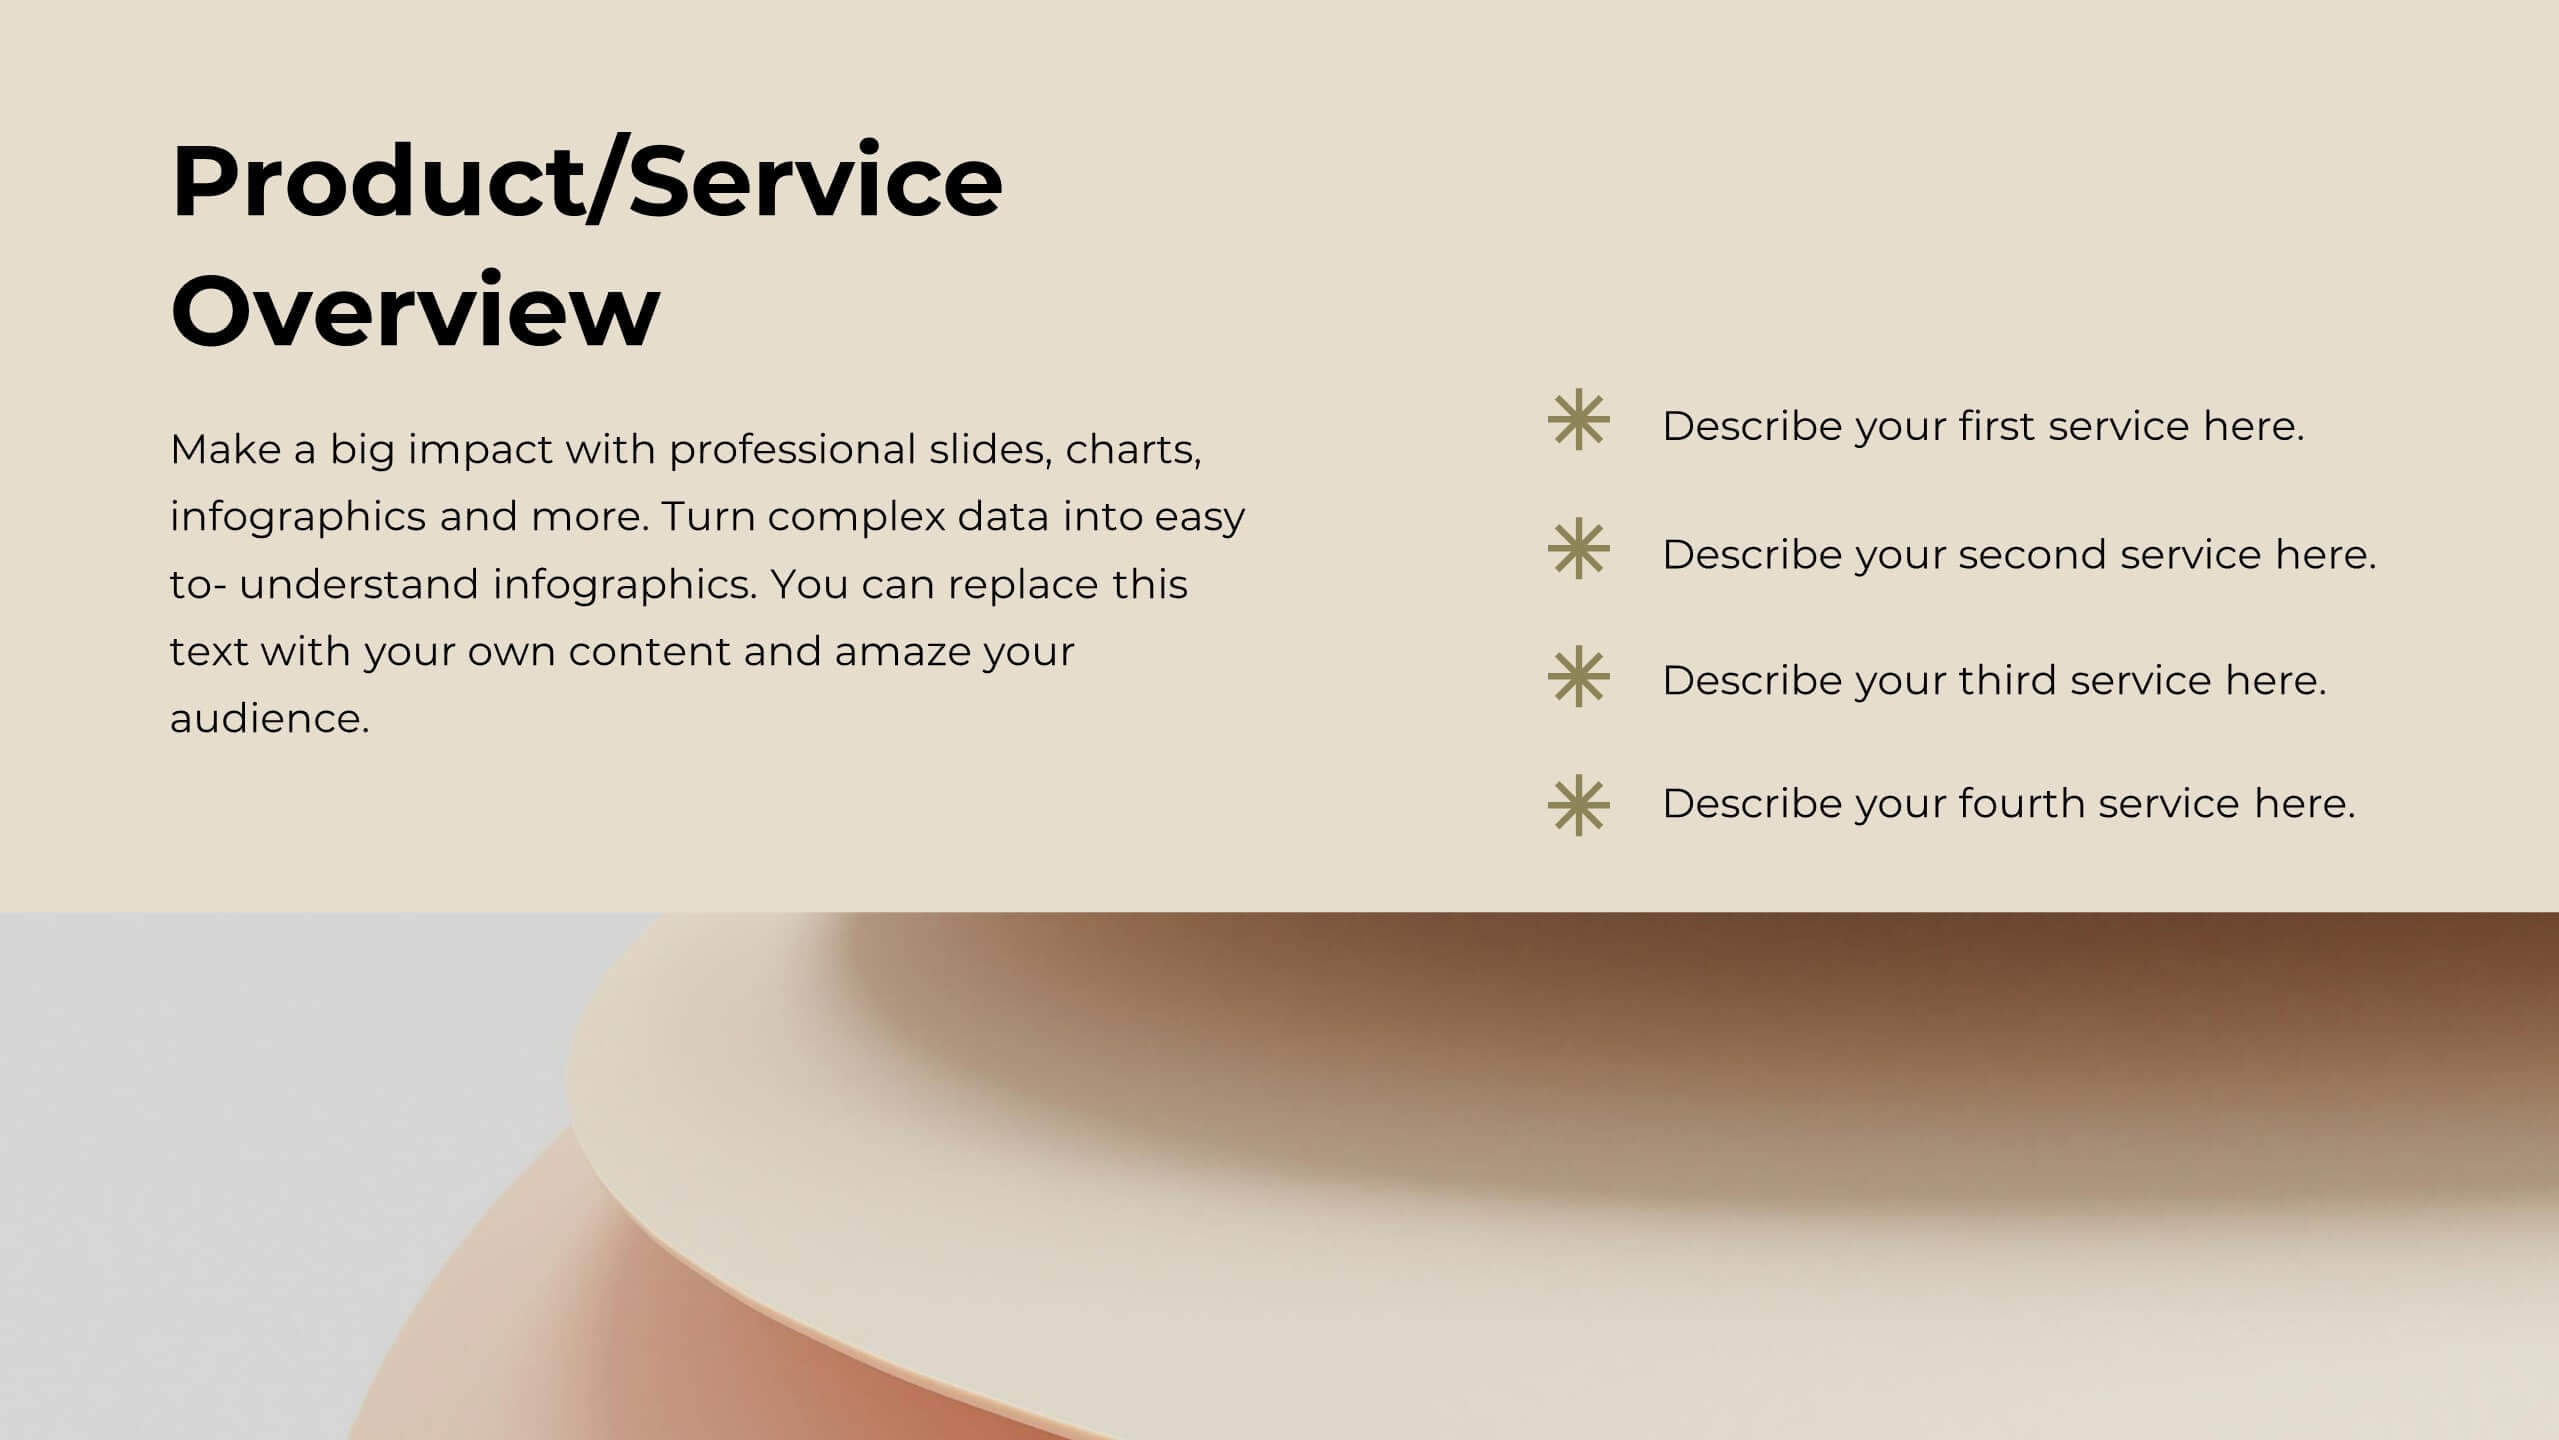
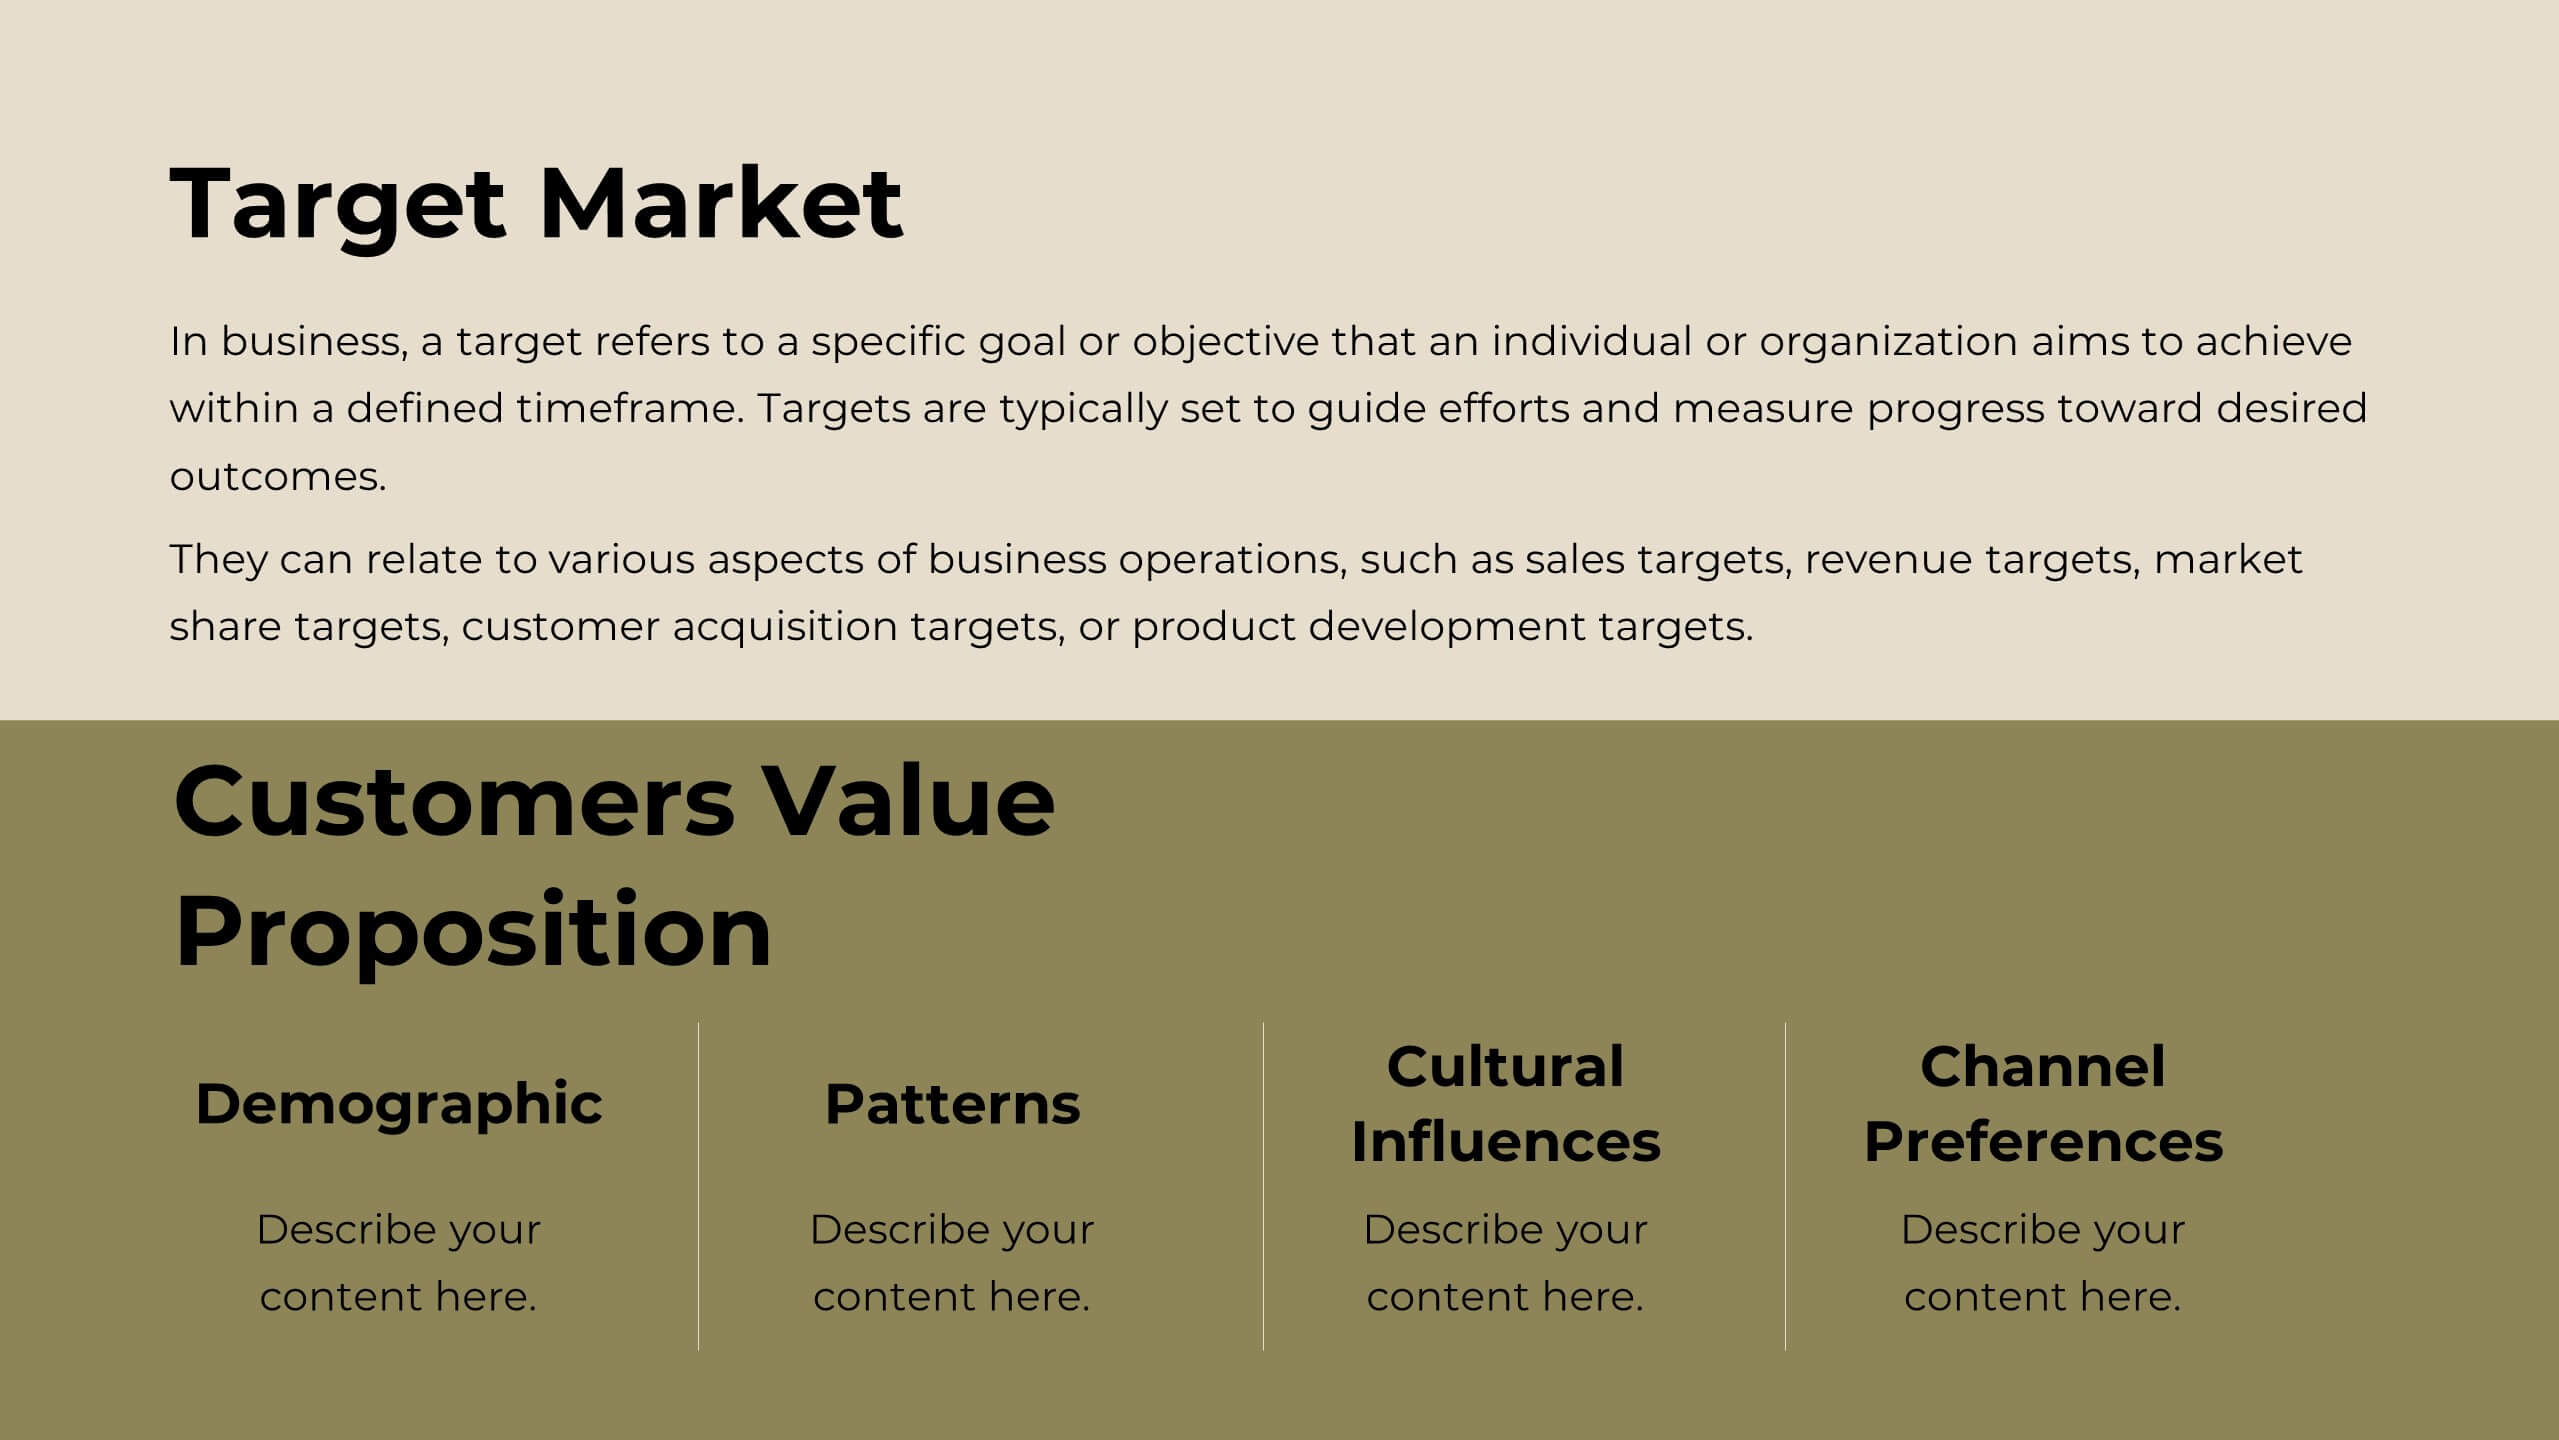
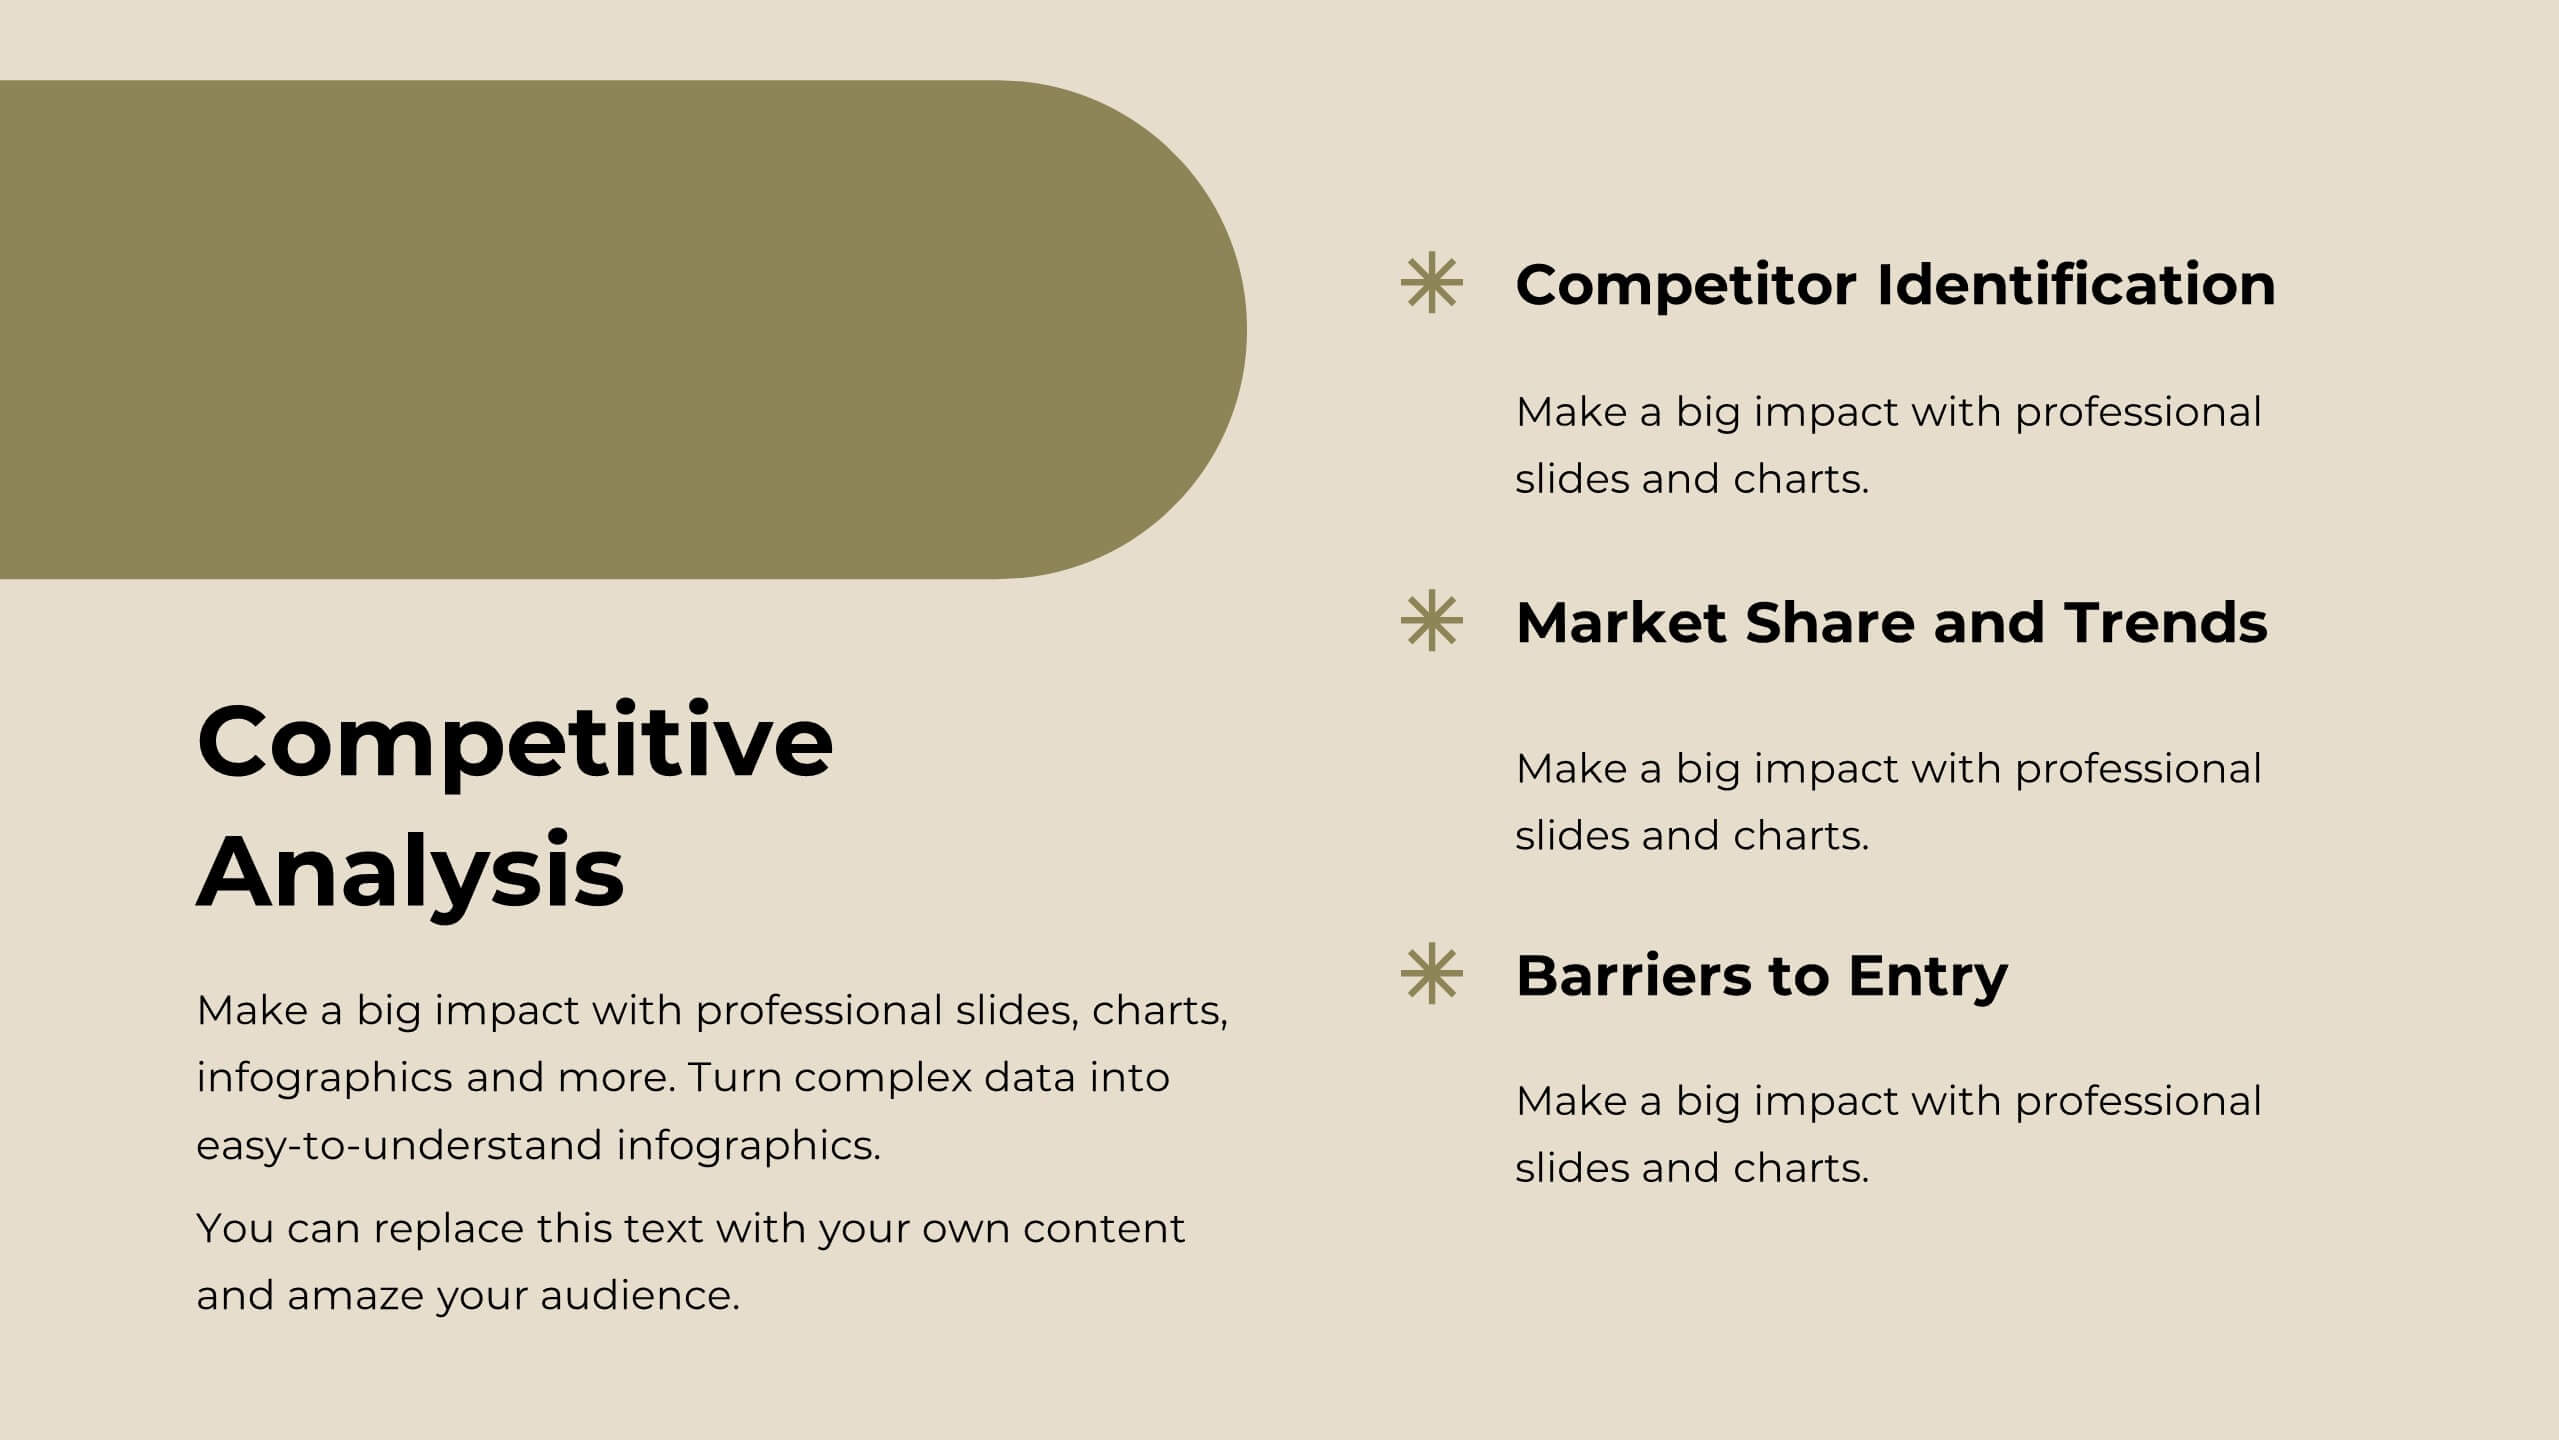
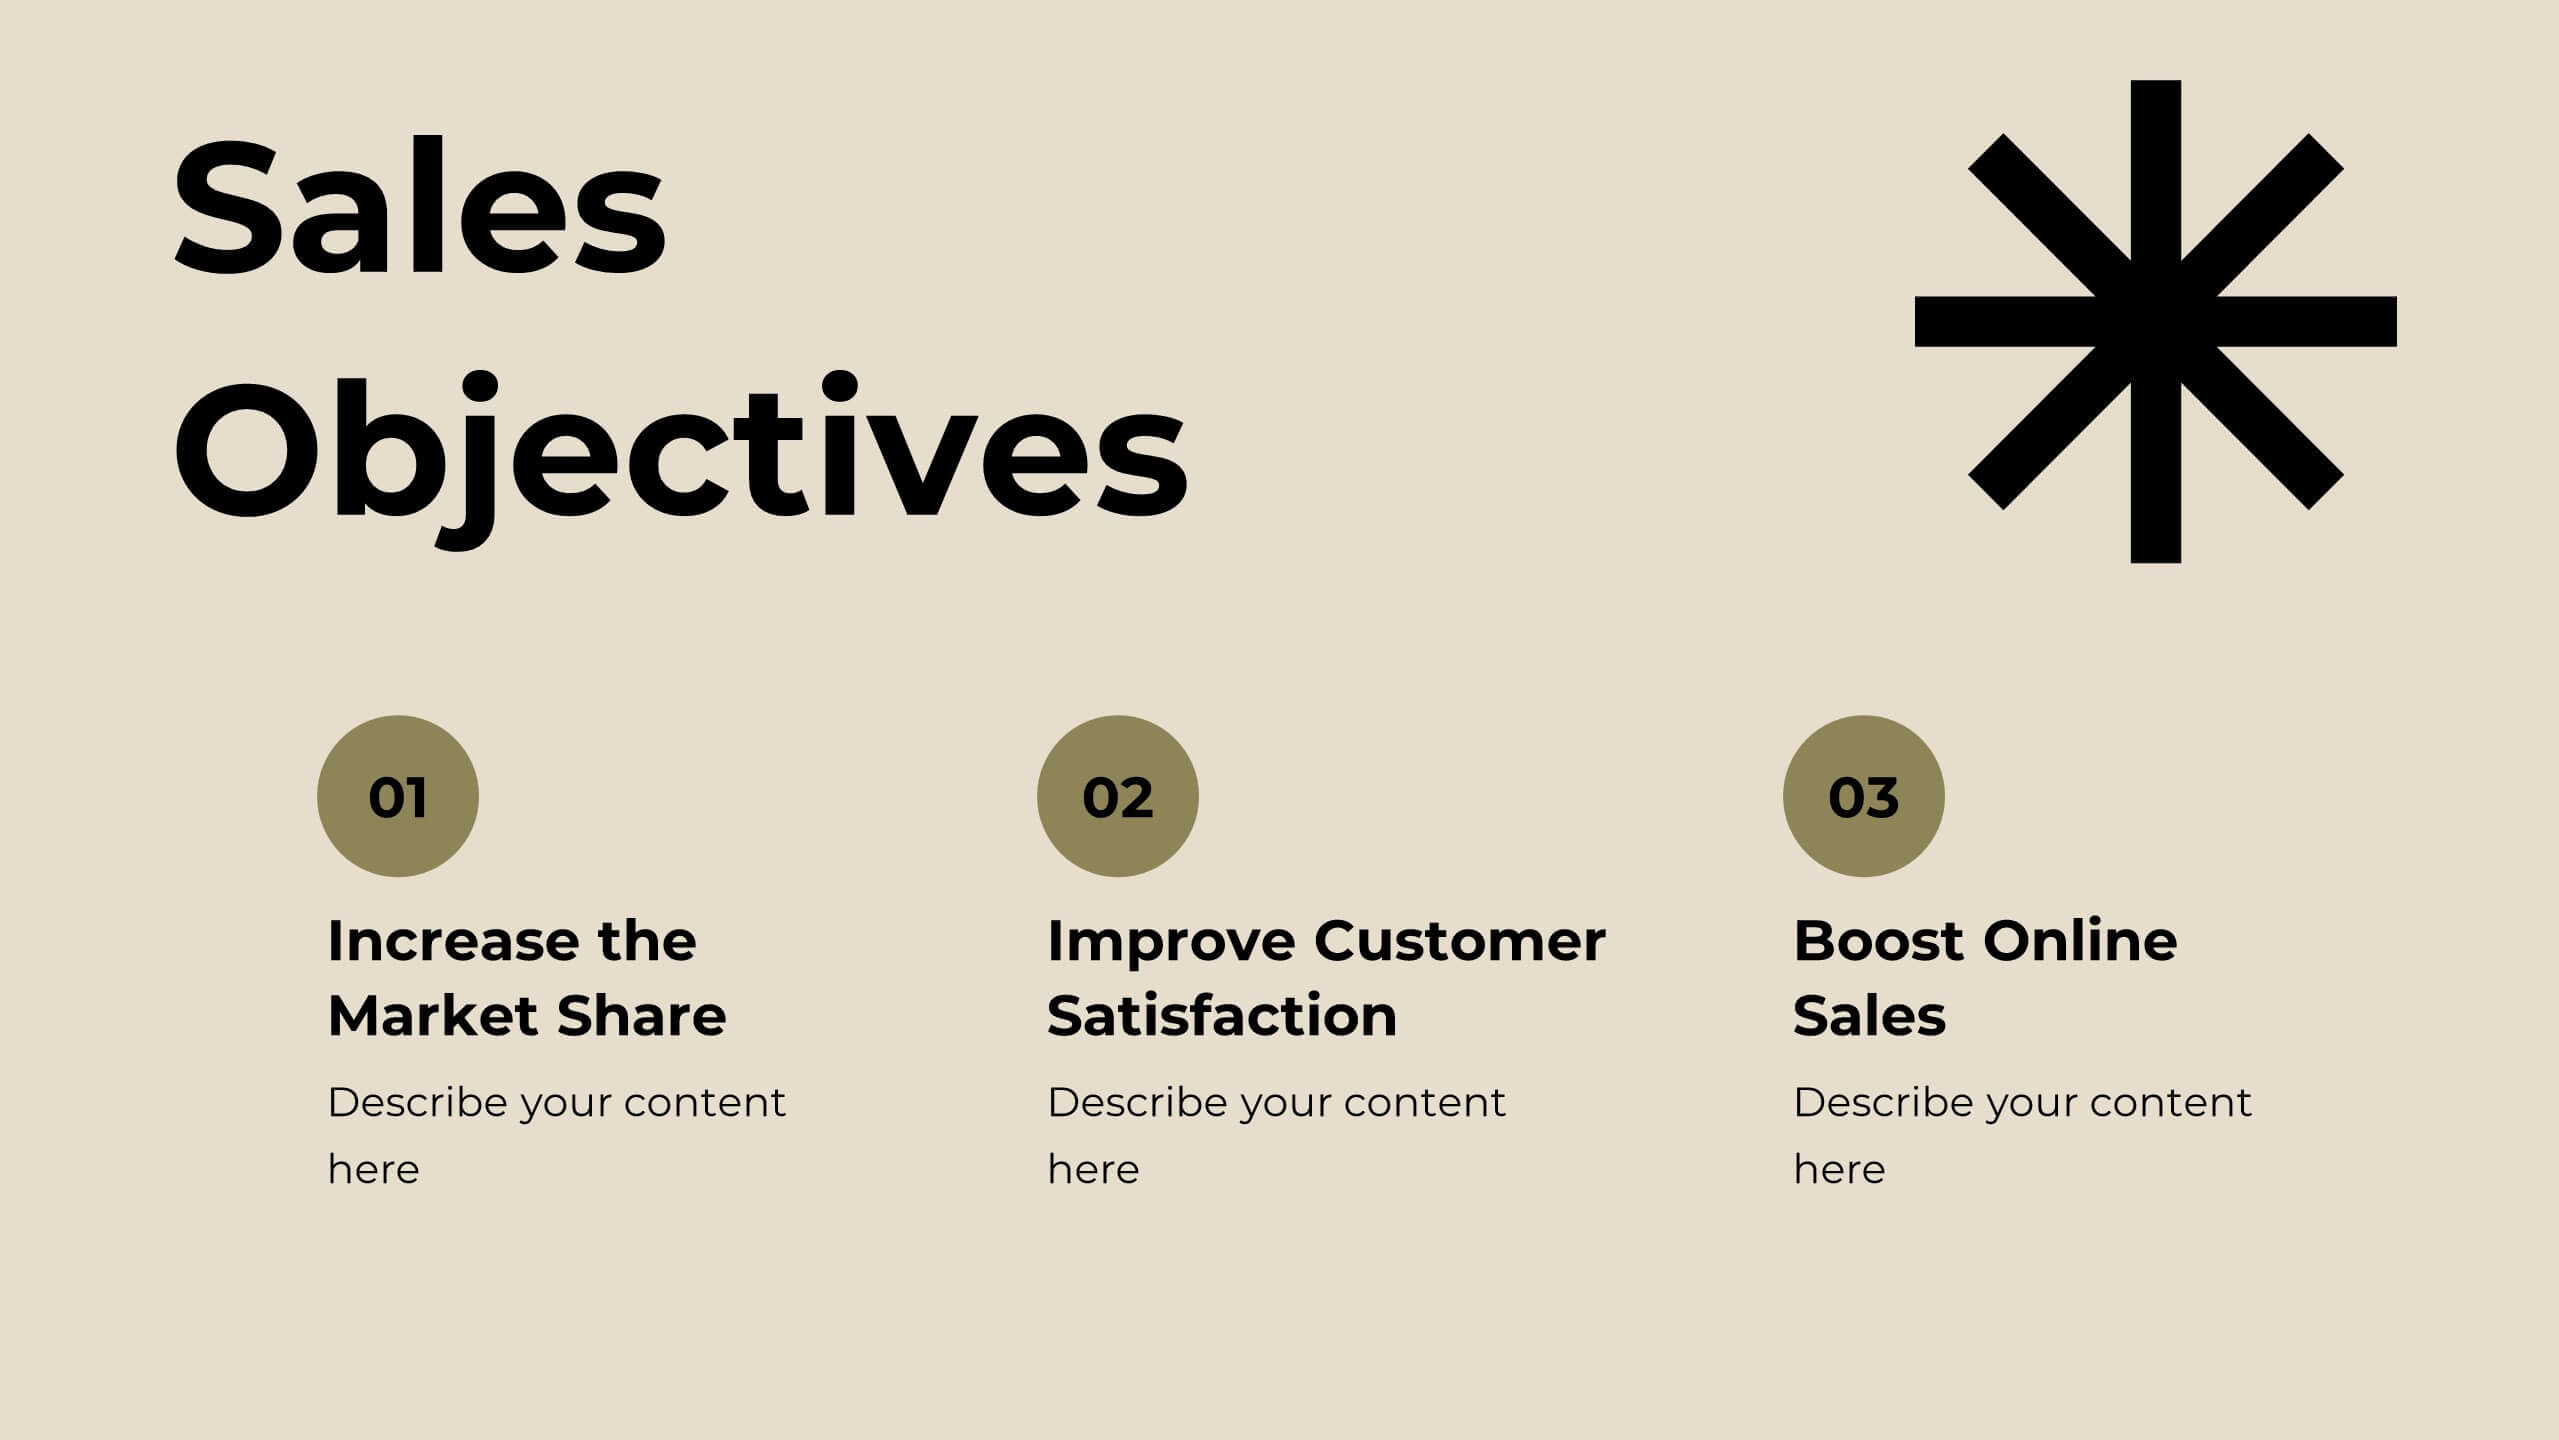
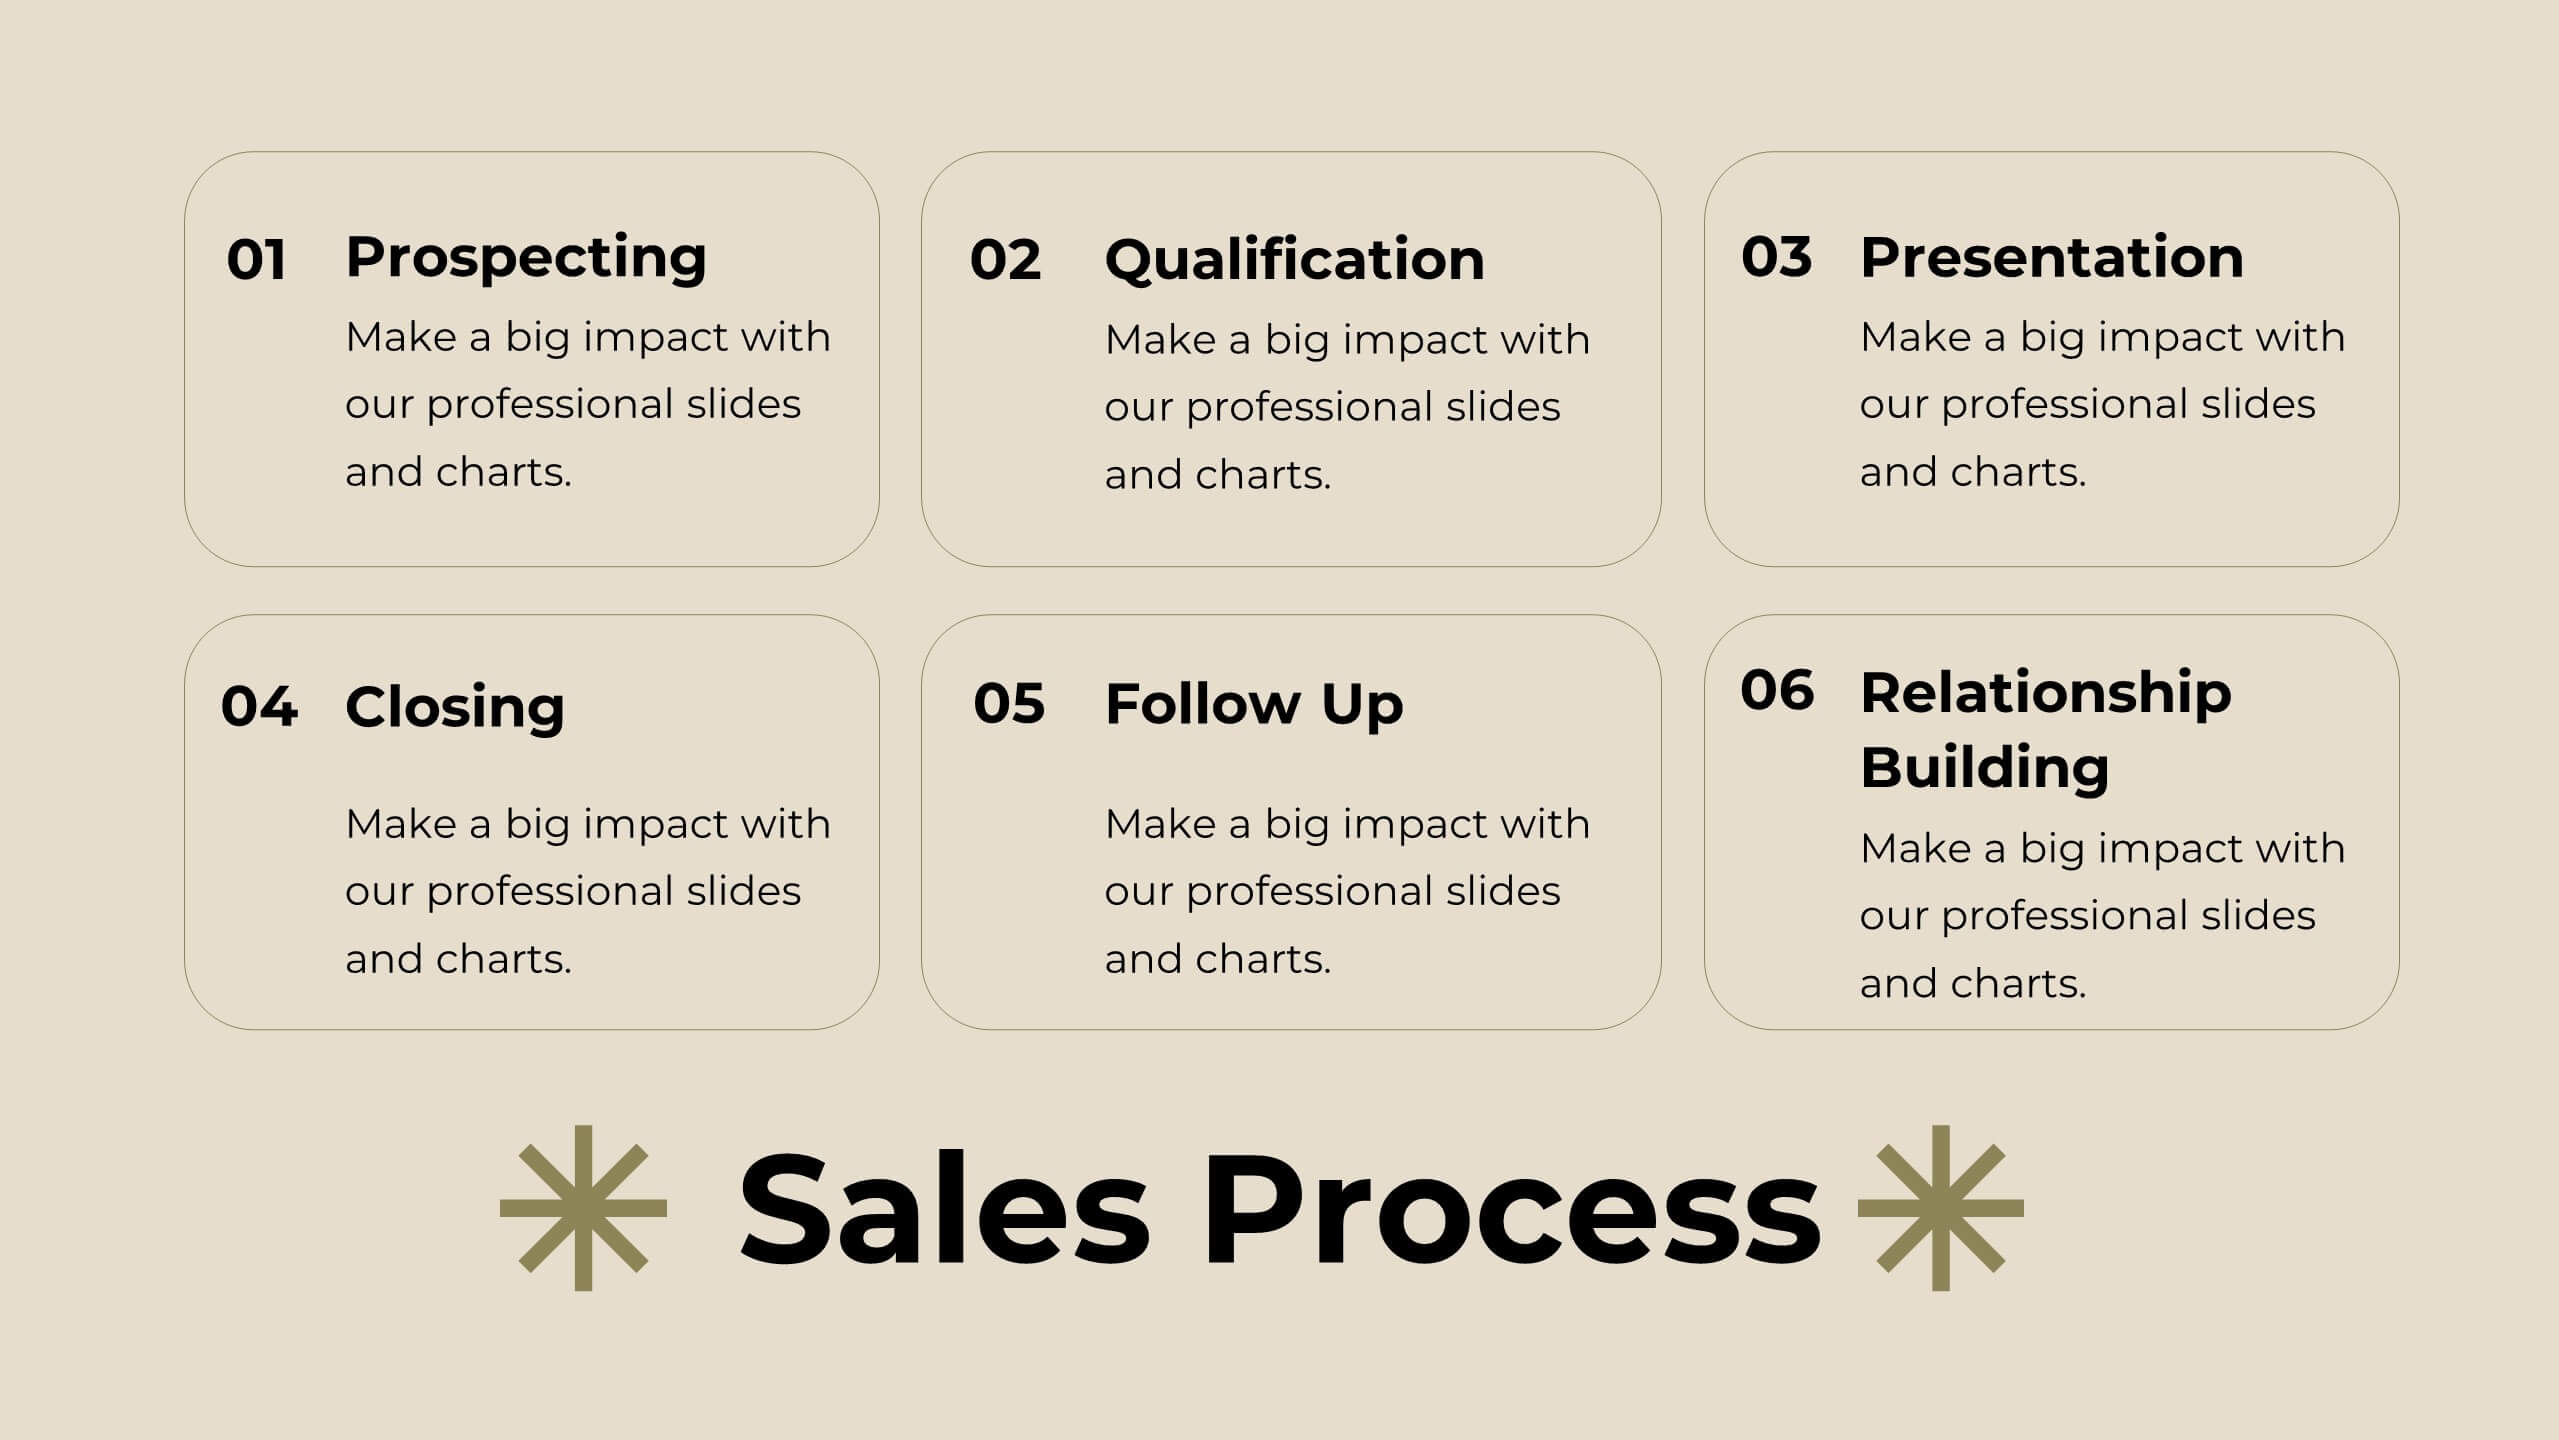
Opal Sales Pitch Deck Presentation
Boost your sales strategy with this sleek pitch deck template! Perfect for detailing your company overview, sales objectives, and pricing strategy, it includes slides for competitive analysis and customer testimonials. Engage your audience with clear, professional visuals and structured content. Compatible with PowerPoint, Keynote, and Google Slides for seamless presentations on any platform.


5 slides
Real-Time Data Dashboard Presentation
Bring your data to life with a dynamic layout that tracks key metrics as they shift by the moment. This presentation helps you present trends, performance indicators, and live insights with clarity and impact, ideal for fast-moving teams. Fully compatible with PowerPoint, Keynote, and Google Slides.


22 slides
Meteor Academic Research Report Presentation
Get ready to make your research presentation stand out with the Meteor Academic Research Report template! This elegant and sophisticated design is perfect for showcasing your research findings with clarity and impact. The template features a refined color scheme of earthy browns and soft greens, giving your presentation a polished and professional look. Each slide is carefully crafted to highlight key aspects of your research, from objectives and methodology to data analysis and conclusions. With dedicated sections for literature review, key findings, and future research directions, this template ensures that your audience can follow your research journey from start to finish. The clean and structured layout makes it easy to present complex information in a way that is easy to understand. Fully compatible with PowerPoint, Keynote, and Google Slides, the Meteor template is the ideal choice for delivering compelling and visually appealing academic presentations.


10 slides
Financial Growth Planning
Visualize your path to financial success with this puzzle-themed Financial Growth Planning template. Each step connects seamlessly to outline investment goals, budgeting strategies, or revenue milestones. Designed for clarity and impact, it's fully editable in PowerPoint, Keynote, and Google Slides for effortless customization.


29 slides
Shadowglow Brand Guidelines Proposal Presentation
Present a cohesive brand vision with this professional template, designed for crafting detailed and visually compelling brand guidelines. Highlight essential components like brand vision and mission, brand values, and identity elements, including color palettes, typography, and imagery. This template seamlessly incorporates customer personas, tone and voice guidelines, and brand touchpoints to define the essence of your brand's communication. Utilize slides for website, social media, and packaging strategies to establish consistency across all platforms. Customizable and compatible with PowerPoint, Google Slides, and Keynote, this design ensures clarity and professionalism, making it ideal for agencies or teams presenting comprehensive brand proposals.


26 slides
Olympus Brand Guidelines Proposal Presentation
The Olympus Brand Identity Presentation is a sleek and modern template designed to help you showcase your brand's unique identity and strategy. This template kicks off with a clean and engaging slide that sets the stage for the entire presentation. It guides you through various aspects of brand identity, including brand components, target audience, and unique selling proposition (USP). The template also dives into brand positioning, strategy, and guidelines, ensuring that your brand's message is consistent and compelling. Additionally, it covers brand experience, recognition, and recall, offering a comprehensive view of your brand's impact. With dedicated sections for performance metrics, brand success stories, and future development, this template provides a complete toolkit for effectively communicating your brand's strengths and vision. Fully compatible with PowerPoint, Keynote, and Google Slides, the Olympus template is perfect for any brand-focused presentation.


5 slides
Decision-Making Options
Visualize your strategic paths with this step-by-step decision-making infographic. Designed to showcase up to five sequential options or phases, this template uses bold icons and numbering to guide viewers through the process. Ideal for business strategies, project planning, or process evaluations. Fully editable in PowerPoint, Keynote, and Google Slides.


21 slides
Arcadian Photography Portfolio Template Presentation
Showcase your best work with this sleek and stylish photography portfolio presentation template! It’s perfect for presenting your featured projects, creative process, and client testimonials in a visually stunning way. This template is fully customizable and offers a professional touch to your portfolio, making it ideal for both personal and client presentations. Compatible with PowerPoint, Keynote, and Google Slides.


6 slides
Business Challenges and Solutions Presentation
Address challenges with strategic solutions using this Business Challenges and Solutions template. Featuring a clear side-by-side layout, this design helps visualize business obstacles and their corresponding solutions for effective decision-making. Perfect for problem-solving discussions, strategy meetings, and brainstorming sessions, this template ensures your content remains structured and impactful. Fully customizable for PowerPoint, Keynote, and Google Slides.


8 slides
Restaurant Menu Design Presentation
Showcase your menu items with style using this bold, modern restaurant menu infographic. Designed to highlight pricing, meal categories, and featured items, this layout is perfect for restaurant presentations, promotions, or digital signage. Includes editable text areas and food-themed icons. Works seamlessly in PowerPoint, Keynote, and Google Slides.


7 slides
Supply Chain Infographic Presentation Template
A Supply Chain is a strategic business process that can help organizations improve capacity, reduce cost and risk, attain growth potential and create value. A supply chain consists of these activity points: Suppliers, Manufacturing, Distribution, retailer, Customers. This template will help you to create a supply chain that meets your needs. It includes six clear steps, fill each box with details about what you want in each part of the supply chain. With this template, you’ll get a clear picture of what’s working in your supply chain and where there are opportunities for improvement.


7 slides
Weight Challenge Infographic Presentation
Challenges are essential for personal and professional growth, and they play an important role in our lives in several ways. This template is designed for any and all use. You can use it in business, academic presentations, or home. This template is designed to give you flexibility in your presentations and allow you to create dynamic content that stands out from the crowd. This is compatible with Powerpoint, Keynote, and Google Slides so you can easily edit your presentation. This template can be used for a variety of projects, including team building, goal setting and brainstorming!