


Features
- 4 Unique slides
- Fully editable and easy to edit in Microsoft Powerpoint, Keynote and Google Slides
- 16:9 widescreen layout
- Clean and professional designs
- Export to JPG, PDF or send by email


Do you have any questions?
Recommend


4 slides
Comprehensive Business Project Pitch Presentation
Present a polished and structured message with the Comprehensive Business Project Pitch Presentation. Featuring a clean checklist format paired with bold icons and color-coded segments, this layout is perfect for showcasing core strategies, deliverables, or proposal points. Easily customizable for PowerPoint, Keynote, or Google Slides.


5 slides
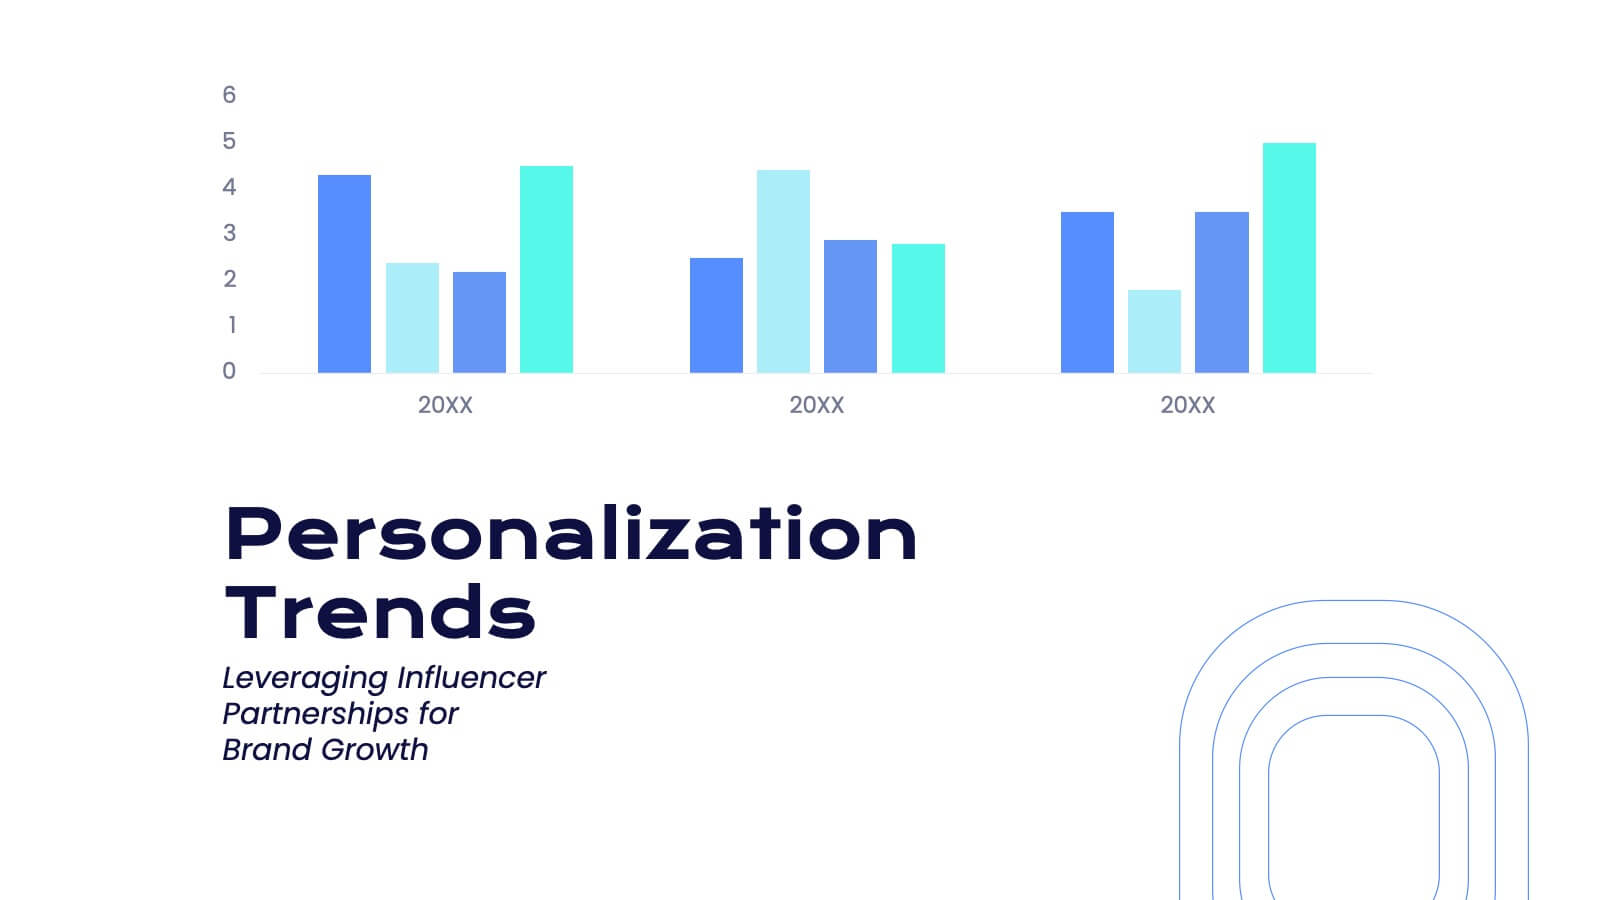
Editable Data Charts Presentation
Bring your data to life with a clean, engaging layout that makes every insight easy to understand. This presentation helps you explain percentages, comparisons, and key metrics with clarity while keeping your narrative smooth and professional. Designed for clear data storytelling and effortless editing, it's fully compatible with PowerPoint, Keynote, and Google Slides.


20 slides
Alchemy Sales Forecast Presentation
Elevate your sales strategy with this sleek and modern sales forecast presentation template. Featuring sections for sales objectives, pricing strategies, performance metrics, and future opportunities, it’s perfect for teams aiming to analyze and plan effectively. Fully compatible with PowerPoint, Keynote, and Google Slides for seamless professional presentations.


7 slides
Security Jobs Infographic
Security jobs refer to roles and positions within various industries that primarily focus on safeguarding individuals, properties, data, and assets from potential threats, risks, or unauthorized access. This infographic template is designed to shed light on the diverse and dynamic world of security professions. Fully customizable and compatible with Powerpoint, Keynote, and Google Slides. This infographic is your gateway to understanding the vital roles that contribute to a safer world. Discover your path, protect communities, and embark on a fulfilling career journey in security.


5 slides
Financial and Growth Statistics
Present financial insights and growth metrics with impact using this visually engaging infographic. Ideal for showcasing revenue performance, profit trends, or investment results, this template keeps data clear and actionable. Fully customizable in PowerPoint, Keynote, and Google Slides to match your brand and strategy needs.


5 slides
Concise Company Overview Executive Summary Presentation
Present your business snapshot with clarity using this Concise Company Overview Executive Summary Presentation. Featuring a colorful puzzle-style diagram with six customizable titles, this slide is ideal for outlining key departments, initiatives, or functions. Fully editable in PowerPoint, Keynote, Google Slides, and Canva for maximum flexibility.


20 slides
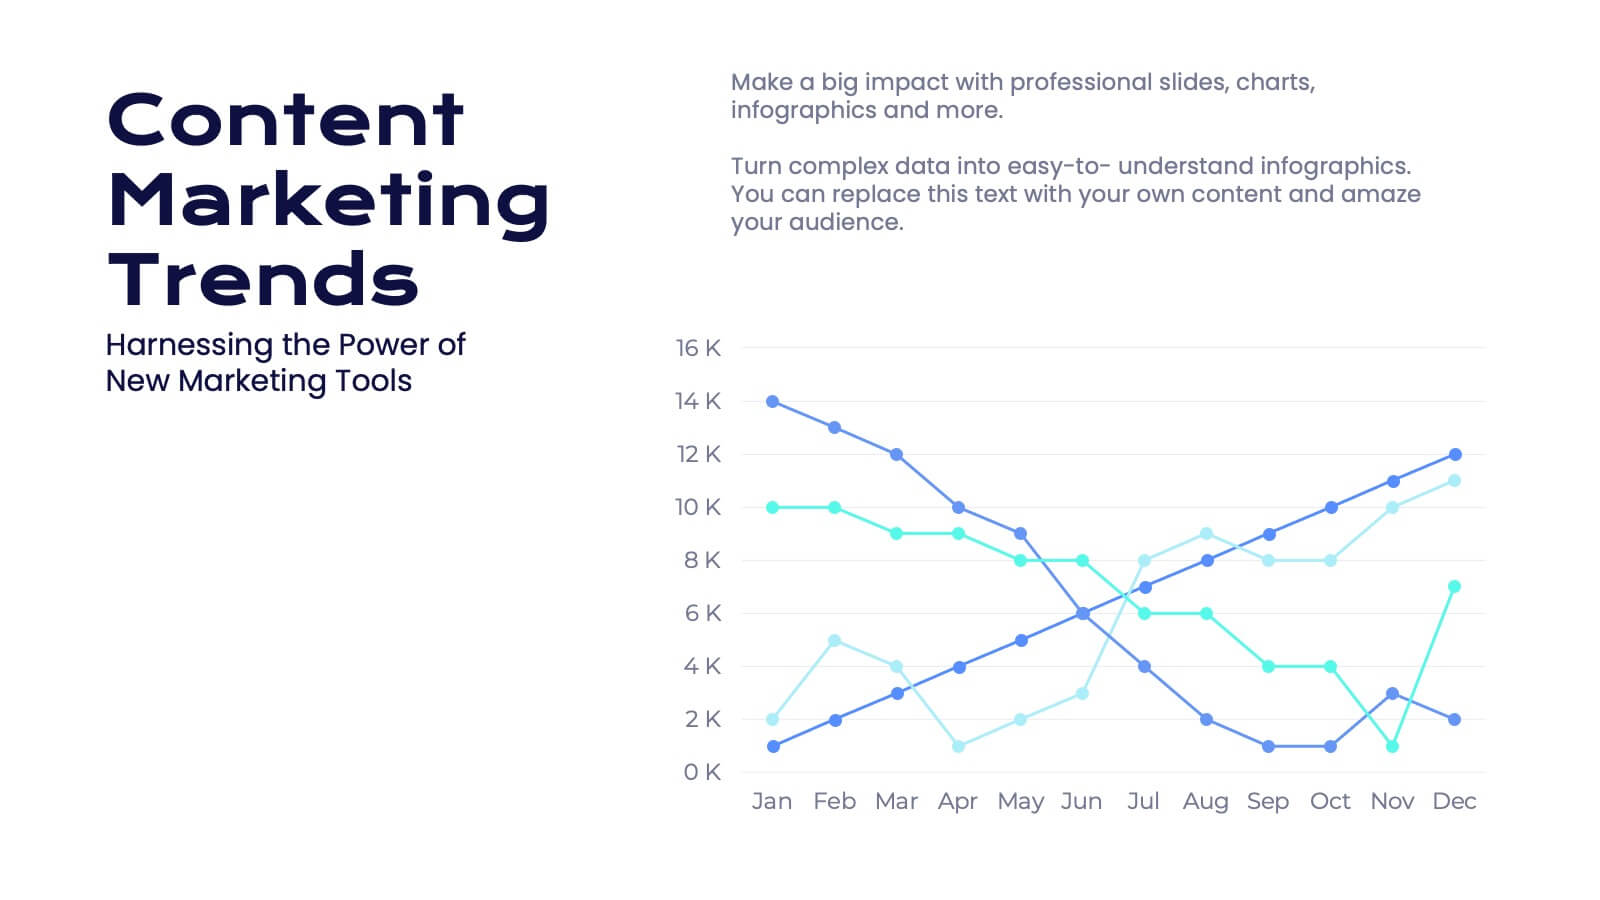
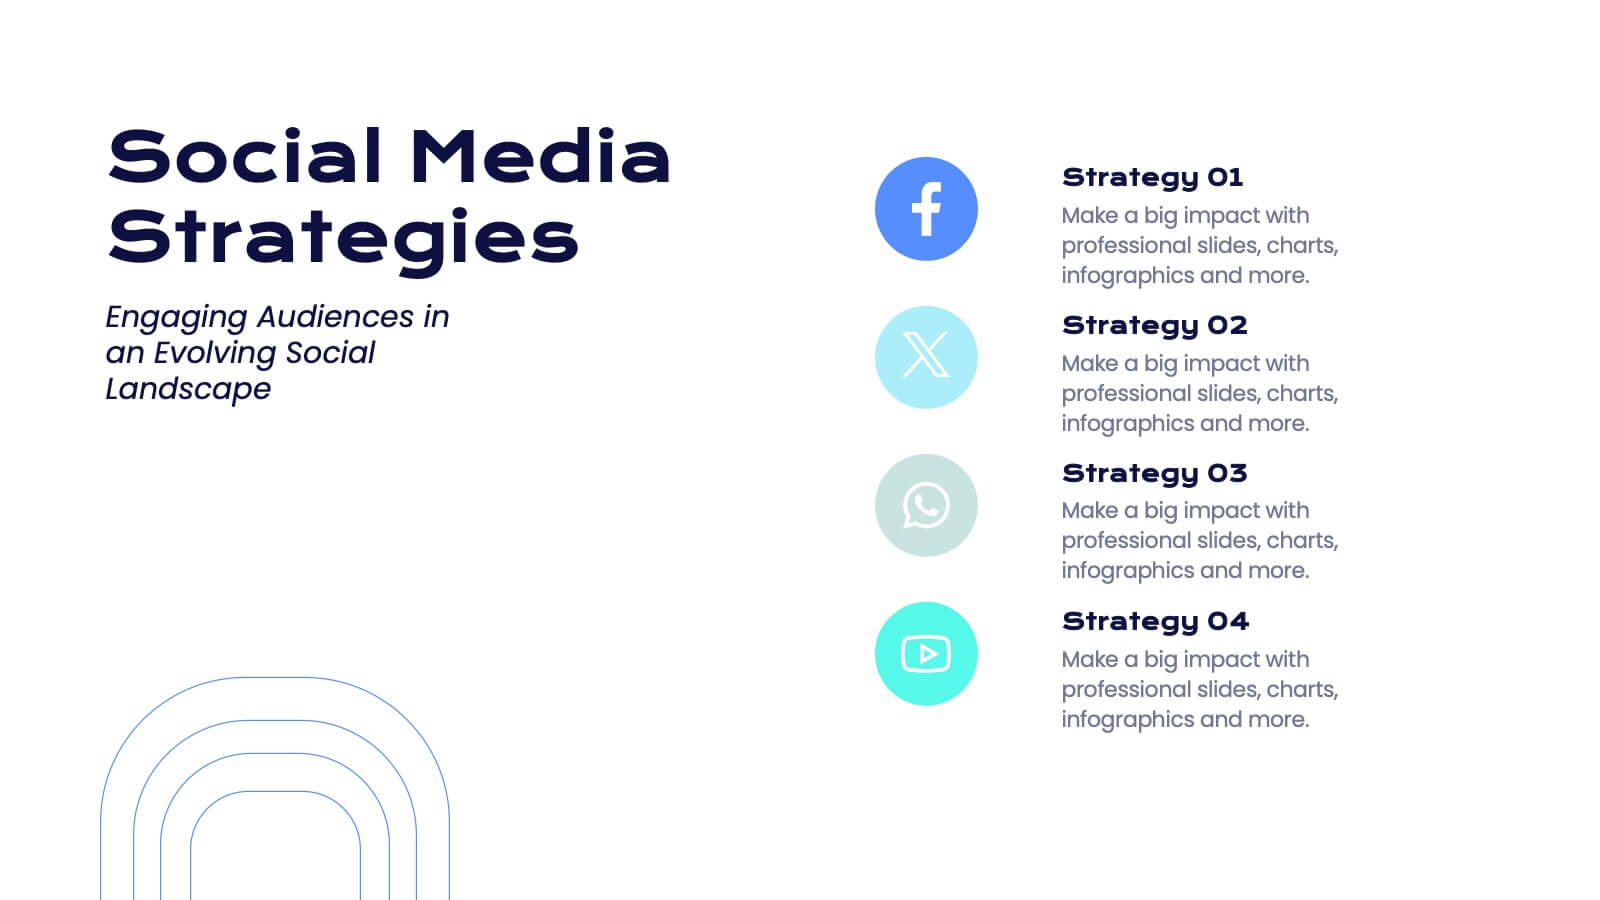
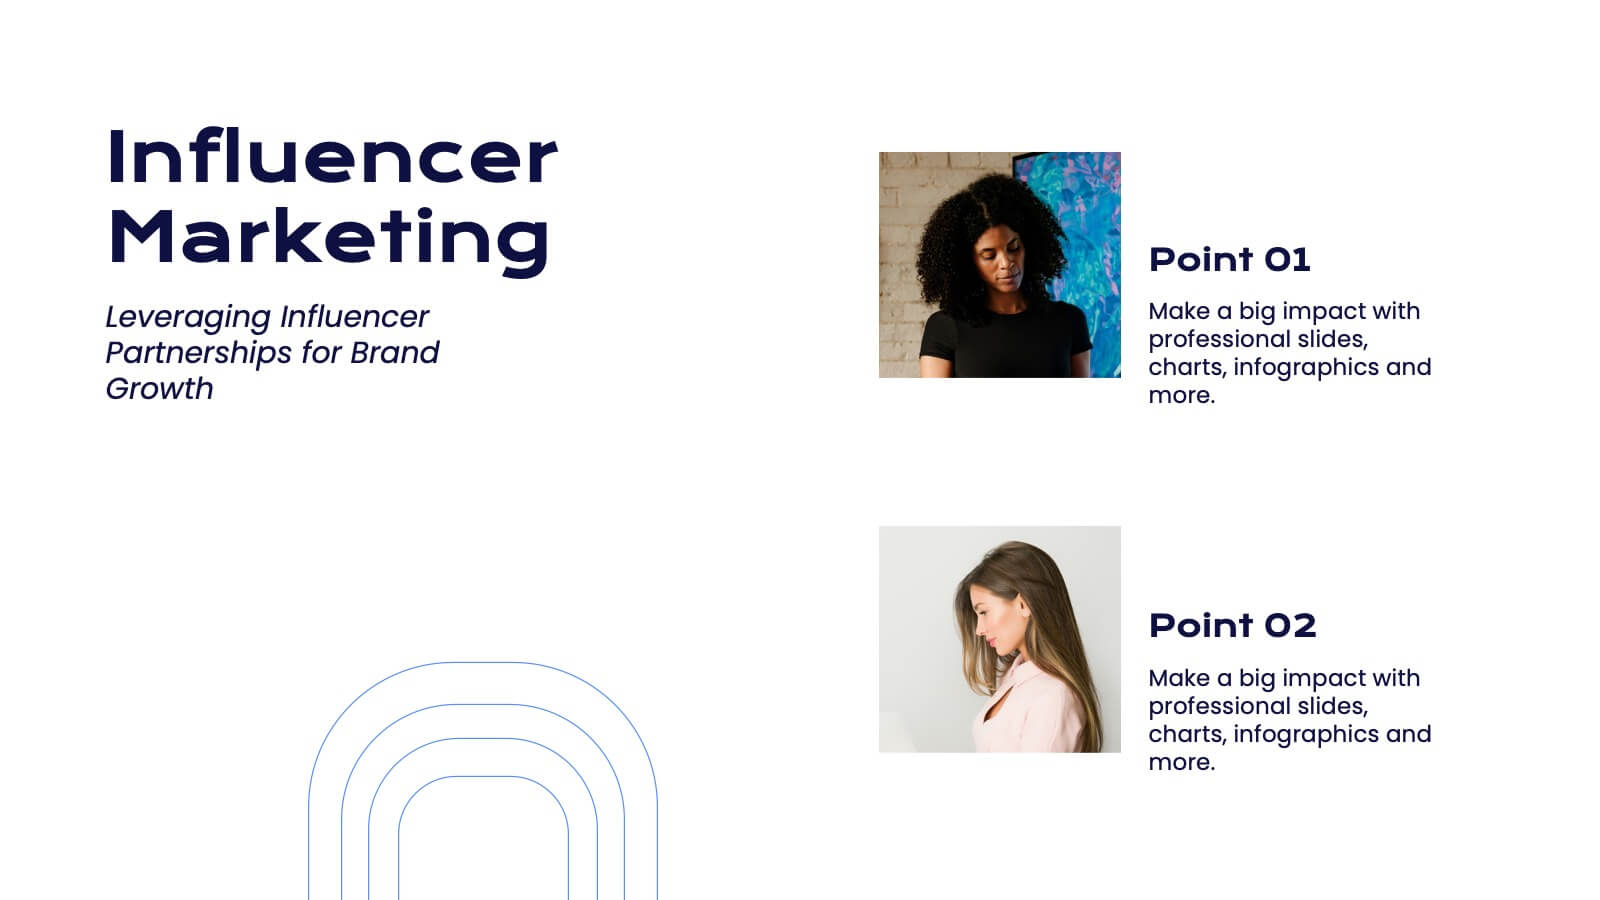
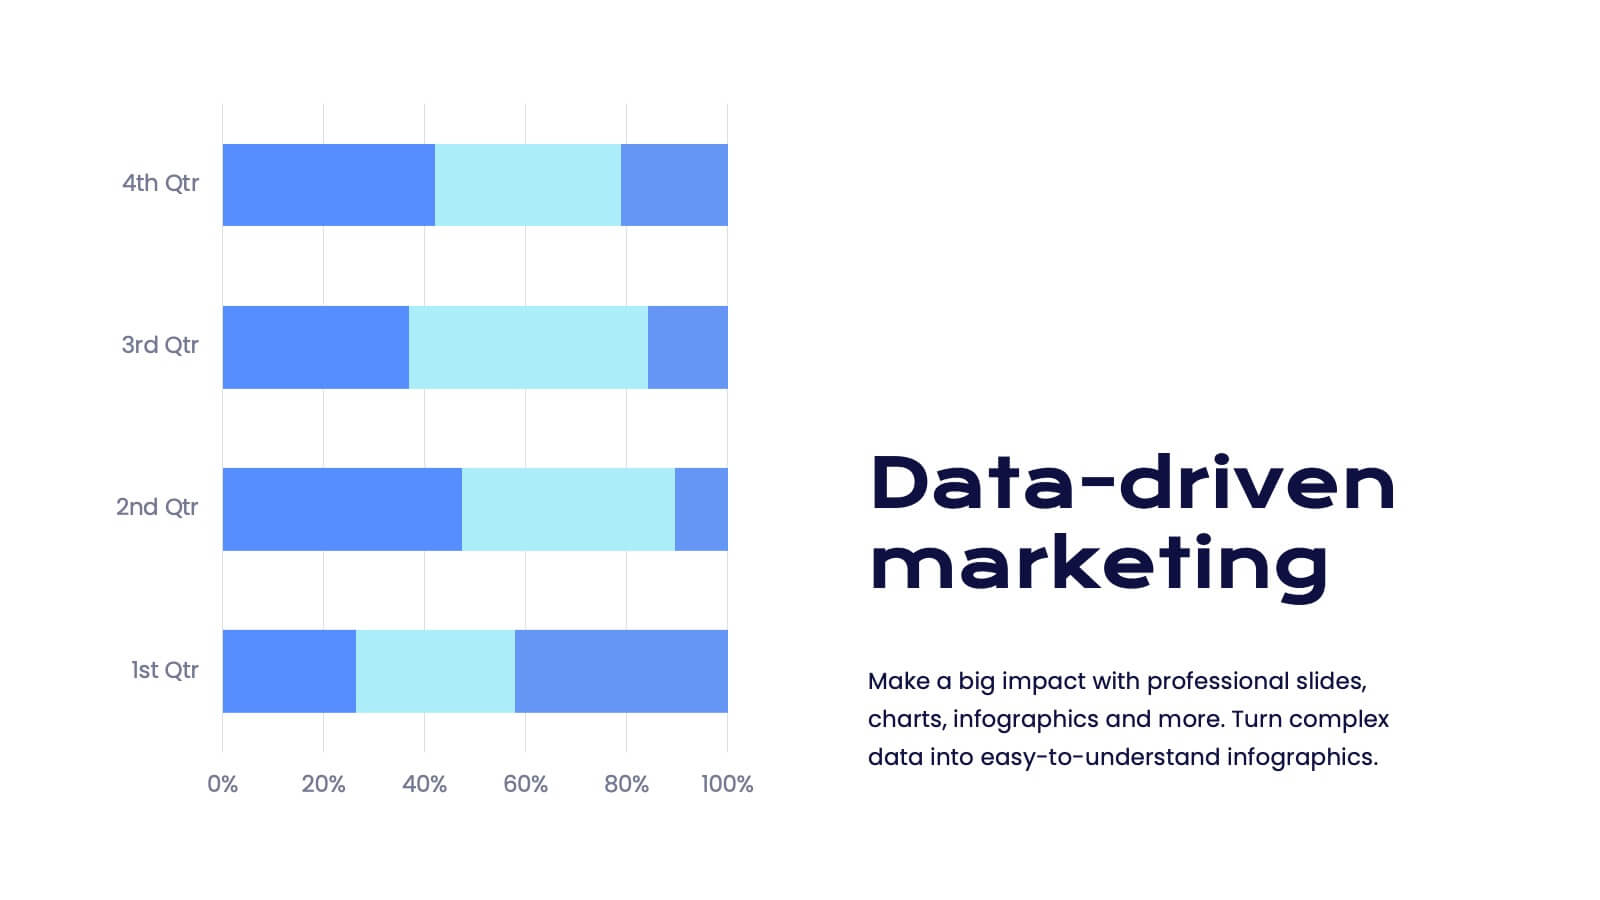
Faerie Digital Marketing Strategy Plan Presentation
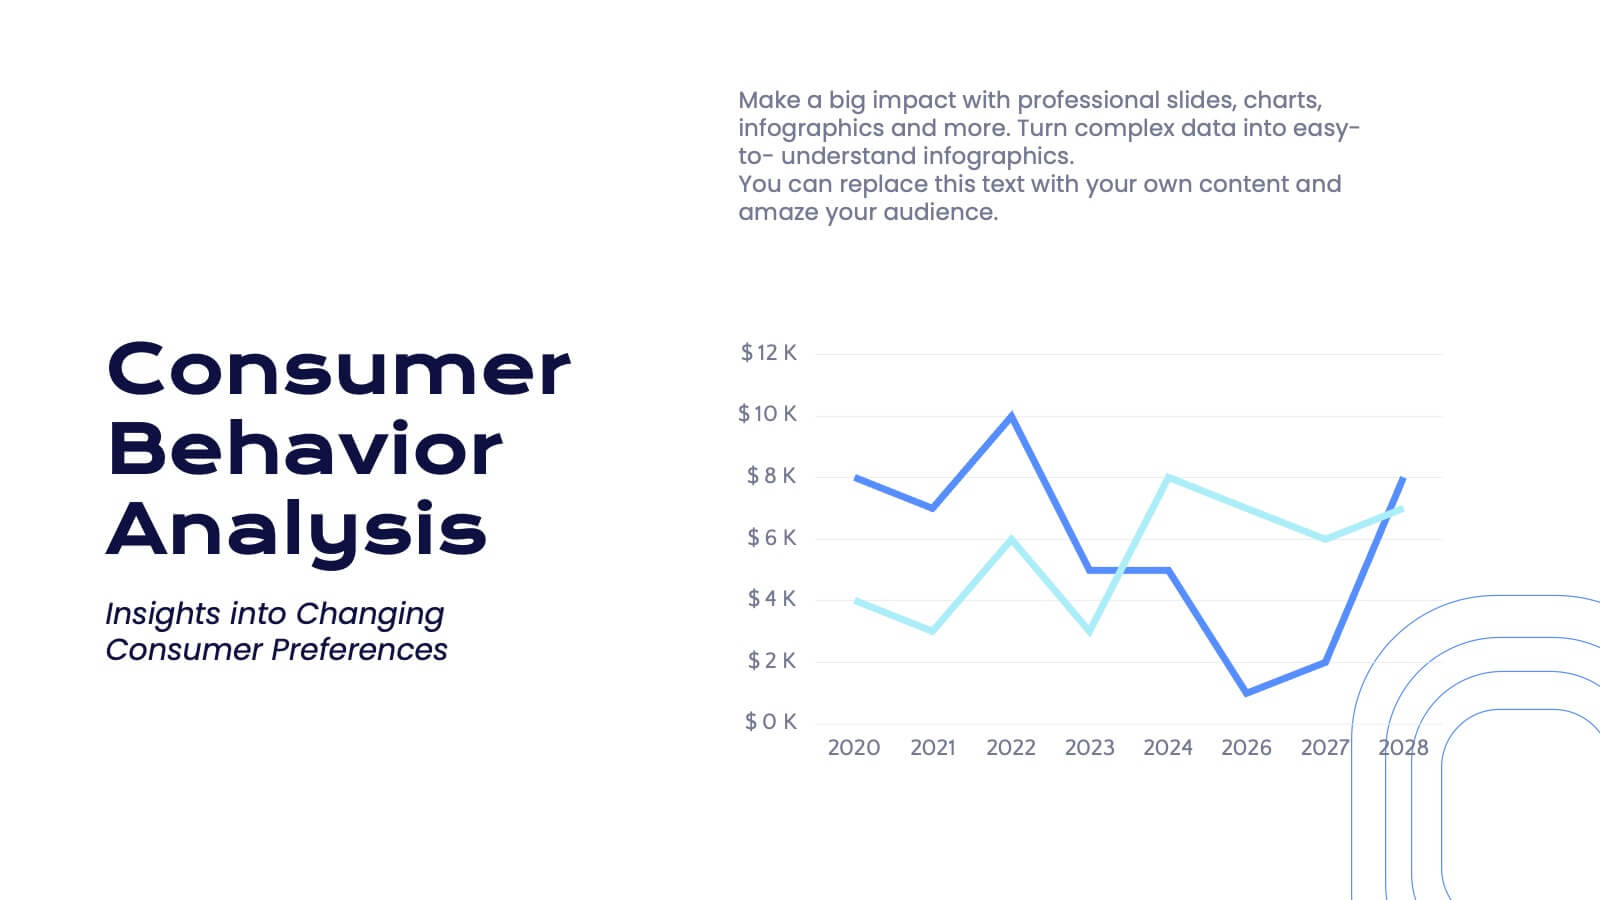
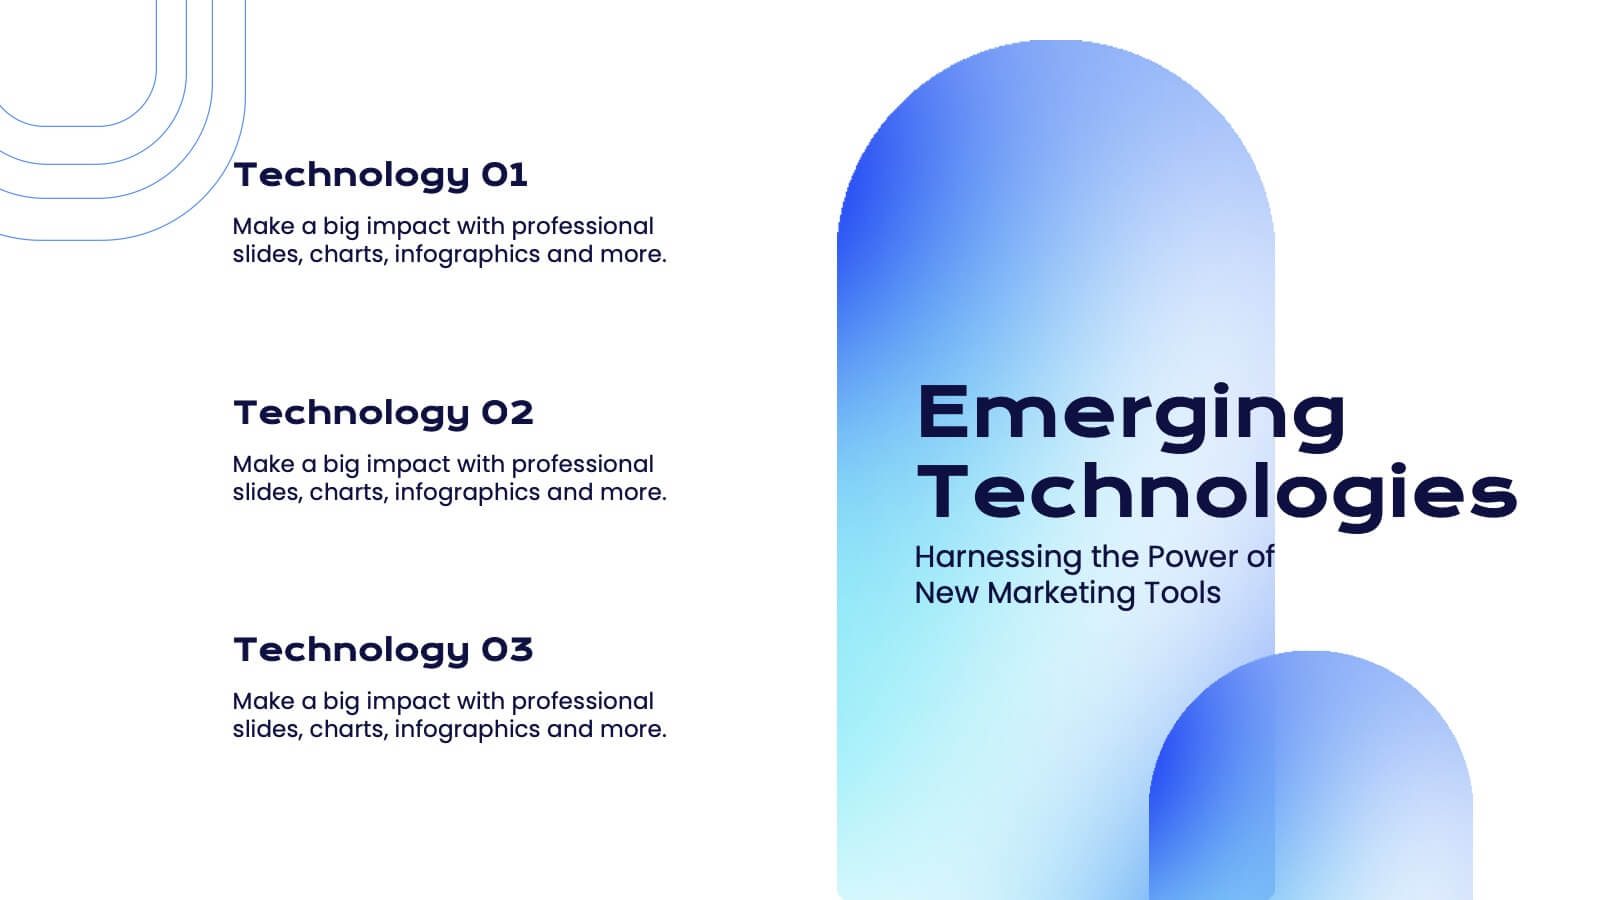
Create a compelling marketing strategy with this sleek, modern template! It covers key topics like consumer behavior, social media strategies, and emerging trends. Perfect for showcasing insights in a clear, data-driven format. Fully customizable, it works seamlessly with PowerPoint, Keynote, and Google Slides for effective presentations.


5 slides
Cybersecurity Risk Management Presentation
Simplify your security strategy with this clean, lock-themed visual. This layout organizes five key points with corresponding icons, perfect for presenting IT safeguards, data protection plans, or risk response actions. The vertical structure ensures clarity, while the design remains professional and editable in PowerPoint, Keynote, and Google Slides.


4 slides
Three-Dimensional Business Model Slide Presentation
Visualize growth and complexity with the Three-Dimensional Business Model Slide Presentation. This template uses sleek 3D chart elements to illustrate layered business concepts across 1D, 2D, and 3D perspectives. Ideal for modeling scalability, market maturity, or performance comparisons. Fully customizable in PowerPoint, Keynote, and Google Slides.


5 slides
Demographic and Psychographic Segments Presentation
Break down your audience with clarity using the Demographic and Psychographic Segments Presentation. This slide is ideal for showcasing four key consumer dimensions through a centered circular layout and quadrant icons. Perfect for marketing campaigns, branding strategies, and audience targeting. Fully editable in Canva, PowerPoint, Keynote, or Google Slides.


9 slides
Business Dashboard Infographics
A business dashboard, often referred to as a business intelligence dashboard, is a visual representation of an organization's key performance indicators and critical business metrics. Empower your business analysis and strategy with our Infographic. This dynamic template enables you to present key business metrics, performance indicators, and trends in a clear and impactful manner. Compatible with Powerpoint, Keynote, and Google Slides. This template is a powerful tool to visualize your business progress, identify opportunities, and communicate your success story to viewers, clients, or team members.


6 slides
Agile Project Management Infographic
Agile methodology is an iterative and collaborative approach to project management and software development. This infographic template outlines the key principles and practices of the Agile project management approach. This template is designed to help project managers, teams, and stakeholders understand and implement Agile methodologies for efficient and collaborative project delivery. This serves as a comprehensive guide to understanding and implementing Agile methodologies in project management. It presents the key principles, frameworks, practices, and benefits of Agile in a visually engaging and easy-to-understand format.


4 slides
Cloud Computing IT Architecture Presentation
Enhance your Cloud Computing IT Architecture presentations with this dynamic layered cloud infographic. Perfect for visualizing cloud storage and security frameworks, this template is fully customizable and compatible with PowerPoint, Keynote, and Google Slides.


6 slides
Construction Project Management Infographic
Construction project management is the process of planning, organizing, and overseeing construction projects from inception to completion. This infographic template is designed to showcase the essential elements and processes involved in managing a construction project. It is a concise and easy-to-understand visual representation of key aspects that play a vital role in successful project execution. This provides an overview of the project's key elements, progress, and success factors. This visually appealing infographic helps in effective communication, decision-making, and project monitoring throughout the construction process.


7 slides
Programming Framework Infographic
Delve into the intricate world of coding with the programming framework infographic. With a harmonious palette of blue, white, and green, this template visualizes the intricacies of different programming frameworks in a clear and engaging manner. Tailor-made for developers, software engineers, educators, and tech enthusiasts, it transforms complex concepts into digestible visual snippets. Embedded with custom graphics, relevant icons, and adaptable image placeholders, it enhances any tech presentation. Moreover, its seamless adaptability with PowerPoint, Keynote, and Google Slides ensures you leave a lasting impression.


5 slides
Manufacturing in the US Infographics
Delve into the industrial heartbeat of America with the manufacturing in the US infographics. Rendered in patriotic hues of red, blue, and white, this vertical, creative, and informative template is a powerhouse of insight, perfect for industry analysts, educational purposes, or corporate presentations aiming to explore the intricacies of U.S. manufacturing. The infographic doesn’t just present data; it tells the story of American industry, with engaging graphics, intuitive icons, and dedicated spaces for real imagery that bring facts to life. This tool is invaluable for anyone needing to communicate the vast scope of U.S. manufacturing prowess effectively and compellingly.


7 slides
Behavior Psychology Infographic Presentation
A Psychology Infographic is a visual representation of information related to the field of psychology. This template includes charts, diagrams, and other visual elements that help illustrate concepts, theories, and research findings in psychology. Use this infographic to cover a wide range of topics, such as personality traits, cognitive processes, mental disorders, and social behavior. The purpose of this psychology template is to help people better understand the complex concepts related to psychology. Compatible with Powerpoint, Keynote, and Google Slides this template is fully editable.