


Features
- 10 Unique slides
- Fully editable and easy to edit in Microsoft Powerpoint, Keynote and Google Slides
- 16:9 widescreen layout
- Clean and professional designs
- Export to JPG, PDF or send by email


Do you have any questions?
Recommend


4 slides
Innovation with Design Thinking Framework Presentation
Drive innovation with the Design Thinking Framework presentation. This visually engaging layout structures ideas, processes, and solutions into a clear and adaptable design. Perfect for brainstorming sessions, business strategy meetings, and creative problem-solving. Fully customizable and compatible with PowerPoint, Keynote, and Google Slides for a seamless workflow.


7 slides
Agile Circle Methodology Infographic Presentation
Agile Methodology is a flexible and adaptive approach to project management that values customer satisfaction, teamwork, and continuous improvement. Our Agile Methodology template is perfect for academic or work presentation projects. This template is super easy to use and works with Powerpoint, Keynote, and Google Slides. It has a minimal design with, bright colors that will keep your audience engaged. With this template, you can learn all about Agile Methodology in a way that is visually appealing. Use this template to see how you and your team work more efficiently and effectively.


5 slides
Sustainable Development Goals Deck Presentation
Present your sustainability roadmap with clarity using the Sustainable Development Goals Deck. Designed for highlighting eco-initiatives, circular strategies, and responsible development objectives. The circular layout supports goal-based narratives and strategic breakdowns. Fully editable in PowerPoint, Keynote, and Google Slides—ideal for ESG reports, environmental pitches, or CSR presentations.


20 slides
Scriptorium Design Portfolio Presentation
Showcase your creative work with a sophisticated design portfolio presentation template tailored for designers and creators. This template includes clean, minimalist slides to highlight your introduction, portfolio overview, design philosophy, and style. Showcase featured projects with dedicated project highlight slides, complete with client testimonials and awards for added credibility. With sections for your design process, services, pricing, and blog integration, this template provides a professional framework for sharing your creative journey. The editable layout ensures seamless customization to reflect your unique brand, making it suitable for freelancers, agencies, or design teams. Compatible with PowerPoint, Google Slides, and Keynote, this versatile template offers an elegant way to communicate your expertise and leave a lasting impression on clients or stakeholders. Tailor it to your needs and take your portfolio presentations to the next level!


6 slides
Construction Project Management Infographic
Construction project management is the process of planning, organizing, and overseeing construction projects from inception to completion. This infographic template is designed to showcase the essential elements and processes involved in managing a construction project. It is a concise and easy-to-understand visual representation of key aspects that play a vital role in successful project execution. This provides an overview of the project's key elements, progress, and success factors. This visually appealing infographic helps in effective communication, decision-making, and project monitoring throughout the construction process.


5 slides
Hidden Layers Iceberg Presentation
Reveal what lies beneath the surface with this Hidden Layers Iceberg Presentation. Ideal for explaining visible outcomes versus underlying causes, it’s perfect for business, psychology, or education topics. Clearly segmented layers with labeled callouts enhance clarity. Fully customizable in PowerPoint, Keynote, and Google Slides for effortless professional use.


4 slides
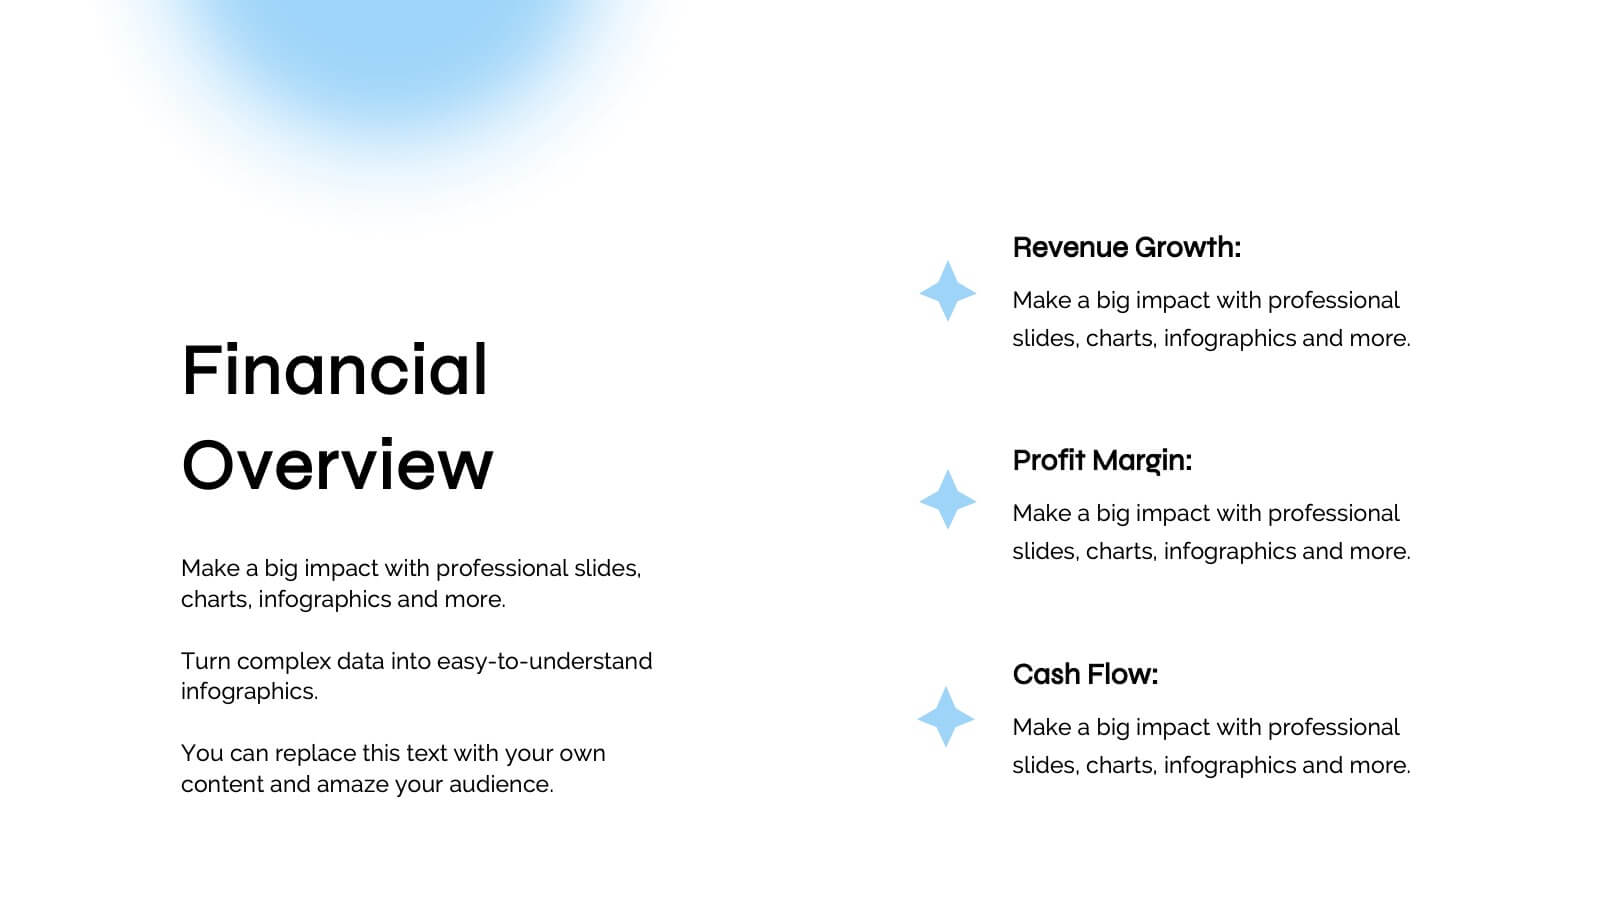
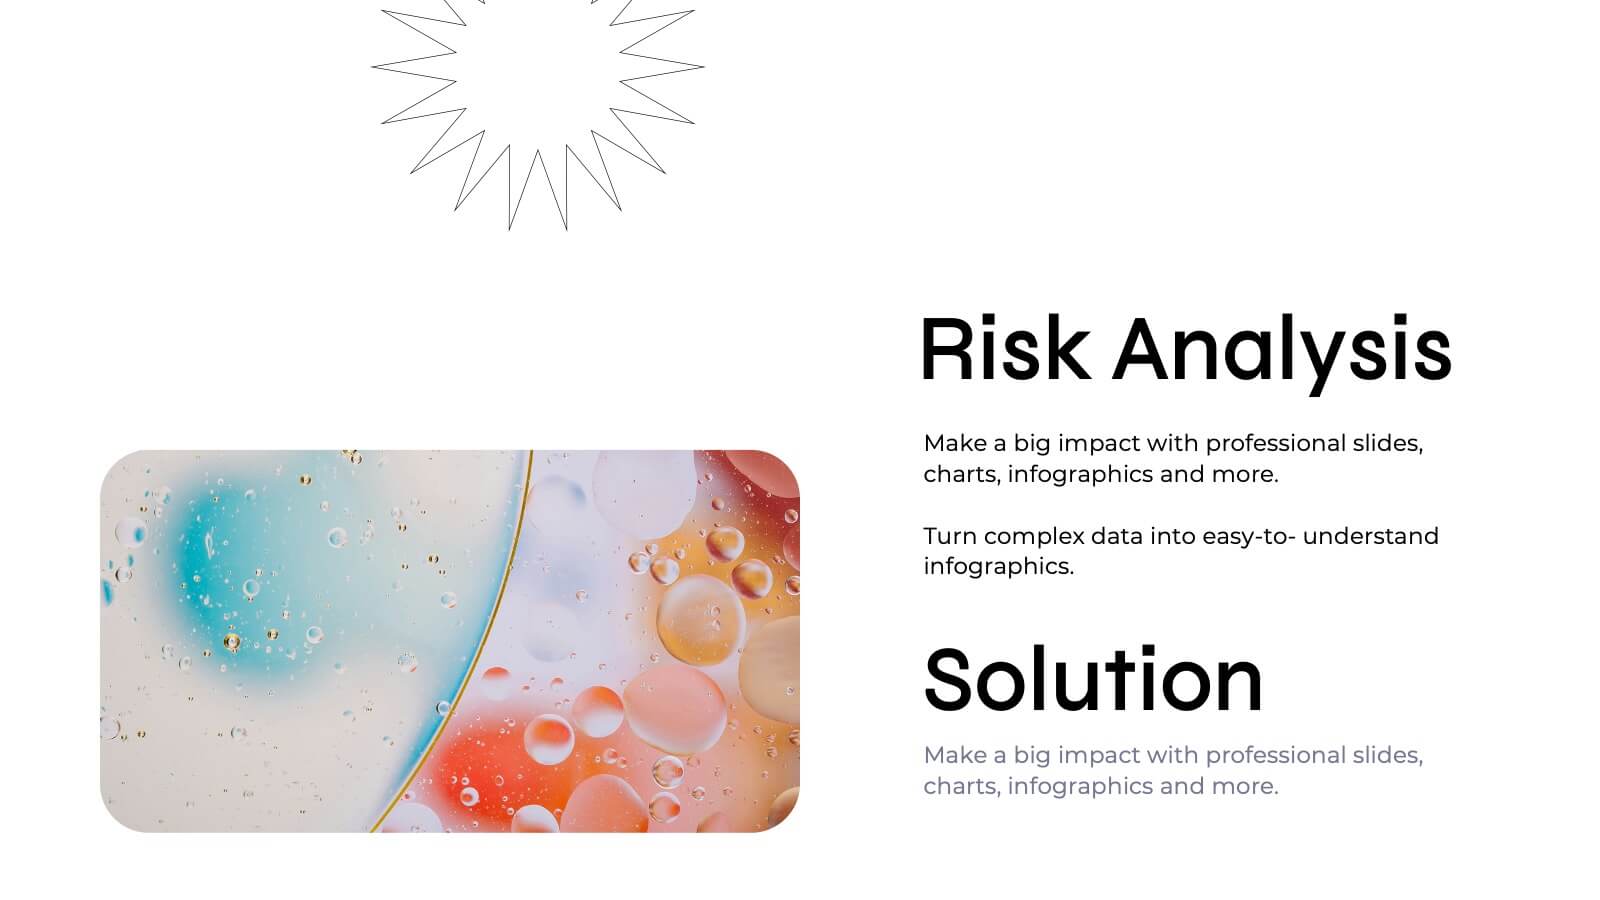
Investment Planning and Risk Guide
Simplify your financial presentation with the Investment Planning and Risk Guide Presentation. This 3-step visual layout walks viewers through the key stages of financial decision-making, from initial capital to potential return. Perfect for illustrating risk assessment, investment flow, or budgeting strategies. Fully editable in PowerPoint, Keynote, and Google Slides.

22 slides
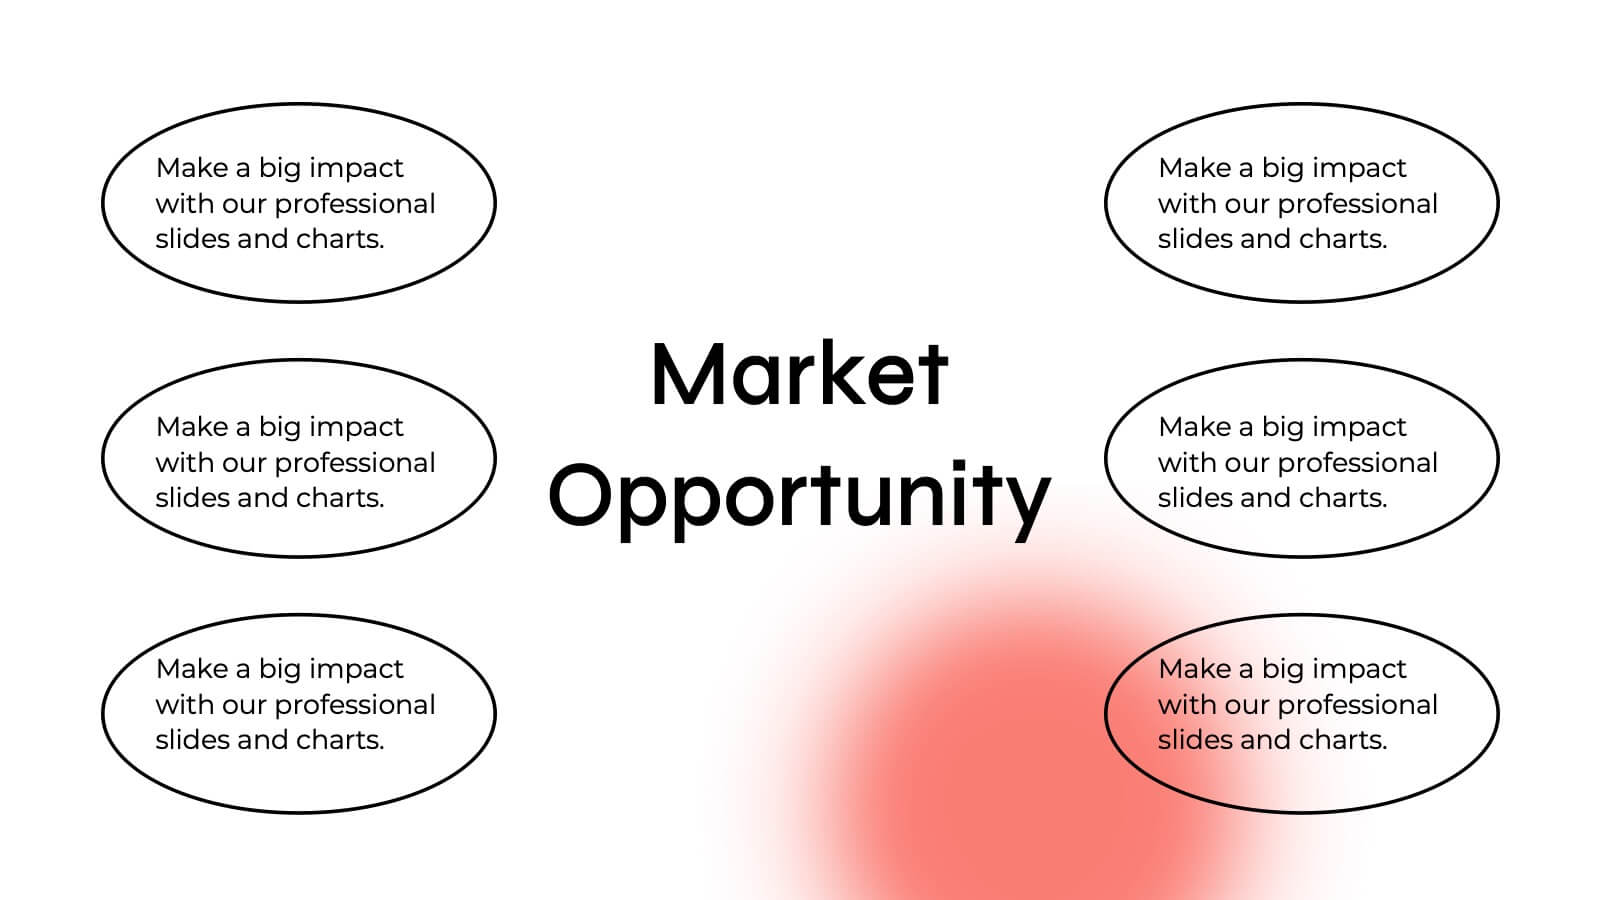
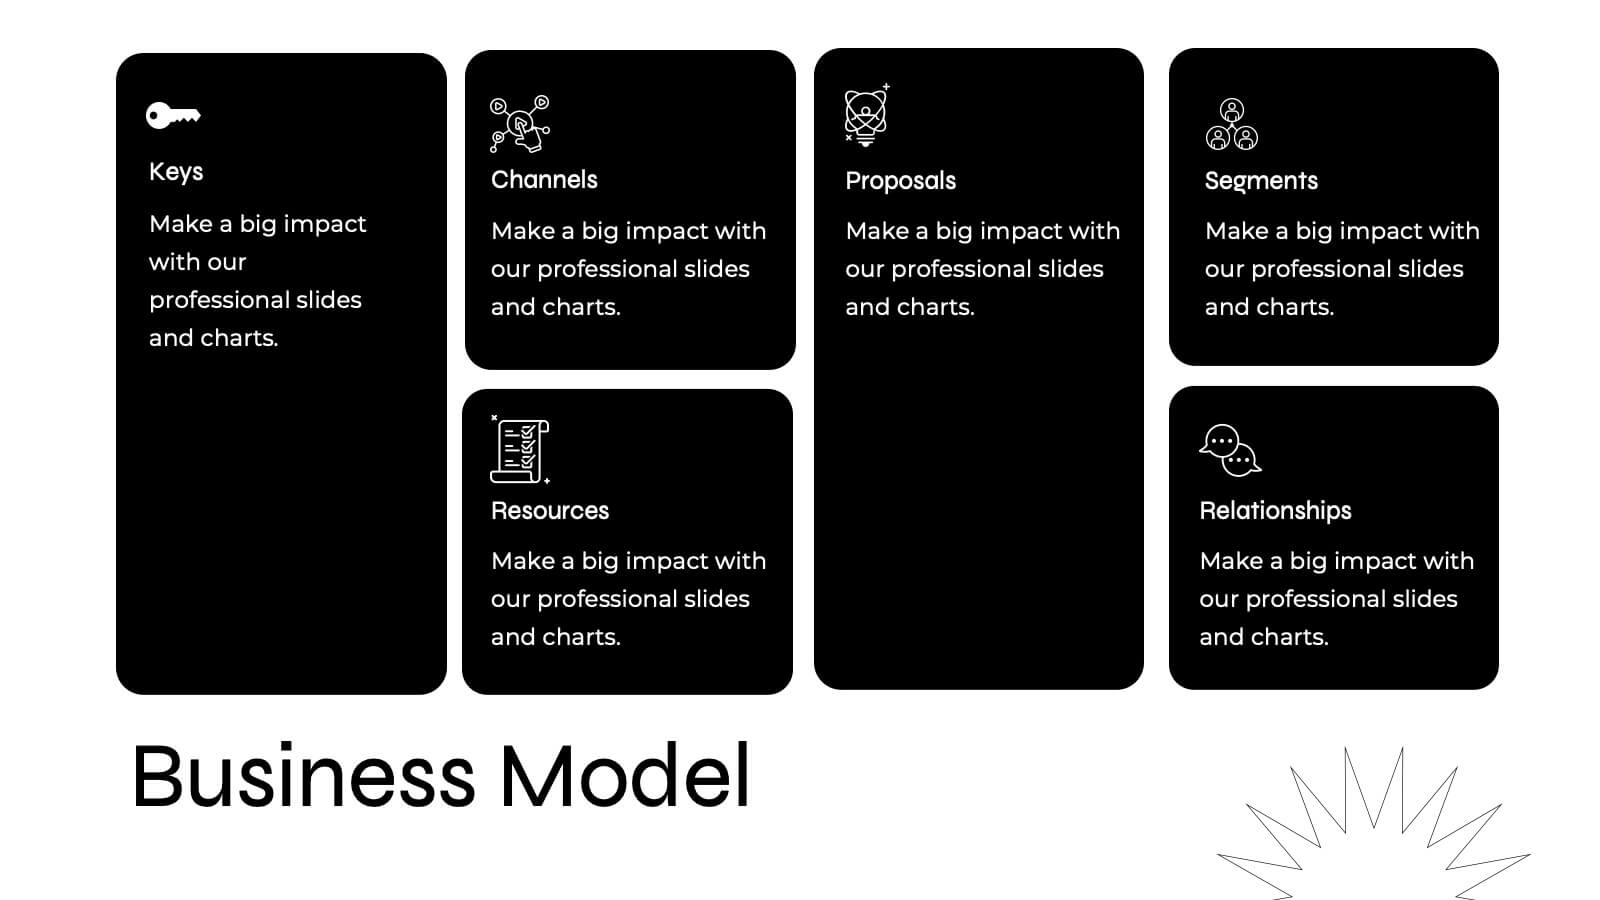
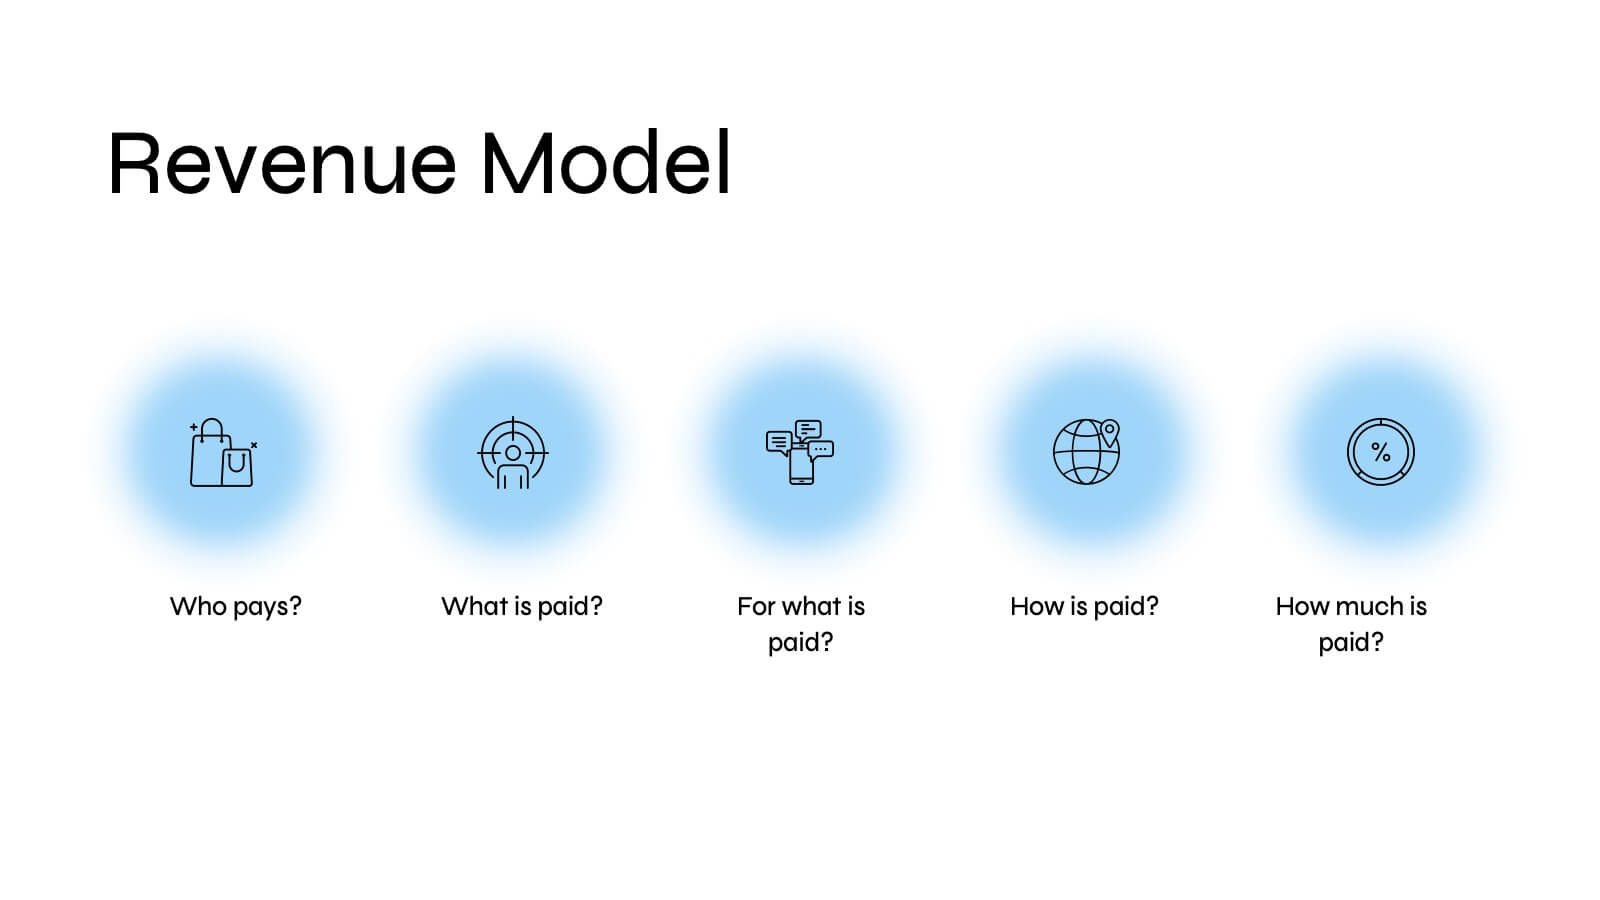
Quirinus Investor Pitch Presentation
Ready to impress investors and stakeholders? This sleek and modern pitch deck template covers all the essentials, from problem statements and market opportunities to revenue models and growth projections. Each slide is designed to convey clear and compelling information for maximum impact. Fully compatible with PowerPoint, Keynote, and Google Slides, making it the perfect tool for your next product launch!


22 slides
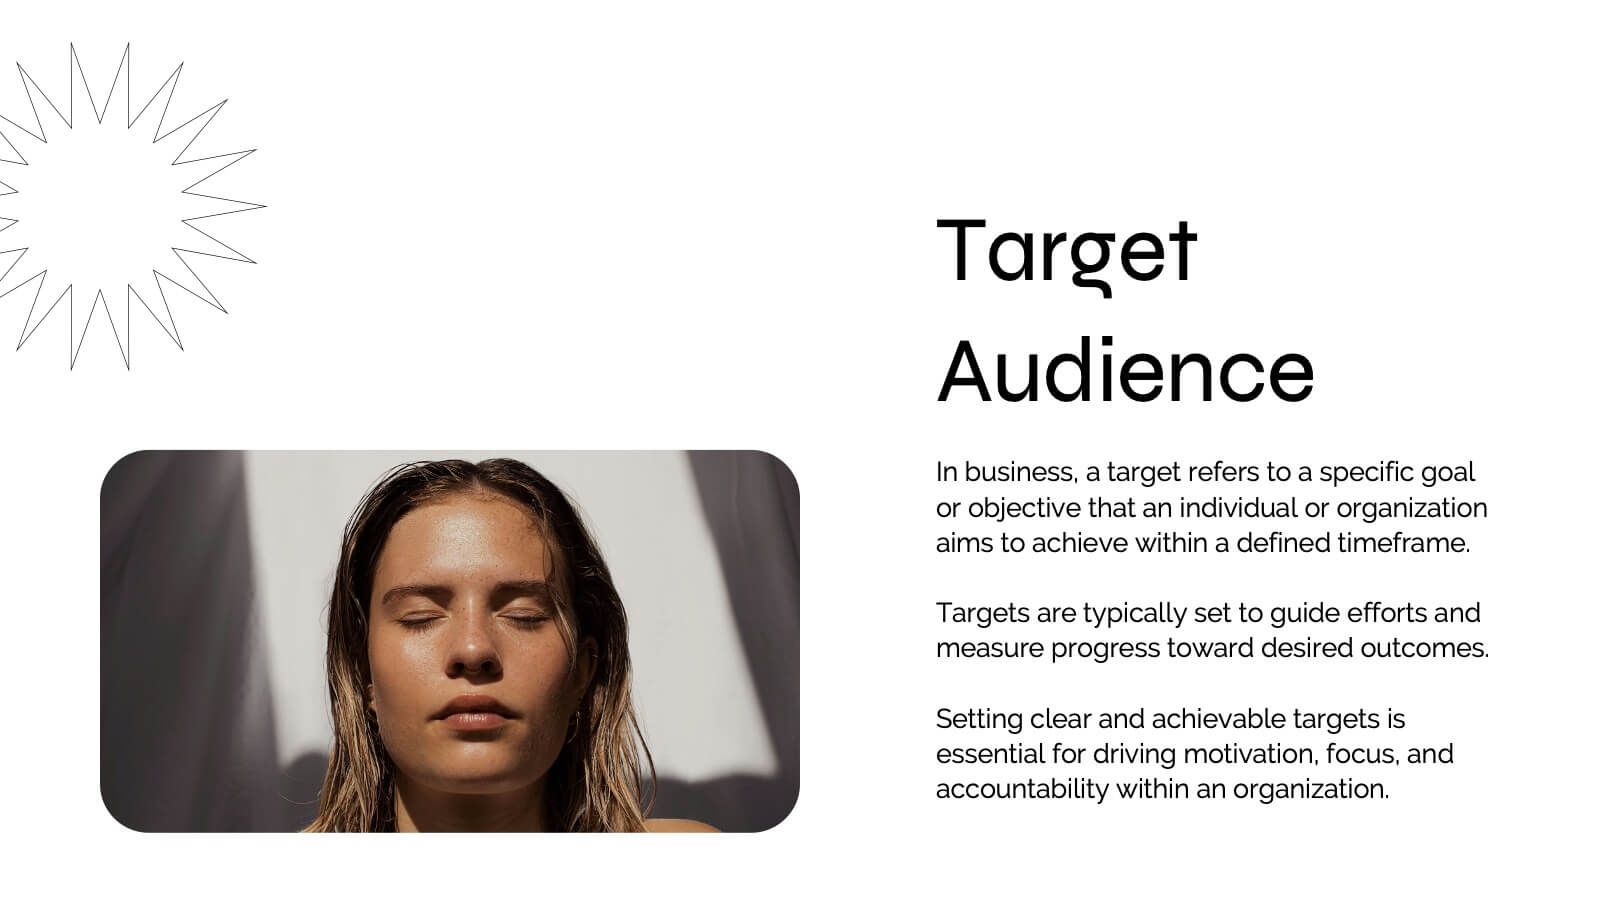
Synchrony New Product Proposal Presentation
Present your innovative ideas effectively with this sleek and organized product proposal template, tailored to showcase every aspect of your new product. From introduction to execution, this template covers every detail, ensuring your proposal is both comprehensive and visually appealing. Key features include slides for product overview, features, target audience analysis, and customer pain points. Additionally, it provides sections for competitive analysis, pricing strategy, and distribution channels, equipping you with all the tools to communicate your value proposition clearly. Technical specifications and production processes are also included, perfect for presenting intricate details. Compatible with PowerPoint, Google Slides, and Keynote, this template is fully customizable to align with your brand’s aesthetics. Whether pitching to stakeholders, potential investors, or internal teams, this presentation ensures your proposal is structured, impactful, and engaging. Save time and leave a lasting impression with this professional design, suitable for any new product launch.


6 slides
Social Psychology Infographic
Social psychology is a branch of psychology that focuses on how individuals' thoughts, feelings, and behaviors are influenced by their social interactions and the social environment. These infographics explore various concepts and principles of social psychology. This template is designed to provide a comprehensive overview of the fascinating field of social psychology and its relevance to understanding human behavior in social contexts. The template provides practical tips and strategies based on social psychology research for improving social interactions, communication skills, and building positive relationships.


4 slides
Insurance Market Trends
Track and present evolving market dynamics with this Insurance Market Trends presentation. Featuring clean, multi-point visual elements, this slide set is perfect for analysts, consultants, and insurance professionals aiming to highlight growth segments, percentages, or trend categories. Fully editable in PowerPoint, Keynote, and Google Slides.


5 slides
Yearly Employee Performance Review Presentation
Celebrate your team’s progress with a modern, data-rich design that’s clear, visual, and professional. This template makes it easy to present yearly performance metrics, individual achievements, and growth comparisons through engaging charts and infographics. Perfect for annual reports and reviews. Compatible with PowerPoint, Keynote, and Google Slides for effortless editing.


6 slides
South America Language Map Infographics
South America is located in the Western Hemisphere and is known for its diverse landscapes, cultures, and countries. This infographic template can provide a visual representation of the countries and key information about the continent's geography, culture, economy, and more. This template is designed to help your audience gain insights into the diverse and rich continent, making it a valuable tool for educational, promotional, and informative purposes. This map infographic can be shared on websites, social media platforms, presentations, and marketing materials targeting audiences interested in South America.


10 slides
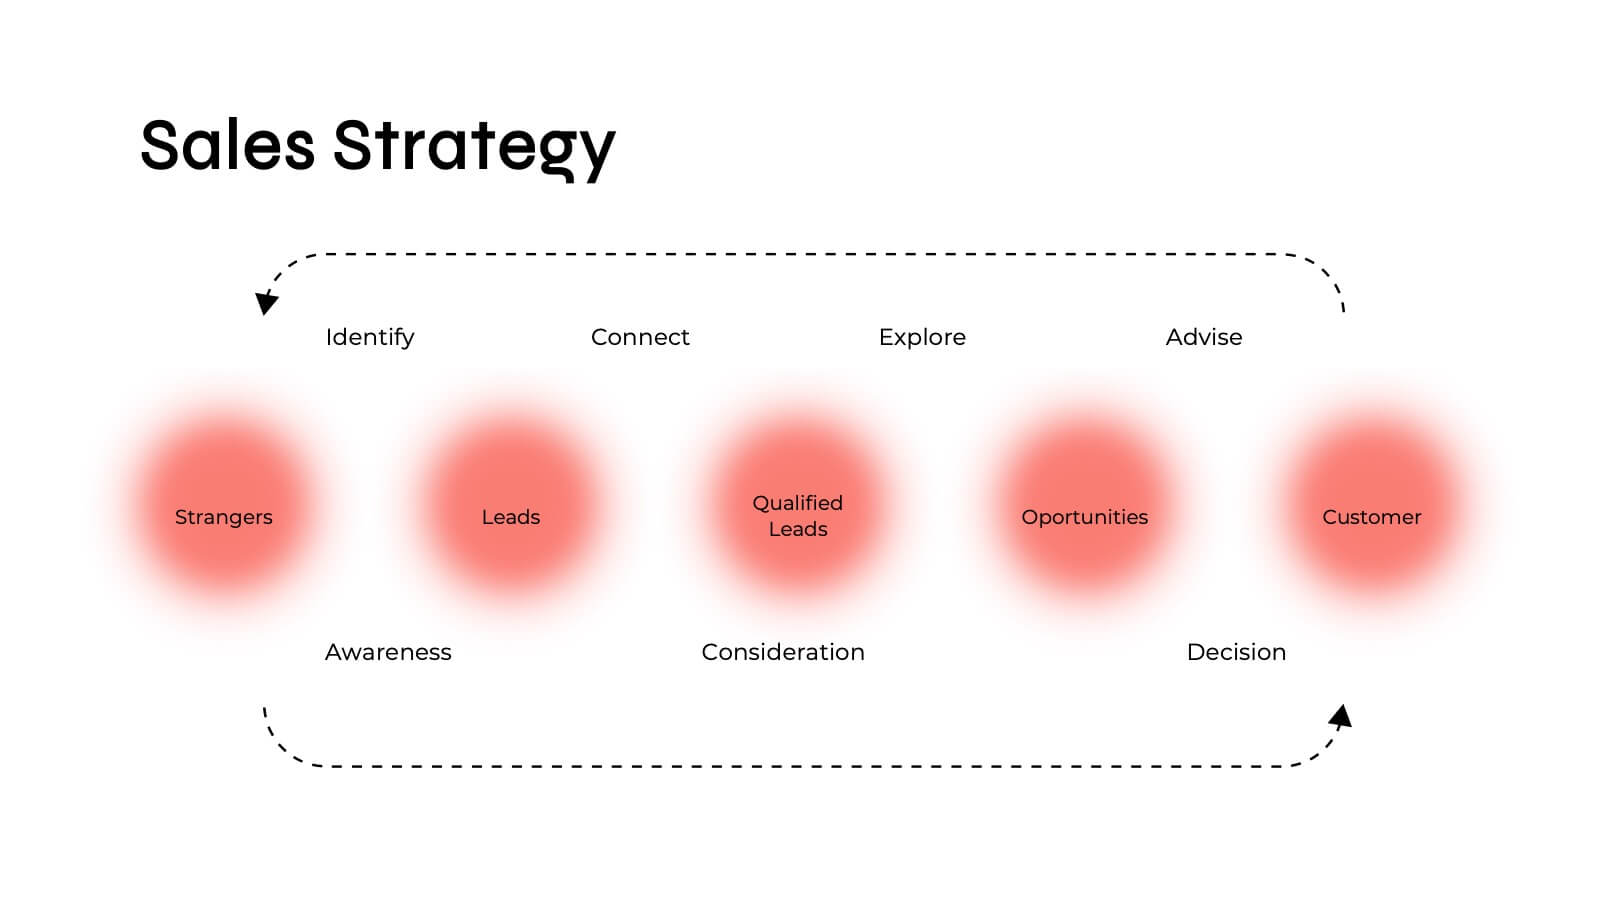
Business Growth through Target Market Analysis Presentation
Showcase how strategic insights drive expansion with this step-by-step infographic. Designed with layered growth icons and space for titles and text, this layout helps illustrate the phases of market targeting, consumer profiling, and sales development. Perfect for marketing strategies, business development roadmaps, and client presentations. Fully customizable in PowerPoint, Keynote, and Google Slides


8 slides
Social Media Engagement Report Presentation
Deliver impactful campaign reviews with the Social Media Engagement Report Presentation. This dynamic layout uses a megaphone visual to amplify your messaging and organize engagement data into four key segments. Perfect for tracking audience reactions, measuring reach, or presenting content performance. Compatible with PowerPoint, Keynote, and Google Slides for seamless customization.


7 slides
Housing Investment Strategy Presentation
Visualize housing strategies with this clean, key-focused layout. Featuring a central house-and-key icon flanked by six sections, this slide is perfect for outlining investment stages, market insights, or project milestones. Fully editable in Canva, PowerPoint, and Google Slides—ideal for real estate professionals, developers, or analysts presenting actionable housing strategies.


7 slides
Law and Compliance Presentation
Bring order and precision to your reports with this modern, structured layout designed to simplify complex regulations and policies. Perfect for presenting legal processes, compliance updates, or governance strategies, it blends professionalism with clarity. Fully compatible with PowerPoint, Keynote, and Google Slides for seamless editing and presentation flexibility.