


Features
- 6 Unique slides
- Fully editable and easy to edit in Microsoft Powerpoint, Keynote and Google Slides
- 16:9 widescreen layout
- Clean and professional designs
- Export to JPG, PDF or send by email


Do you have any questions?
Recommend


21 slides
Helix Full-Service Agency Project Plan Presentation
Showcase your agency's expertise with this sophisticated, minimalistic presentation template. Designed to present comprehensive market analysis, strategy development, and client success stories, this template ensures your agency's capabilities are clearly communicated. Its clean design and professional layout make it perfect for building trust and credibility. Compatible with PowerPoint, Keynote, and Google Slides, it's versatile for any platform.


22 slides
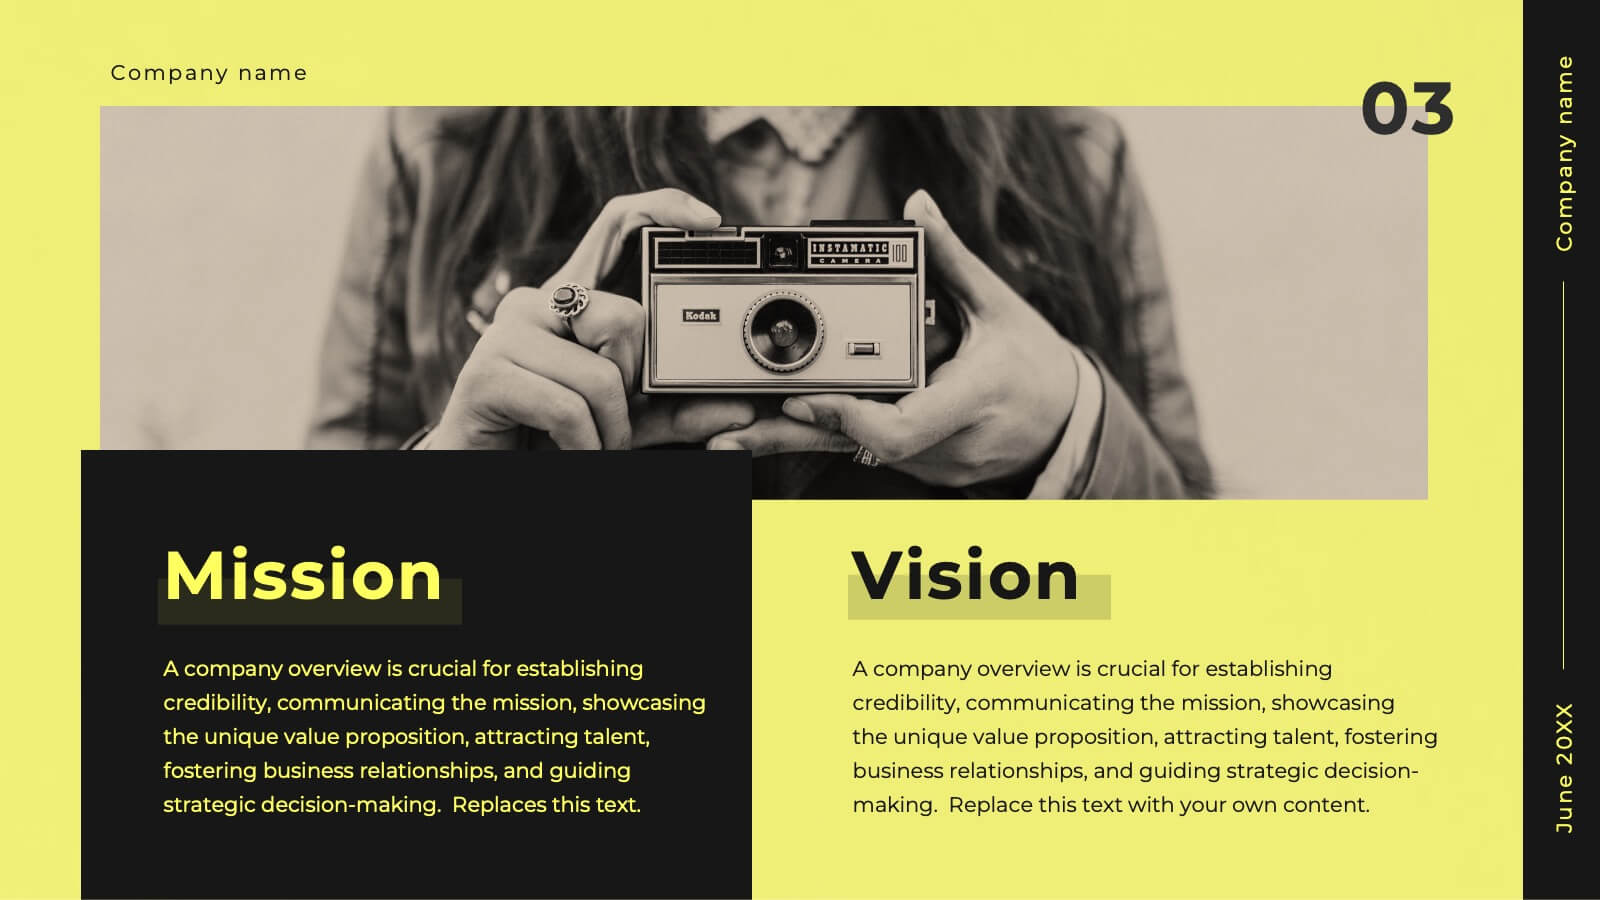
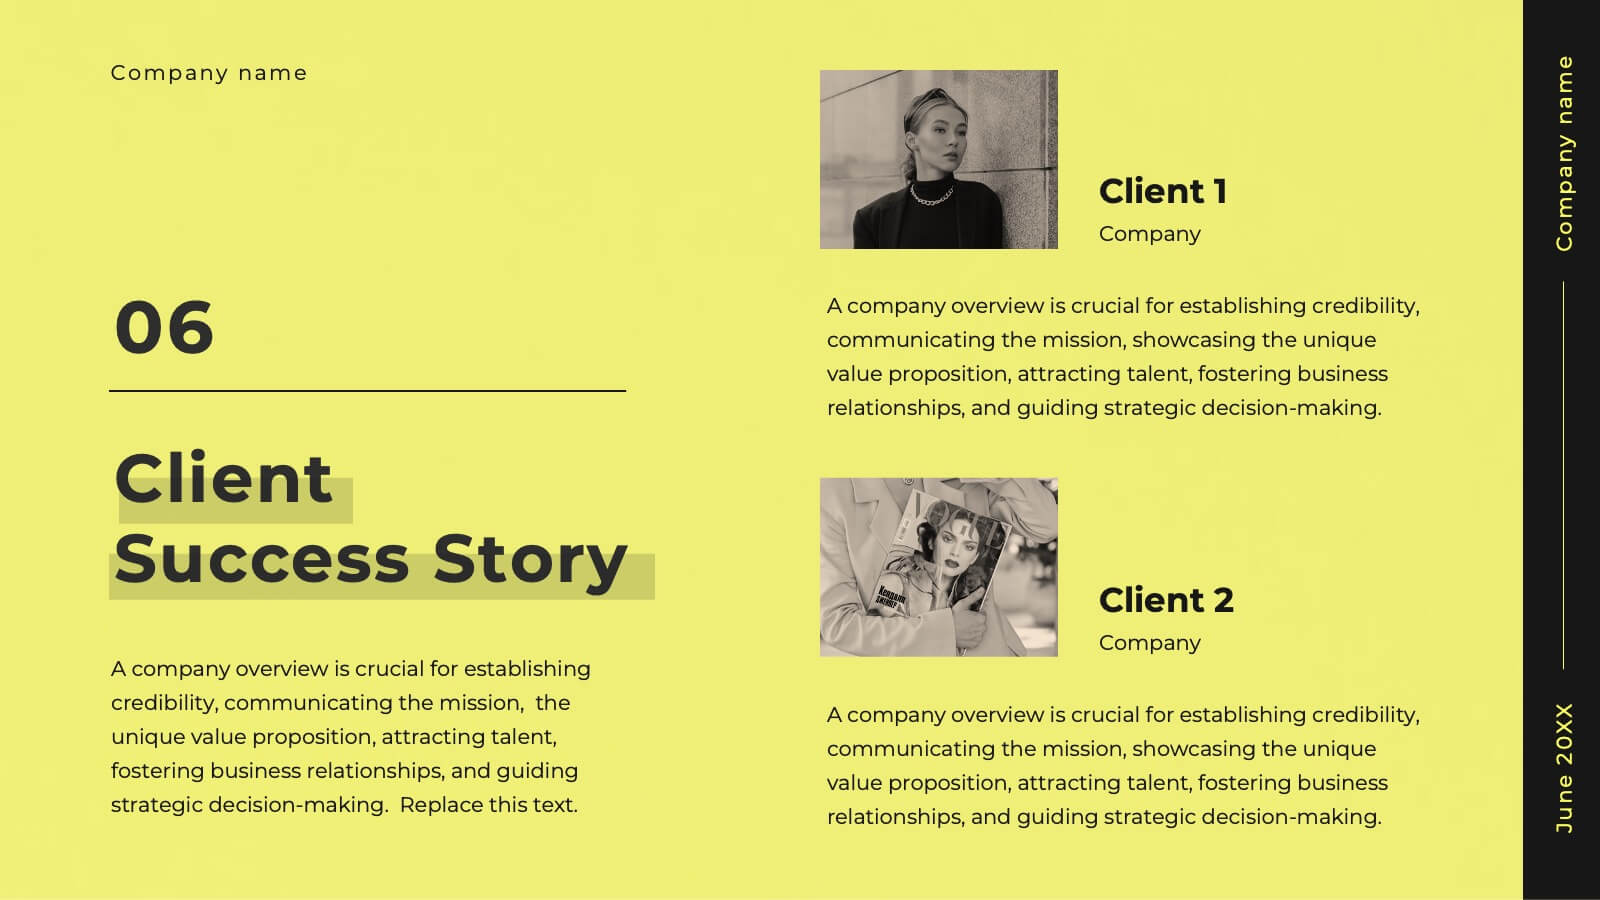
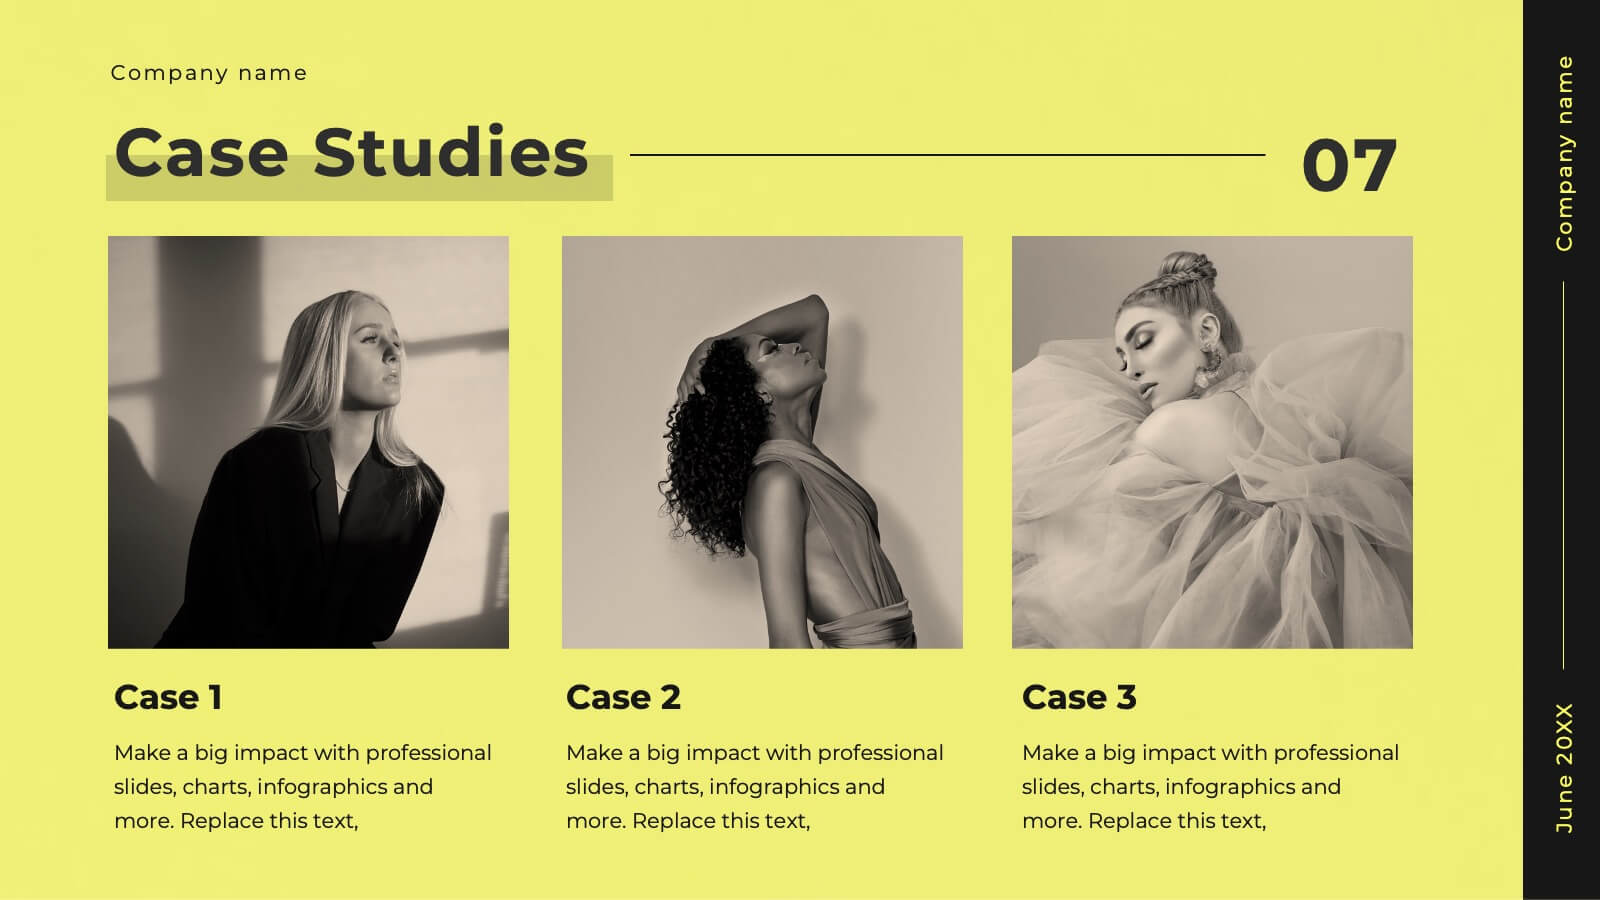
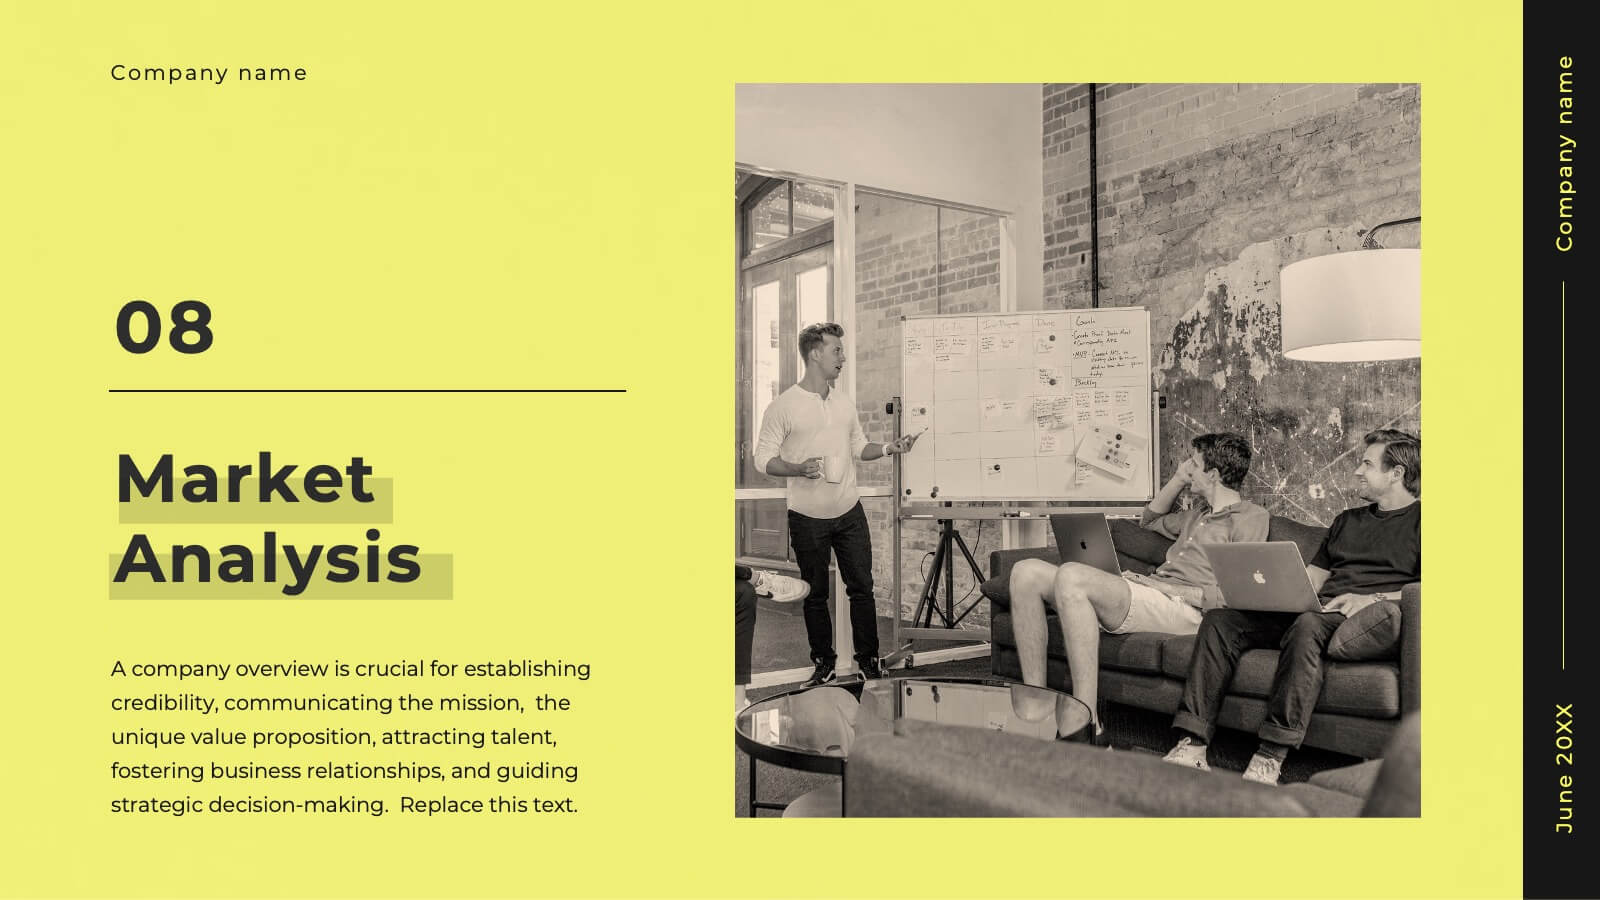
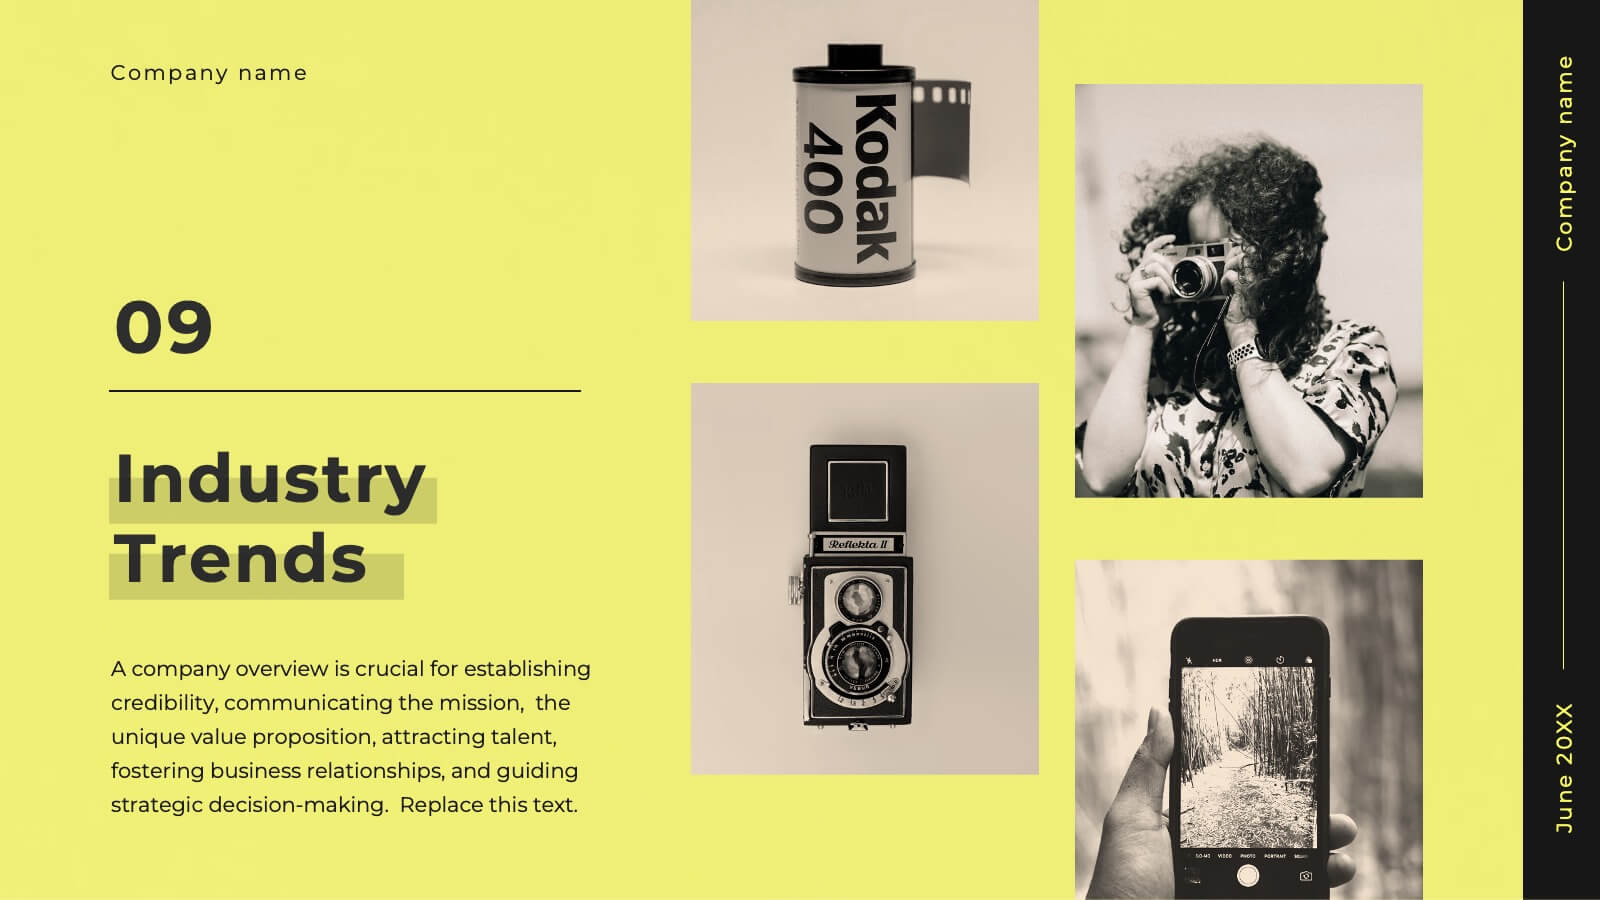
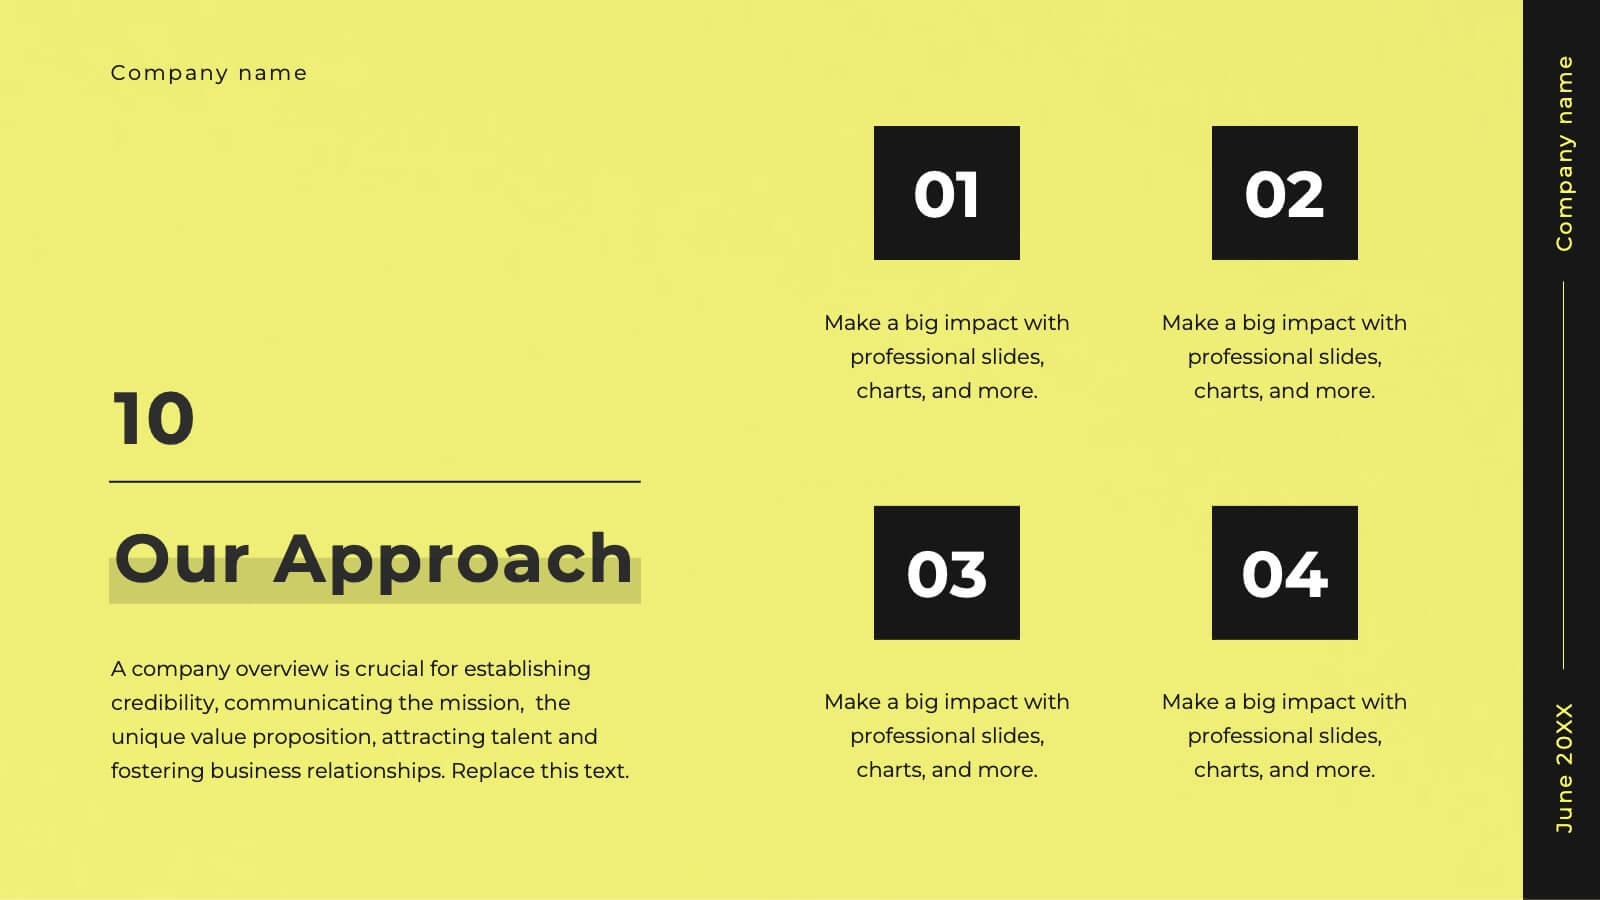
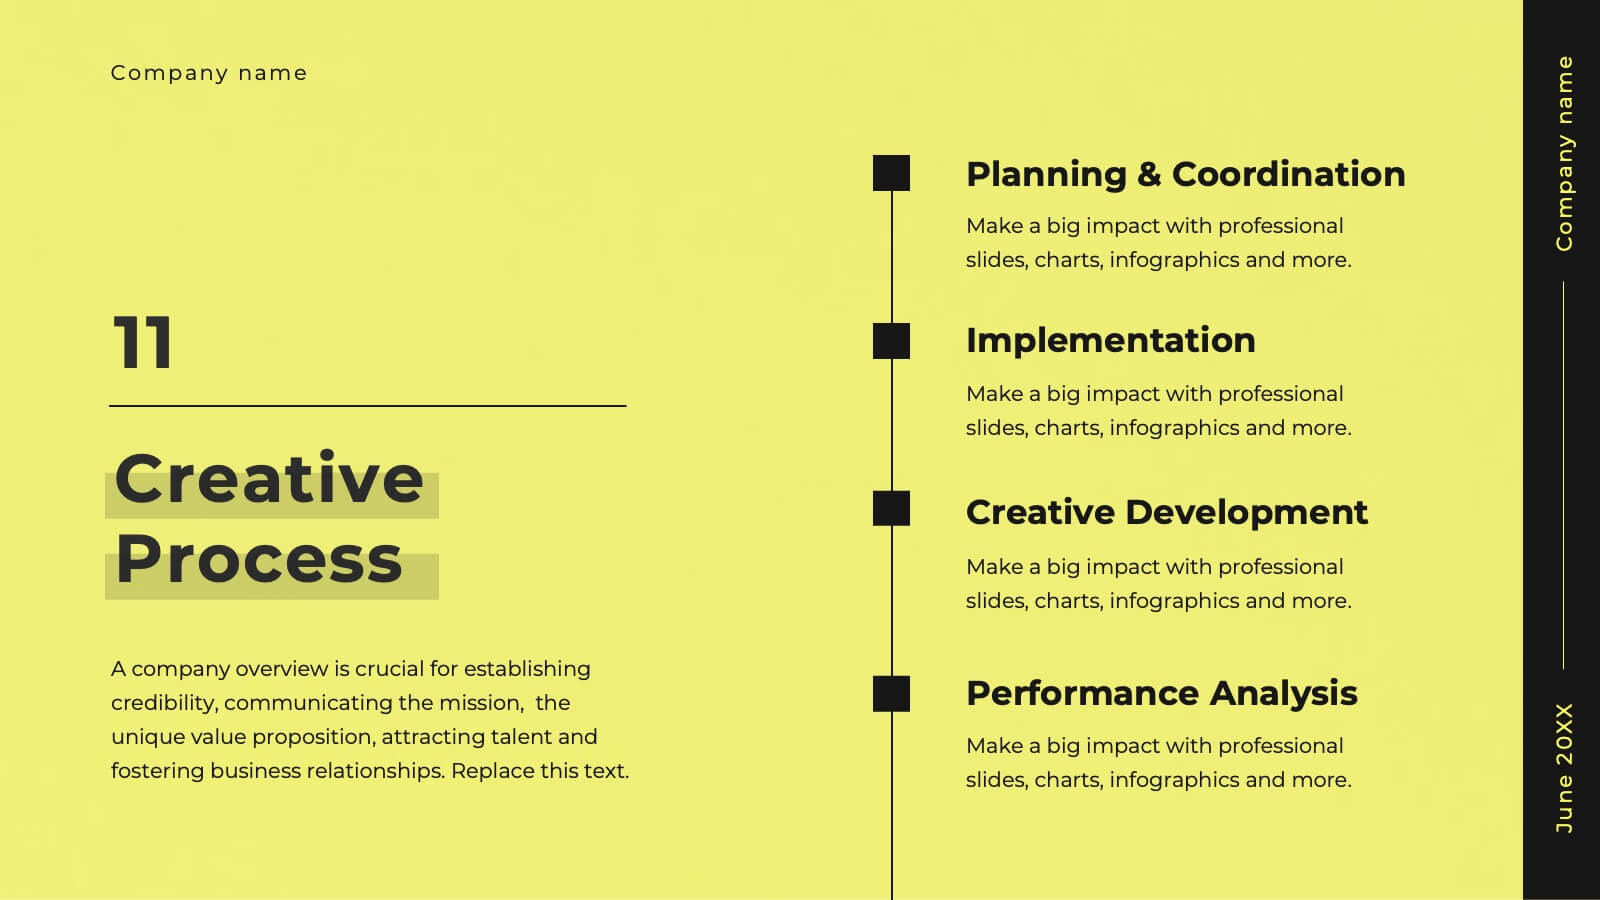
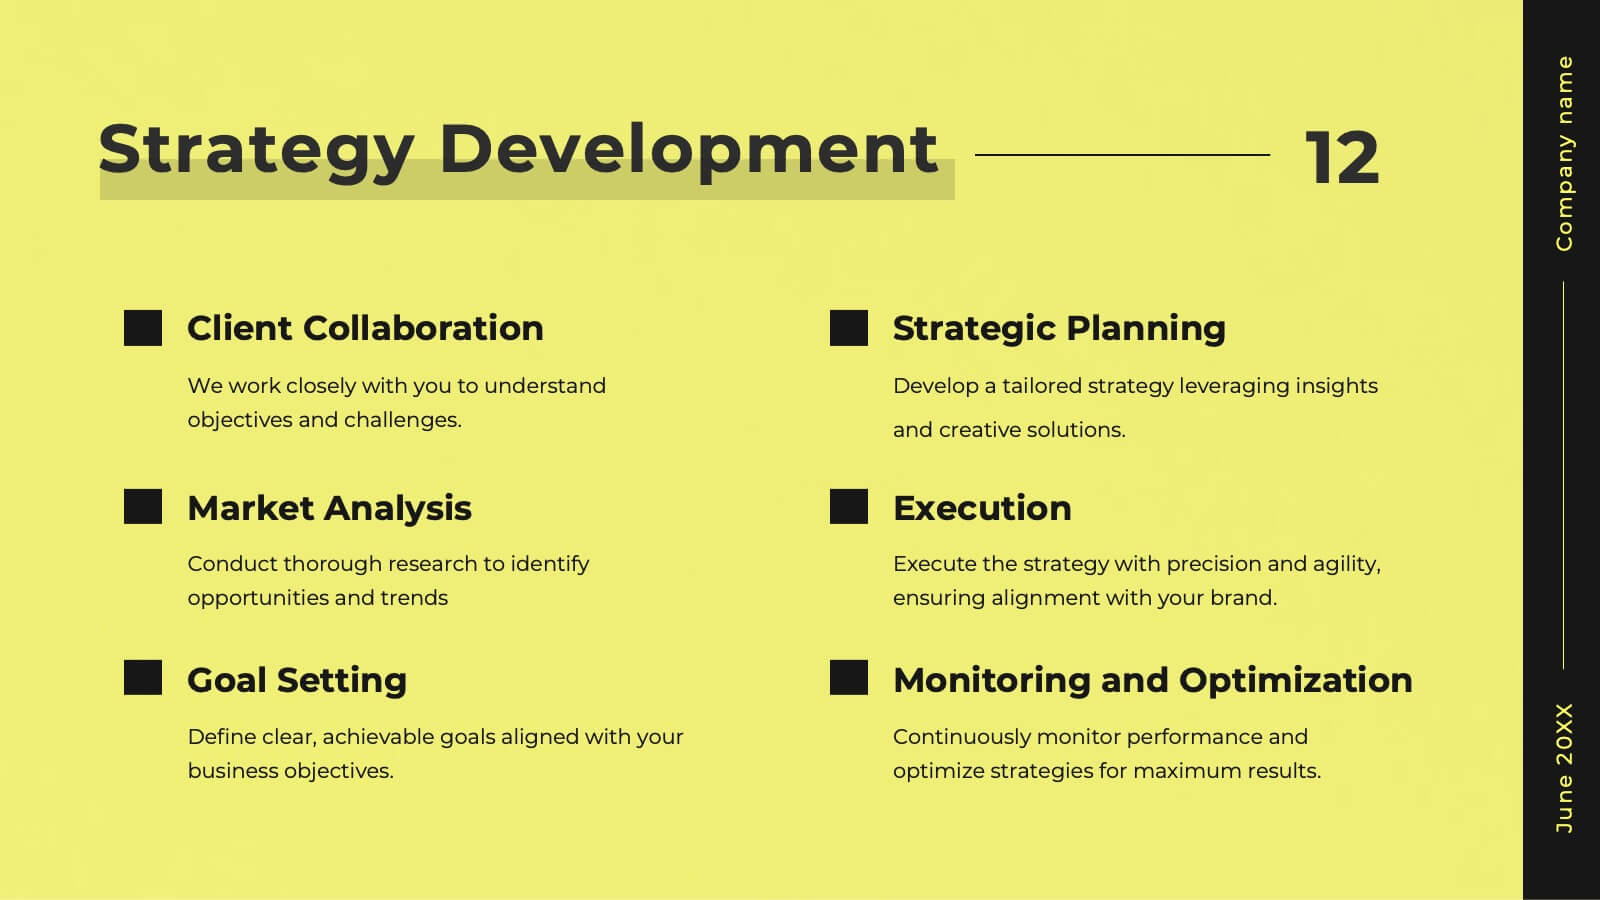
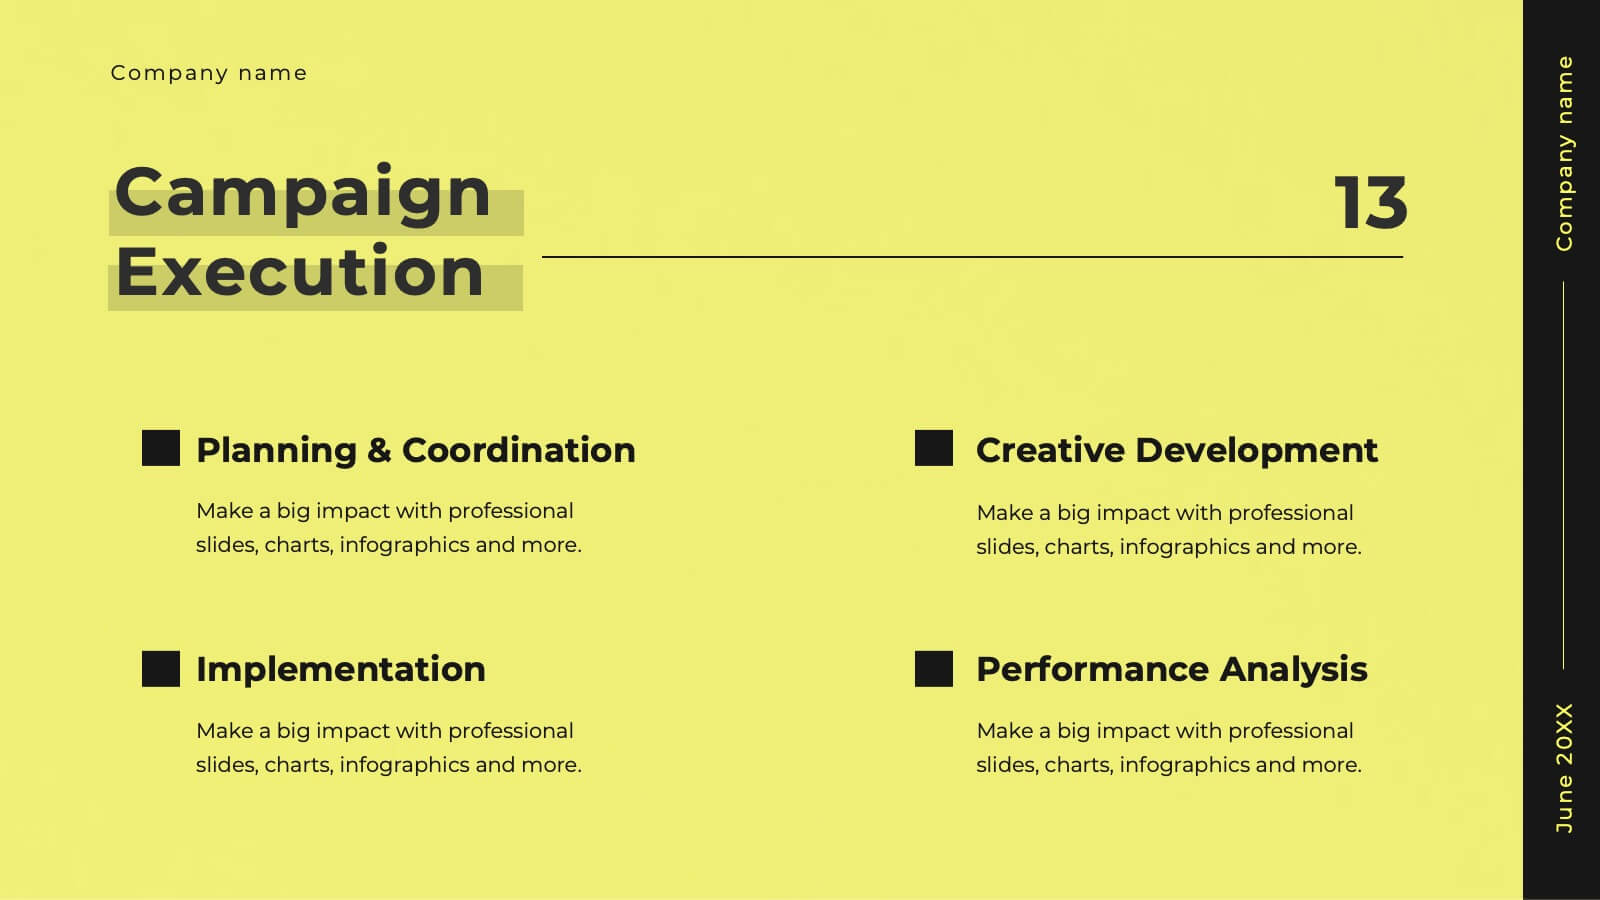
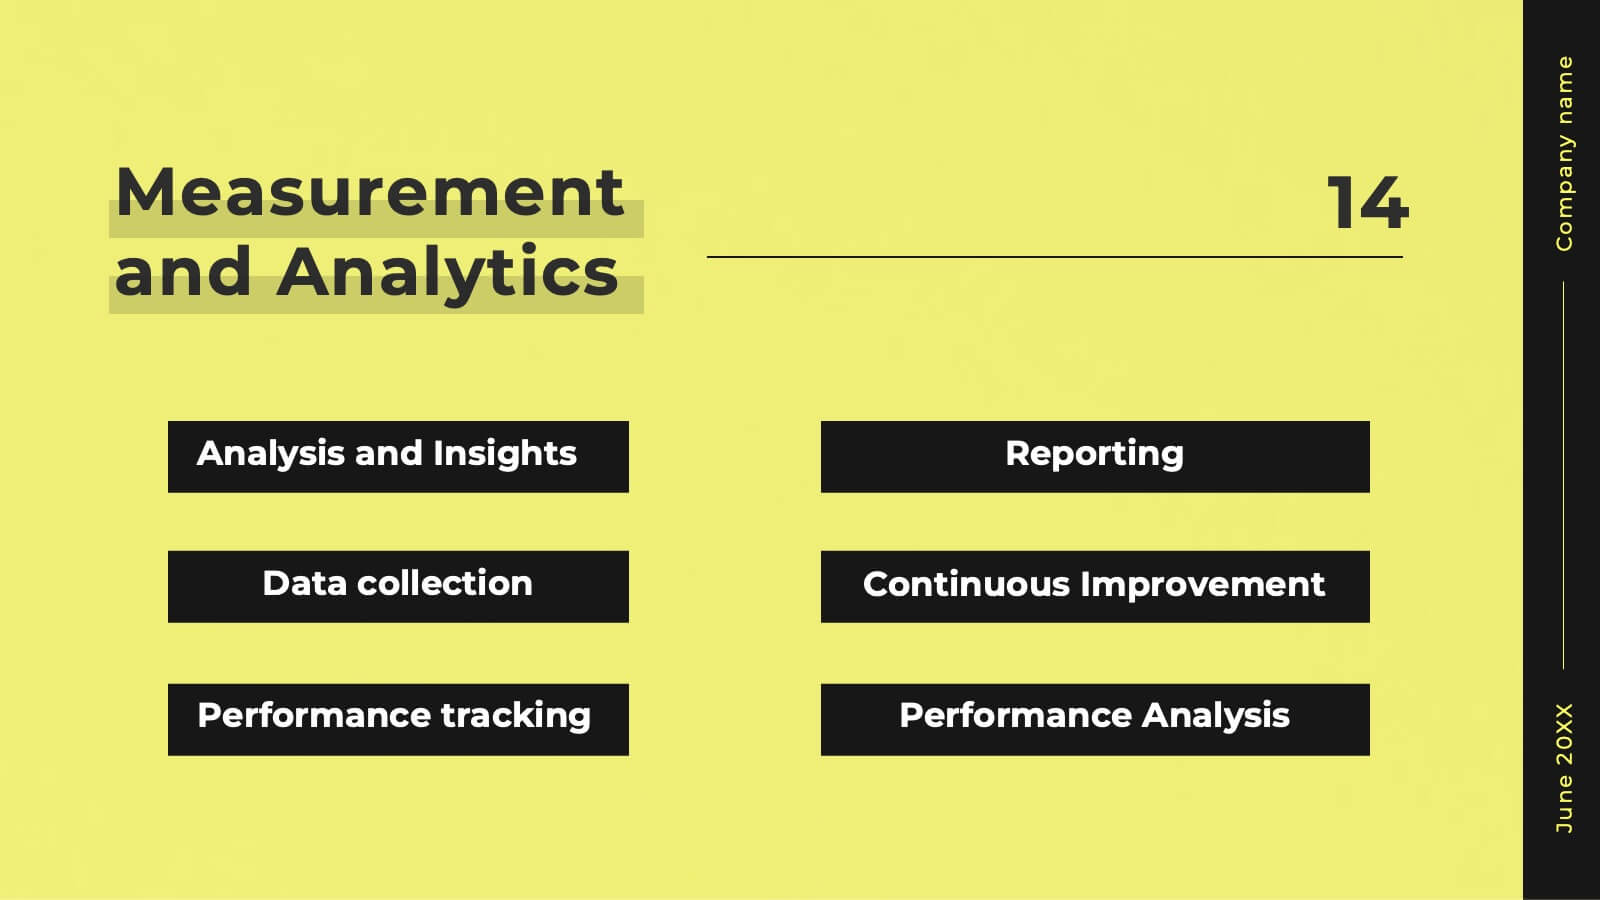
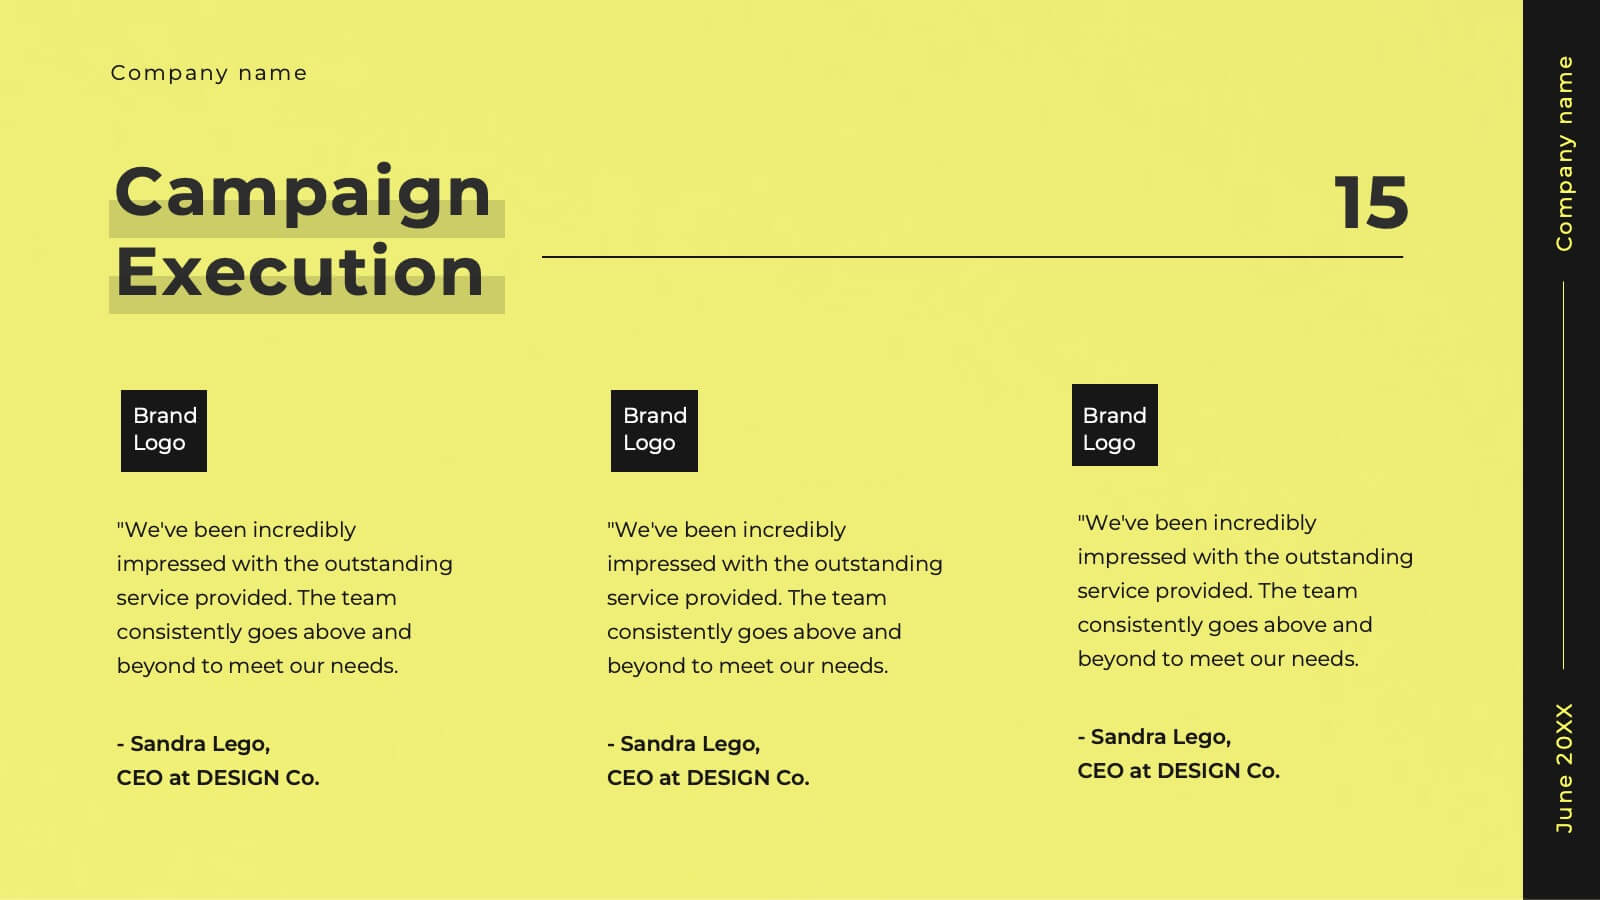
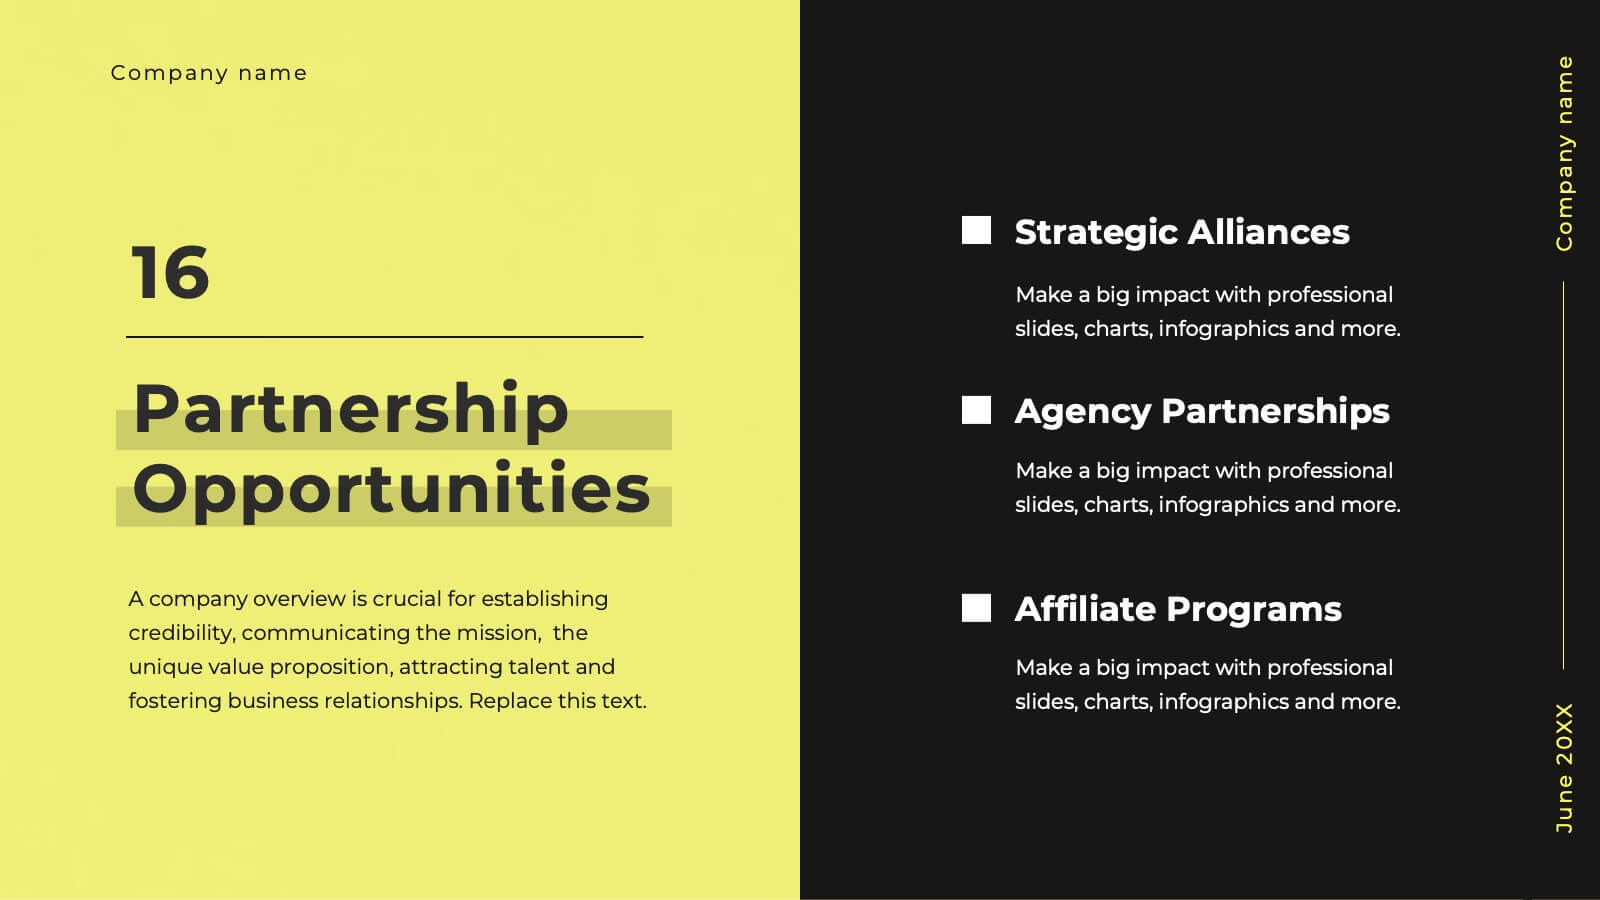
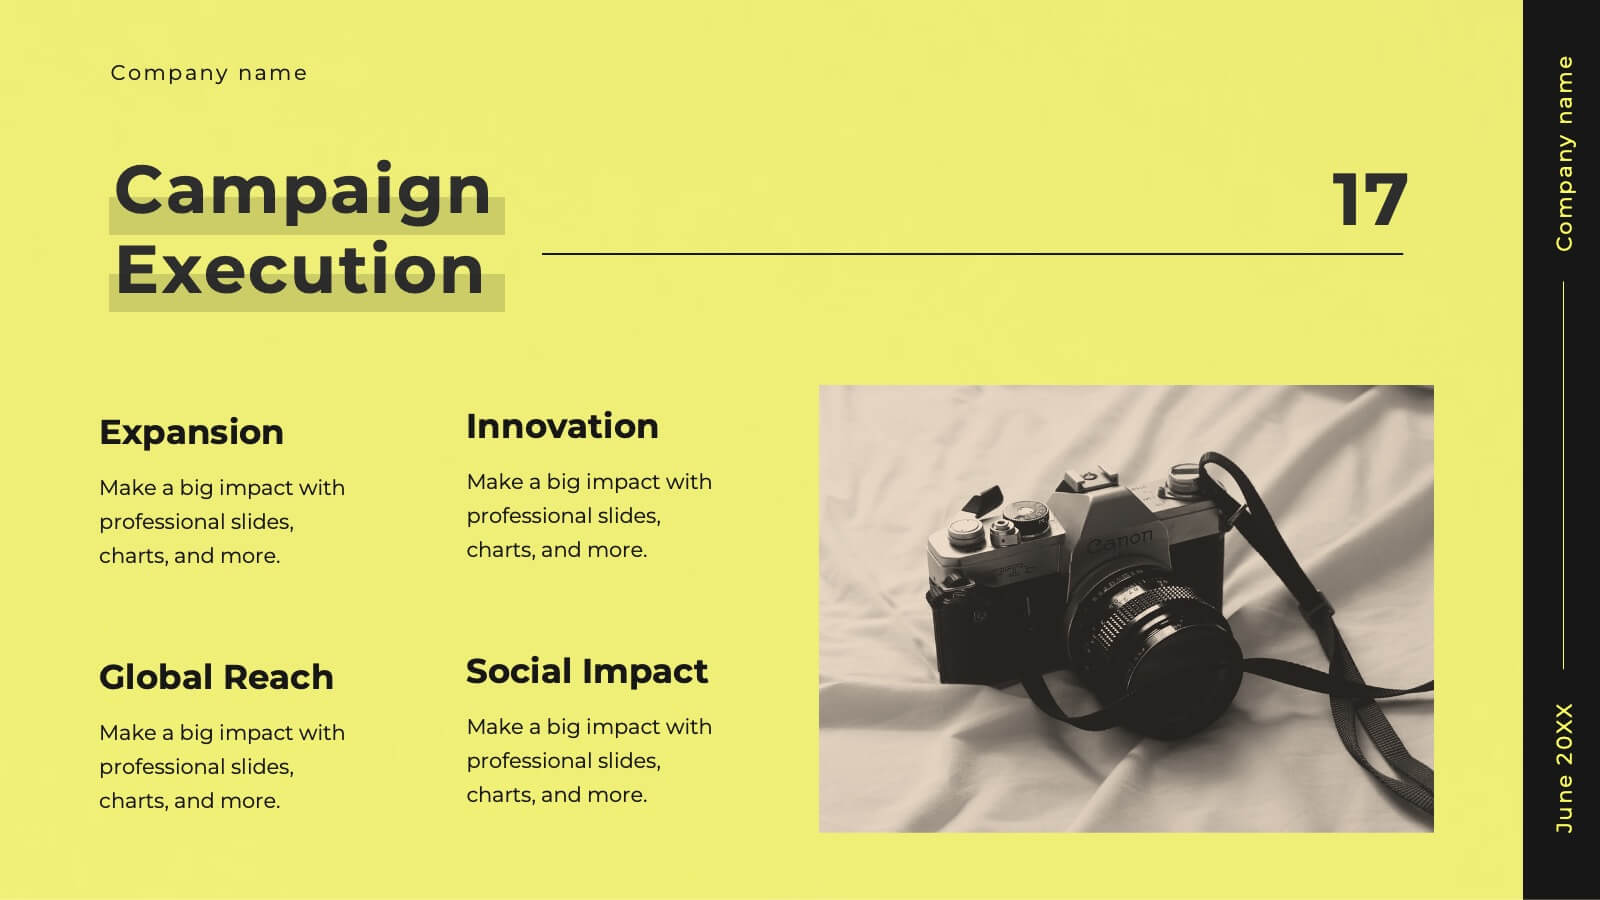
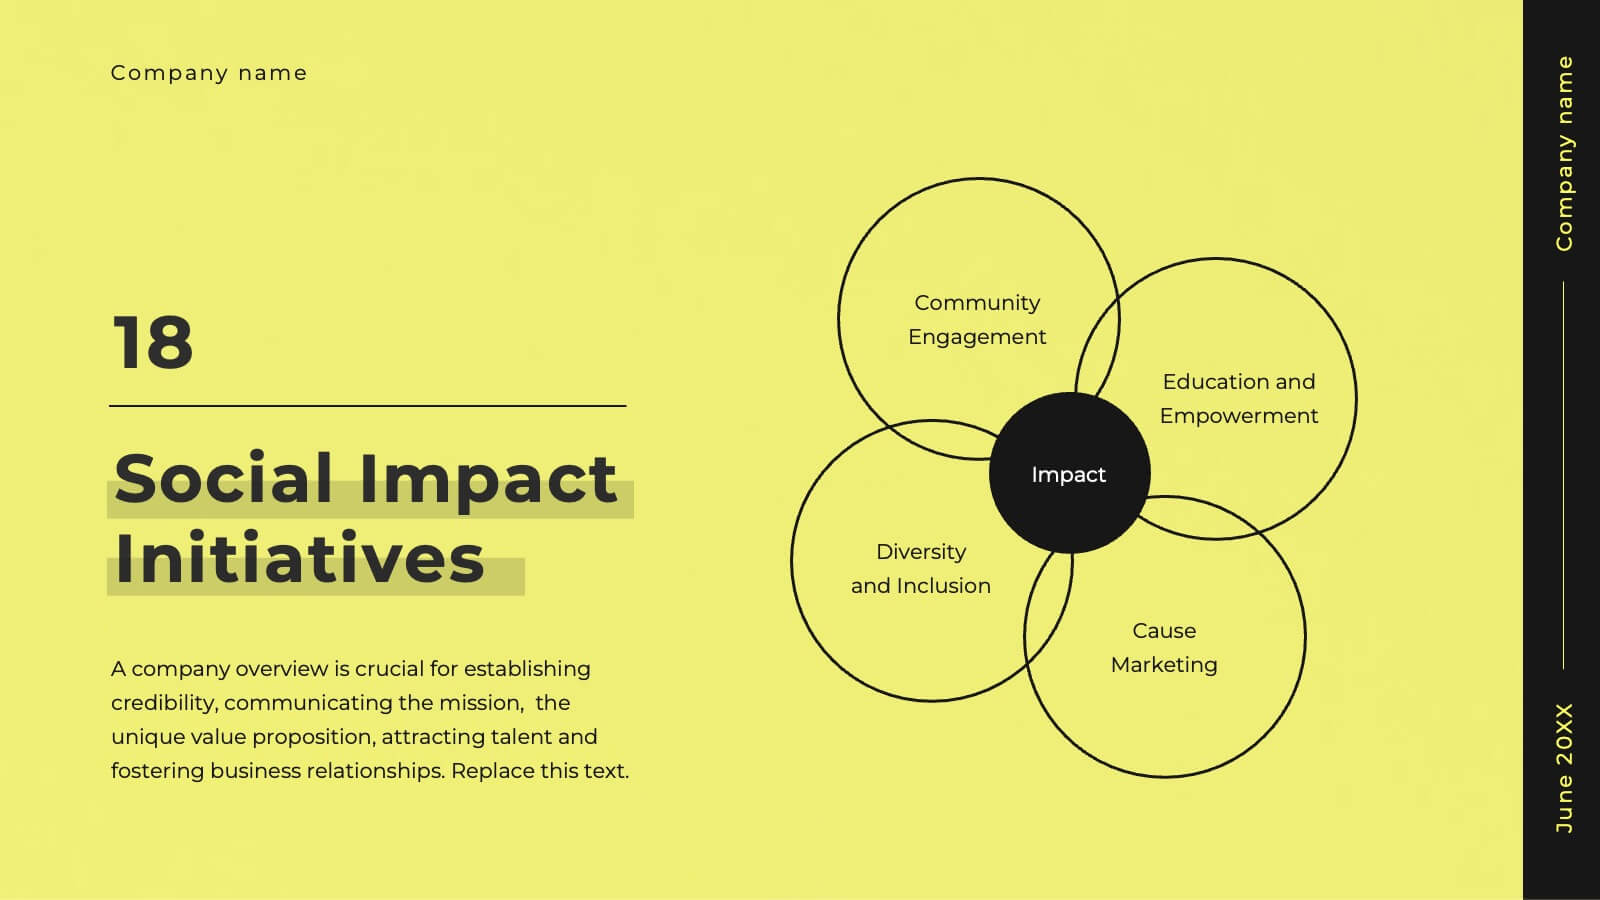
Mistgrove Digital Agency Strategy Plan Presentation
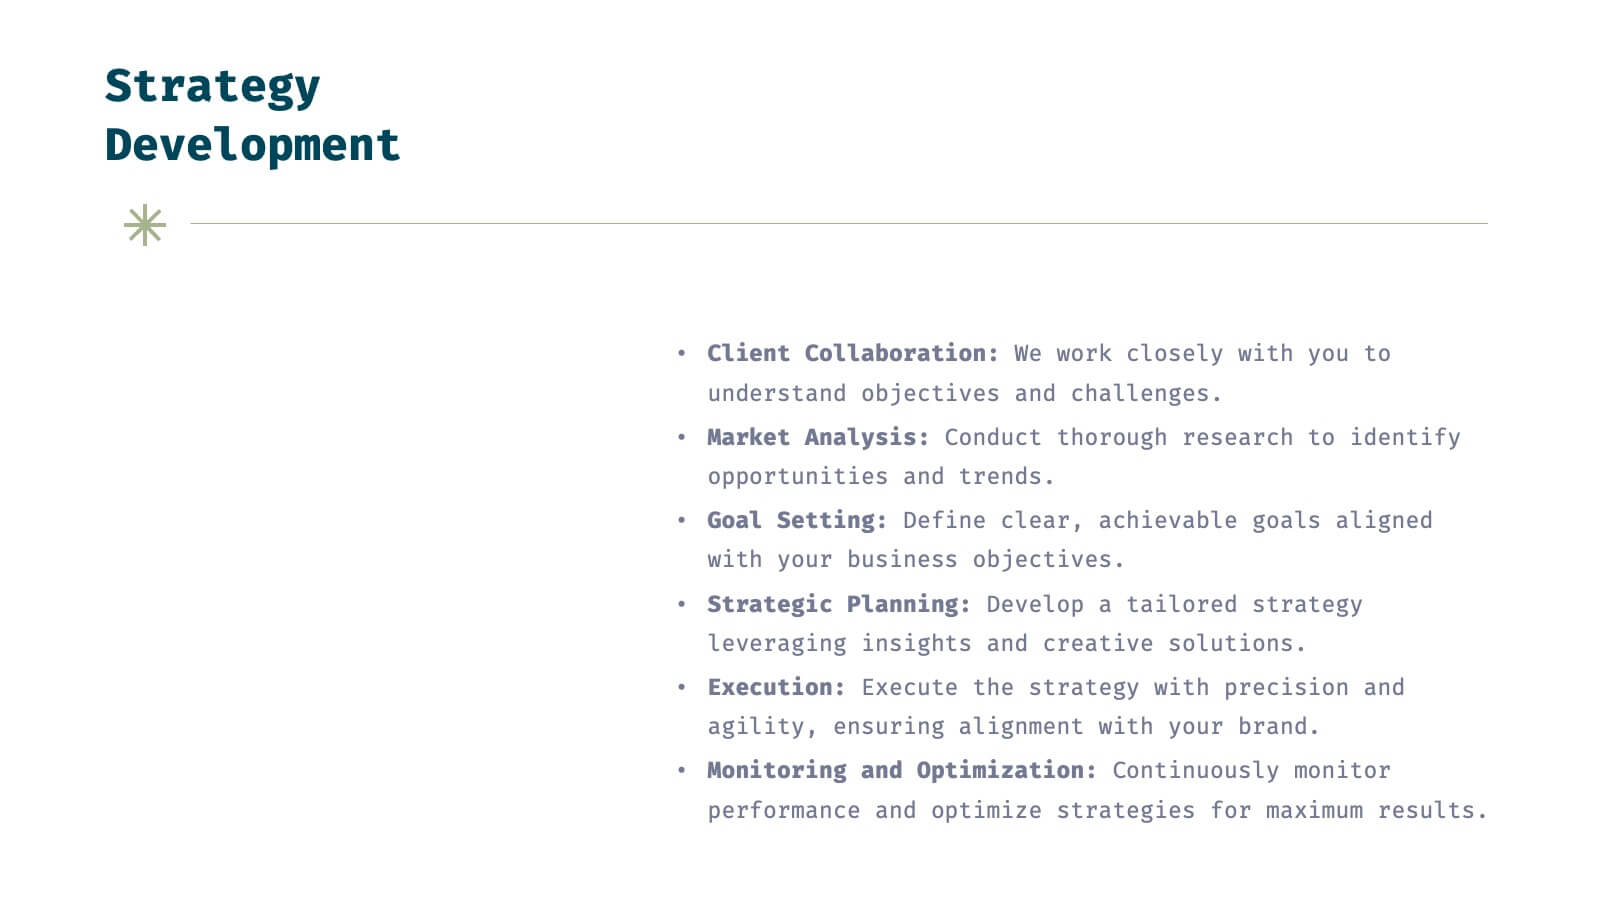
Craft an impactful strategy for your digital agency with this sleek and professional presentation template. Highlight your agency's mission, vision, and services while showcasing success stories through client testimonials and case studies. Dive into essential sections like market analysis, industry trends, and competitive positioning to communicate a forward-thinking strategy effectively. This template includes dedicated slides for creative processes, strategy development, and campaign execution, ensuring you present your approach clearly and confidently. With options for measurement and analytics, future outlooks, and social impact initiatives, it empowers you to convey the value and growth potential of your strategies. Fully compatible with PowerPoint, Google Slides, and Keynote, this template offers seamless customization to align with your agency's unique brand identity and goals.


6 slides
Strategic Planning with PESTEL Presentation
Dive into comprehensive environmental scanning with our "Strategic Planning with PESTEL" presentation template. This layout meticulously breaks down Political, Economic, Social, Technological, Environmental, and Legal factors, enabling thorough market analysis and strategy formulation. Perfect for strategists and analysts, the template supports PowerPoint, Keynote, and Google Slides, facilitating a dynamic and engaging planning session.


6 slides
Commercial Real Estate Infographics
Explore the world of Commercial Real Estate with our customizable infographic template. This template is fully compatible with popular presentation software like PowerPoint, Keynote, and Google Slides, allowing you to easily customize it to illustrate and communicate various aspects of commercial real estate. The Commercial Real Estate infographic template offers a visually engaging platform to outline the different types of commercial properties, investment strategies, market trends, and the benefits of investing in commercial real estate. Whether you're a real estate professional, investor, business owner, or simply interested in the world of commercial properties, this template provides a user-friendly canvas to create informative presentations and educational materials. Deepen your knowledge of Commercial Real Estate with this SEO-optimized infographic template, thoughtfully designed for clarity and ease of use. Customize it to showcase property types (e.g., office, retail, industrial), financing options, risk management, and the potential for income and growth, ensuring that your audience gains valuable insights into this lucrative sector. Start crafting your personalized infographic today to explore the realm of Commercial Real Estate.


6 slides
Risk Management Jobs Infographics
Our Risk Management Jobs infographic is meticulously crafted for Powerpoint, Keynote, and Google Slides, providing a valuable resource for HR professionals, risk consultants, and corporate trainers. This infographic is designed to delineate various job roles within the risk management field, detailing responsibilities, qualifications, and career paths. The infographic outlines the hierarchy and scope of positions, ranging from entry-level risk analysts to chief risk officers, and includes essential information on the skill sets and expertise required for each role. By presenting this data in a visually engaging format, the infographic simplifies the complexity of risk management career structures. Incorporating this infographic into career development workshops, job fairs, or internal training sessions will enhance understanding of the professional opportunities within risk management. It can also serve as a guide for those looking to advance in the field, providing clarity on the progression and specializations available. Use this infographic to effectively communicate the diverse range of roles and career trajectories in risk management.


7 slides
Stock Market Futures Infographic
The stock market, also known as the equity market or share market, is a platform where buying, selling, and issuing shares of publicly-held companies take place. This infographic template serves as your compass through the intricate landscape of stocks and futures, empowering you with the knowledge to steer your investments towards a prosperous horizon. Compatible with Powerpoint, Keynote, and Google Slides. The striking visualizations present the clash between the bullish and bearish market forces, symbolizing the constant struggle that drives market movements. Easily showcase the latest stock prices with this template.


6 slides
IT Infrastructure and Services Management Presentation
Visualize key operations clearly with the IT Infrastructure and Services Management Presentation. This slide features a circular diagram paired with five editable content blocks—perfect for mapping infrastructure elements like networks, servers, and tools. The icon-ring design adds clarity and structure to complex workflows. Fully compatible with PowerPoint, Keynote, and Google Slides.


4 slides
Regional Economic Evolution in Asia Map Presentation
Track economic progress across Asia with this regional growth map. Each country is paired with a progress bar for visual comparison of growth indicators. Ideal for data-driven insights, economic reviews, or development updates. Editable in PowerPoint, Keynote, and Google Slides for seamless customization and professional, geography-based presentations.


4 slides
Types of Insurance Policies Comparison Presentation
Highlight key differences between insurance policies using this shield-themed comparison slide. With space for six categories and clear icon-label pairs, it’s perfect for showcasing coverage types or plan tiers. Fully editable in PowerPoint, Keynote, and Google Slides—ideal for agents, brokers, or internal training on policy features.


5 slides
Economic Analysis of North America Map Presentation
The Economic Analysis of North America Map template provides a focused visual tool for displaying economic data across different regions. With dedicated spots for key statistics and trends, this template enhances presentations with clear, data-driven insights. It is designed to be user-friendly and is compatible with PowerPoint, Keynote, and Google Slides.


4 slides
Financial KPI Analysis Presentation
Present key financial metrics with clarity using the Financial KPI Analysis slide. This layout highlights four essential indicators—MRR, Customer Count, Gross Profit Margin, and NPM—each with colorful data blocks and corresponding mini charts. A dynamic line graph and column chart provide deeper insight into monthly and categorical performance. Fully editable in PowerPoint, Keynote, and Google Slides for streamlined reporting.


6 slides
Bubble Map Ideas Infographics
Visualize your ideas creatively with our Bubble Map Ideas infographic template. This template is fully compatible with popular presentation software like PowerPoint, Keynote, and Google Slides, allowing you to easily customize it to brainstorm and organize your concepts using a bubble map format. The Bubble Map Ideas infographic template offers a visually engaging platform to brainstorm and categorize ideas, concepts, and relationships in a structured and visually appealing manner. Whether you're a creative thinker, project manager, or educator, this template provides a user-friendly canvas to create informative presentations and visualizations of your ideas. Elevate your idea generation and organization with this SEO-optimized Bubble Map Ideas infographic template, thoughtfully designed for clarity and ease of use. Customize it to map out your ideas, prioritize them, and identify key connections, ensuring that your creative process becomes more organized and productive. Start crafting your personalized infographic today to bring your ideas to life.


10 slides
AIDA Model Explained with Graphics Presentation
Bring your message to life with a dynamic visual flow that guides viewers through each stage of your communication strategy in a clear, compelling way. This presentation breaks complex concepts into simple steps, helping audiences follow your narrative effortlessly. Fully customizable and compatible with PowerPoint, Keynote, and Google Slides.


4 slides
Service Plan Pricing Matrix Presentation
Present your pricing options clearly with this Service Plan Pricing Matrix Presentation. Designed for easy comparison, this layout highlights four tiers—Basic, Standard, Professional, and Expert—with bold pricing, checklists, and CTA buttons. Ideal for service providers, SaaS, and agencies. Fully editable in Canva, PowerPoint, Keynote, and Google Slides.


6 slides
Business Value Proposition Presentation
Ignite your strategy with this captivating template that highlights your unique business value. This tool breaks down key value propositions, market differentiators, and customer benefits in an engaging format. Perfect for pitching ideas, it clarifies competitive advantages and growth opportunities. Compatible with PowerPoint, Keynote, and Google Slides for seamless presentations.


5 slides
Brainstorming Session Diagram Presentation
Spark creativity and structure your next idea session with the Brainstorming Session Diagram Presentation. Featuring a central brain icon and four labeled input areas, this layout makes it easy to visualize and organize group contributions. Fully editable in PowerPoint, Canva, and Google Slides for seamless collaboration and customization.


22 slides
Glimmer Creative Agency Pitch Deck Presentation
Step up your game with this vibrant agency pitch deck template! Ideal for showcasing your services, client success stories, and strategic approach, it includes dynamic slides for market analysis and campaign execution. Engage potential clients with compelling visuals and well-organized content. Compatible with PowerPoint, Keynote, and Google Slides for a smooth presentation experience on any platform.