


Features
- 4 Unique slides
- Fully editable and easy to edit in Microsoft Powerpoint, Keynote and Google Slides
- 16:9 widescreen layout
- Clean and professional designs
- Export to JPG, PDF or send by email


Do you have any questions?
Recommend


6 slides
Business Mission Statement Presentation
Here is a vivid "Business Mission Statement" presentation template tailored to elucidate your company's core objectives and strategic goals. This template features a unique brain-design interface that symbolizes thought leadership and innovative thinking, ideal for sharing insights that resonate deeply with your team or stakeholders. Compatible with PowerPoint, Keynote, and Google Slides, it's the perfect tool for broadcasting your mission with clarity and impact.


5 slides
Enterprise IT System Design Presentation
Create a professional Enterprise IT System Design presentation with this structured diagram. Ideal for showcasing IT infrastructure, system architecture, data flow, and integration strategies, this fully customizable template is compatible with PowerPoint, Keynote, and Google Slides.


10 slides
Growth Strategy in Four Steps Presentation
Achieve sustainable business expansion with the Growth Strategy in Four Steps presentation. This structured template guides teams through progressive development phases, using clear visuals to illustrate key milestones and percentage-based improvements. Ideal for entrepreneurs, marketers, and business strategists, this slide layout is fully customizable and compatible with PowerPoint, Keynote, and Google Slides for seamless integration into your workflow.


6 slides
Annual Report Company Infographic
An annual report is a comprehensive document that provides an overview of a company's performance and financial activities over the course of a year. This Infographic template is a great way to present key highlights, accomplishments, and data from a year in a visually engaging and concise format. Designing an Annual Report Infographic can effectively convey the year's achievements and progress to stakeholders, investors, clients, and employees in a visually compelling and concise manner. This is designed to gather feedback from colleagues, team members, or stakeholders and make any necessary revisions to enhance the clarity and impact of the infographic.


4 slides
Business Growth in Numbers Presentation
Showcase business performance with the Business Growth in Numbers Presentation template. Designed for sales reports, financial reviews, and market analysis, this template includes visualized statistics, percentage comparisons, and trend graphs to highlight key growth metrics. Fully customizable and compatible with PowerPoint, Keynote, and Google Slides, it ensures clear and compelling data storytelling.


4 slides
Marketing KPI Dashboard Presentation
Visualize marketing performance at a glance with this Marketing KPI Dashboard Presentation. Designed with a modern funnel graphic and monthly performance bars, this slide highlights key metrics such as audience reach, engagement rate, conversion rate, and campaign effectiveness. Color-coded indicators make insights easy to interpret. Ideal for marketing teams, strategy updates, and performance reviews. Fully customizable in PowerPoint, Keynote, and Google Slides.


20 slides
Quasar Design Strategy Proposal Presentation
Elevate your design strategy presentations with this modern, engaging template. Perfect for showcasing design briefs, concept development, and project timelines, it features a sleek layout with a cohesive color scheme. Highlight key elements like typography, textures, and feedback processes to captivate your audience. Compatible with PowerPoint, Keynote, and Google Slides, it ensures seamless presentations on any platform.


6 slides
Detailed Case Analysis Report Presentation
Turn complex findings into a clear and engaging story with this modern, data-focused layout. Ideal for professionals presenting research, performance reviews, or audit results, it helps you organize insights with precision and clarity. Fully editable and compatible with PowerPoint, Keynote, and Google Slides for effortless customization and presentation delivery.


6 slides
Ecological Sustainability Goals Presentation
Bring your environmental vision to life with a clean, uplifting layout that guides audiences through key sustainability milestones. This presentation helps you explain eco-focused goals, long-term impact, and actionable strategies in a simple, structured way that’s easy to follow. Fully compatible with PowerPoint, Keynote, and Google Slides.


4 slides
Interlocking Puzzle Chart Design Presentation
Unlock big ideas with a visual design that clicks your concepts together like a seamless 3D puzzle. This presentation makes it easy to explain connected processes, relationships, or strategic components in a clean, engaging way. Perfect for business, planning, and team alignment. Fully compatible with PowerPoint, Keynote, and Google Slides.


5 slides
Human Resource Functions Infographics
Illuminate the complexities of people management with our human resource functions infographics template. Cast in the professional yet warm palette of black, orange, pink, and red, this template is an essential tool for HR professionals, corporate trainers, and business leaders. It elegantly dissects various HR realms with its sleek graphics, intuitive icons, and dedicated image placeholders, making it perfect for showcasing recruitment processes, employee engagement strategies, or organizational culture principles. Its creative, vertical style is designed to hold the attention and fuel the imagination, turning any HR presentation into a compelling narrative.

23 slides
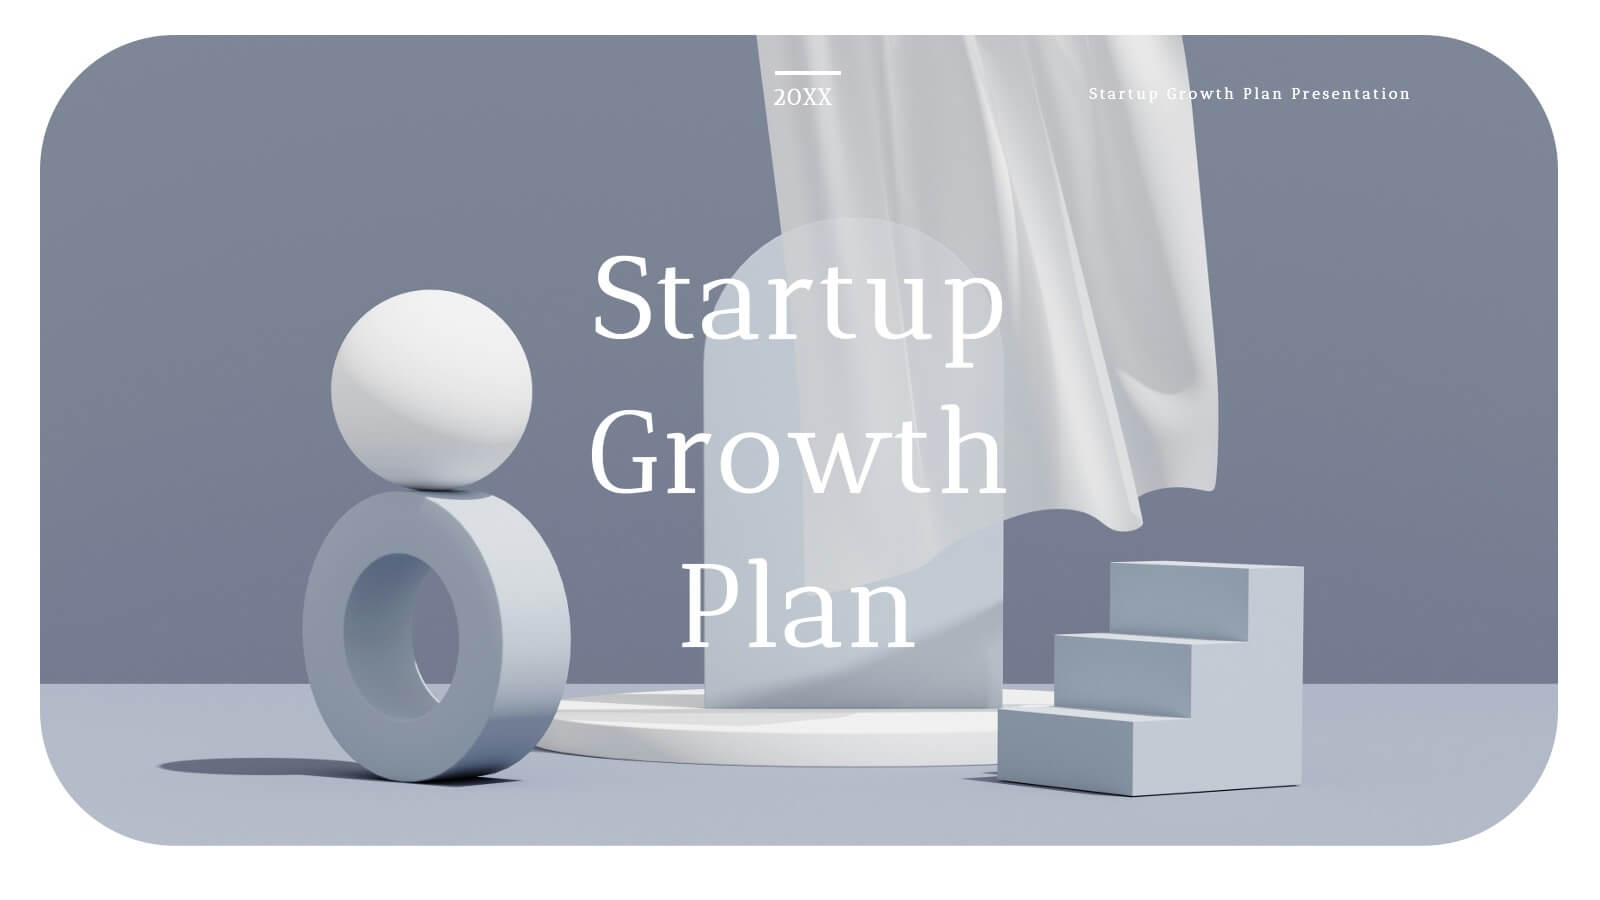
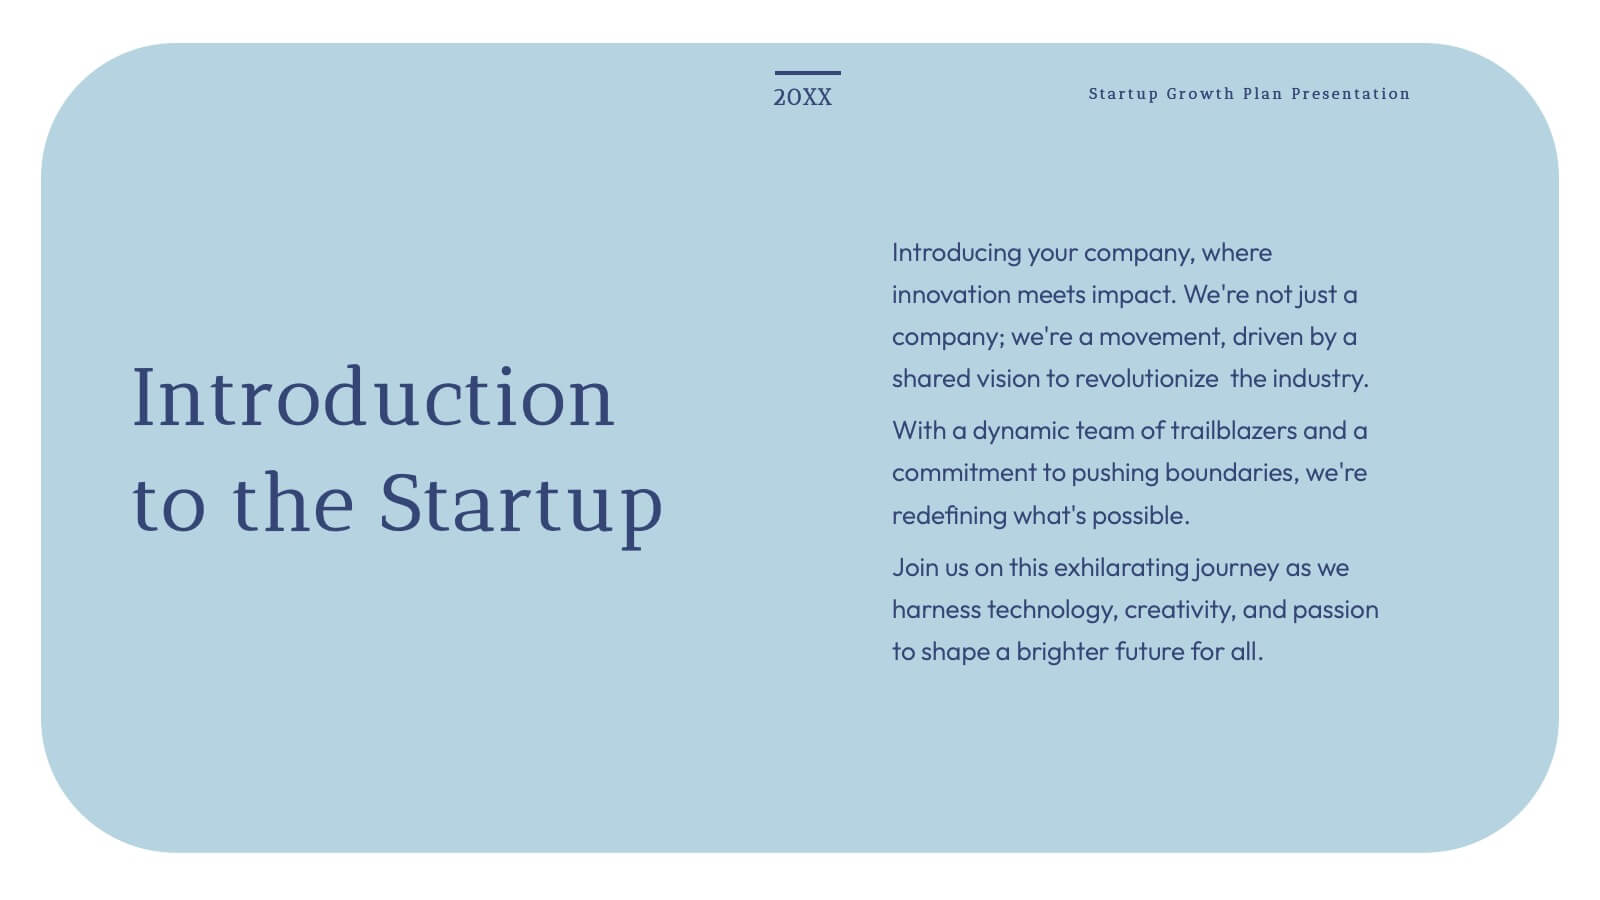
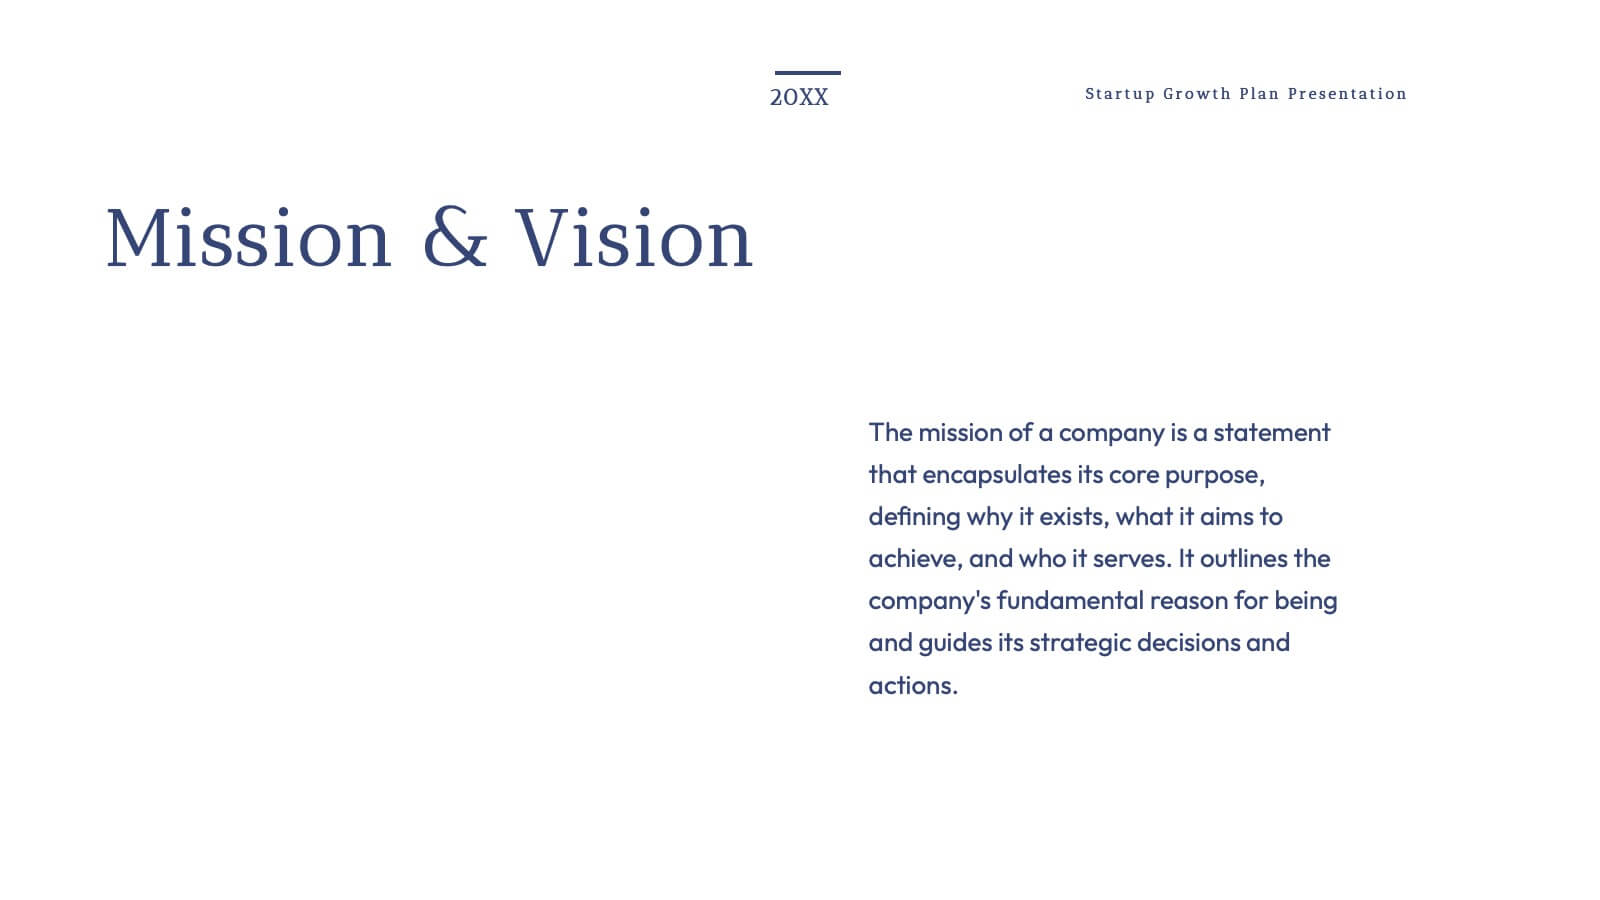
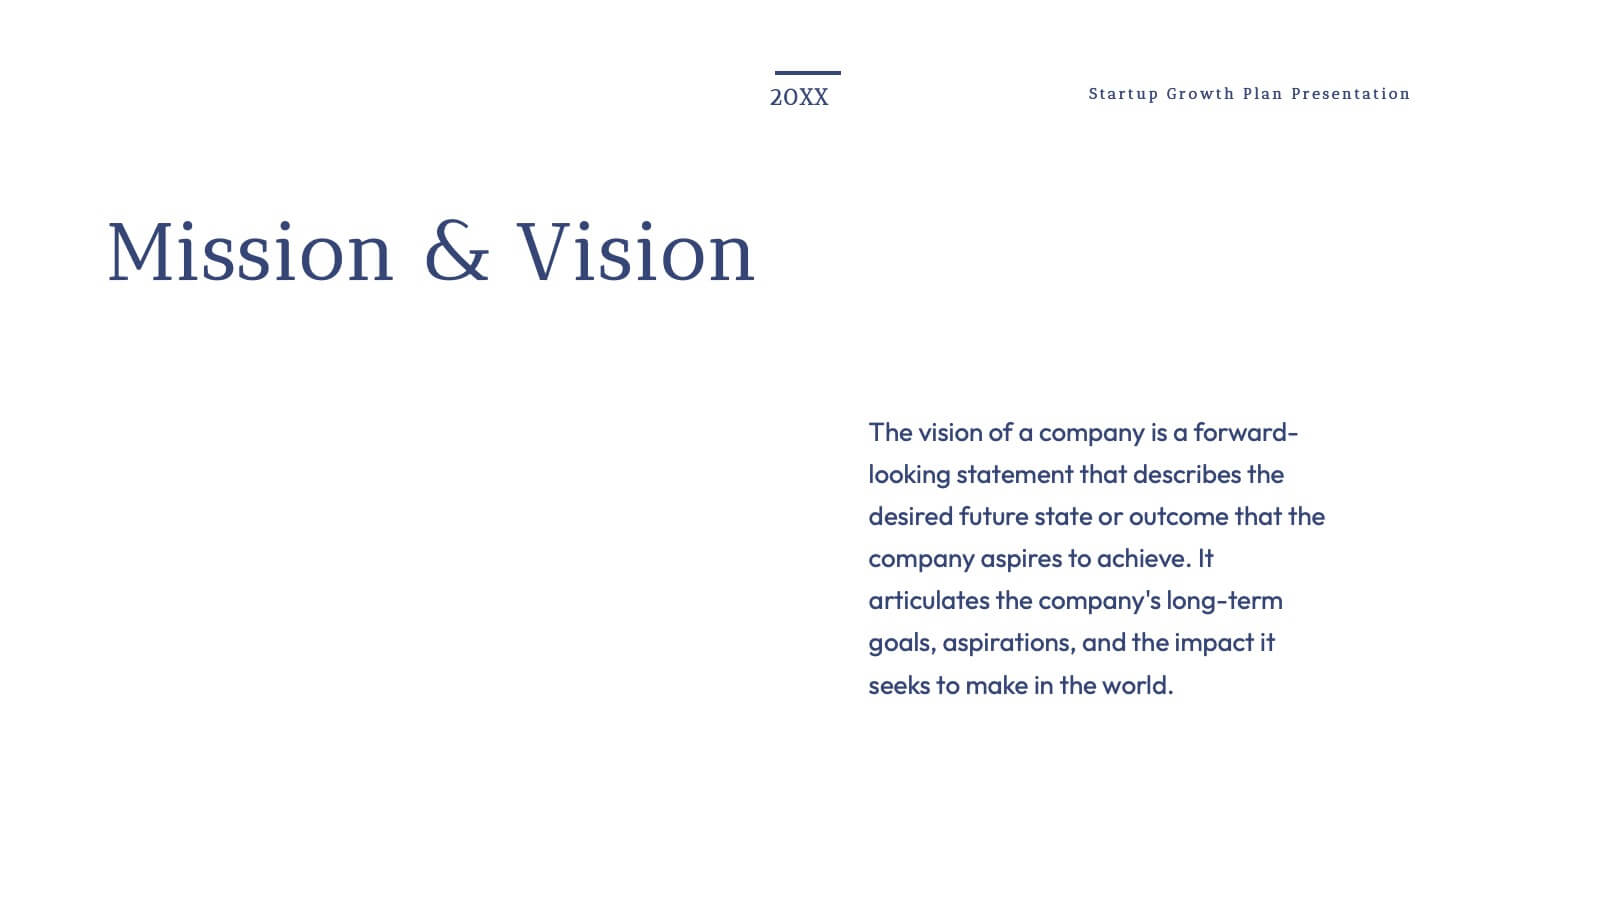
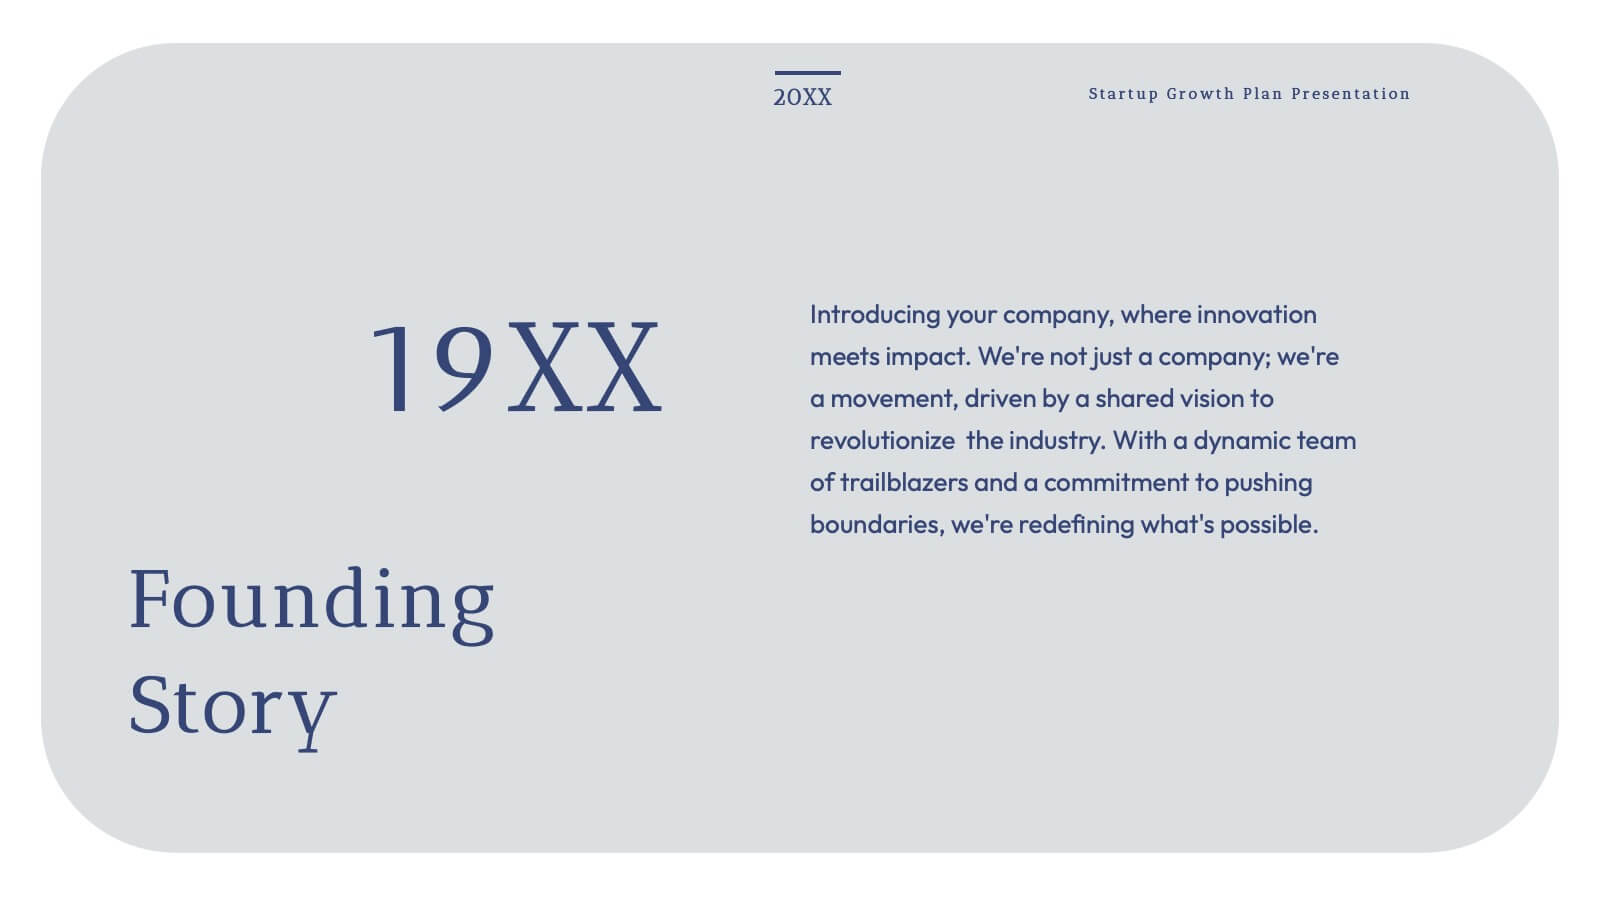
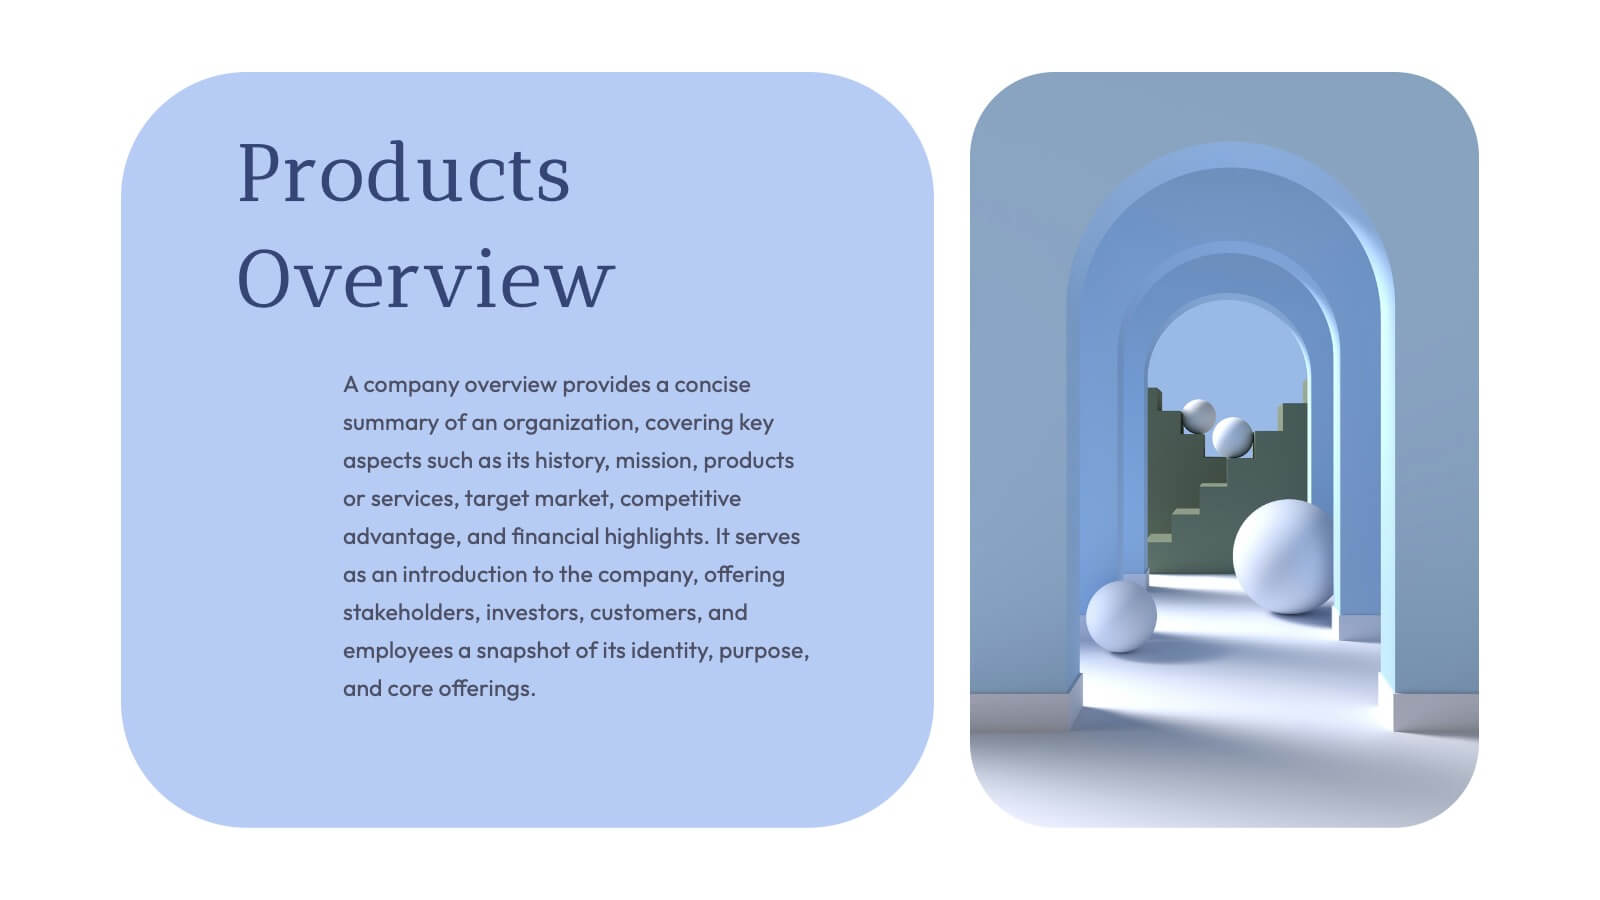
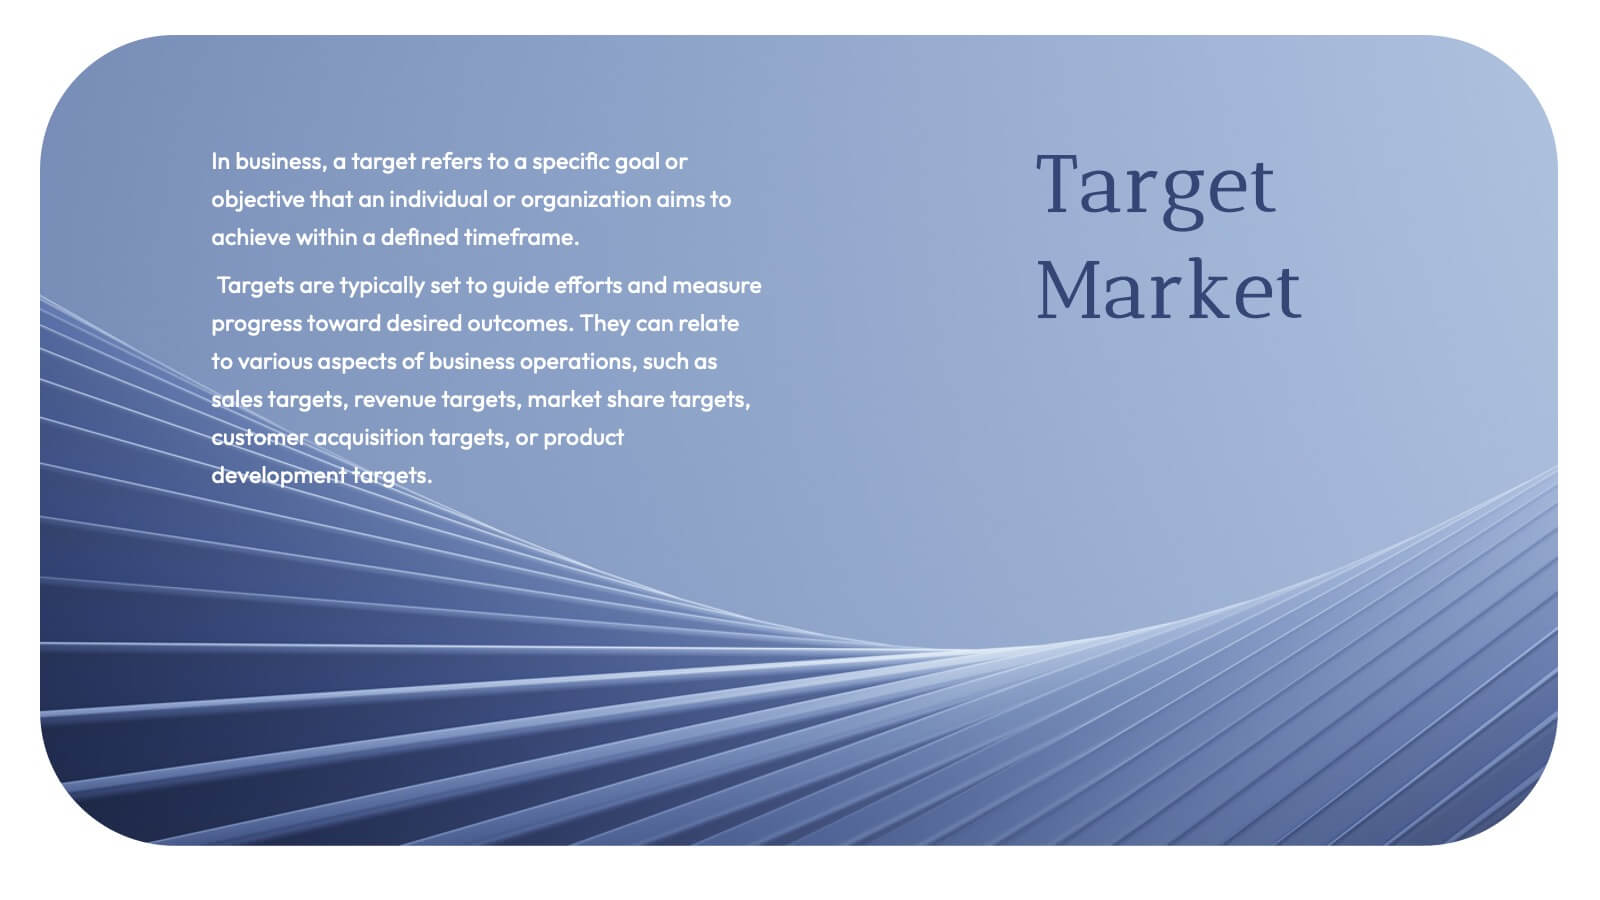
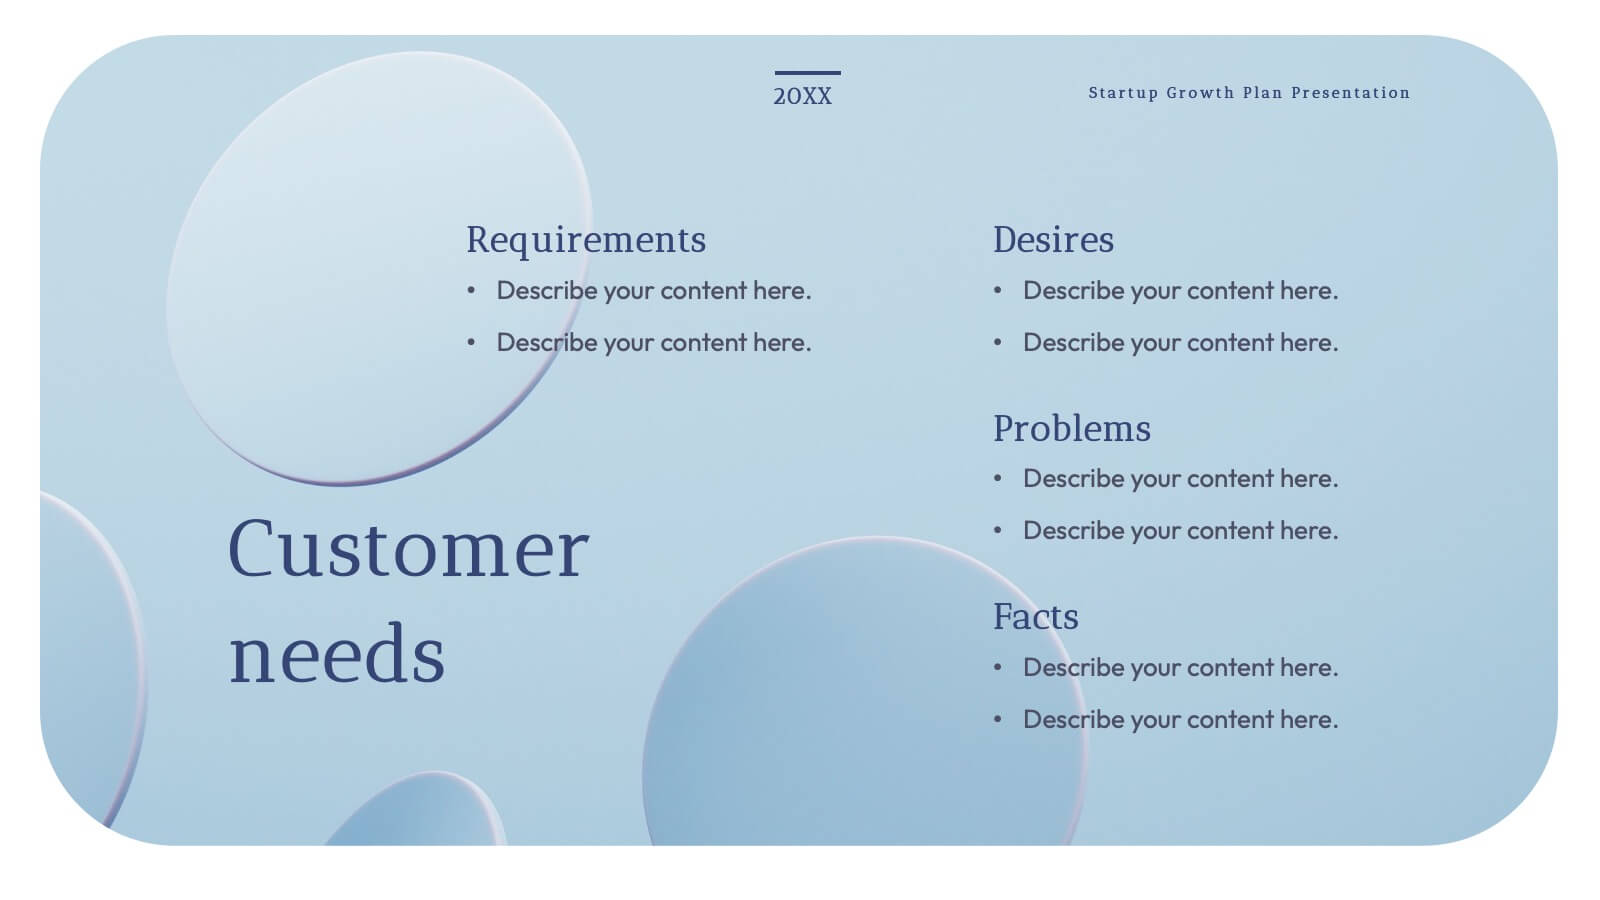
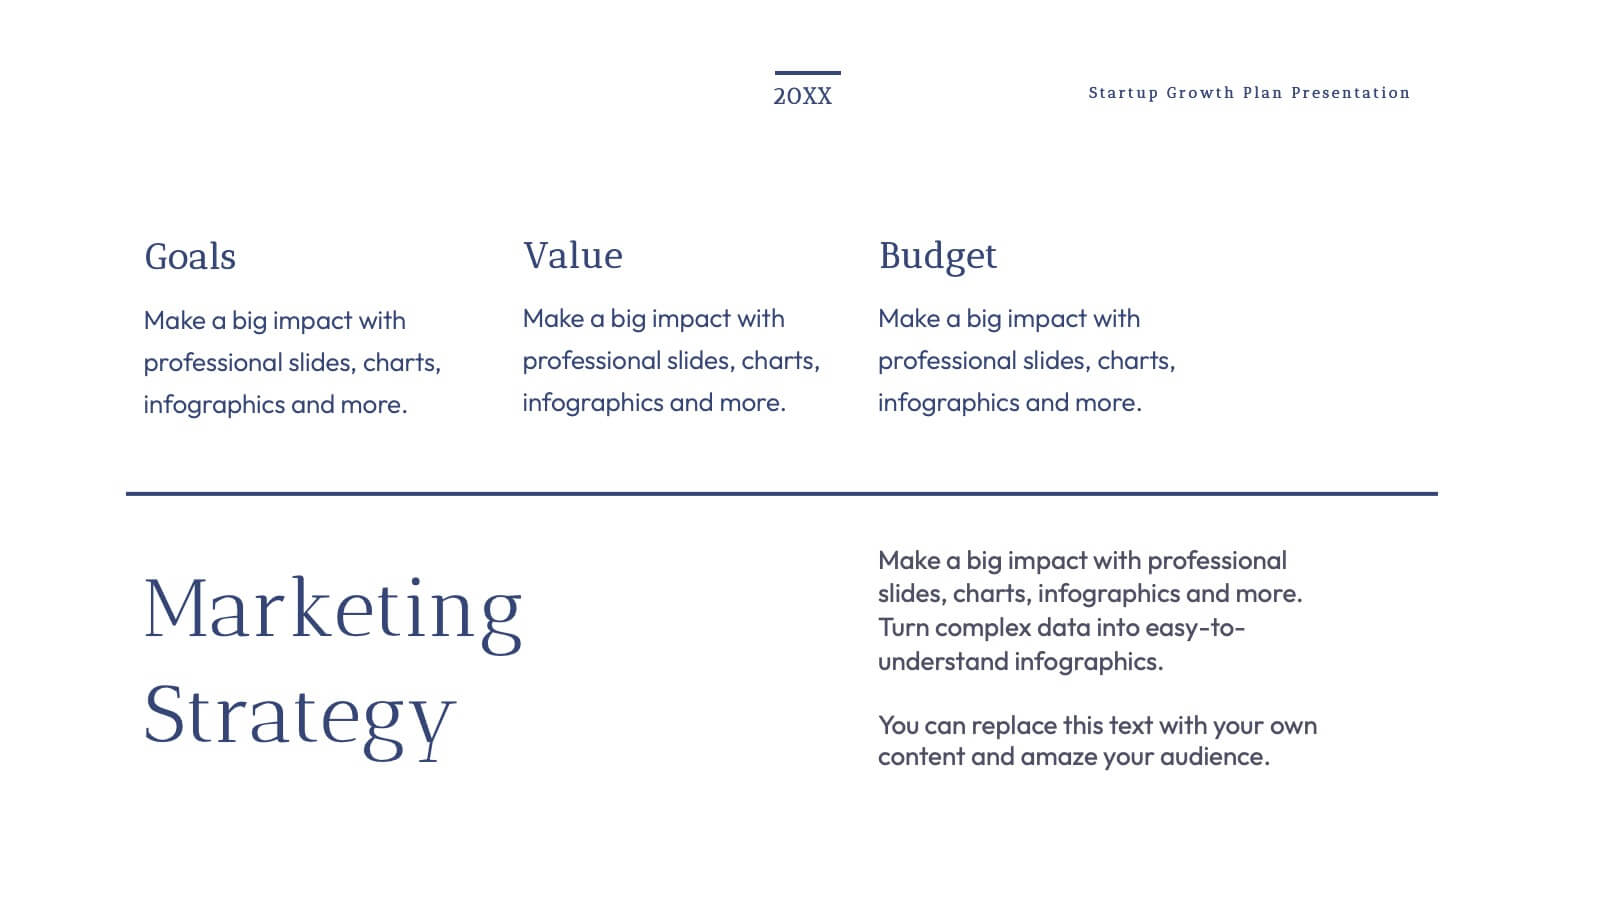
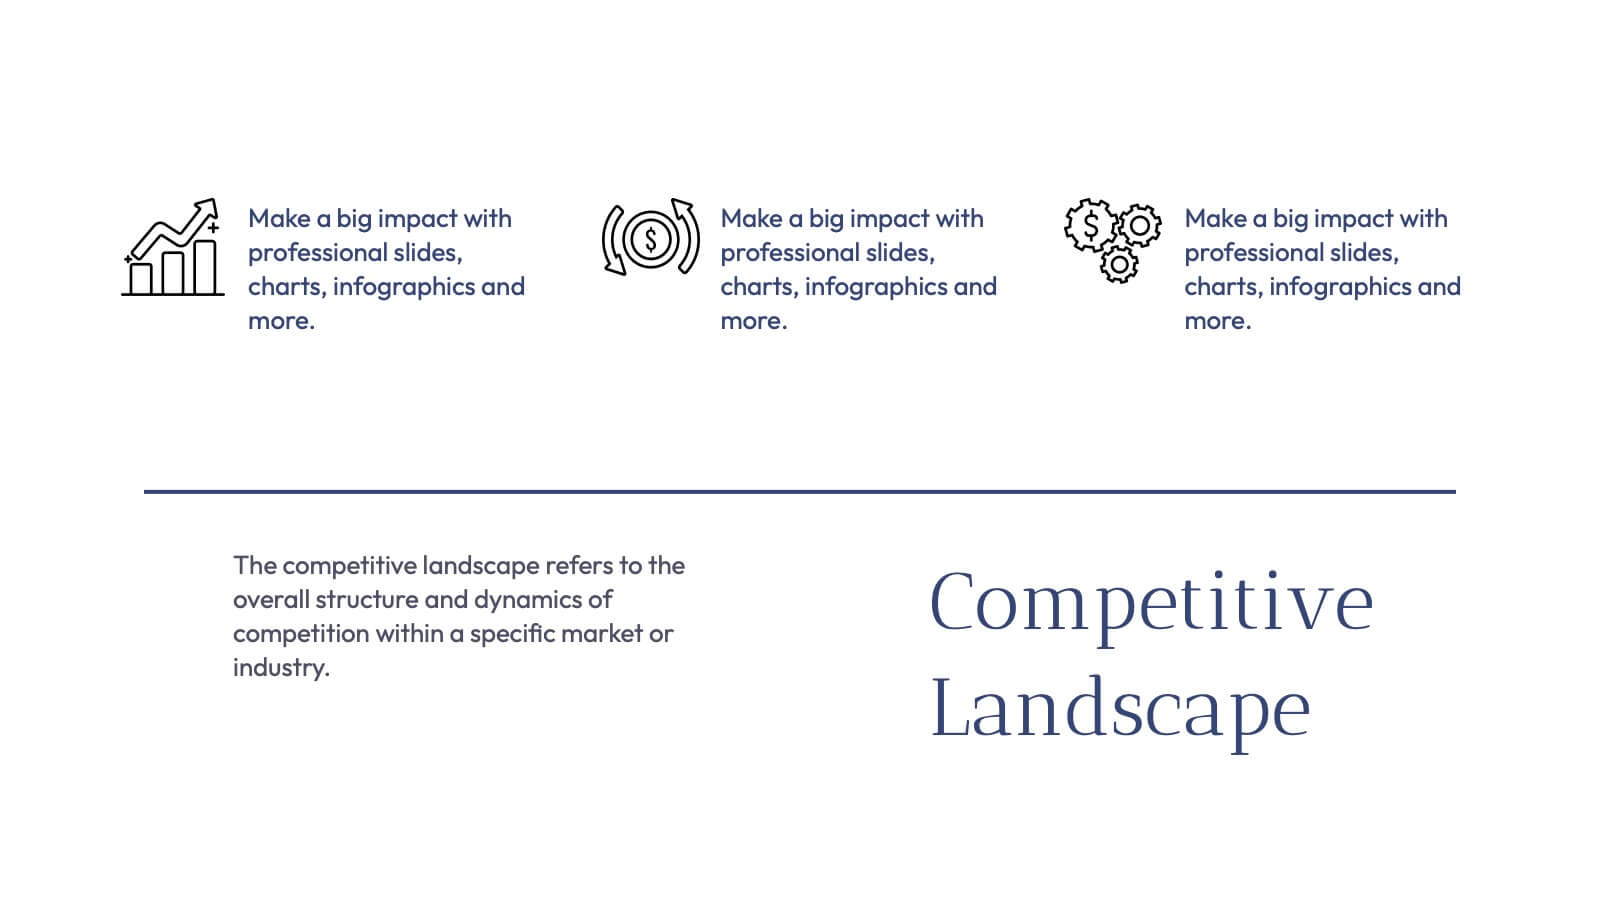
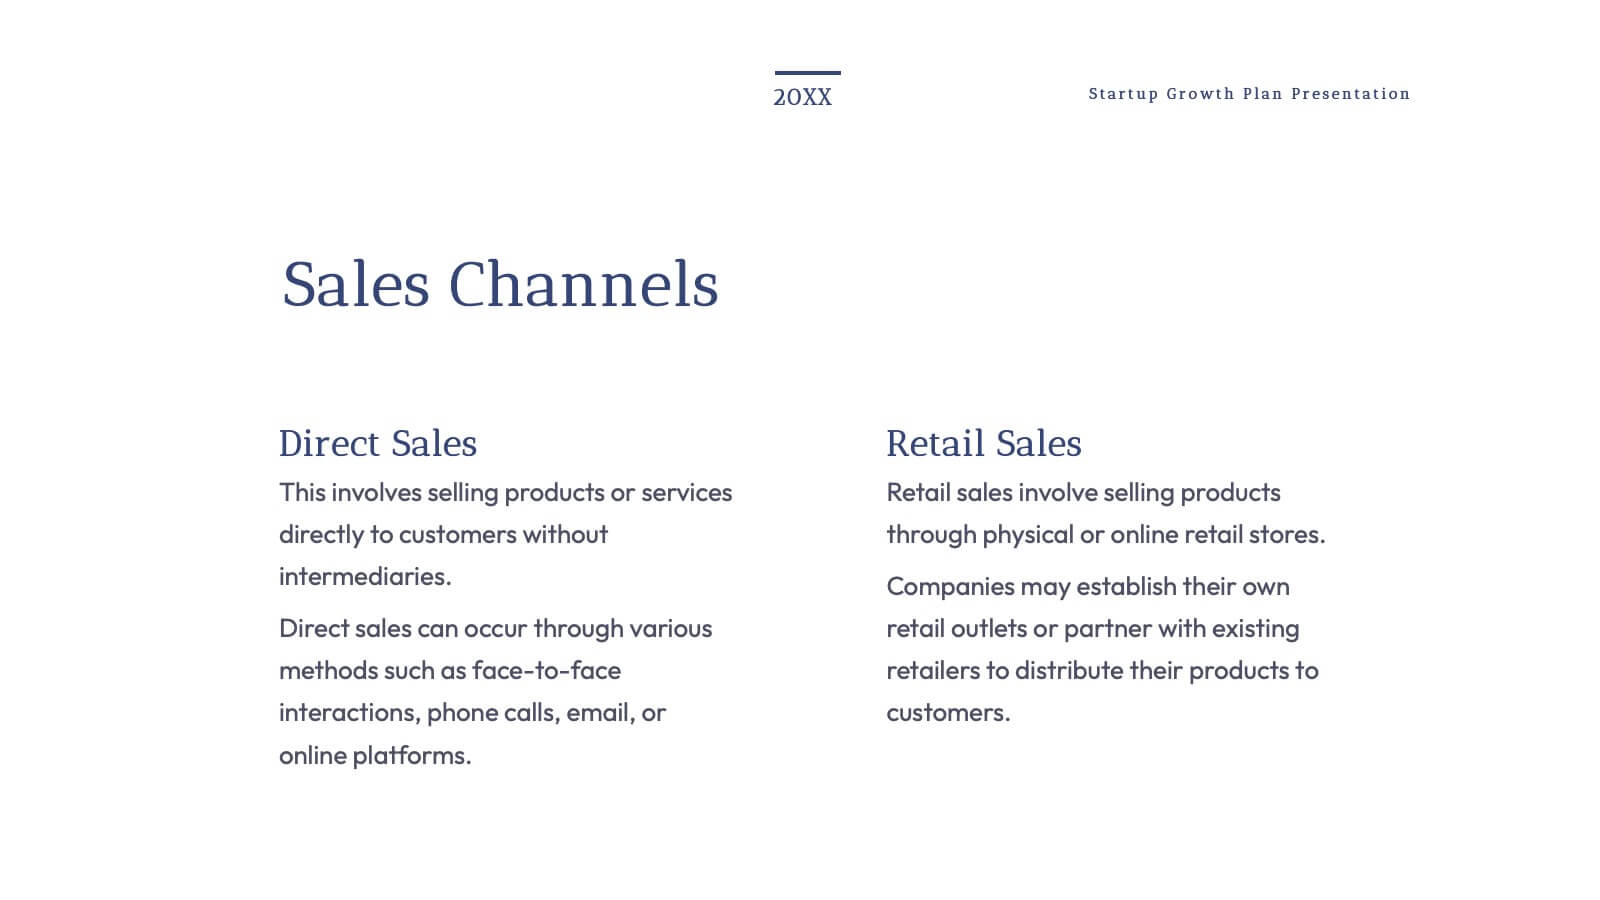
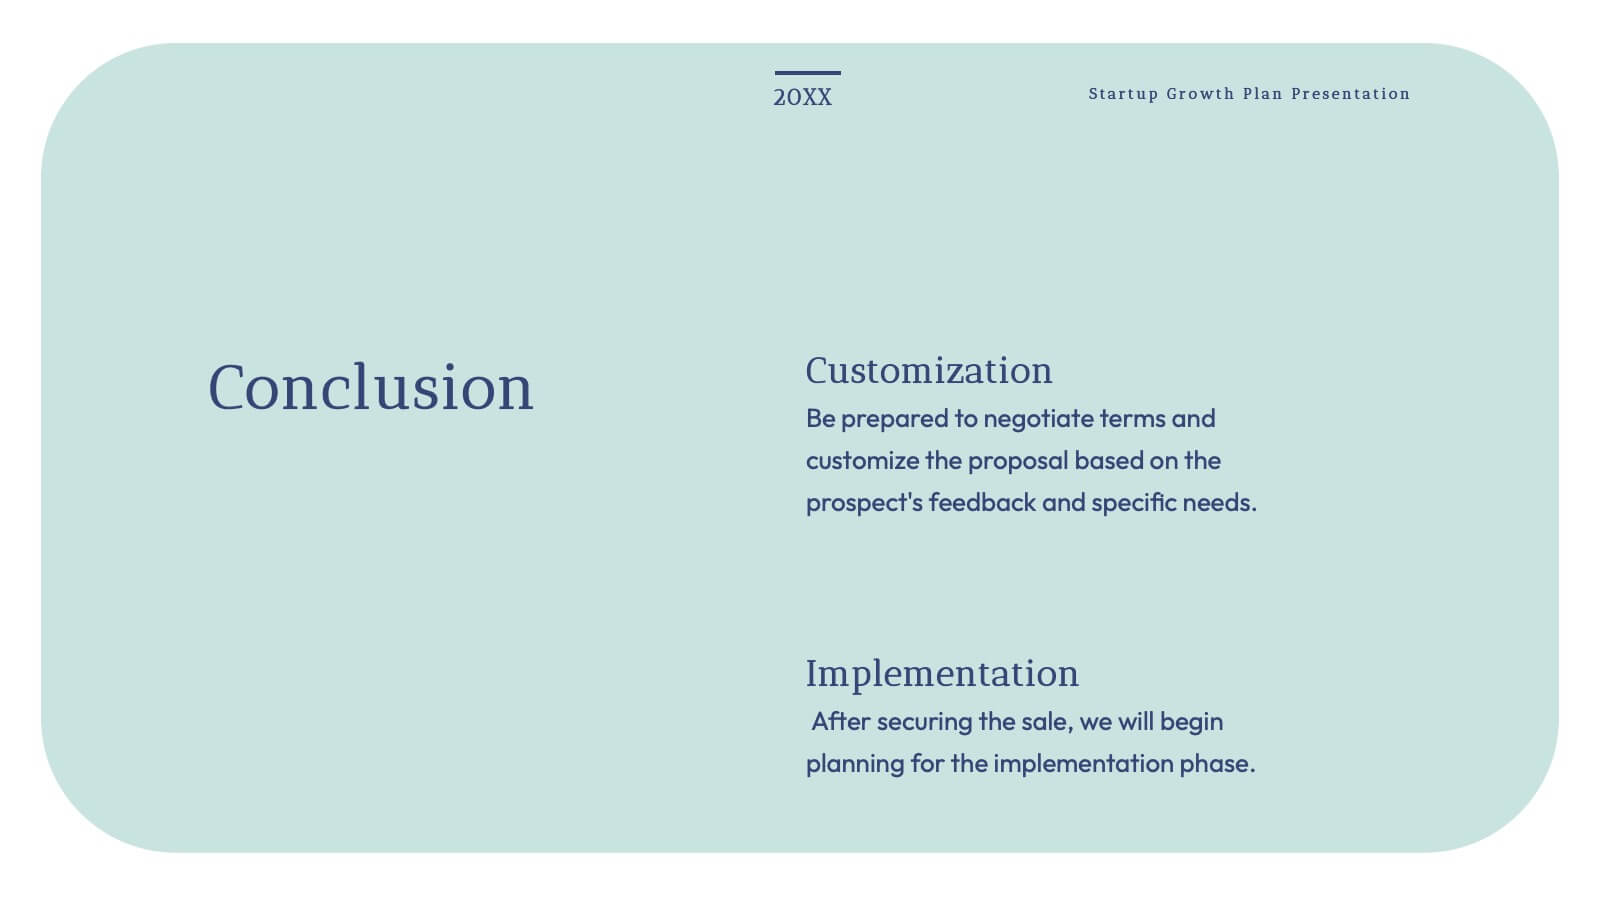
Grecian Startup Growth Plan Presentation
Elevate your pitch with this stunning Grecian-inspired presentation template, perfect for outlining your startup's growth plan! Showcase your business strategy, revenue projections, and scaling opportunities with a clean, elegant design that grabs attention. Impress investors and stakeholders with every slide. Compatible with PowerPoint, Keynote, and Google Slides for seamless customization.


7 slides
Corporate Sustainability Management
Visualize your sustainability priorities with this hexagon-based framework slide, designed to highlight areas like environmental impact, health, welfare, and ethical governance. Ideal for CSR reporting, ESG strategy sessions, or internal sustainability initiatives. Easy to customize in PowerPoint, Keynote, and Google Slides.


6 slides
Cash Management Strategy Presentation
Break down your financial priorities with a bold, visual approach. This cash management slide uses a segmented dollar symbol to represent key areas like budgeting, reserves, expenses, and more—making it easy to track strategy points at a glance. Ideal for finance teams, planning sessions, or investor decks. Compatible with PowerPoint, Keynote, and Google Slides.


7 slides
Harvey Ball Charts Infographic
A Harvey Ball is a simple, round graphic used for visual representation and communication of qualitative information. This infographic template harnesses the power of Harvey Balls, those simple yet potent icons, to convey information and insights in a visually striking manner. Highlight strategies to engage the audience effectively using Harvey Balls. Fully customizable and compatible with Powerpoint, Keynote, and Google Slides. This infographic allows you to explore the ability to customize Harvey Balls, varying in size, color, and style to suit your unique data representation needs.


3 slides
Corporate Law and Regulation Guide Presentation
Clarify legal structures with the Corporate Law and Regulation Guide Presentation. This visually balanced design uses legal scale and book icons to symbolize authority, compliance, and fairness. Perfect for illustrating legal frameworks, policy breakdowns, or governance models. Fully editable for PowerPoint, Keynote, and Google Slides.


20 slides
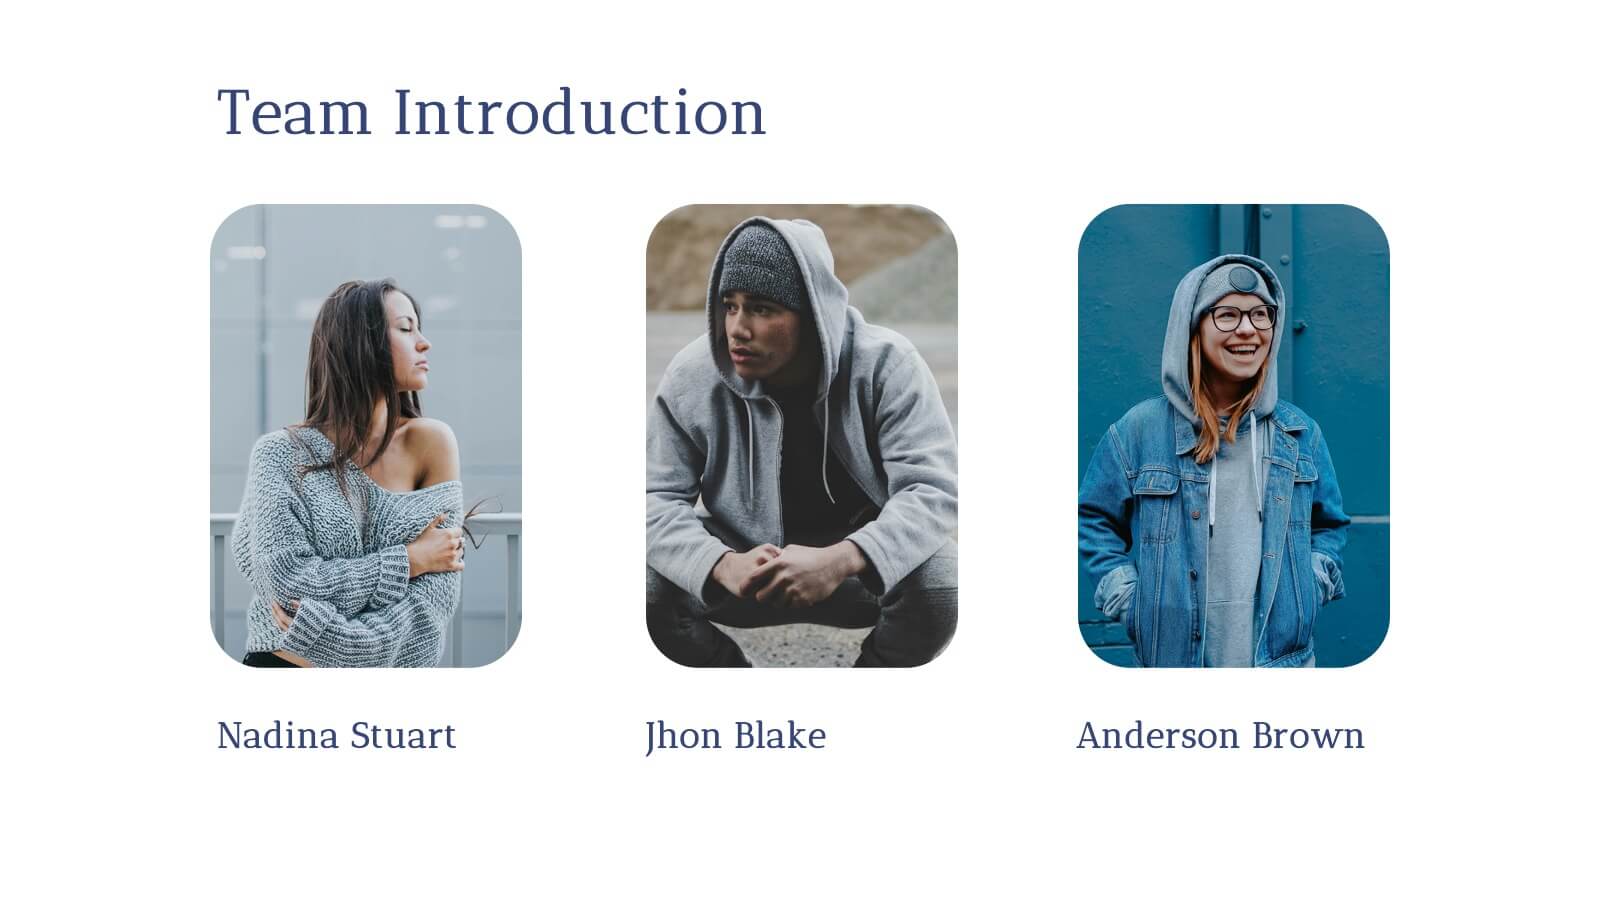
Creative Agency Presentation
Showcase your agency’s capabilities with the Magic Coat Creative Agency template. It features slides detailing team introductions, service overviews, case studies, and more. Ideal for creative agencies aiming to impress potential clients, this template supports PowerPoint, Keynote, and Google Slides, enhancing your presentation's professional appeal.