


Features
- 20 Unique Slides
- Fully editable and easy to edit in Microsoft Powerpoint, Keynote and Google Slides
- 16:9 widescreen layout
- Clean and professional designs
- Export to JPG, PDF or send by email


Do you have any questions?
Recommend


21 slides
Fortuna Product Development Plan Presentation
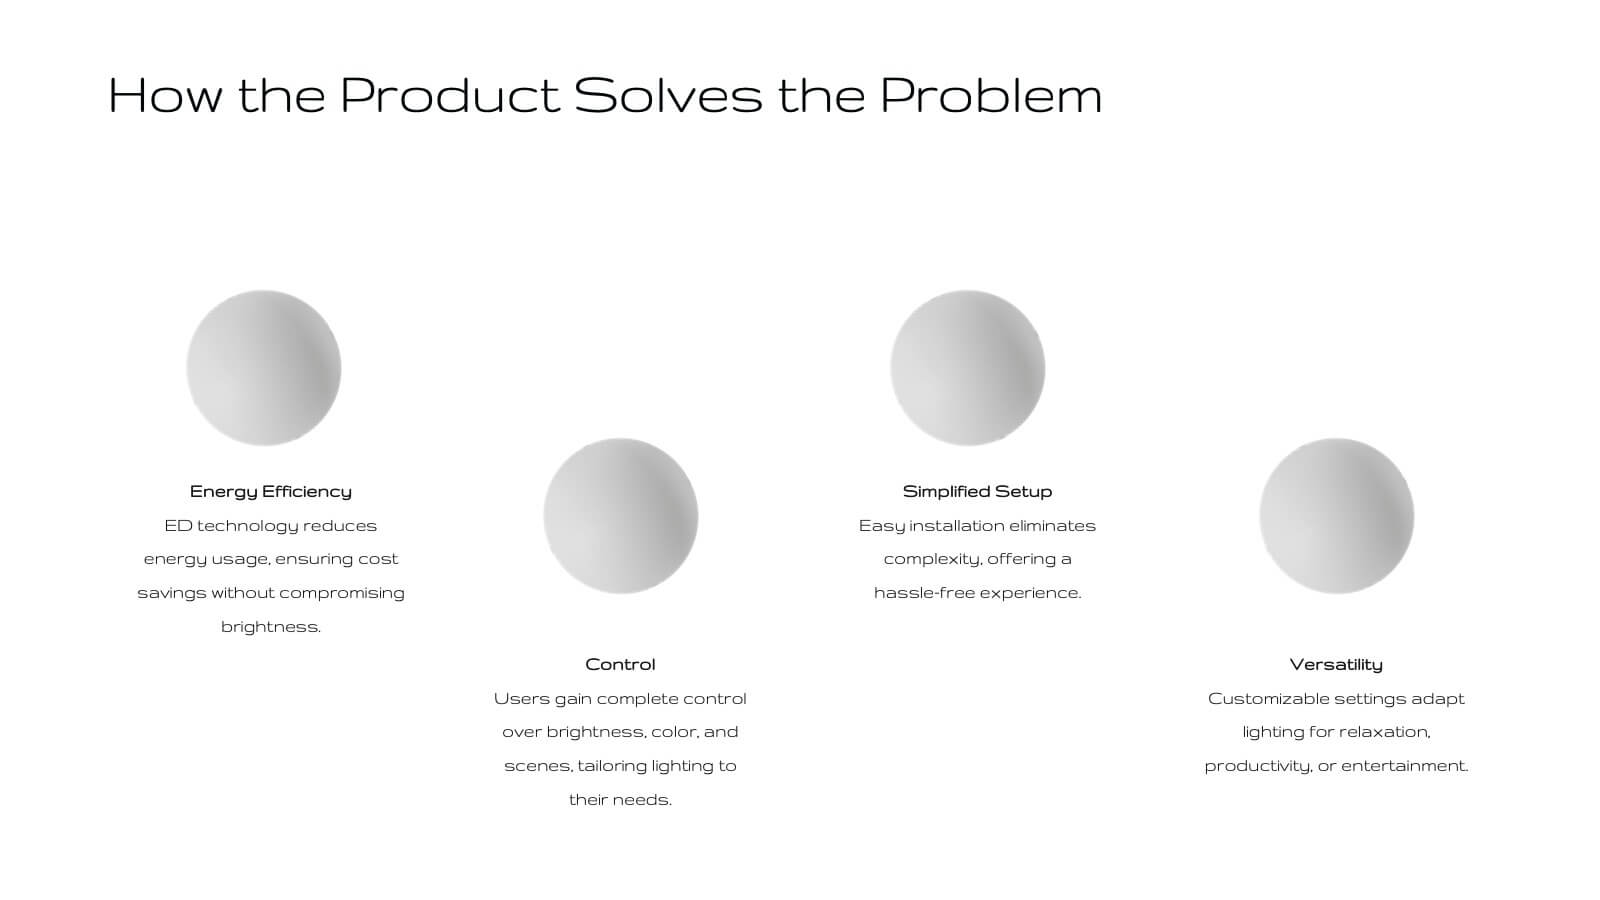
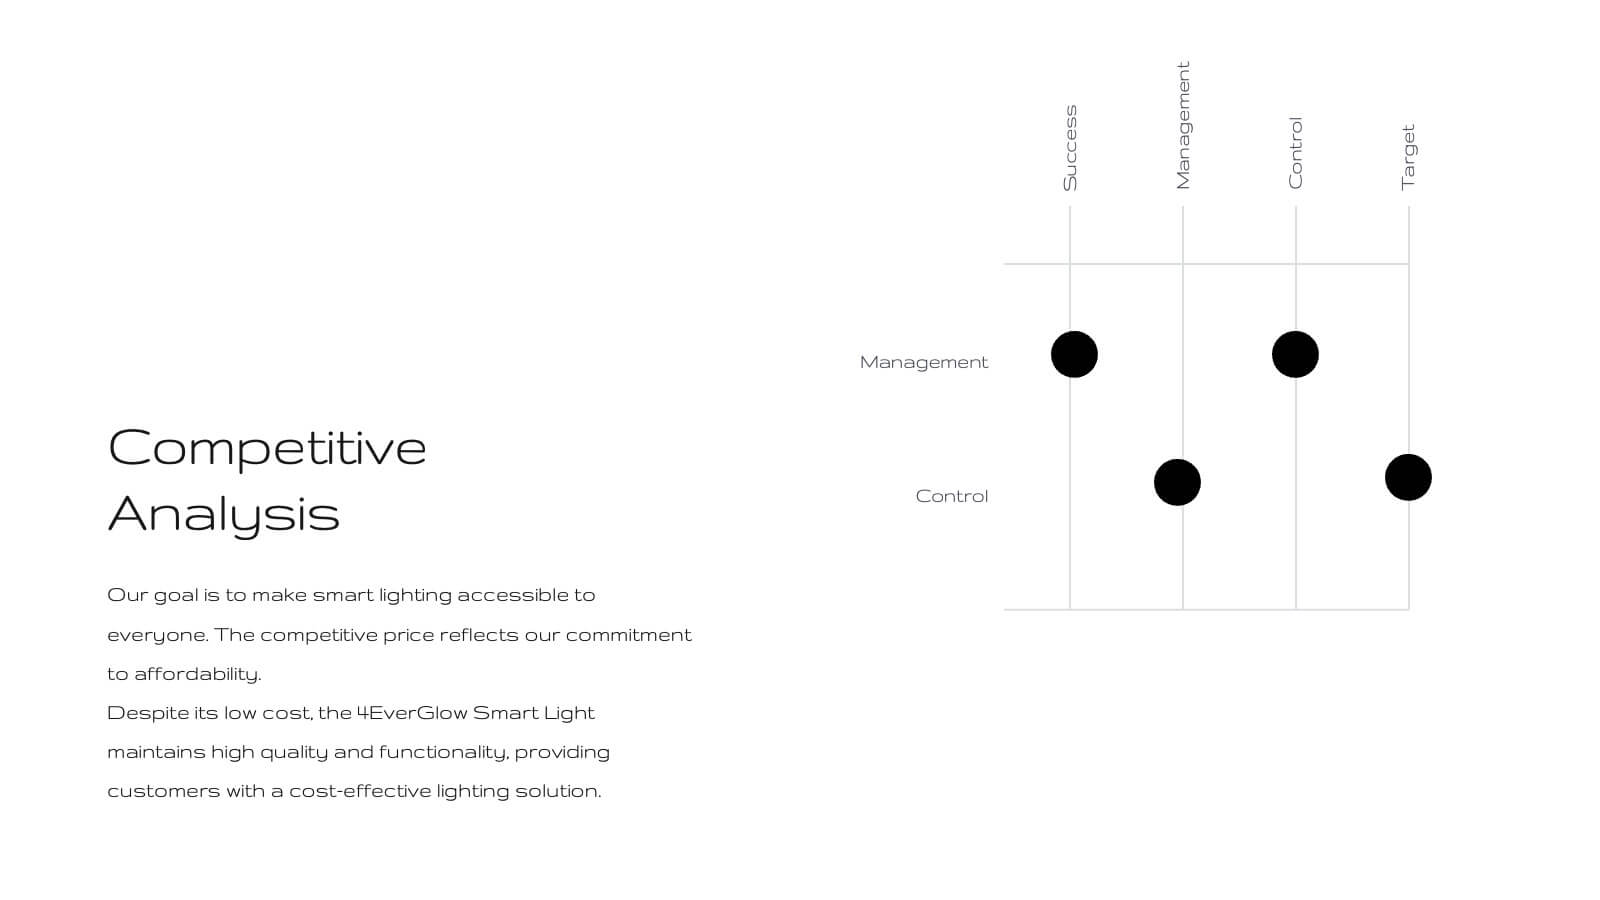
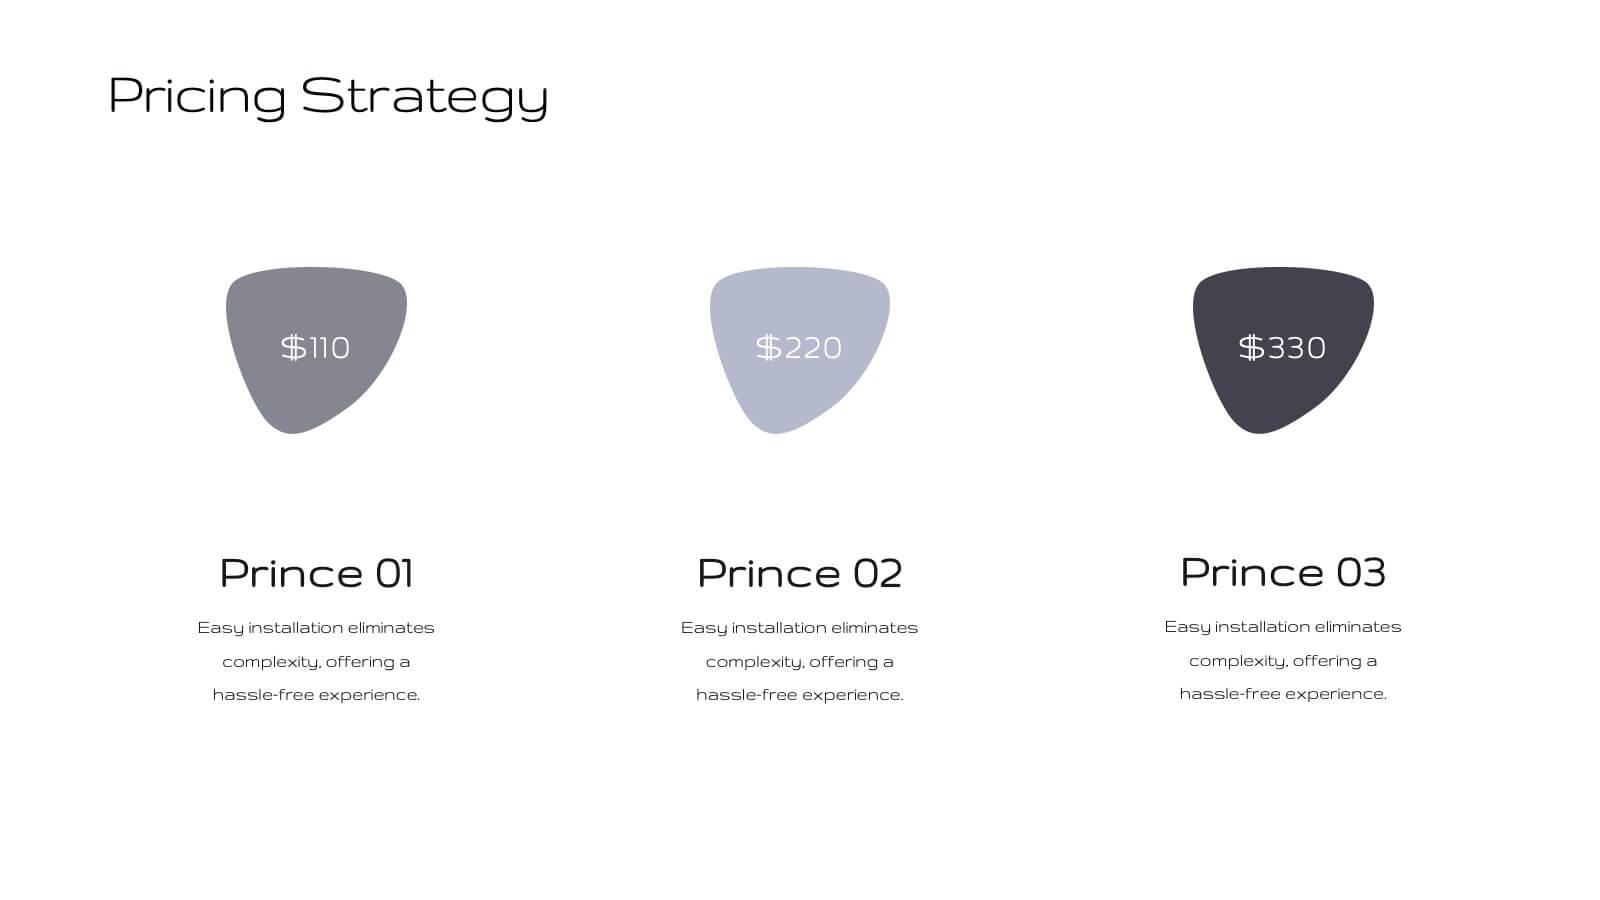
Unveil your product's potential with this elegant, minimalist presentation template. Perfect for detailing product development, features, and market strategies, it features a clean design that emphasizes clarity and professionalism. Highlight key aspects like customer pain points, competitive analysis, and pricing strategies to captivate your audience. Compatible with PowerPoint, Keynote, and Google Slides, it ensures seamless presentations on any platform.


4 slides
Historical Event Timeline Presentation
Visualize your timeline with this Historical Event layout, ideal for showcasing progress, milestones, or key moments over time. Featuring a horizontal design with date markers and icons, it’s perfect for history, education, or project recaps. Fully editable in PowerPoint, Keynote, and Google Slides to match your content and branding.


4 slides
Environmental Impact Assessment Presentation
Bring your audience into a greener future with a clean, leaf-inspired design that makes complex sustainability insights feel clear and approachable. This presentation helps you break down key environmental factors, impact areas, and responsible planning in a simple visual flow. Fully editable and compatible with PowerPoint, Keynote, and Google Slides.


2 slides
Detailed Buyer Profile Analysis Layout Presentation
Showcase a clear snapshot of your customer insights with this Detailed Buyer Profile Analysis Layout. This modern slide helps you outline bios, goals, and key traits using labeled icons, progress bars, and a visual profile section. Ideal for marketing teams, persona development, and product targeting. Fully editable in PowerPoint, Keynote, and Google Slides.


7 slides
One-Page Business Model Overview Presentation
Simplify your business strategy with this One-Page Business Model slide. Perfect for pitches or internal reviews, it maps out key elements like partners, activities, customers, and revenue on a single page. Clean, customizable blocks help communicate your vision clearly—ideal for startups, entrepreneurs, and teams needing quick business clarity.


25 slides
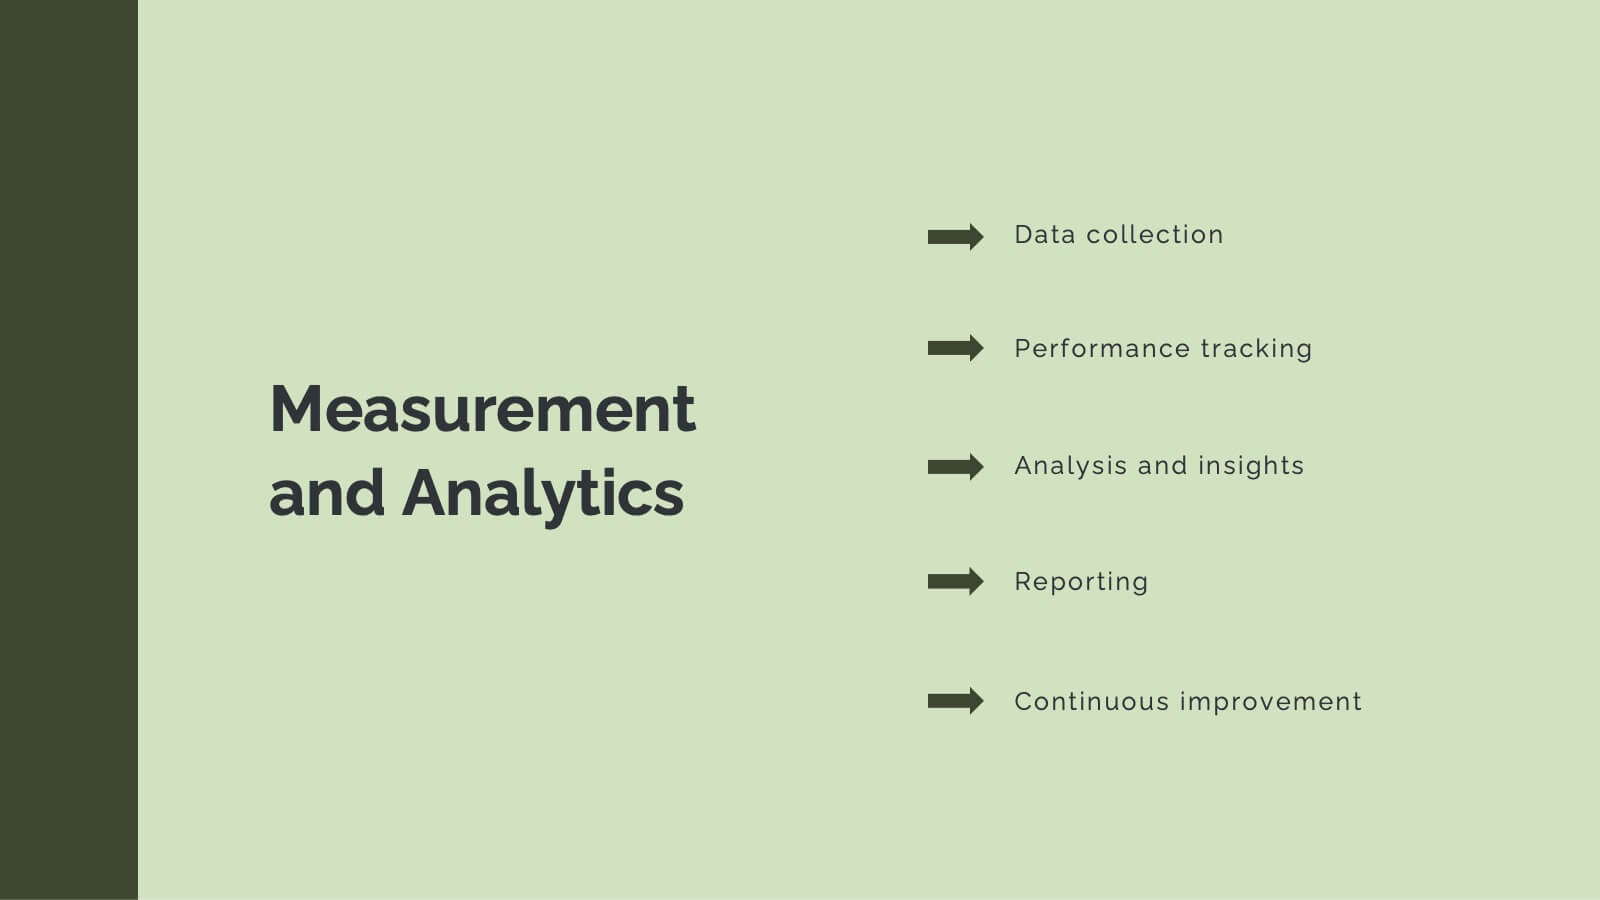
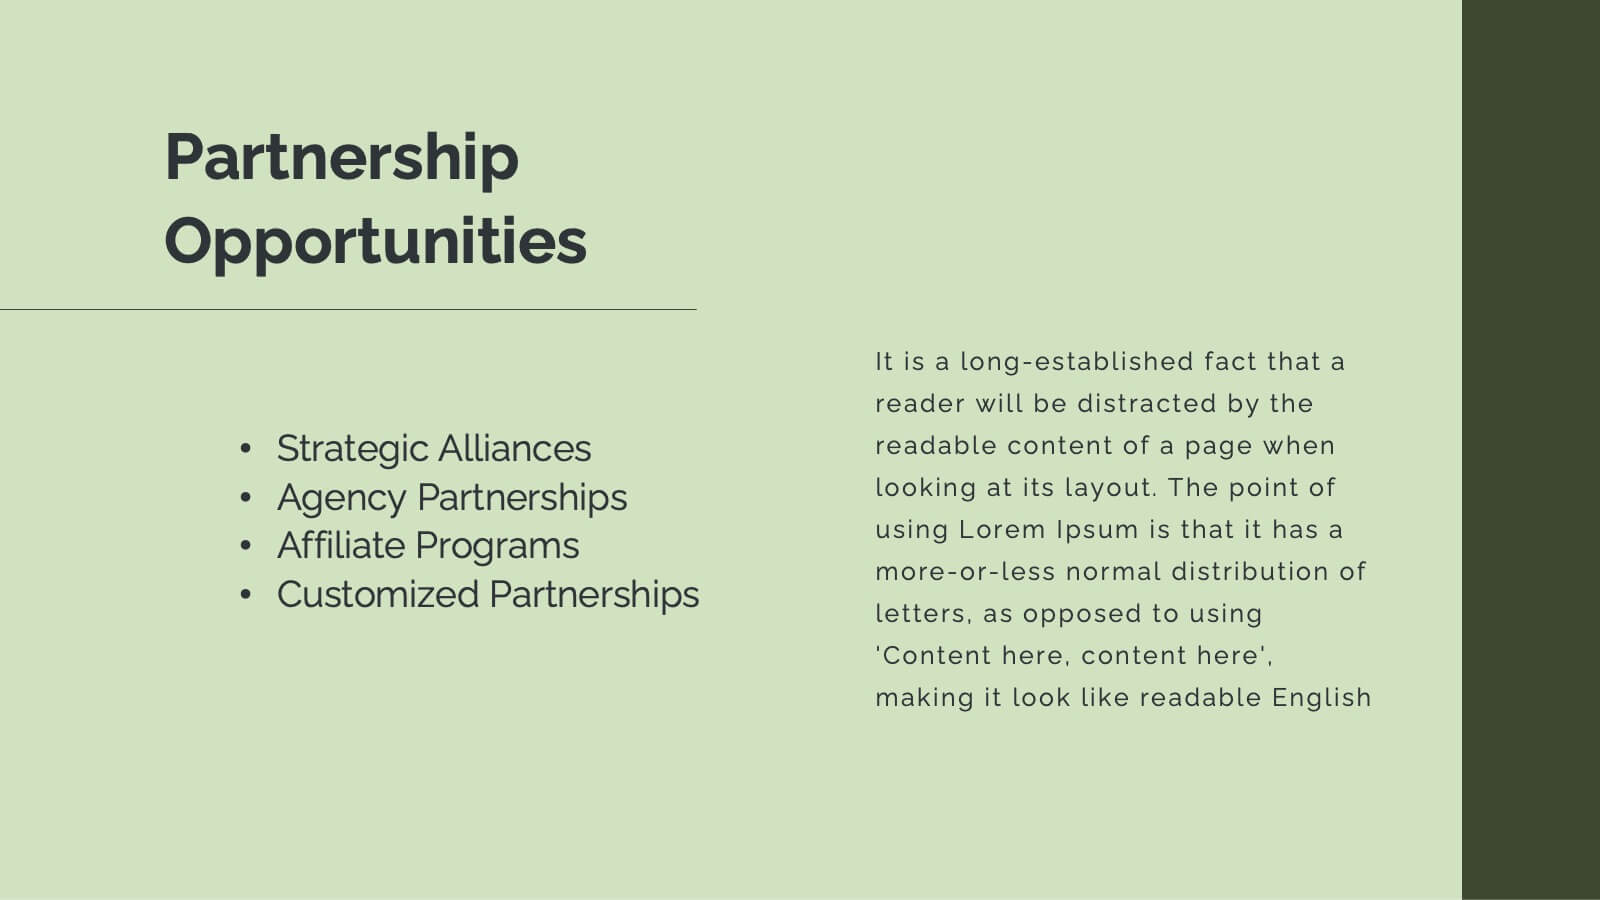
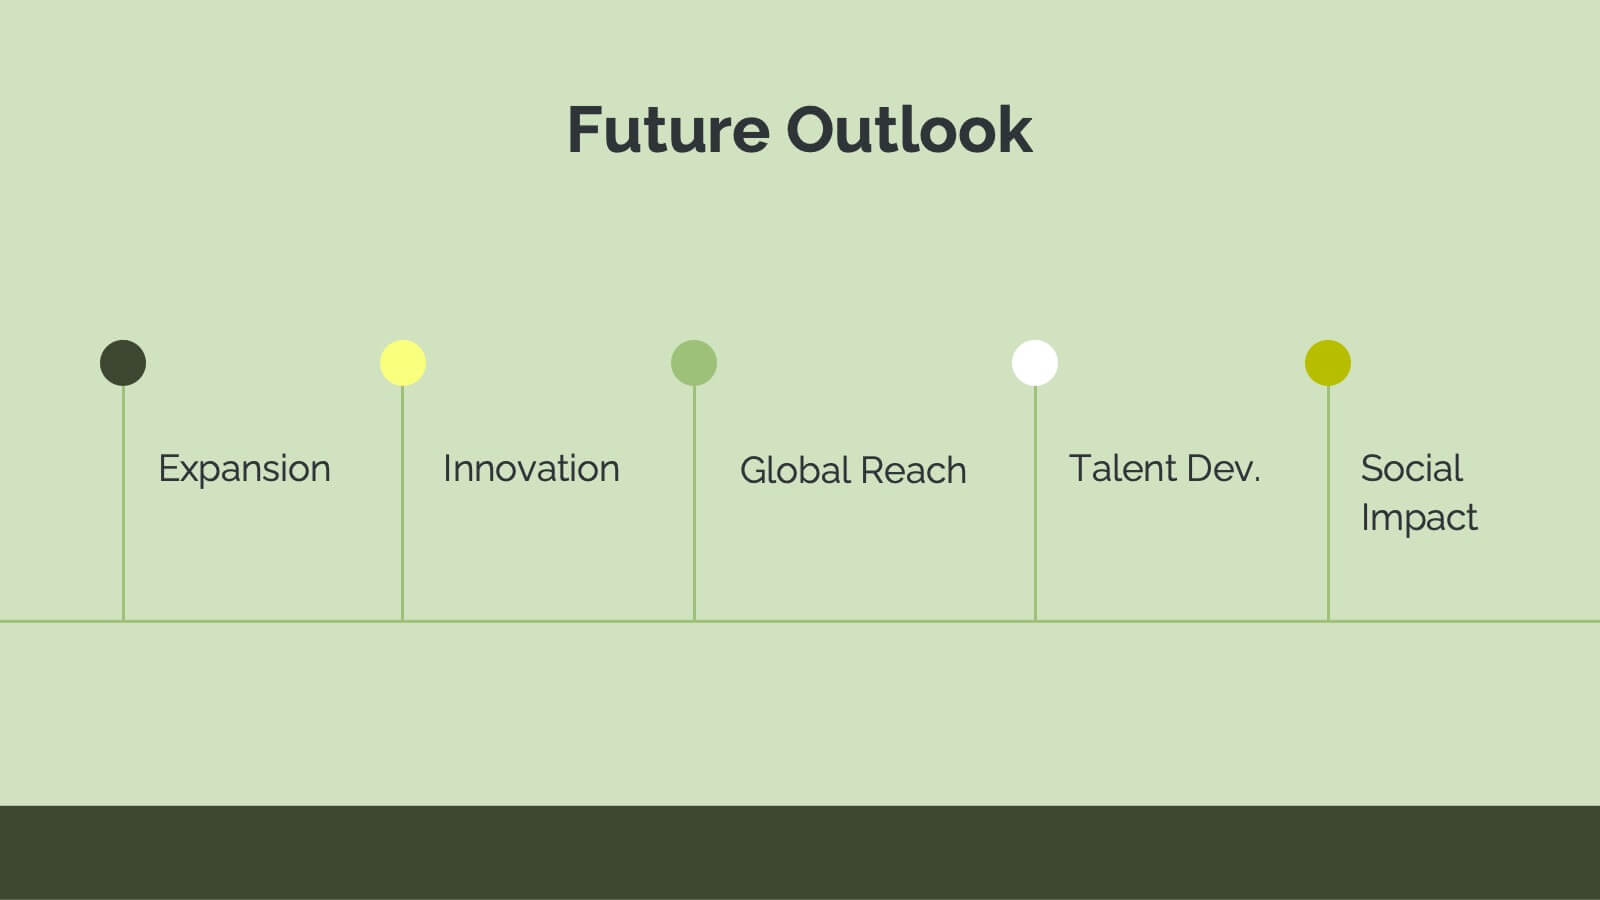
Keystone Market Research Presentation
Present your market research with confidence using this stylish, contemporary template. Perfect for detailing research objectives, data collection, and key findings, it features a sleek design with vibrant colors. Highlight critical aspects like market trends, results interpretation, and recommendations to captivate your audience. Compatible with PowerPoint, Keynote, and Google Slides, it ensures seamless presentations on any platform.

22 slides
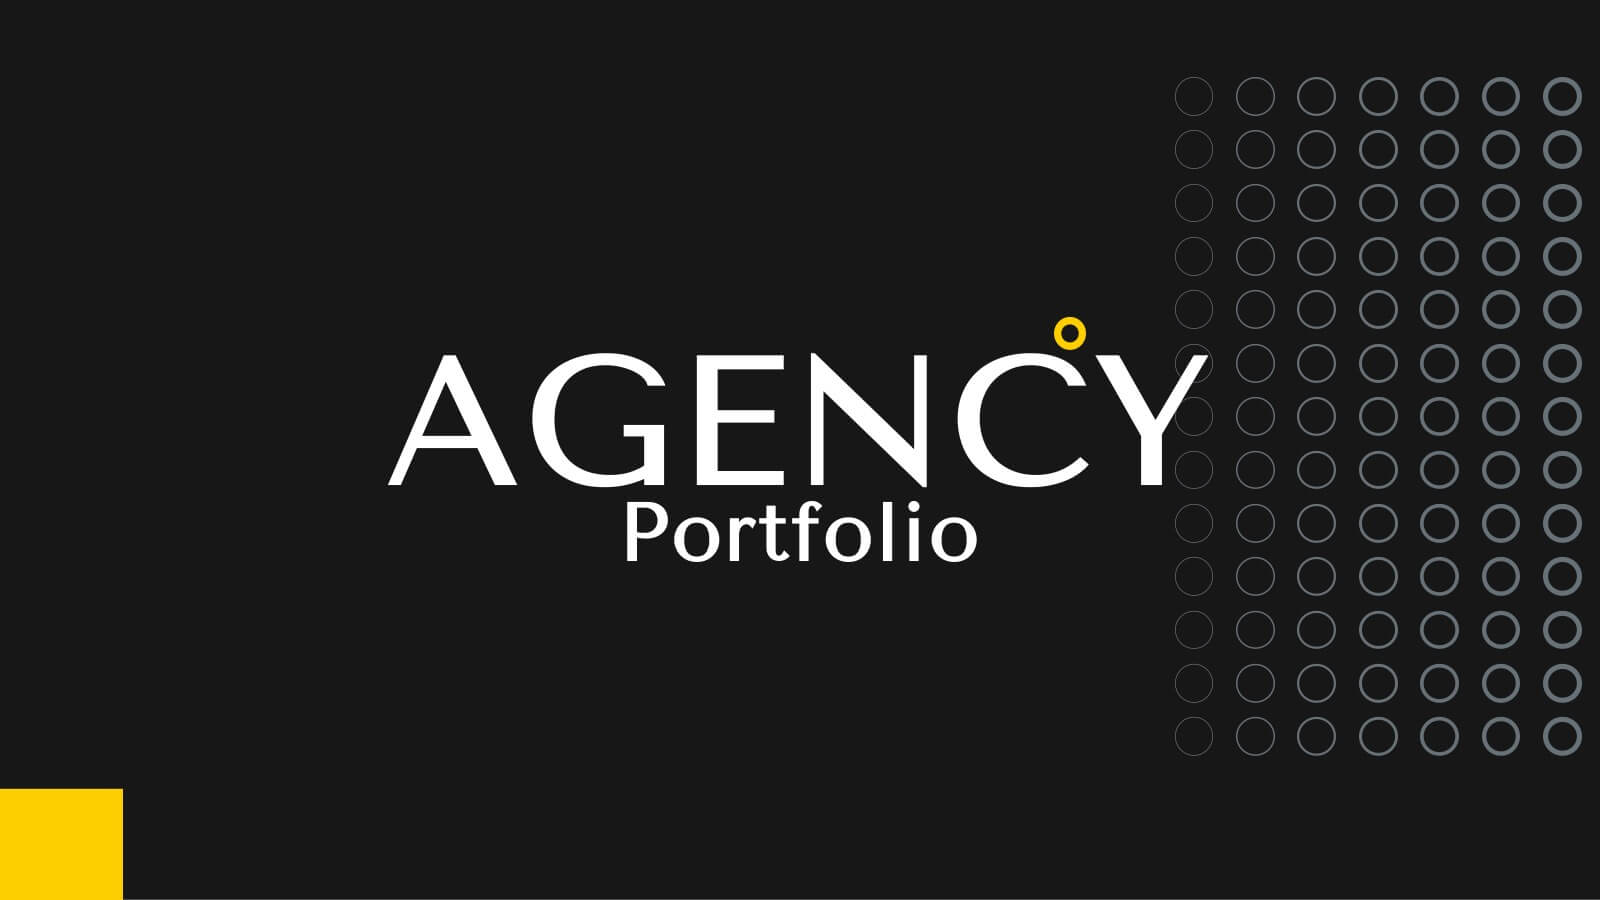
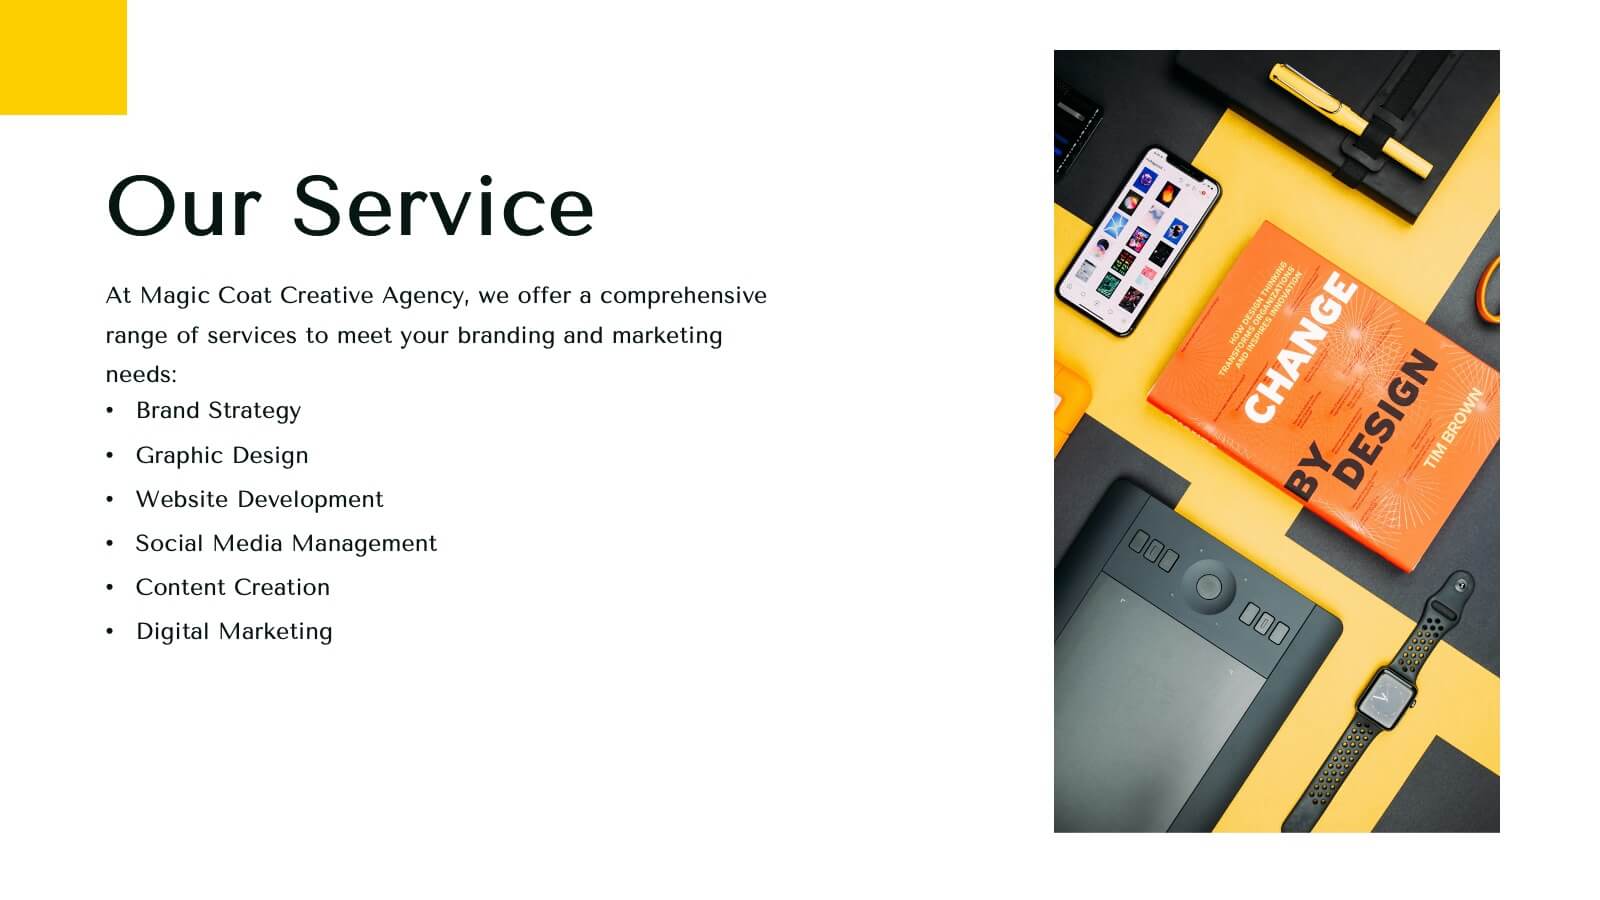
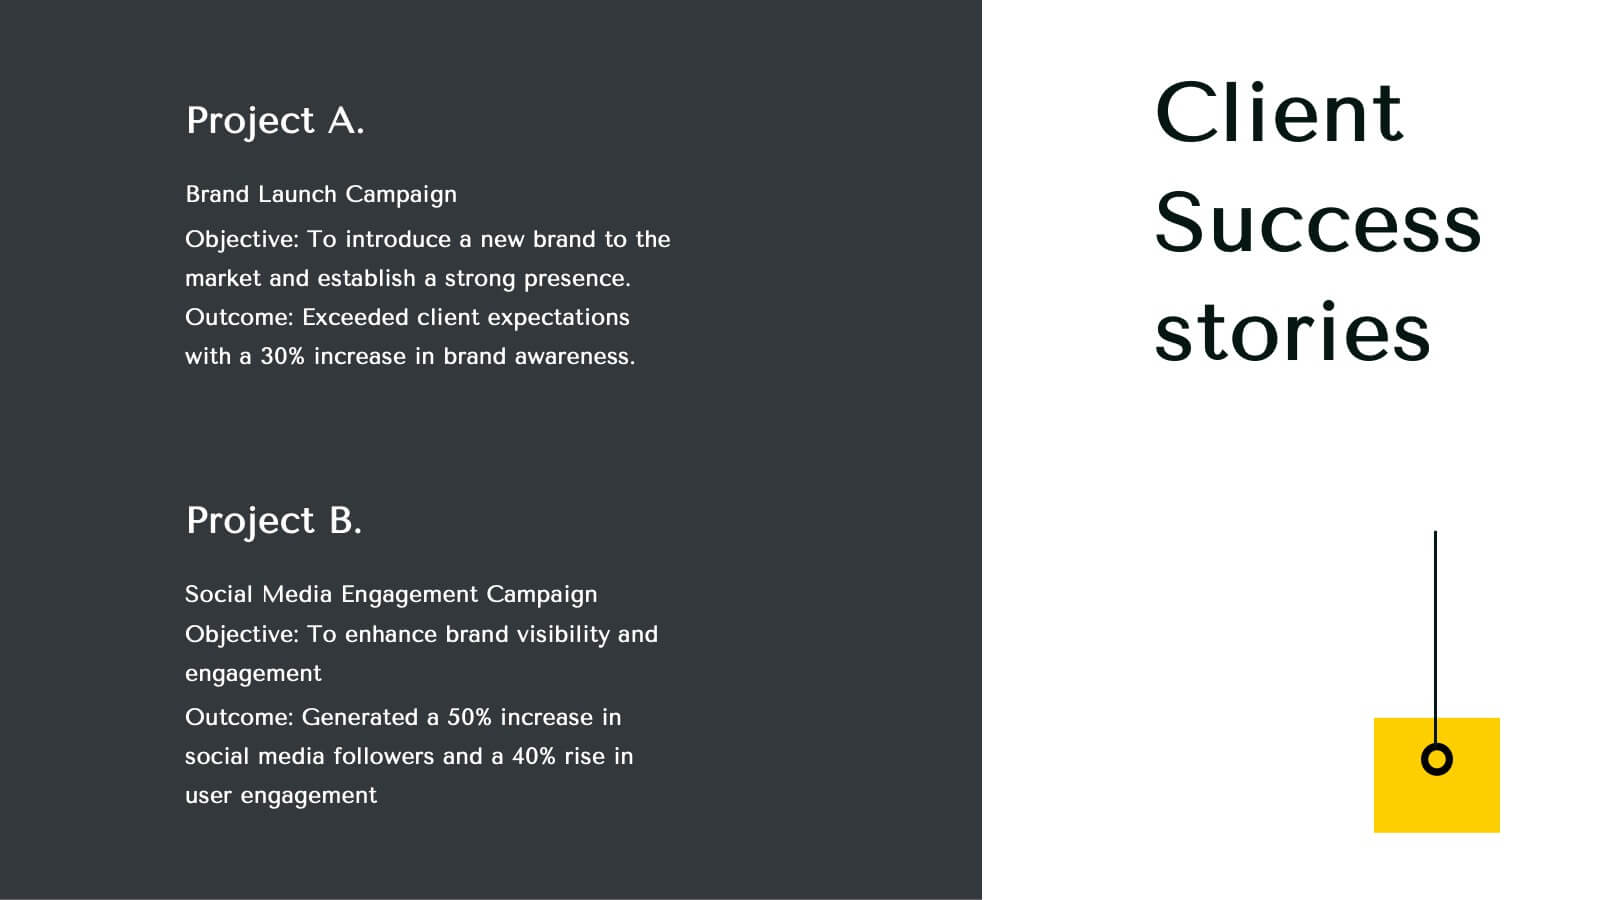
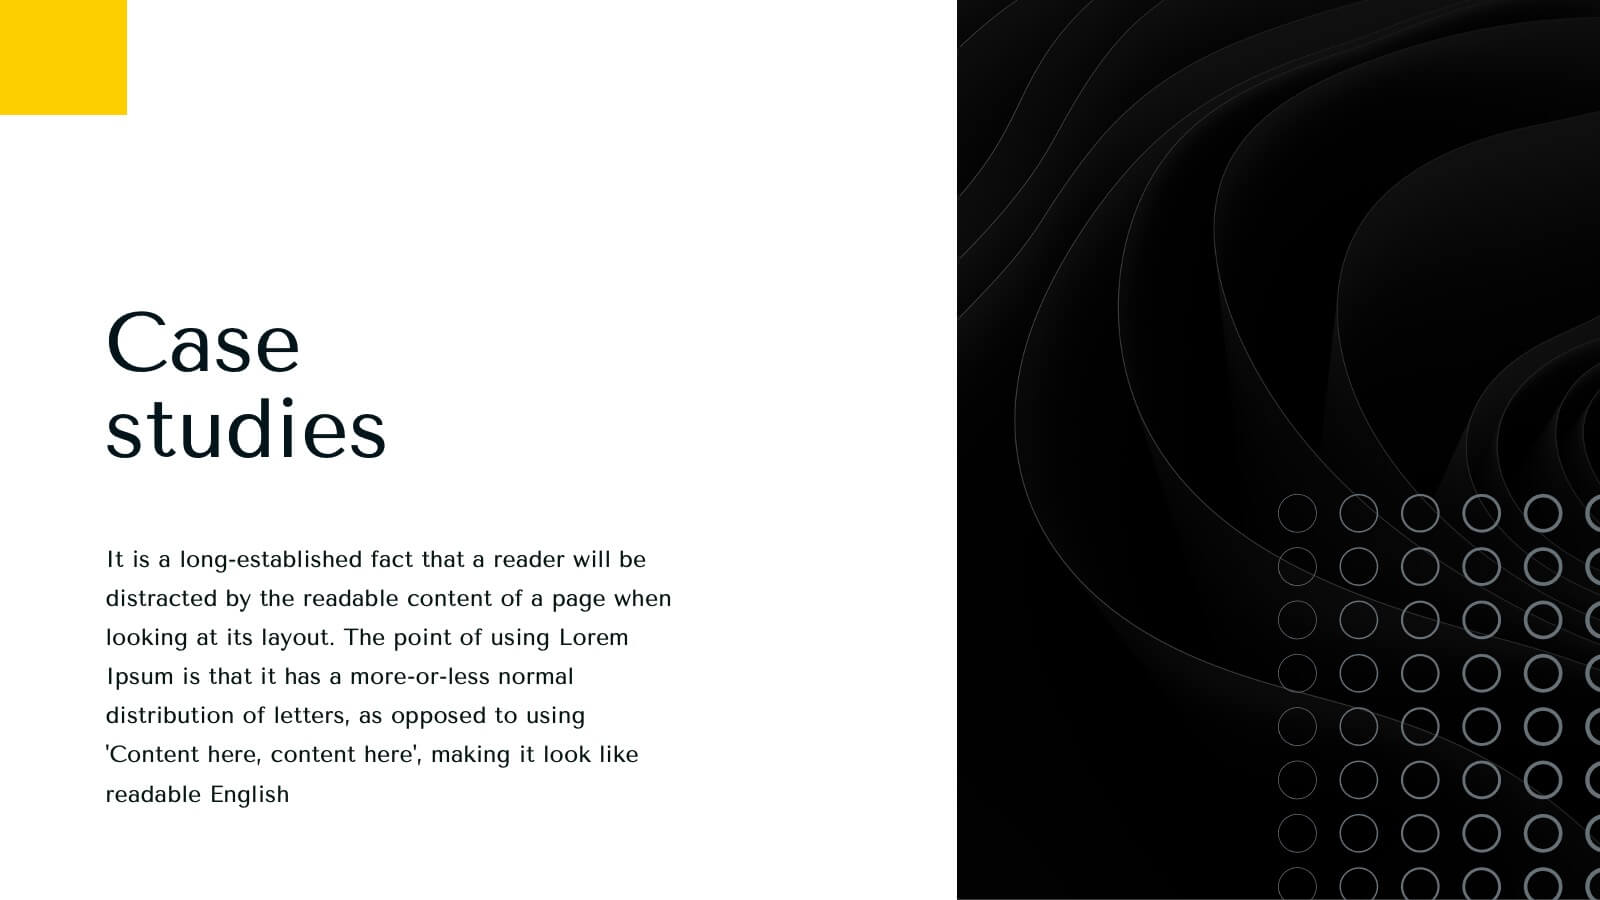
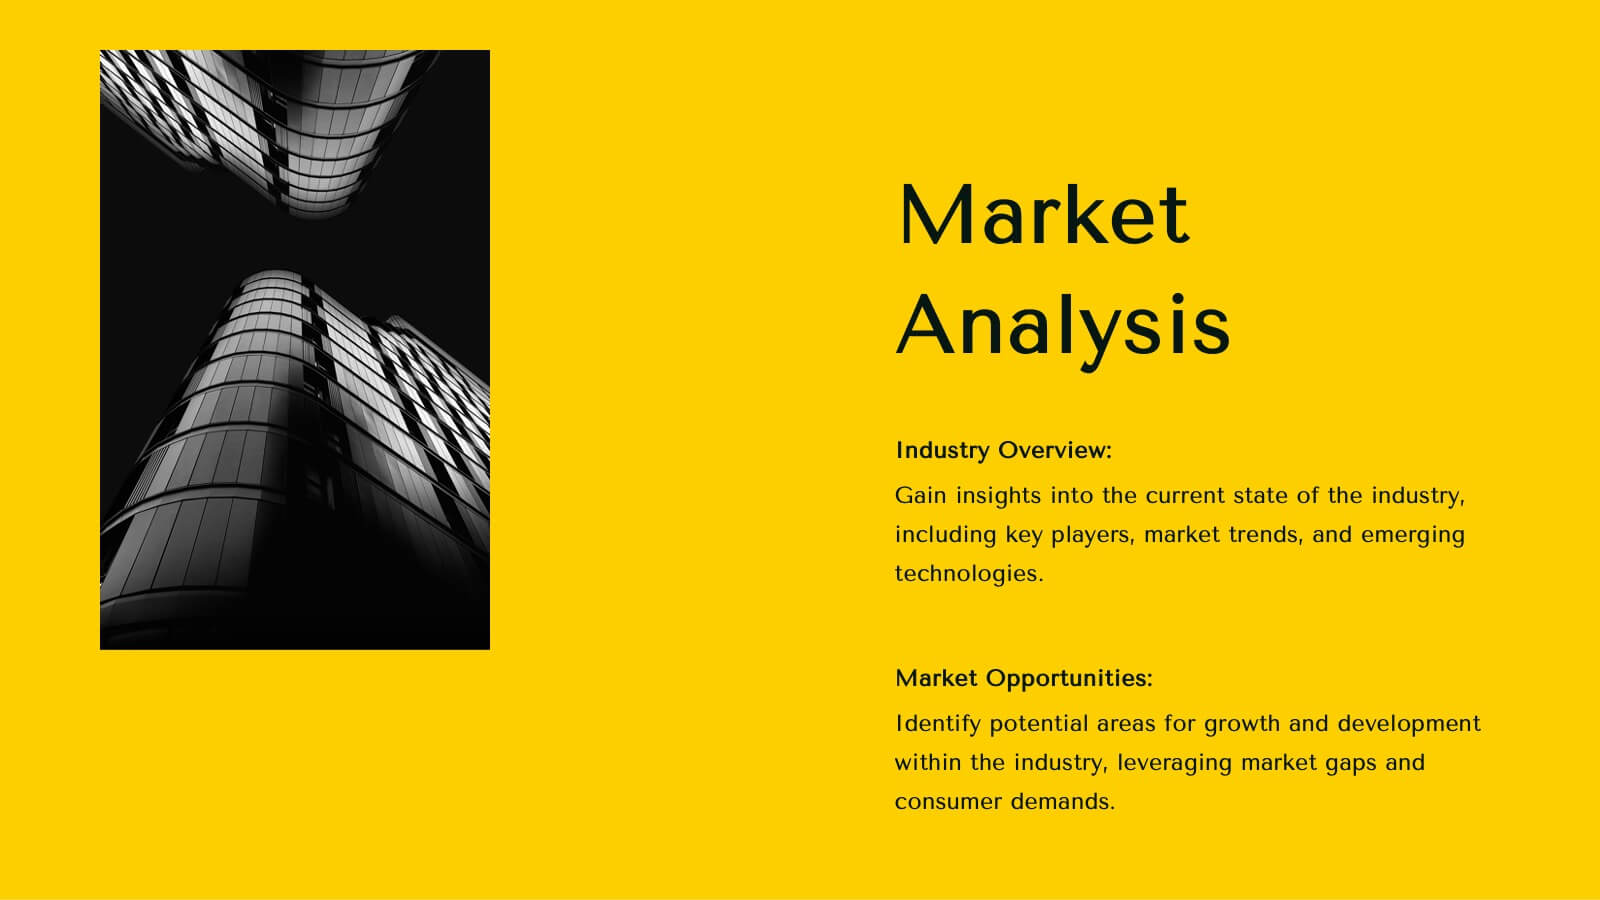
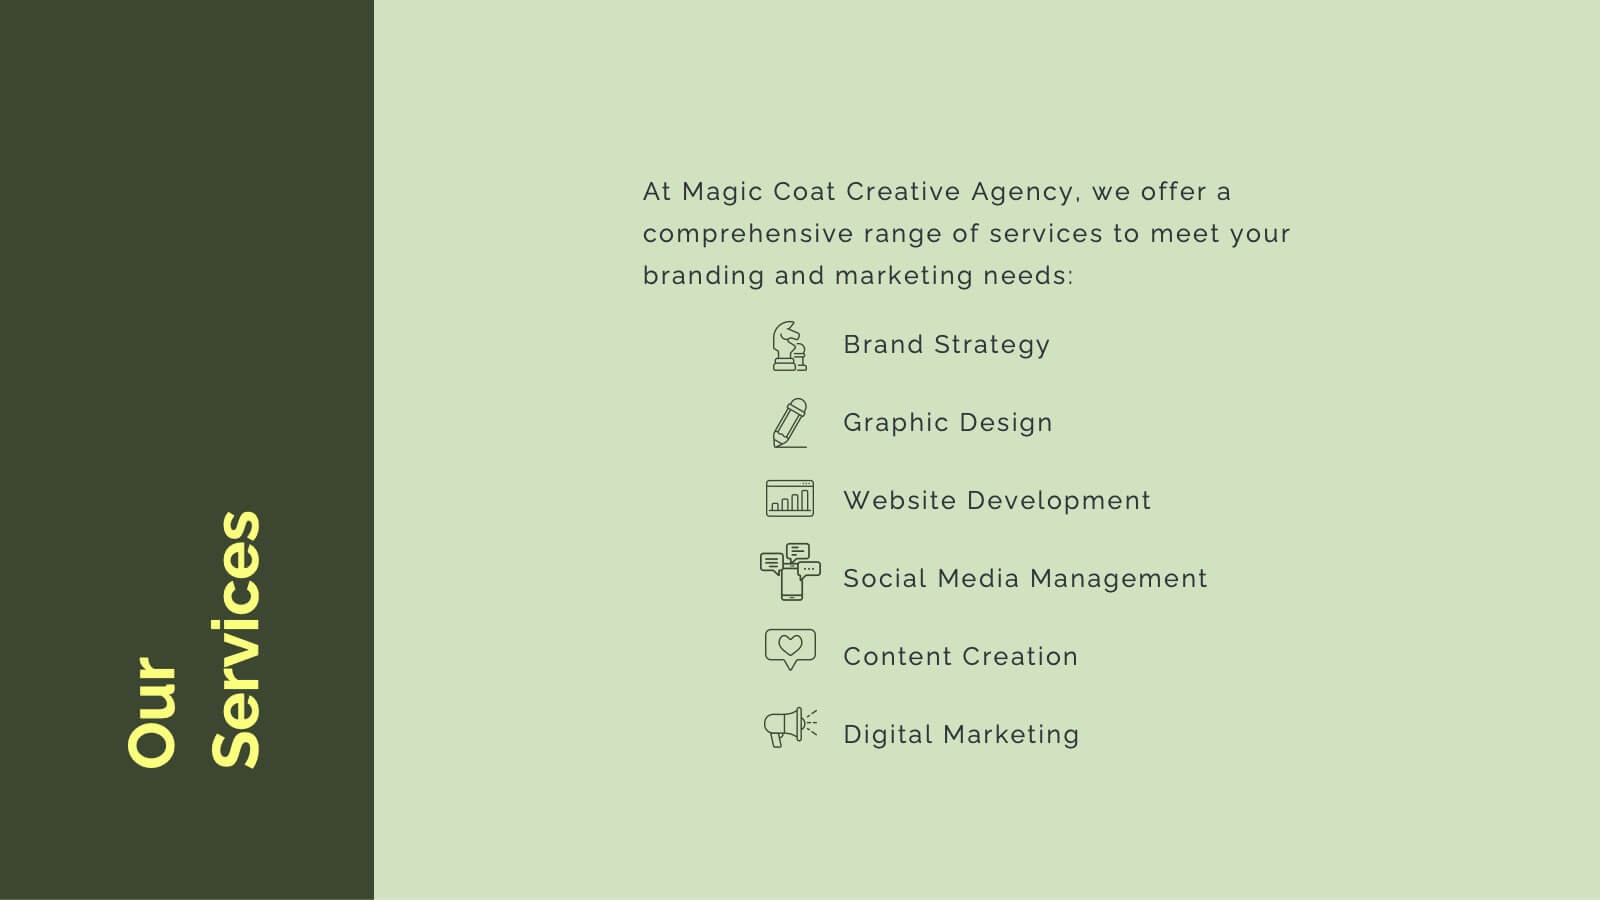
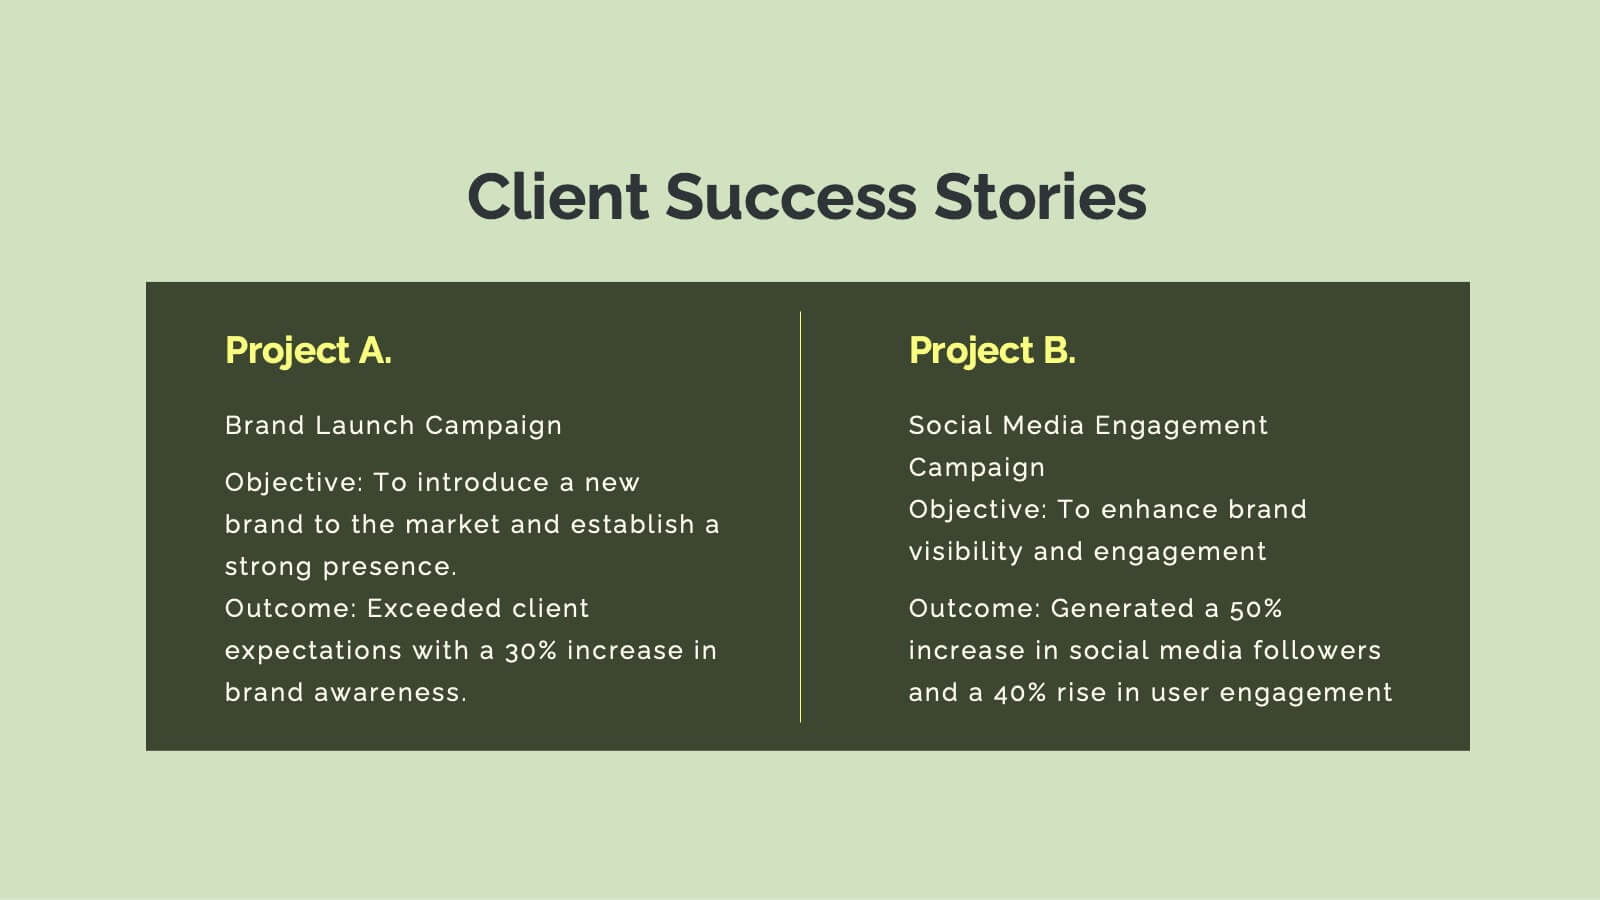
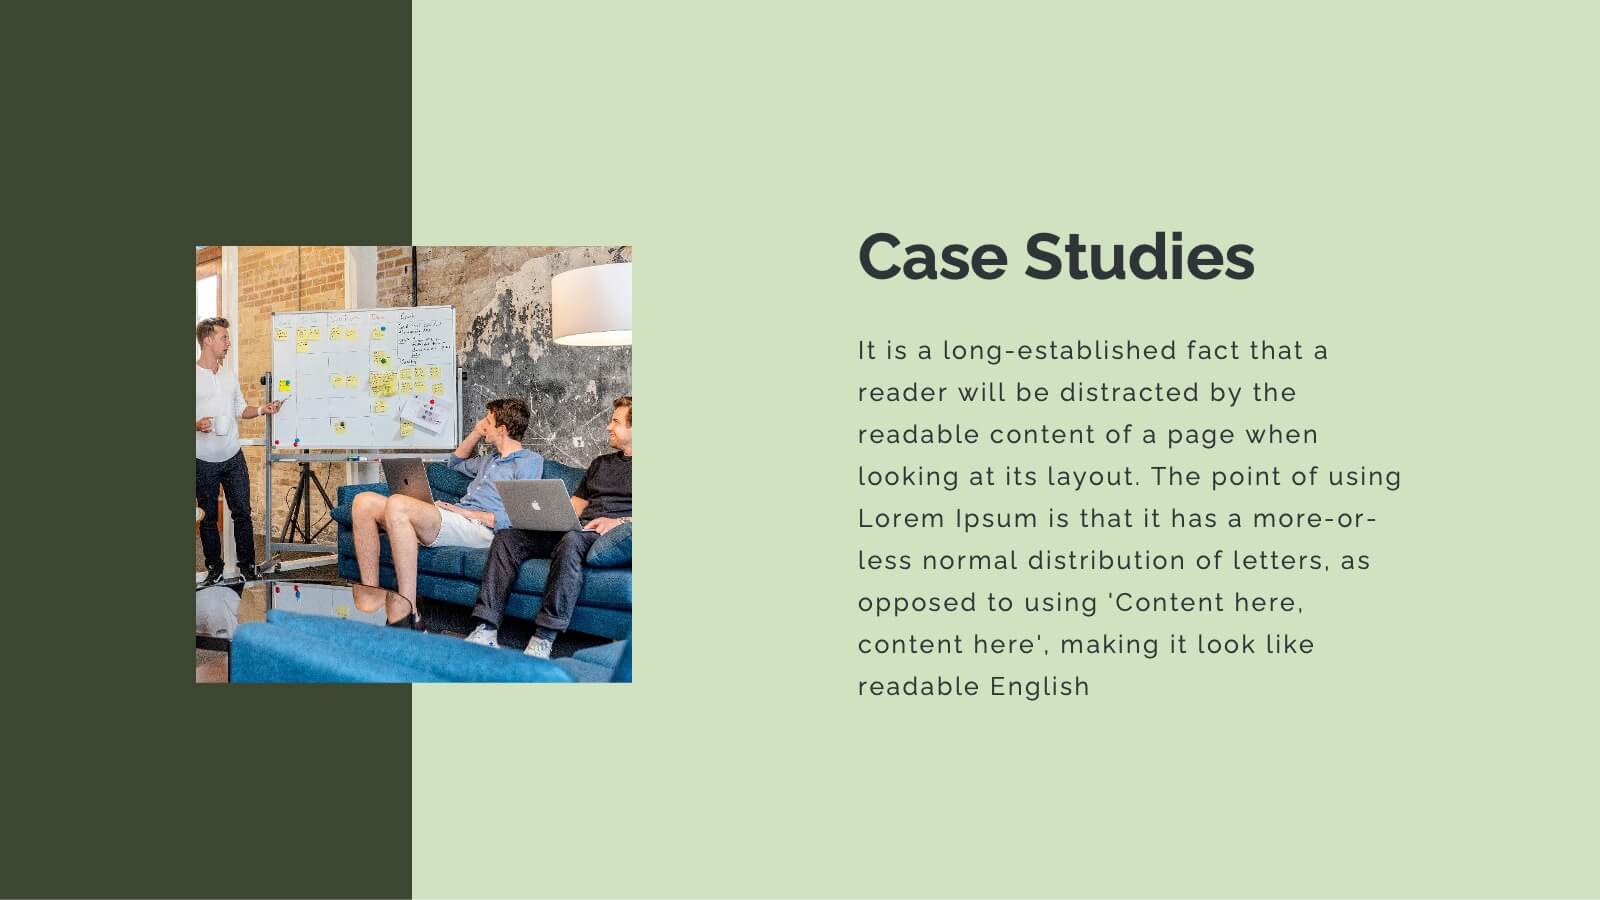
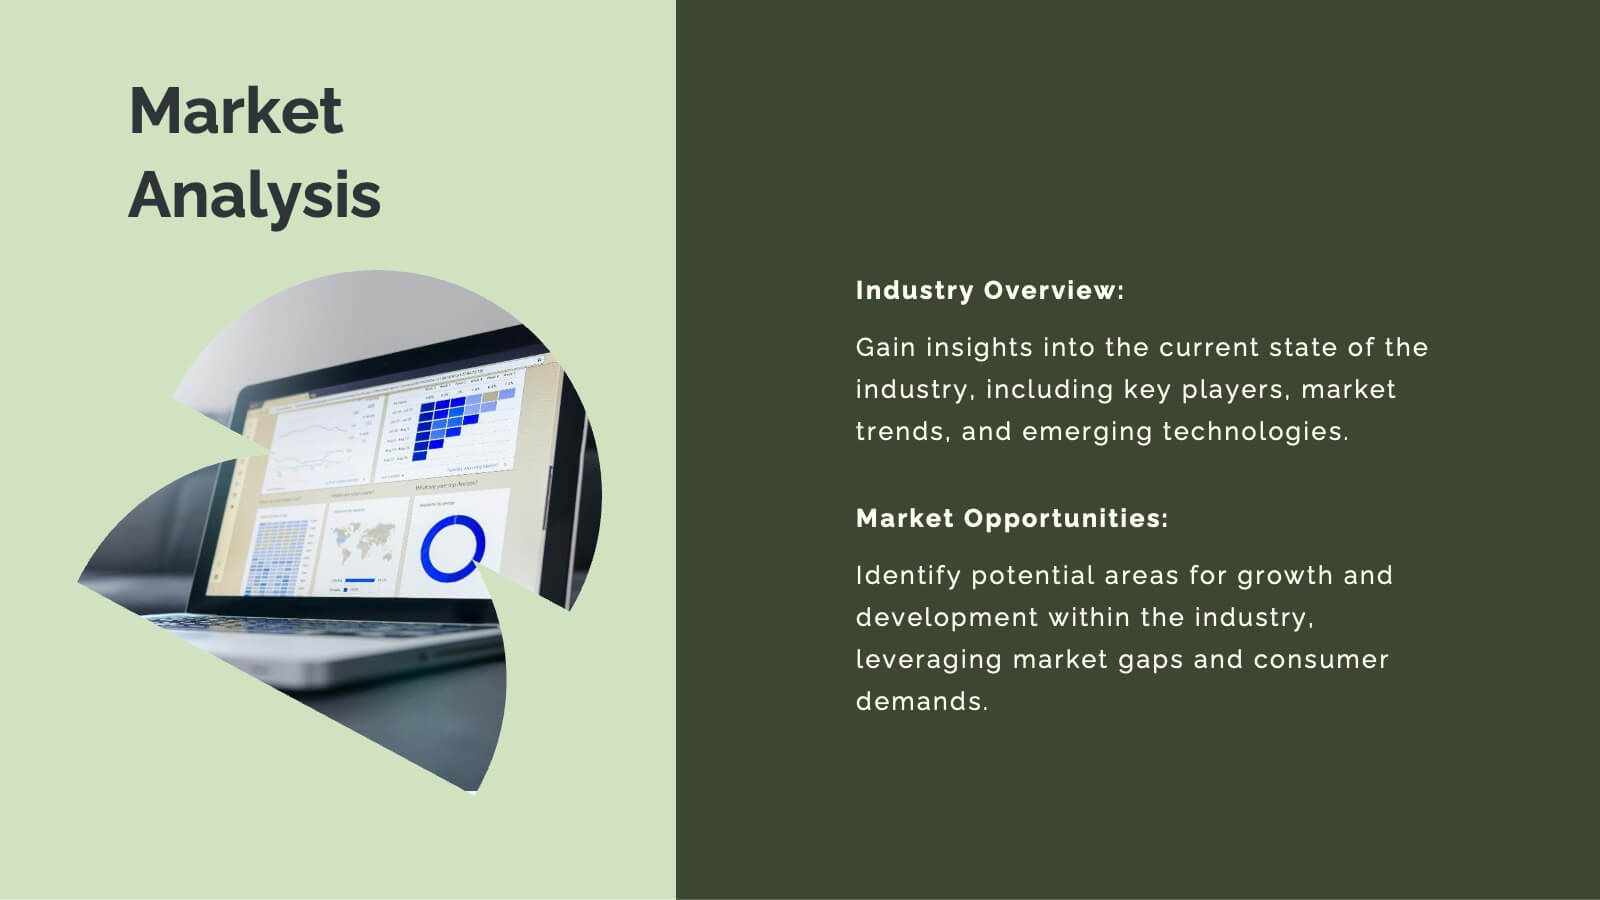
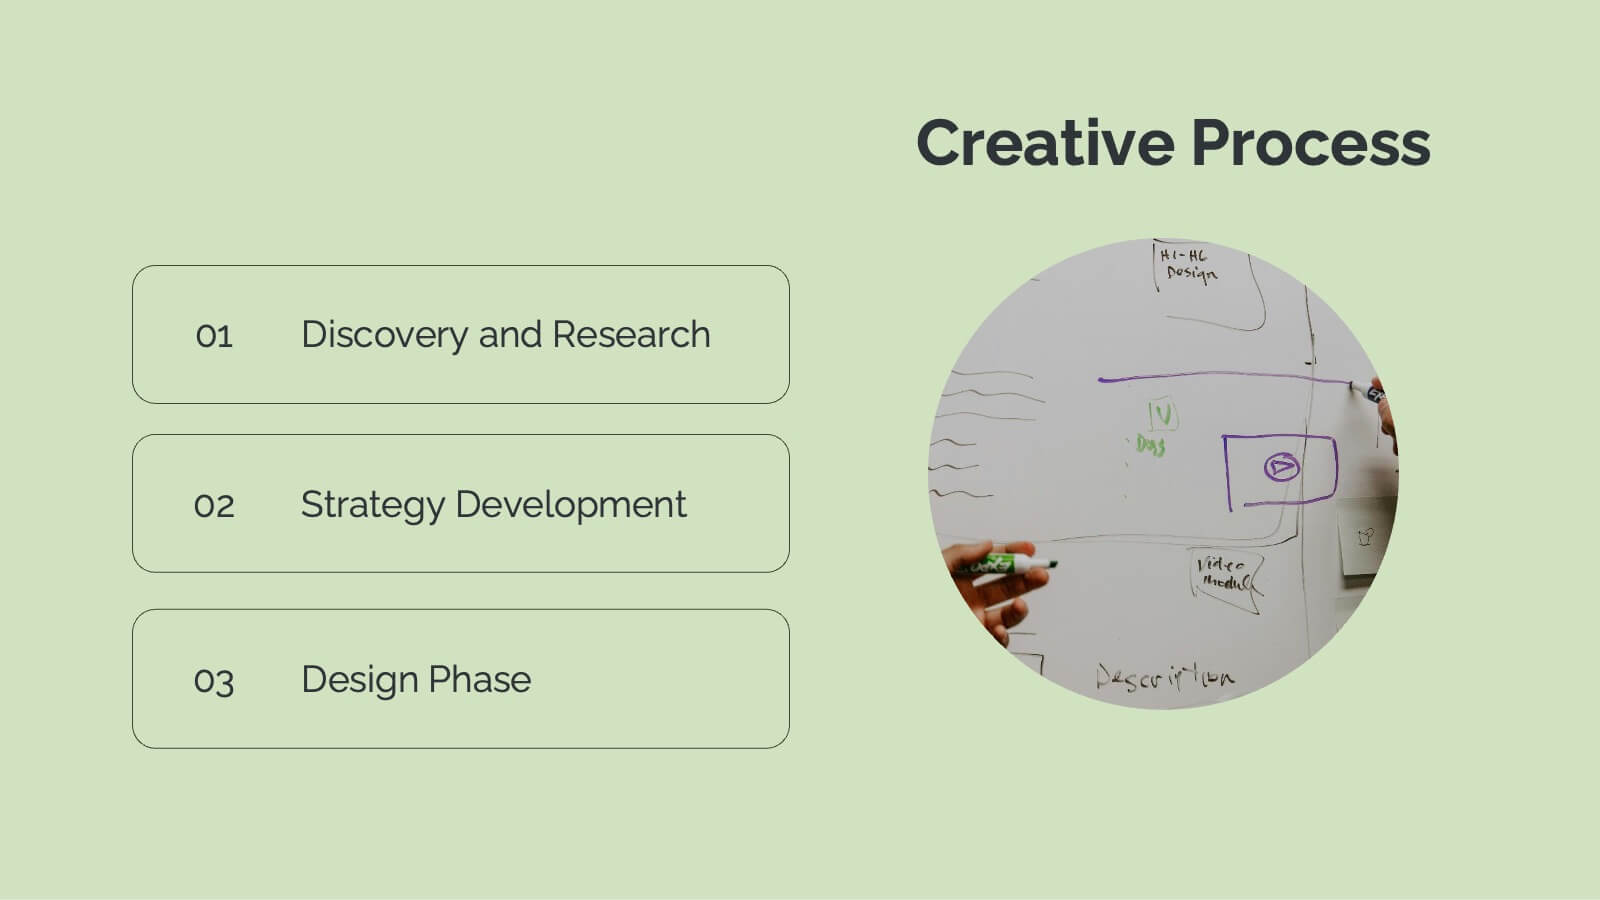
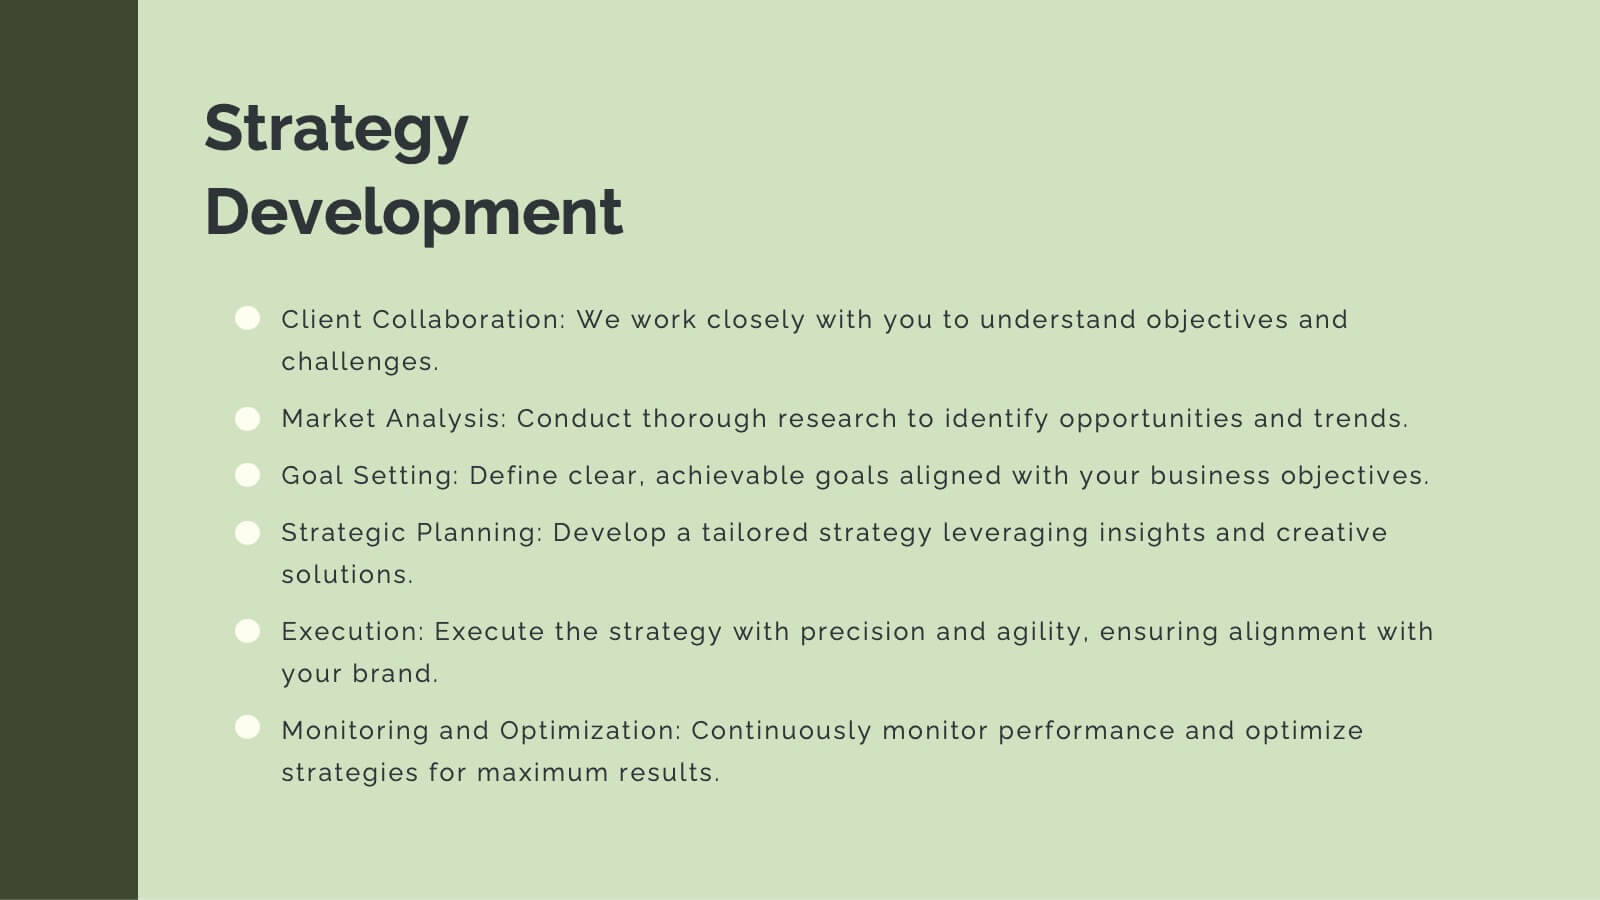
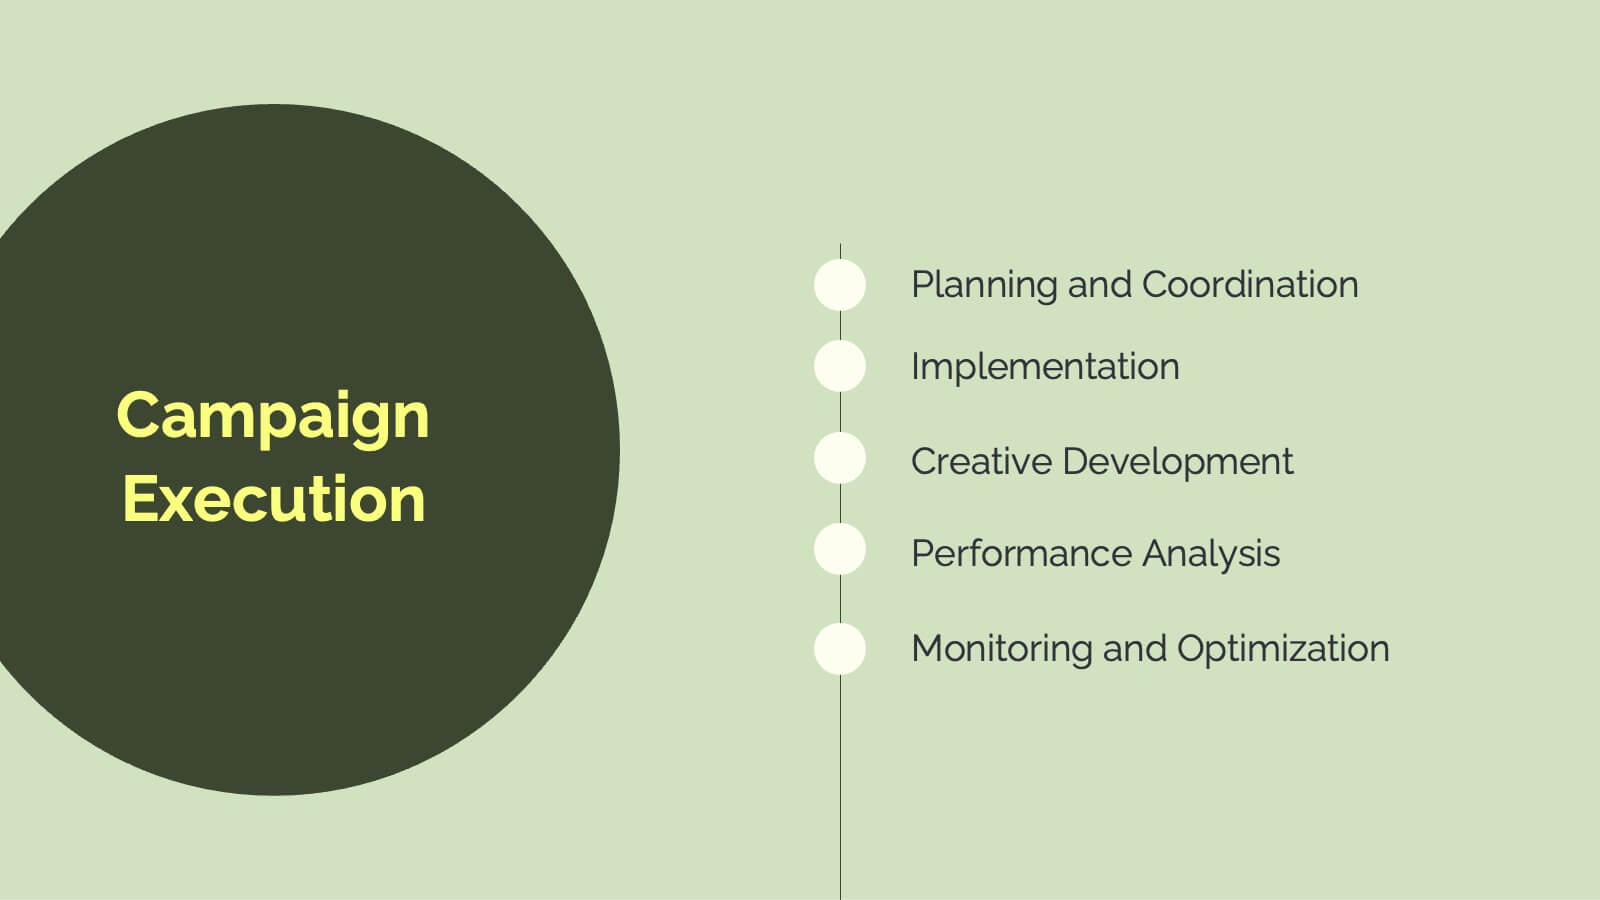
Infinity Agency Portfolio Presentation
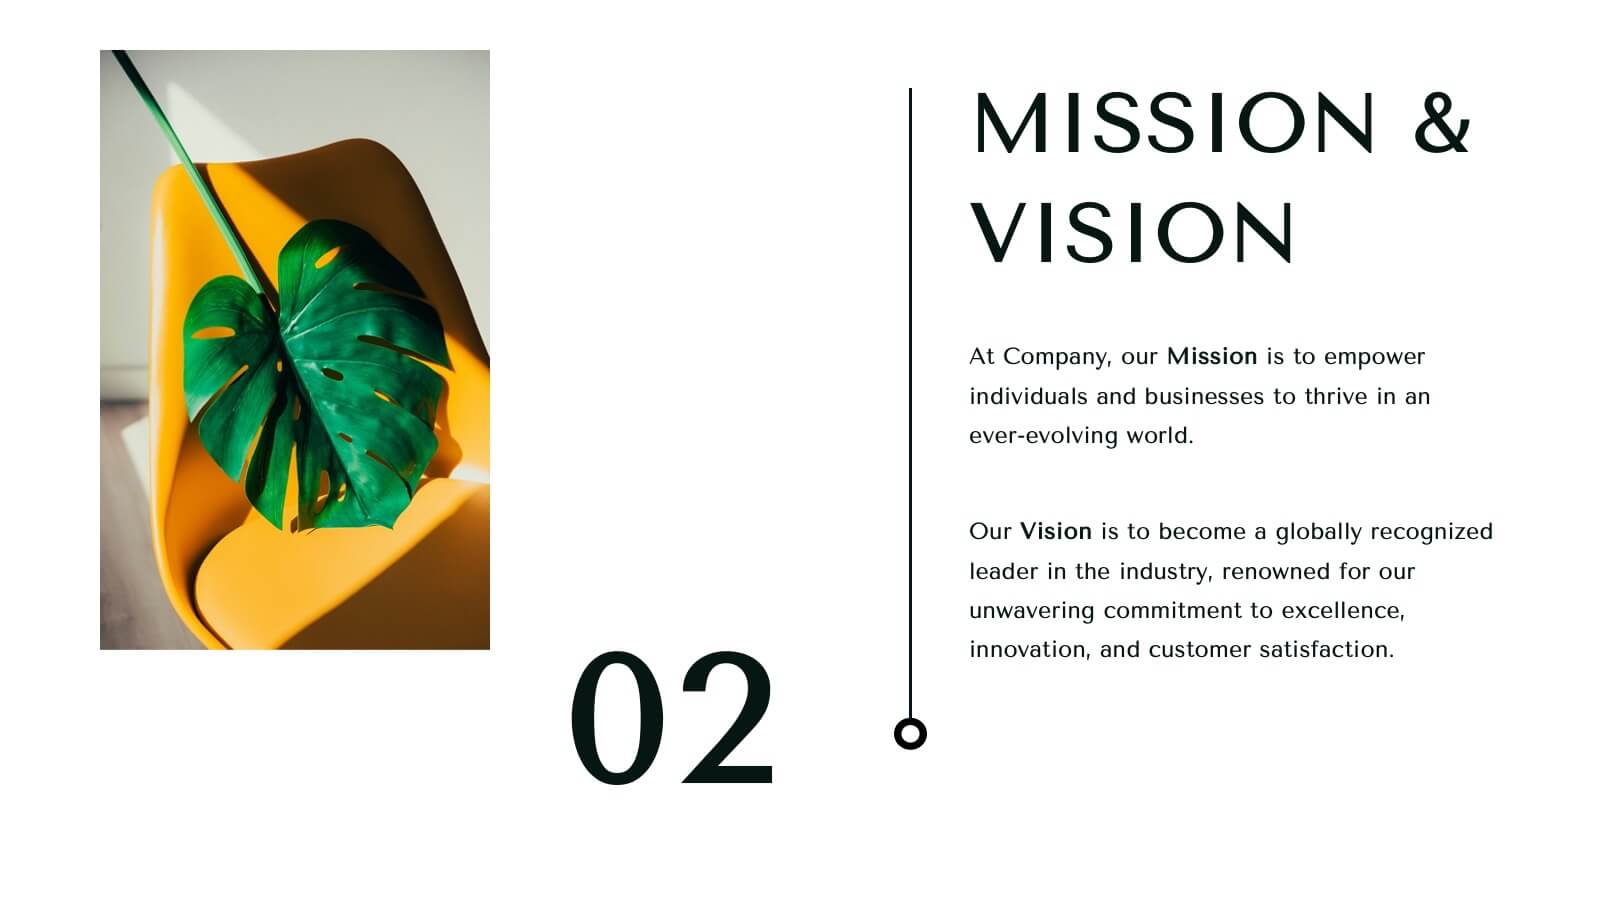
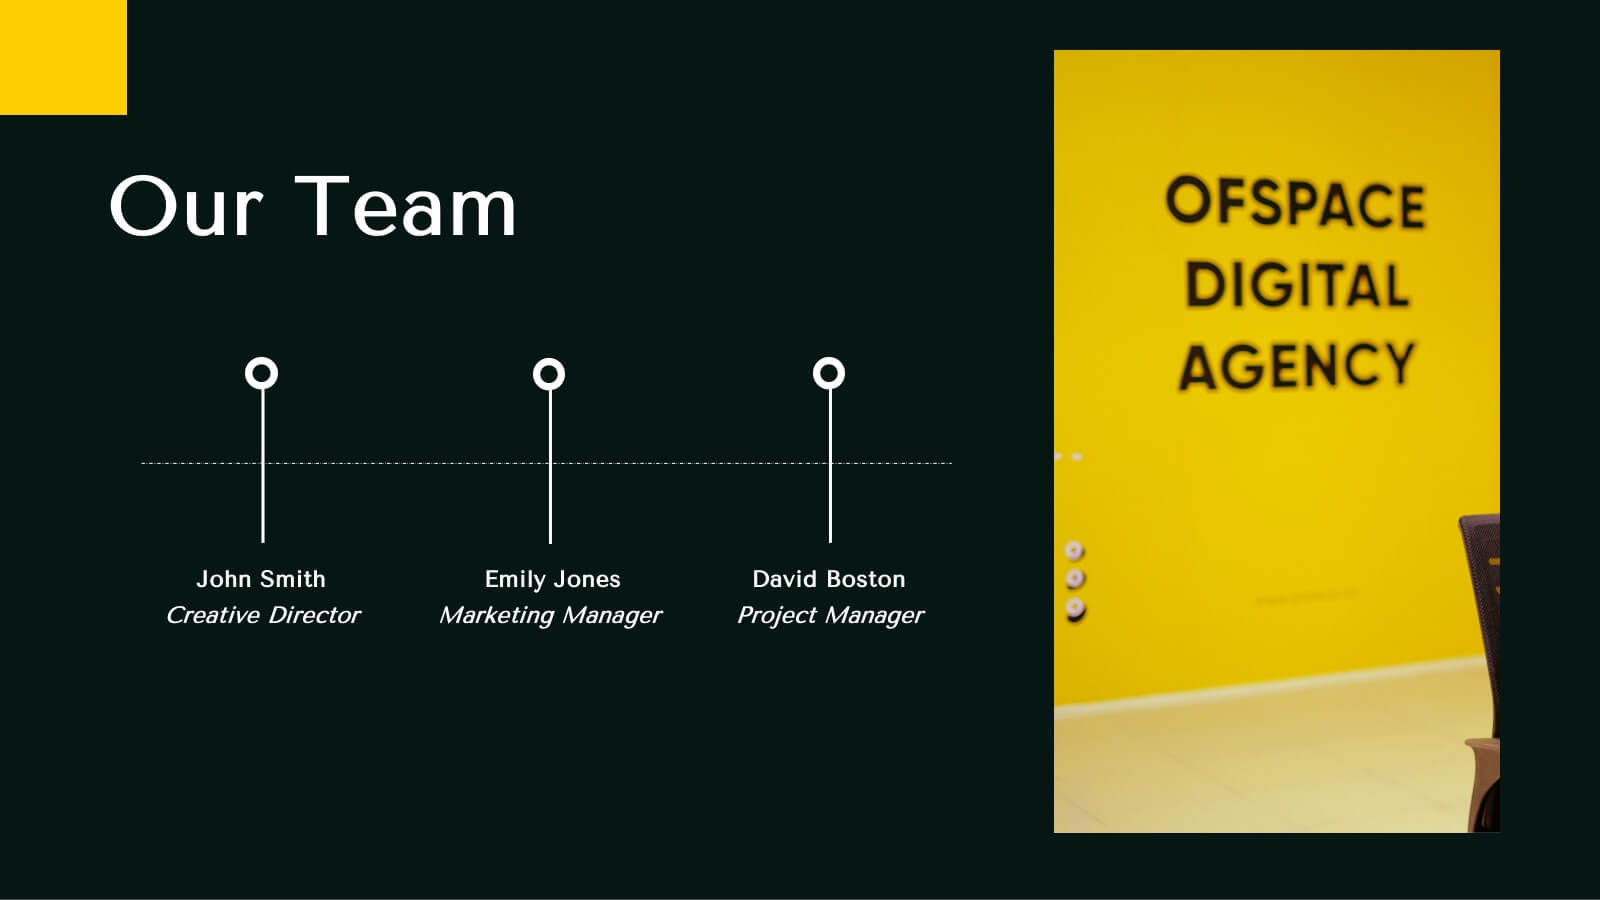
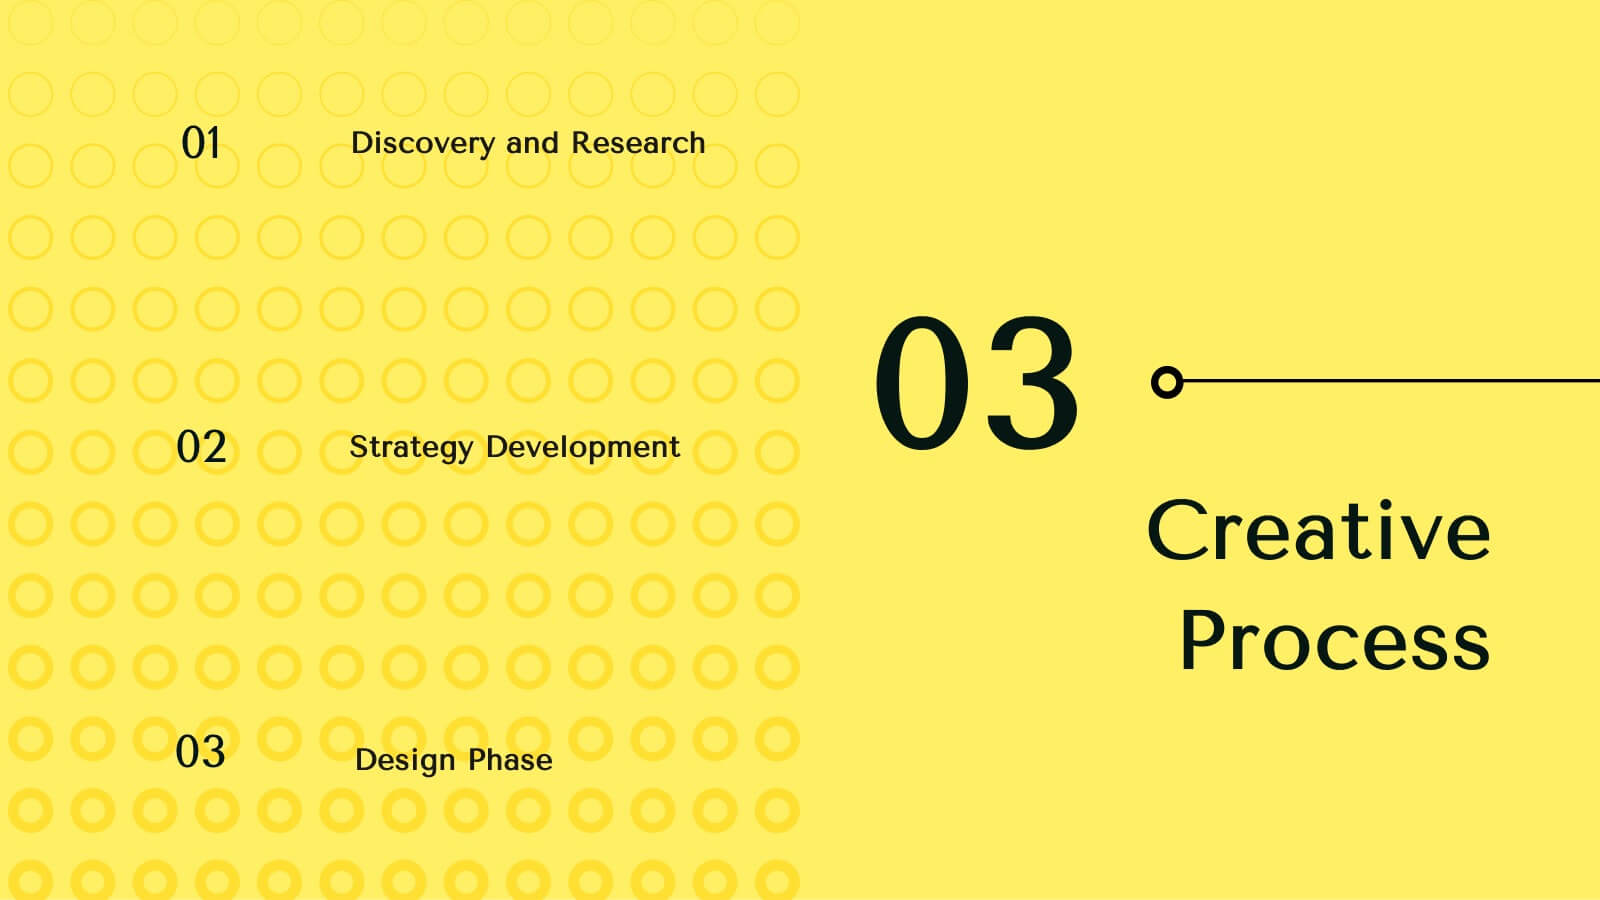
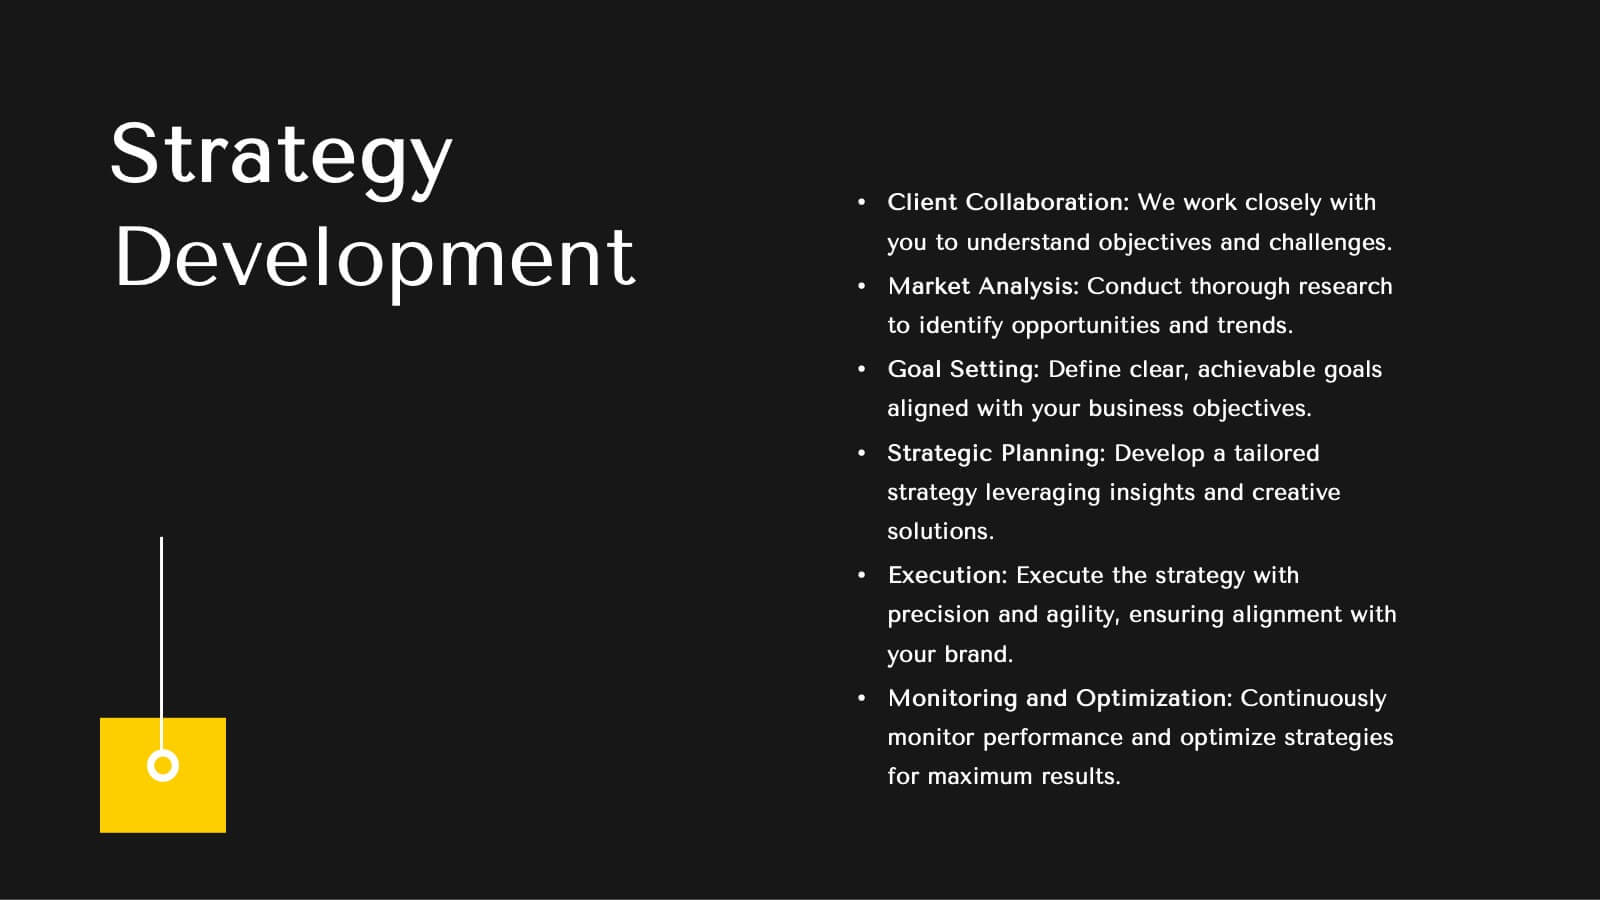
Showcase your agency's excellence with this dynamic and modern presentation template. Ideal for presenting market analysis, client success stories, and strategic development plans, it features a bold design with a vibrant yellow and black theme. Highlight your unique approach and creative process to captivate your audience. Compatible with PowerPoint, Keynote, and Google Slides, it's perfect for any platform.


26 slides
Wedding Planner Company Profile Presentation
A wedding planner company is a specialized service provider that assists couples in planning, organizing, and coordinating their wedding day. This beautiful template is tailored for wedding planning companies looking to showcase their services and expertise. With this presentation, wedding planners can present their company's unique offerings, experience, and past successful events in an engaging and elegant manner. This presentation features an elegant and romantic design that reflects the essence of weddings. It incorporates soft colors, floral patterns, and beautiful imagery to create a sophisticated and enchanting atmosphere.


21 slides
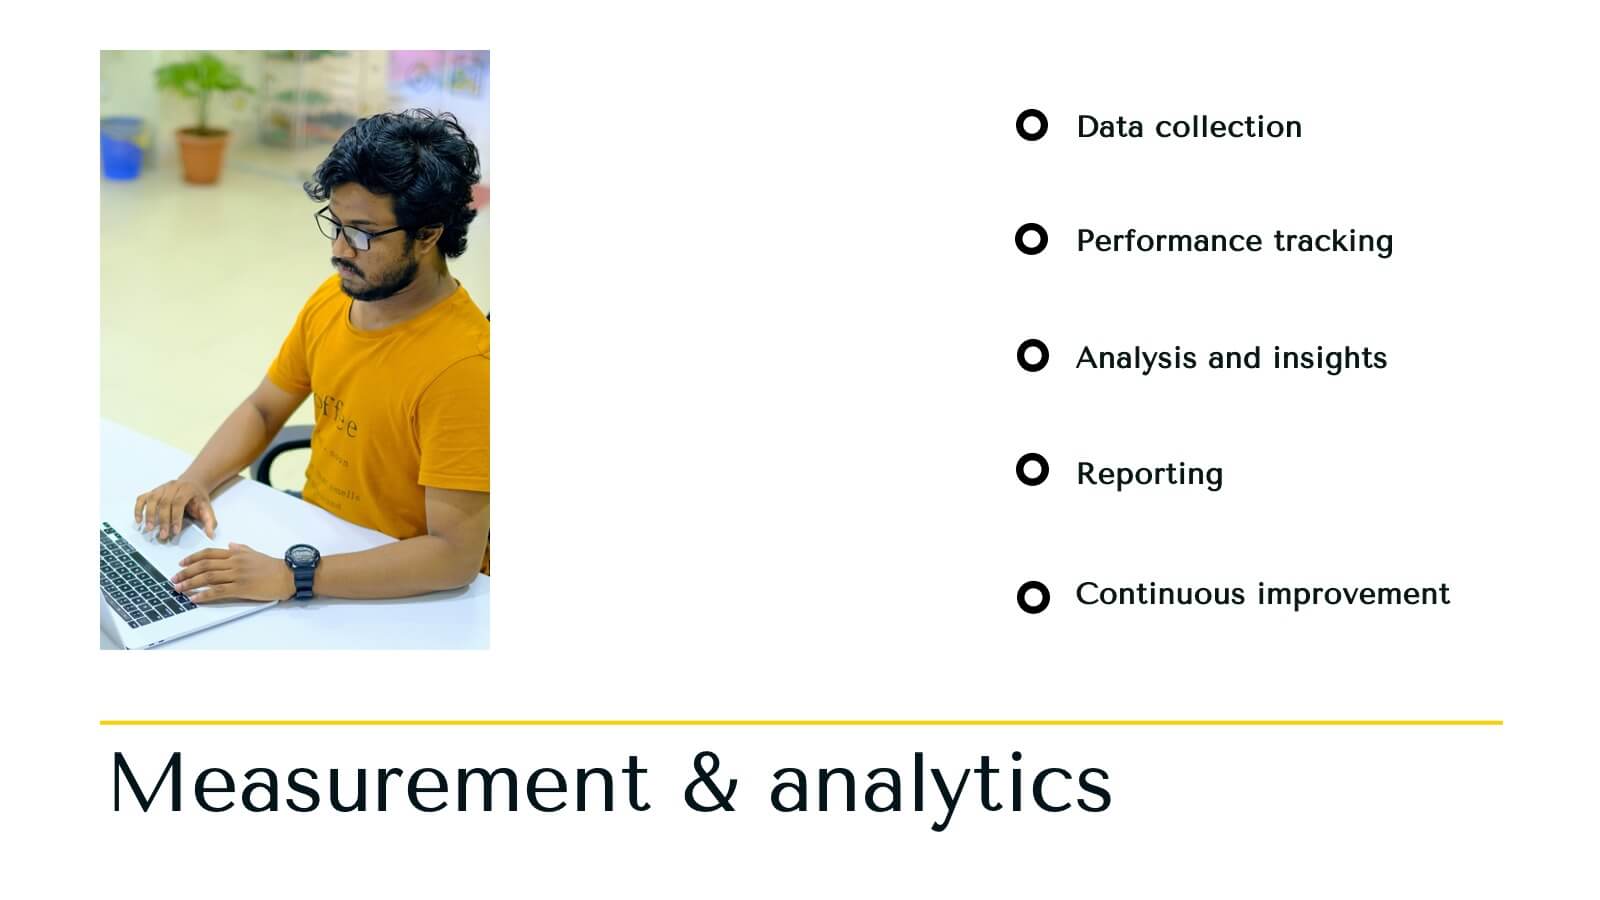
Horizon Advertising Agency Proposal Presentation
Elevate your advertising impact with this comprehensive agency proposal template. It’s meticulously designed to showcase your agency’s capabilities from strategic planning to creative execution, ensuring a persuasive presentation of services like market analysis, campaign strategies, and client success stories. Each slide is formatted to facilitate understanding and engagement, making it perfect for highlighting your team's expertise and unique approach. Compatible with major presentation platforms like PowerPoint, Google Slides, and Keynote, this template supports your efforts to secure new clients and projects seamlessly across various devices.


5 slides
Economic Analysis of Europe Map Presentation
Visualize key economic indicators across European regions with this impactful map-based presentation. Use shaded country highlights and accompanying bar charts to present comparative data, performance trends, and regional growth. Ideal for economic reports, investor updates, or strategic planning. Fully editable and works seamlessly with PowerPoint, Keynote, and Google Slides.


5 slides
Business Strategy Planning Puzzle Presentation
Visualize interconnected initiatives with this Business Strategy Planning Puzzle Presentation. The magnifying glass design and five-piece puzzle format help you break down complex strategy components into digestible segments. Ideal for highlighting core objectives, key performance drivers, and strategic focus areas. Fully customizable with editable text boxes and icons. Compatible with PowerPoint, Keynote, and Google Slides.


8 slides
Identifying and Addressing Business Problems Presentation
Break down challenges with clarity using this structured 4-step business problem-solving slide. Highlight each issue with its own icon, number, and explanation, making it easy to communicate obstacles and outline solutions. Ideal for team strategy meetings, leadership briefings, or client reports. Fully customizable in PowerPoint, Keynote, and Google Slides.


8 slides
Cost Analysis and Budgeting Presentation
Easily assess financial performance with the Cost Analysis and Budgeting Presentation template. This visually engaging slide helps break down cost structures, budget allocation, and financial comparisons in a clear and professional manner. Ideal for financial analysts, business strategists, and project managers presenting financial data. Fully editable in PowerPoint, Keynote, and Google Slides for effortless customization.


6 slides
Risk Prevention and Security Measures Presentation
Enhance your safety strategy with this professional infographic slide. Designed to highlight five key risk and security areas, it features a clean, diamond layout with icon-based callouts. Ideal for business continuity plans, risk assessments, or compliance reports. Fully editable in PowerPoint, Keynote, and Google Slides.


5 slides
Population Segmentation by Demographic Factors Presentation
Break down audience demographics with this segmented infographic slide. Featuring a vertical figure illustration divided into color-coded percentage bars, it’s ideal for showcasing traits like age, gender, or location. This layout offers a clear visual summary, making it perfect for reports, marketing briefs, or investor presentations. Fully editable in Canva.


6 slides
Multiple Choice Options Slide Presentation
Make your ideas stand out with a bold, interactive design that organizes multiple options clearly and visually. Ideal for showcasing comparisons, scenarios, or decision pathways, this presentation keeps audiences engaged and informed. Fully compatible with PowerPoint, Keynote, and Google Slides for seamless customization and professional results.


4 slides
Project Milestone Path Roadmap Presentation
Bring your project plan to life with a clean, colorful layout that makes every milestone easy to follow across each quarter. This presentation helps you organize tasks, timelines, and progress in a clear visual path that supports smarter planning and team alignment. Fully compatible with PowerPoint, Keynote, and Google Slides.