


Features
- 6 Unique slides
- Fully editable and easy to edit in Microsoft Powerpoint, Keynote and Google Slides
- 16:9 widescreen layout
- Clean and professional designs
- Export to JPG, PDF or send by email


Do you have any questions?
Recommend


4 slides
Customers Journey Map Presentation
Take your audience on a smooth, visual adventure that clearly outlines each stage of the customer experience. This presentation helps you map behaviors, highlight key interactions, and explain decision points with clarity and style. Designed for easy customization and fully compatible with PowerPoint, Keynote, and Google Slides.


6 slides
Three-Part Comparative Venn Layout Presentation
Showcase relationships, overlaps, and distinctions across three core elements with this elegant petal-style Venn layout. Perfect for comparing strategies, audiences, or product features. Each section includes customizable labels and icons. Fully editable in PowerPoint, Keynote, and Google Slides—ideal for business analysis, educational presentations, and marketing plans.


20 slides
Venus Design Proposal Presentation
Present your design proposal with confidence using this sleek and professional layout! It includes everything from problem statements and proposed solutions to budget breakdowns, milestones, and team expertise, ensuring every detail is covered. Ideal for client presentations or internal project pitches, this template is fully compatible with PowerPoint, Keynote, and Google Slides.


6 slides
Product Launch Milestone Plan Presentation
Turn your big idea into a successful launch with this bold and structured presentation design. Perfect for outlining goals, tracking phases, and measuring progress, it keeps your product roadmap clear and engaging. Easily editable and compatible with PowerPoint, Keynote, and Google Slides for seamless presentation creation.


6 slides
3D Diagram Slide Presentation
Bring your ideas to life with this modern 3D visual layout that adds depth and clarity to any concept. Ideal for breaking down complex information into four connected sections, it enhances understanding through visual hierarchy. Fully customizable and compatible with PowerPoint, Keynote, and Google Slides for effortless use.


6 slides
Buyer Behavior Trends Infographic
Unlock the secrets of consumer psychology with our Buyer Behavior Trends Infographic Template. This template offers a compelling visual exploration of modern consumer trends, designed to capture and convey the nuances of buyer behavior in today’s fast-paced market. Featuring a sleek, modern design, each slide is tailored to present data effectively, from spending habits and brand loyalty to digital consumption and decision-making processes. Use this template to illustrate the underlying factors that influence consumer choices and how these trends shape the future of marketing. Perfect for marketers, researchers, and business strategists, this template allows you to customize layouts, colors, and fonts to align with your brand or study focus. It's an invaluable tool for presentations, reports, and digital content, helping you to communicate complex data in an accessible and engaging way.


5 slides
Strategic Planning with Foundational Pillars Presentation
Define the structure behind your strategic vision with the Strategic Planning with Foundational Pillars presentation. This template showcases four strong pillars beneath a classical pediment, symbolizing the stability and balance of your business strategy. Each pillar represents a core principle—perfect for themes like leadership, values, operations, or goals. Clean, modern, and entirely editable in PowerPoint, Keynote, and Google Slides, this visual works great for executive briefings, annual plans, or business consulting pitches.


5 slides
Five-Step Process Improvement Presentation
Streamline operations with the Five-Step Process Improvement presentation. This template visually maps out key phases of business optimization, using a structured timeline to highlight each step's purpose and impact. Perfect for project managers, consultants, and corporate strategists, this design helps teams track progress and refine workflows effectively. Fully editable and compatible with PowerPoint, Keynote, and Google Slides for effortless customization.


8 slides
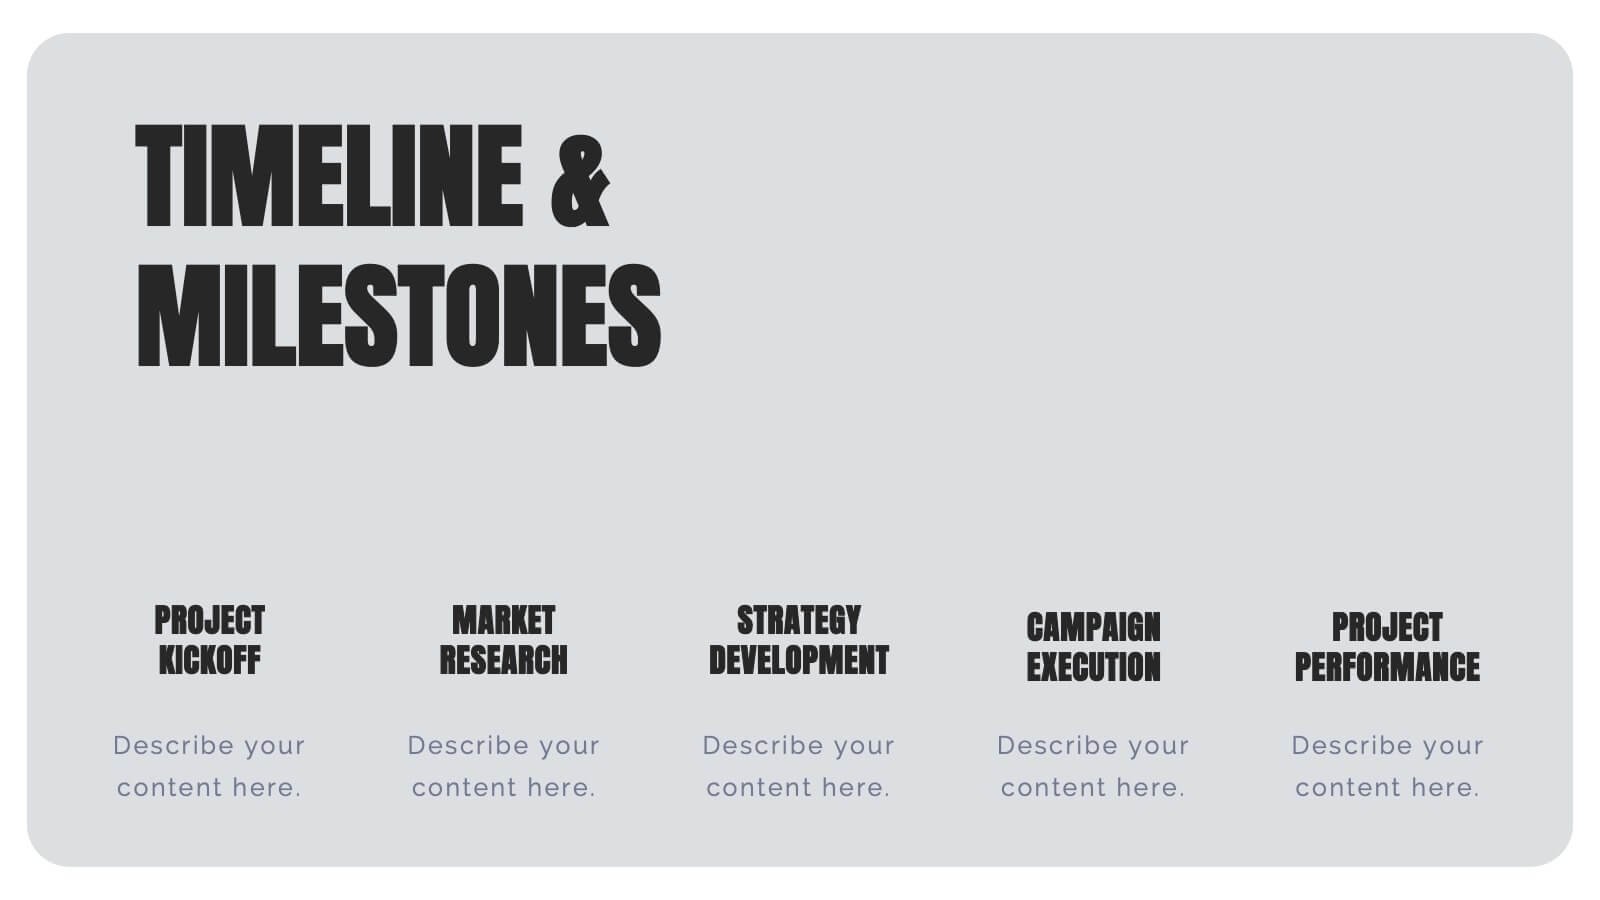
Project Milestones and Deliverables Presentation
Visualize your project’s journey with this step-by-step milestone timeline—ideal for tracking key phases, task ownership, or delivery checkpoints. The diagonal path connects colorful icons and editable text blocks, helping teams align on objectives and timelines. Compatible with PowerPoint, Keynote, and Google Slides.


4 slides
3-Tier Pricing Table Layout Presentation
Make your pricing pitch pop with this bold and modern layout! This presentation template is perfect for showcasing product or service plans with clear comparisons across three tiers. Designed to streamline pricing communication, it’s ideal for SaaS, consulting, or digital services. Fully compatible with PowerPoint, Keynote, and Google Slides.


6 slides
5G Technology Rollout and Future Vision Presentation
From 1G to 5G, tell the story of progress with this visually engaging infographic slide. Perfect for showcasing mobile network evolution, telecom innovation, or digital transformation strategies, each stage is clearly marked for simple, informative storytelling. Fully compatible with PowerPoint, Keynote, and Google Slides for easy editing and seamless presentation.


10 slides
Strategic Business Action Plan Presentation
Create a roadmap for success with the Strategic Business Action Plan presentation. This well-structured template provides a clear, step-by-step framework for executing business strategies, making it ideal for corporate teams, entrepreneurs, and business consultants. Its modern design ensures effective communication of key goals and objectives. Fully customizable and compatible with PowerPoint, Keynote, and Google Slides.


34 slides
Dragon Startup
Introducing our Dragon Start-up Template! This template is designed with a vibrant and energetic yellow color palette, perfect to convey a sense of optimism, creativity, and innovation. It features customizable slides that are specifically tailored for start-up presentations. The slides included cover various aspects of your pitch deck, such as company overview, problem statement, solution description, market analysis, business model, financial projections, and more. Each slide in this template is designed with a dynamic layout, featuring eye-catching yellow accents that add a sense of energy and excitement to your presentation.


4 slides
Clean Business Table Slide Design Presentation
Present your data with clarity using this Clean Business Table Slide Design presentation. Ideal for service comparisons, feature checklists, or role responsibilities, this layout uses simple icons and crisp tables for quick scanning. Professional and modern, it's perfect for client presentations or internal reports. Compatible with PowerPoint, Canva, and Google Slides.


22 slides
Runestone Scientific Research Presentation
The Scientific Research Presentation Template offers 22 clean and professional slides to present your research findings effectively. Cover key areas like objectives, methodology, data analysis, key findings, and future directions. Perfect for academic or professional settings, it's fully customizable and compatible with PowerPoint, Keynote, and Google Slides.

22 slides
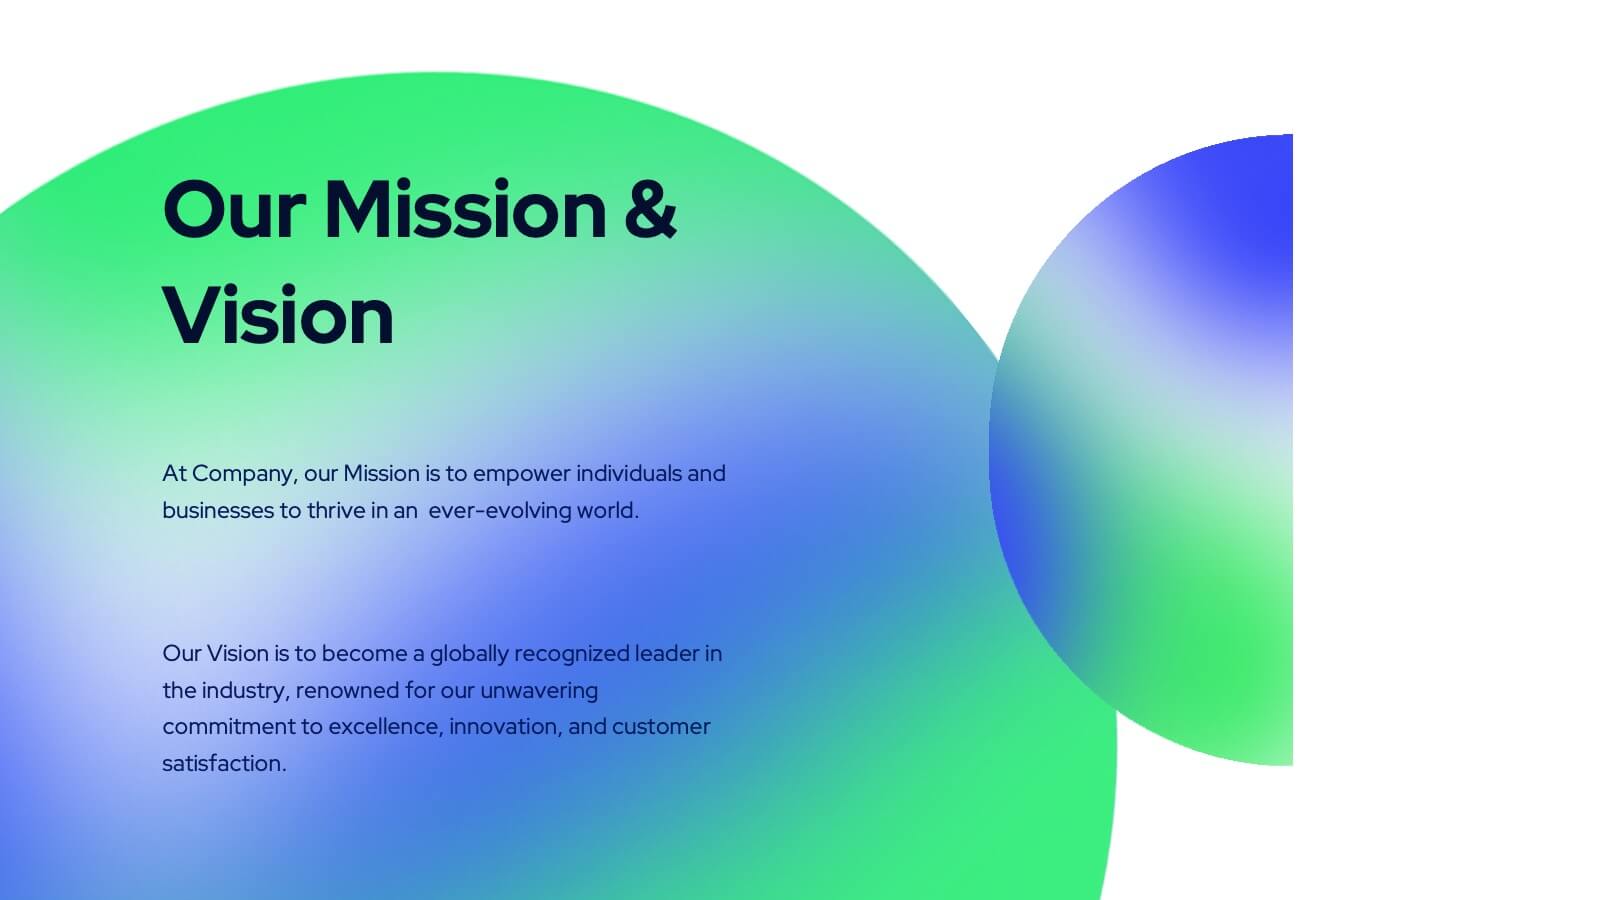
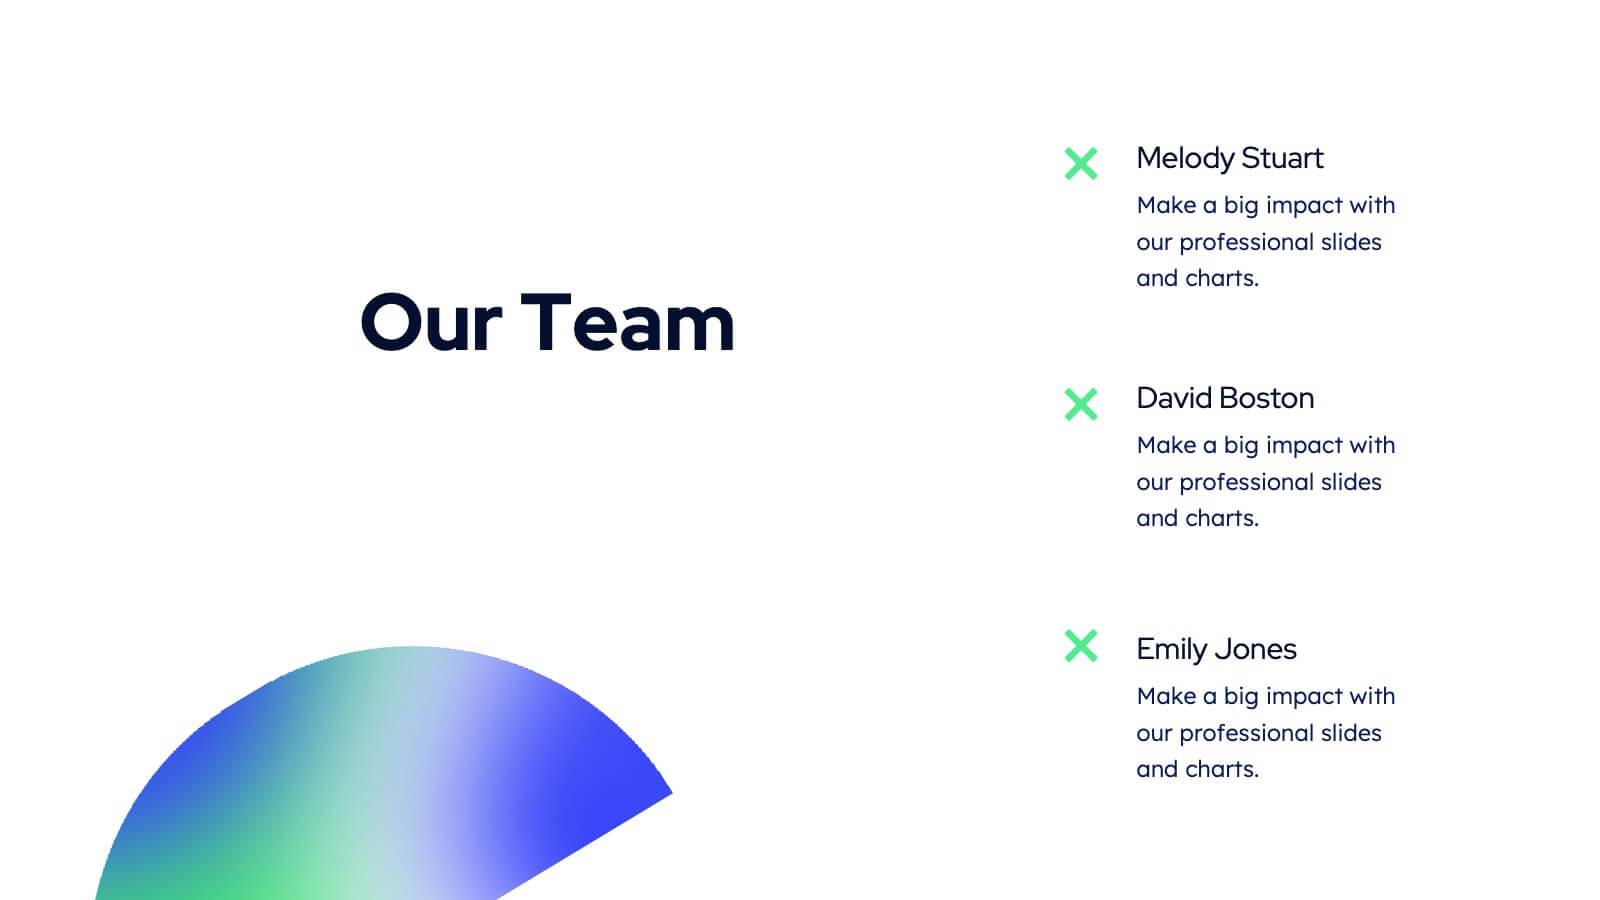
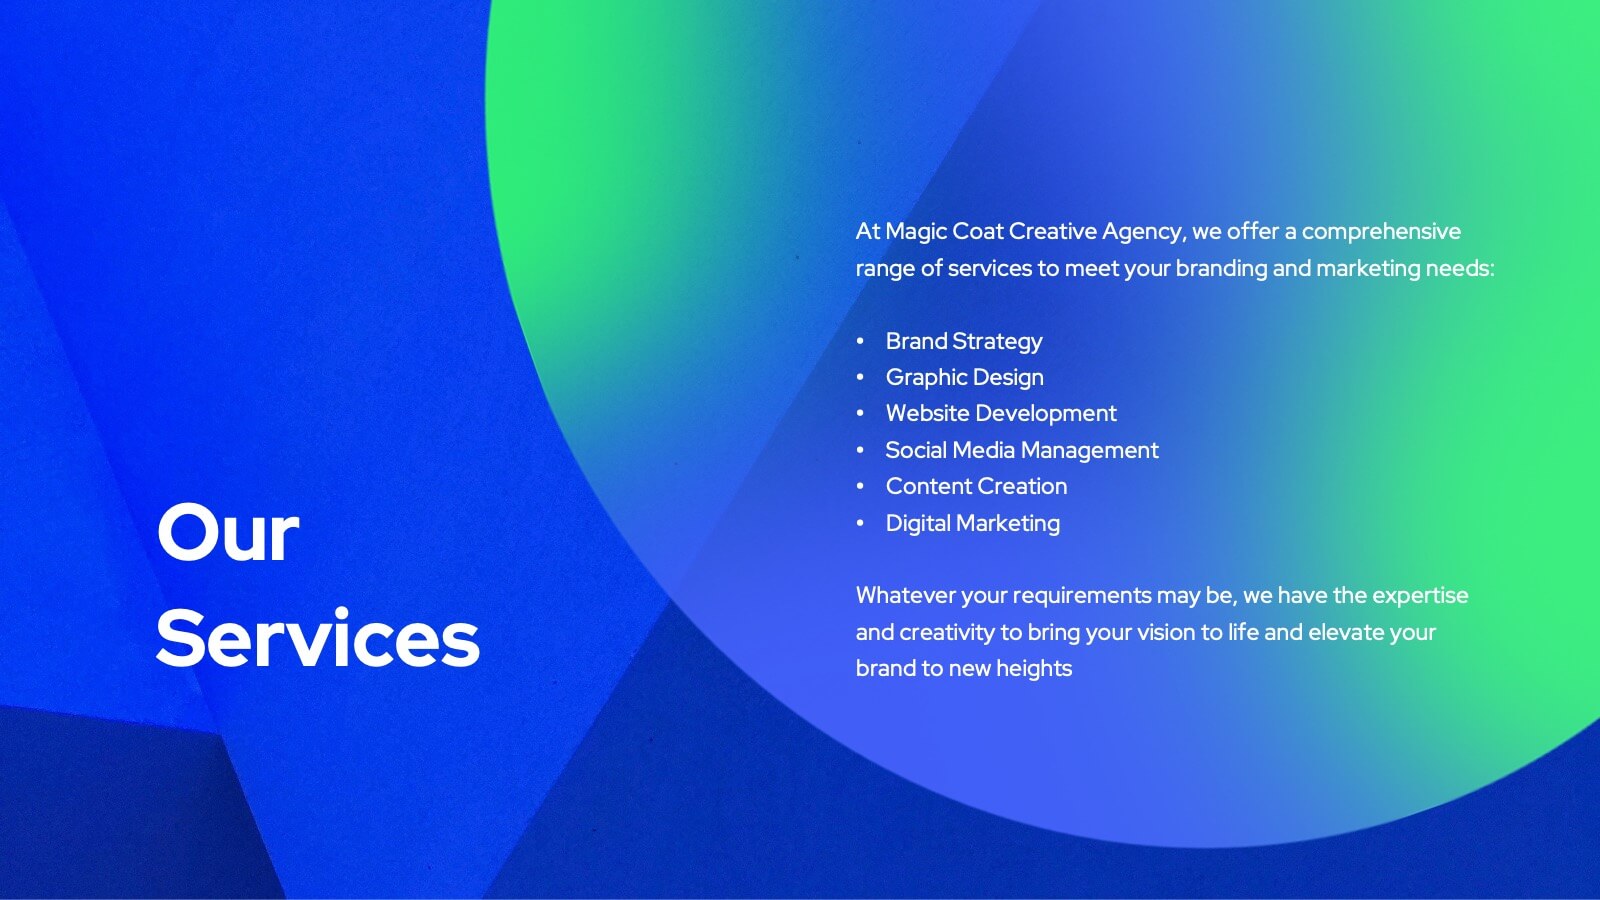
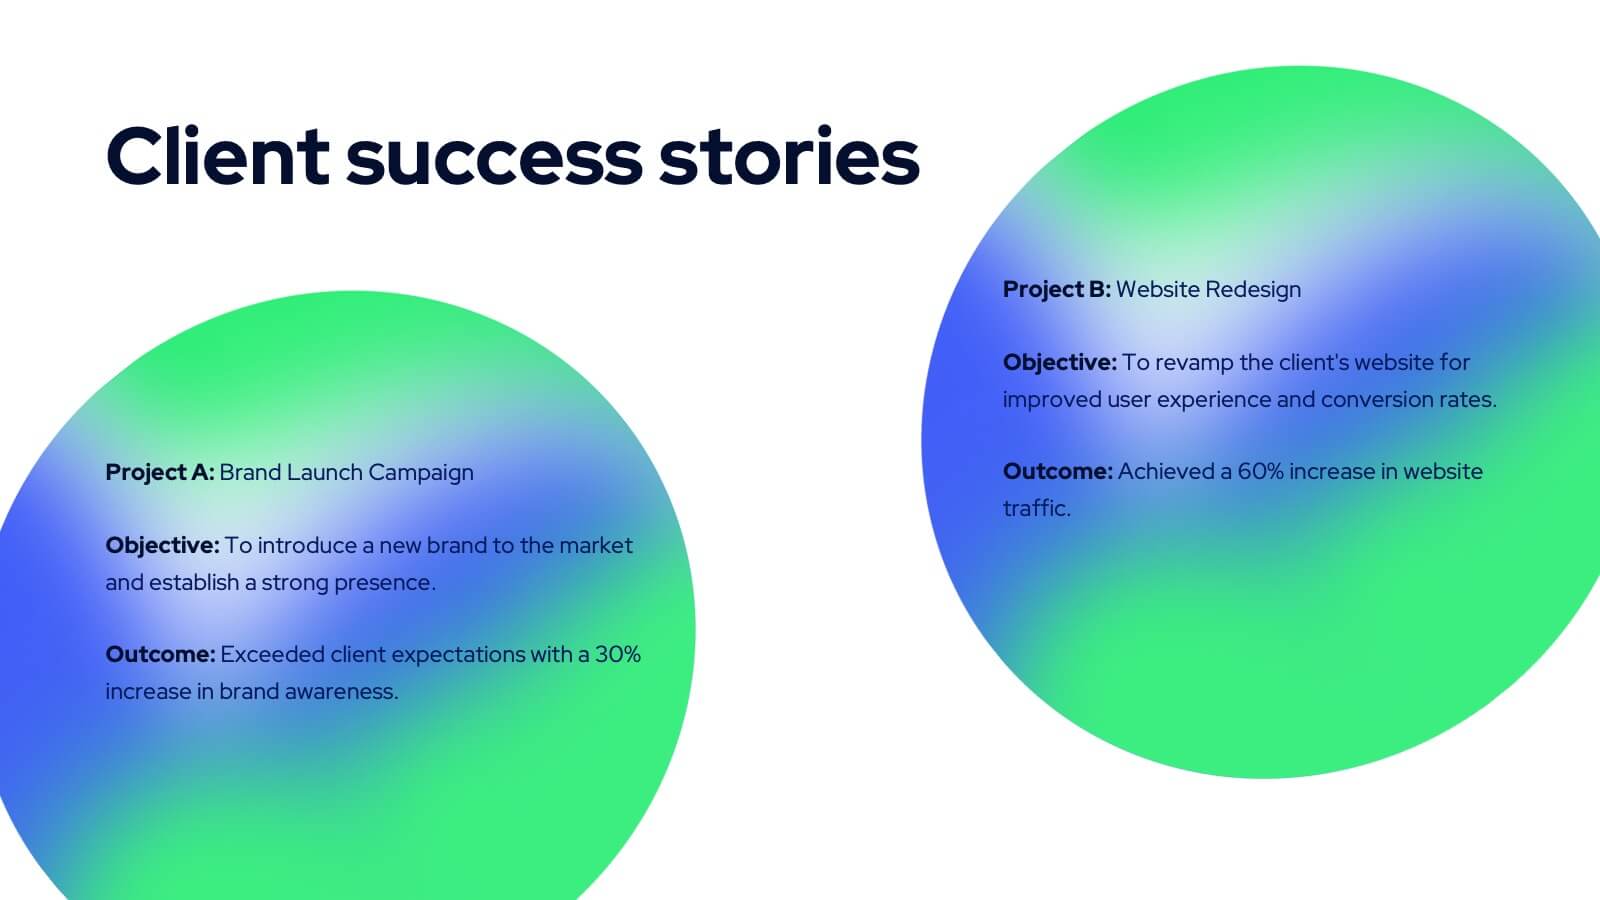
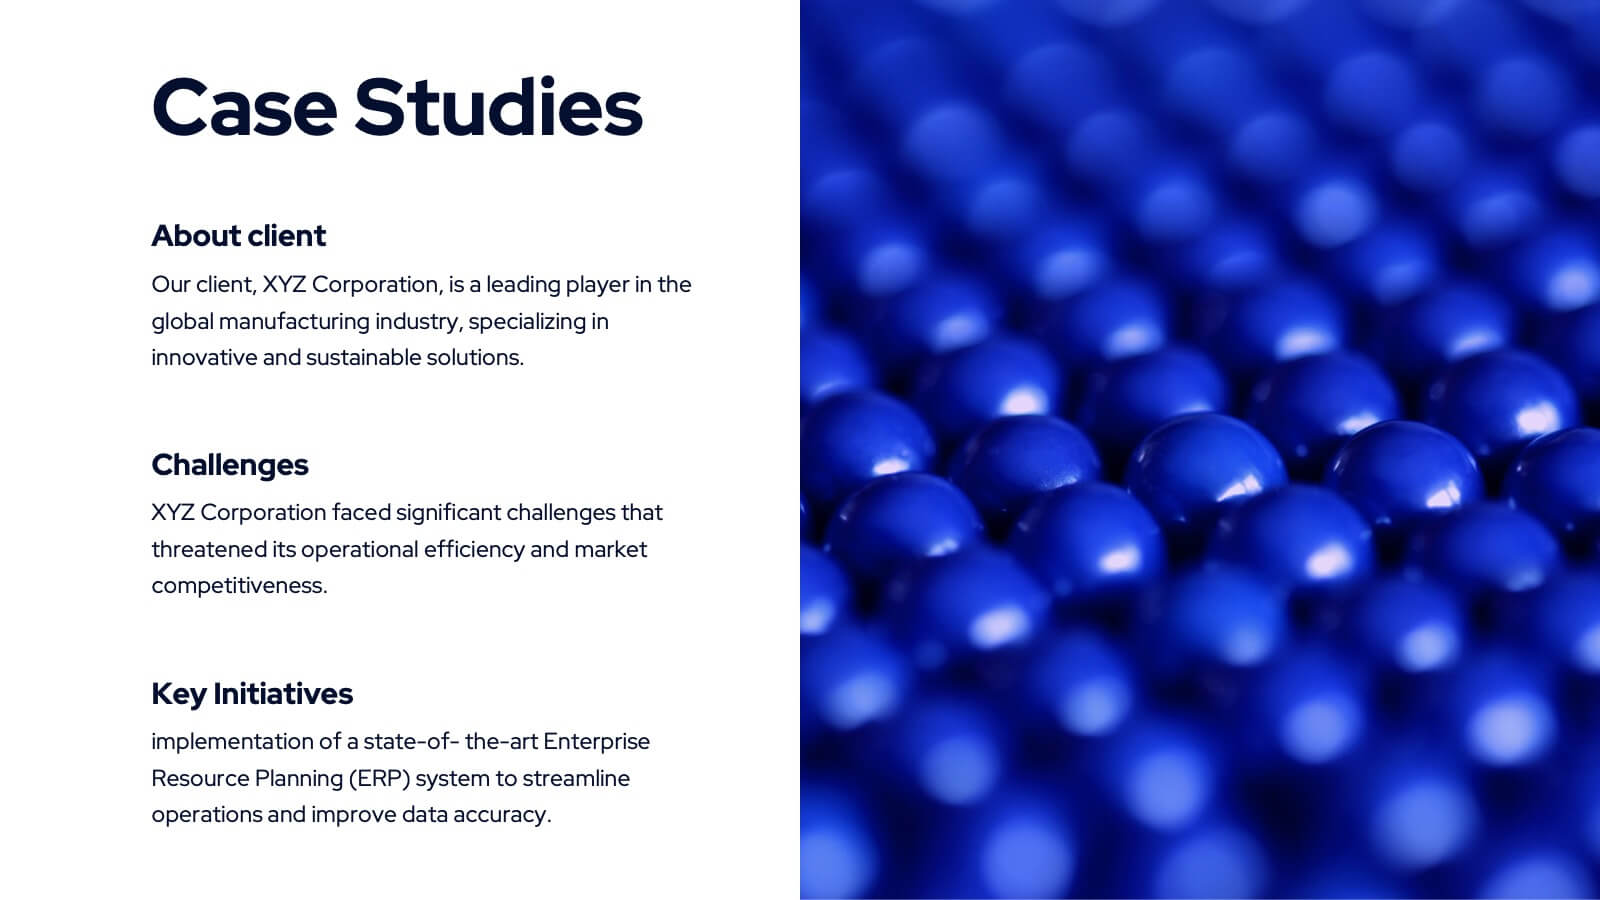
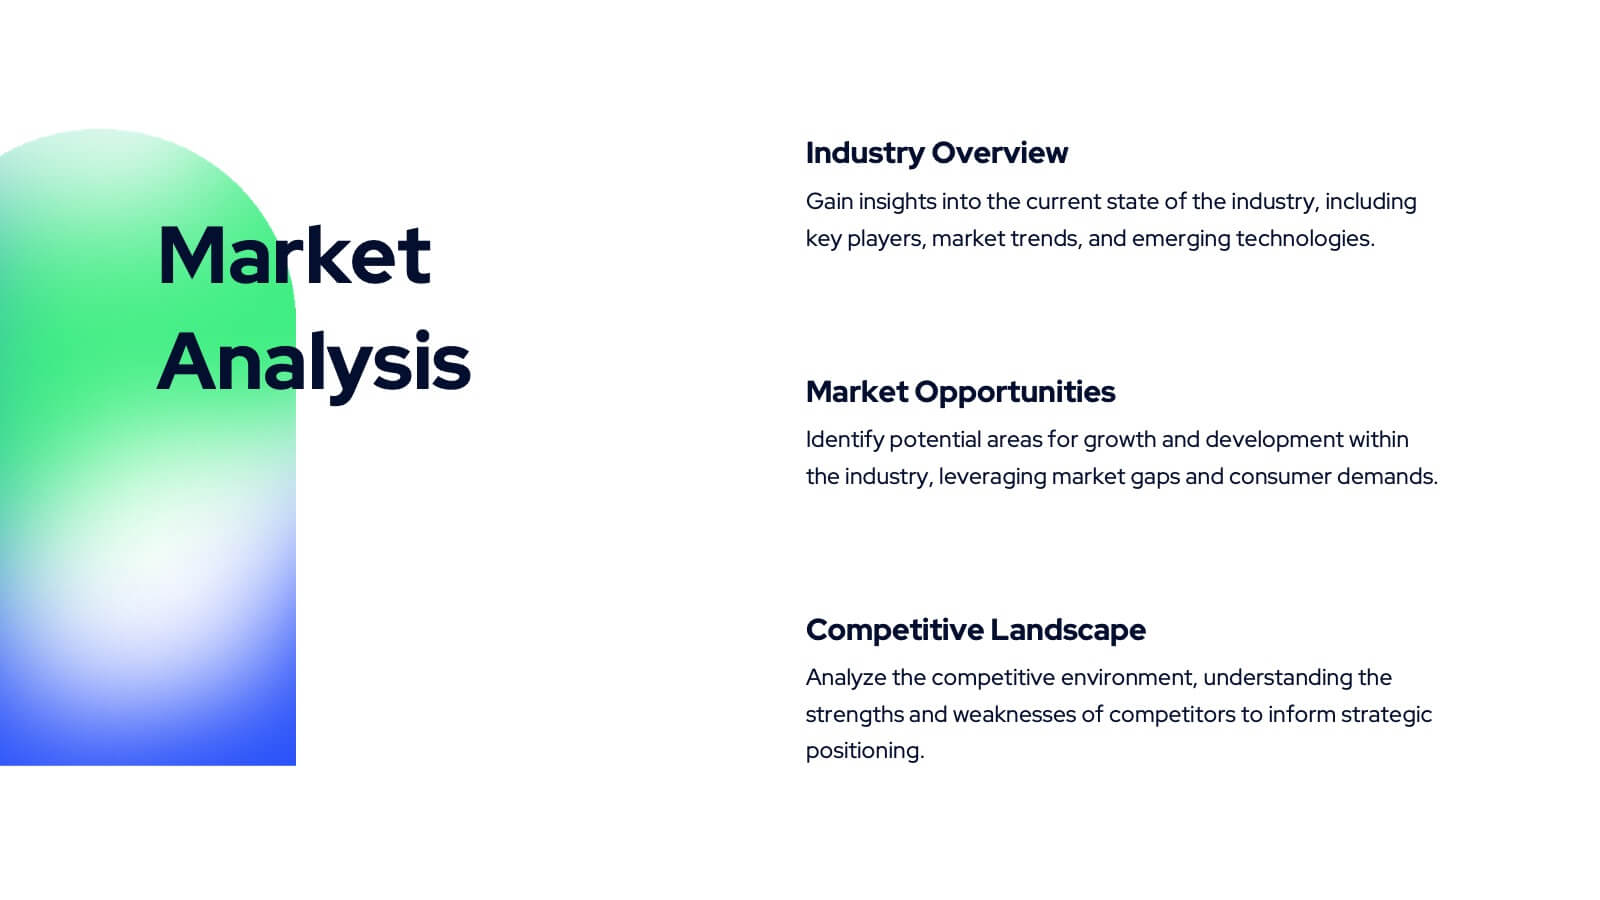
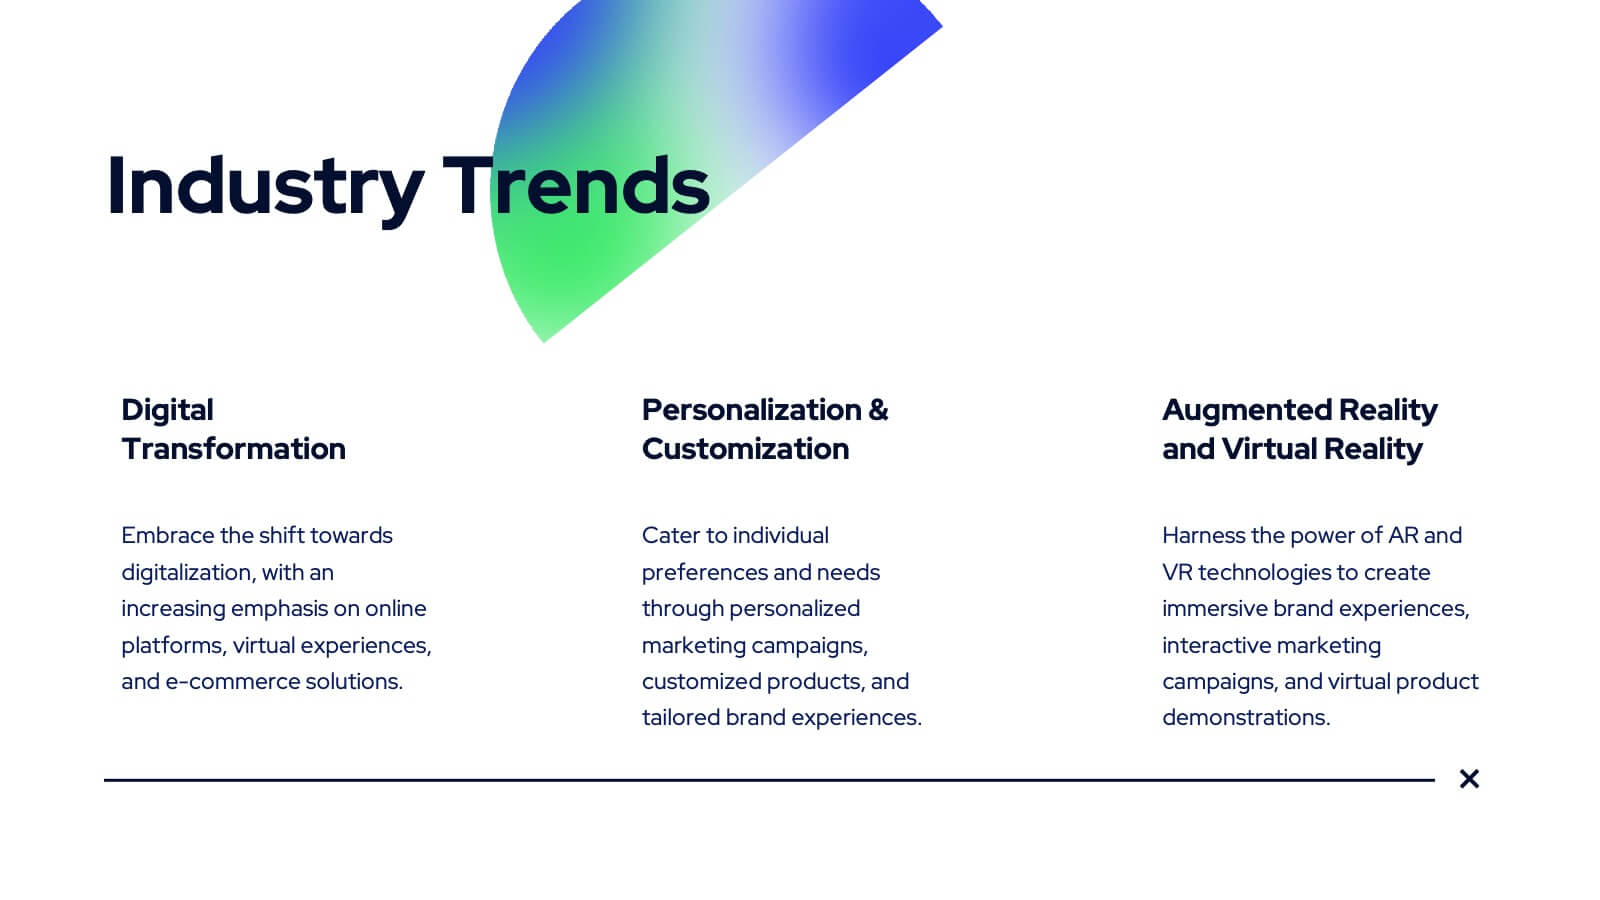
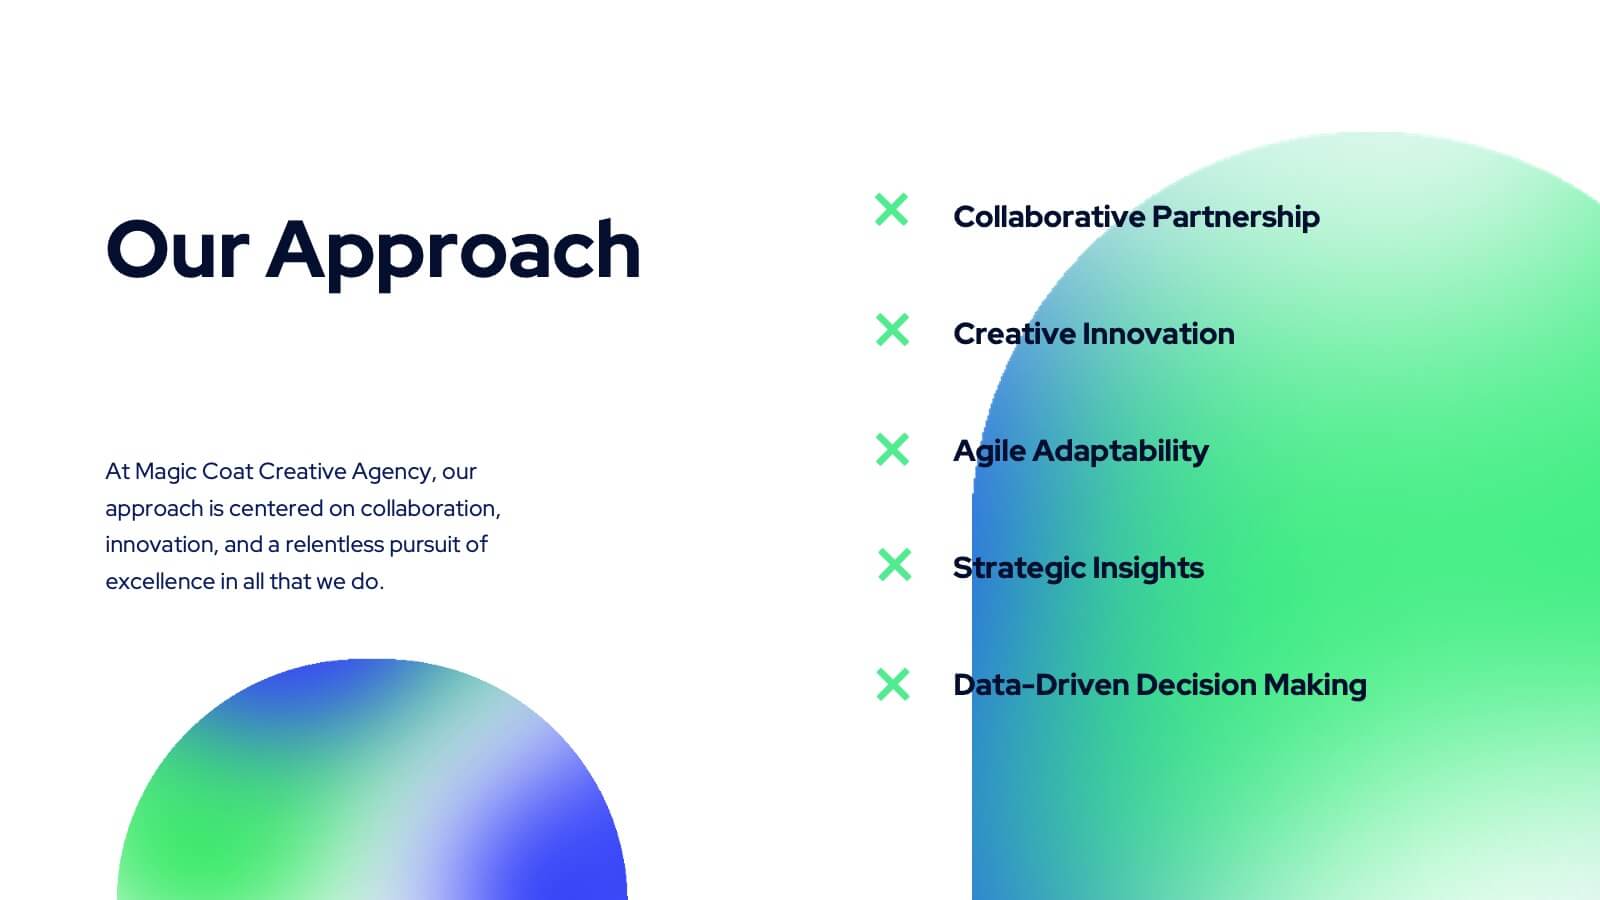
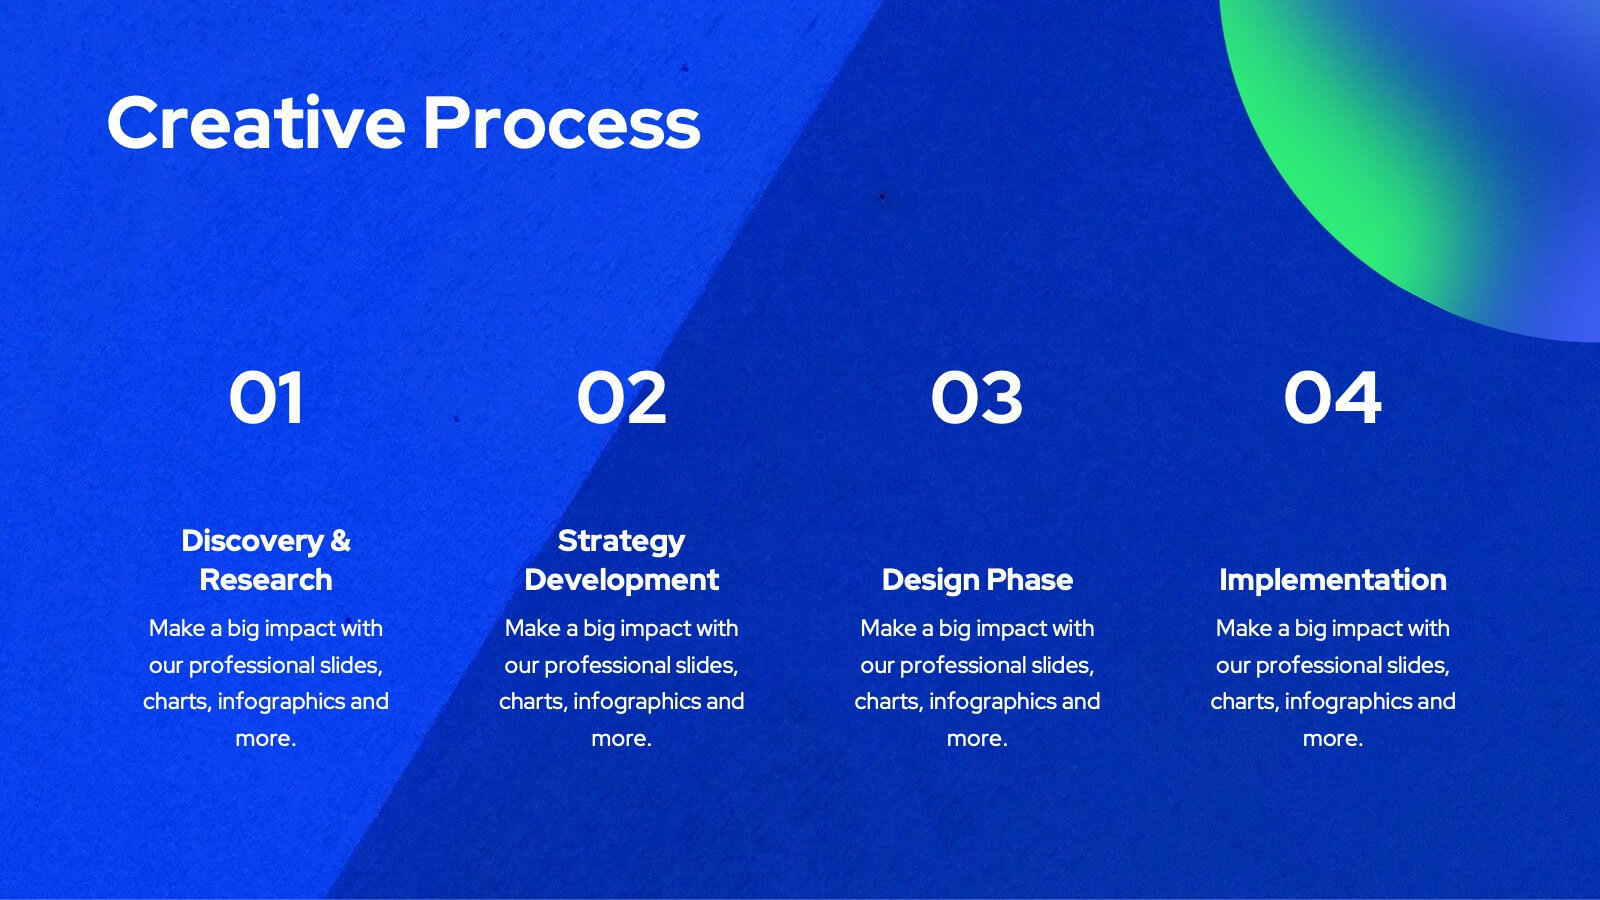
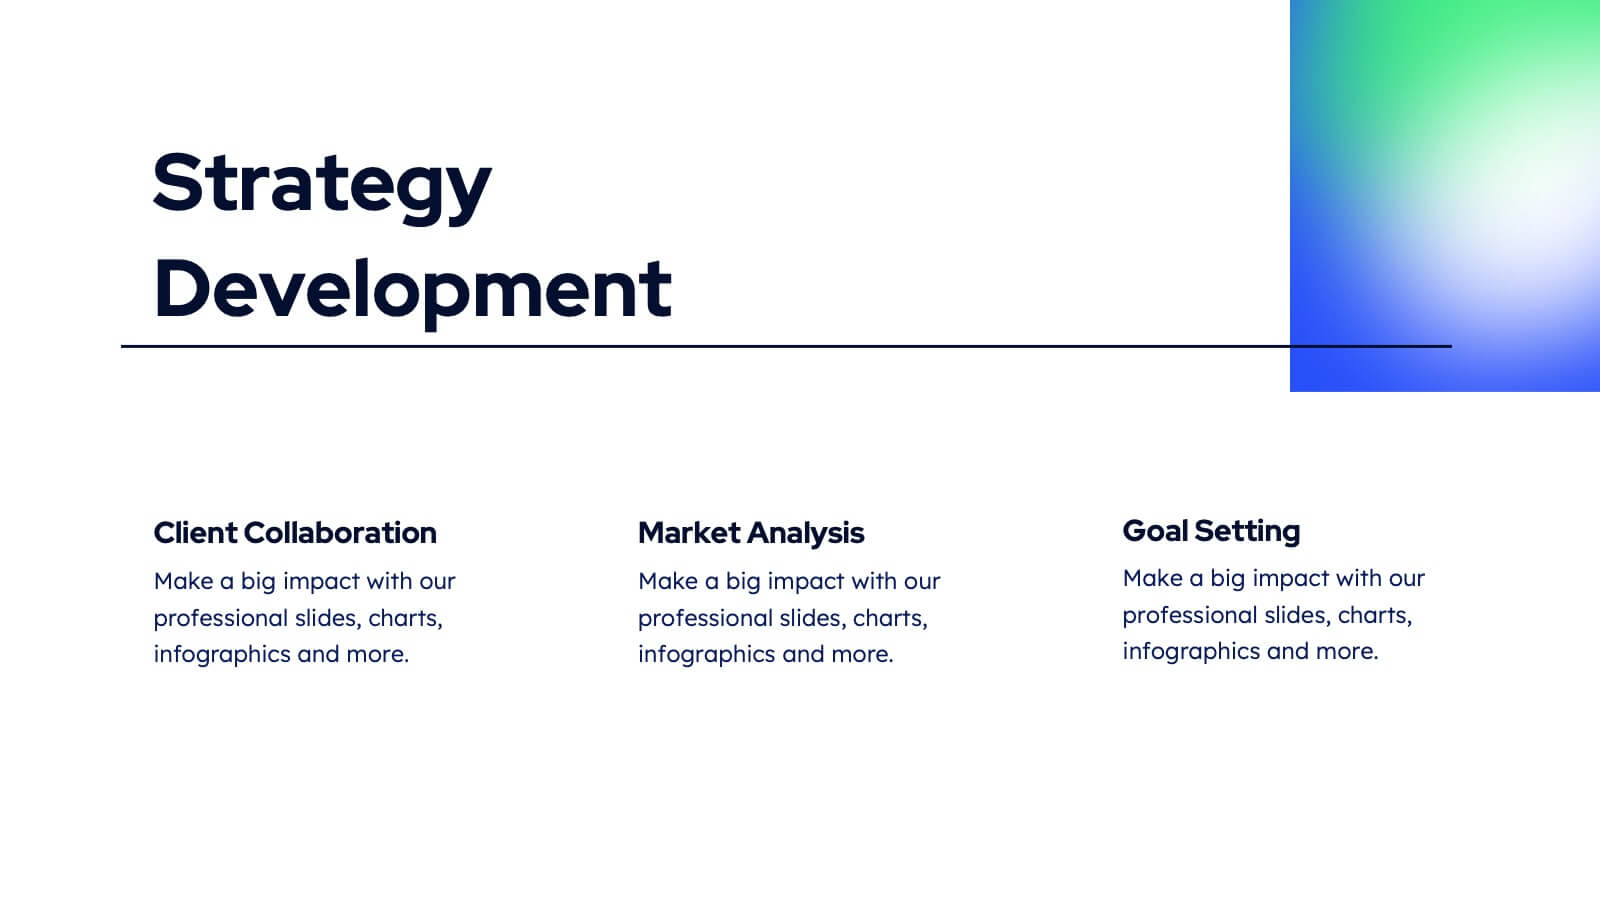
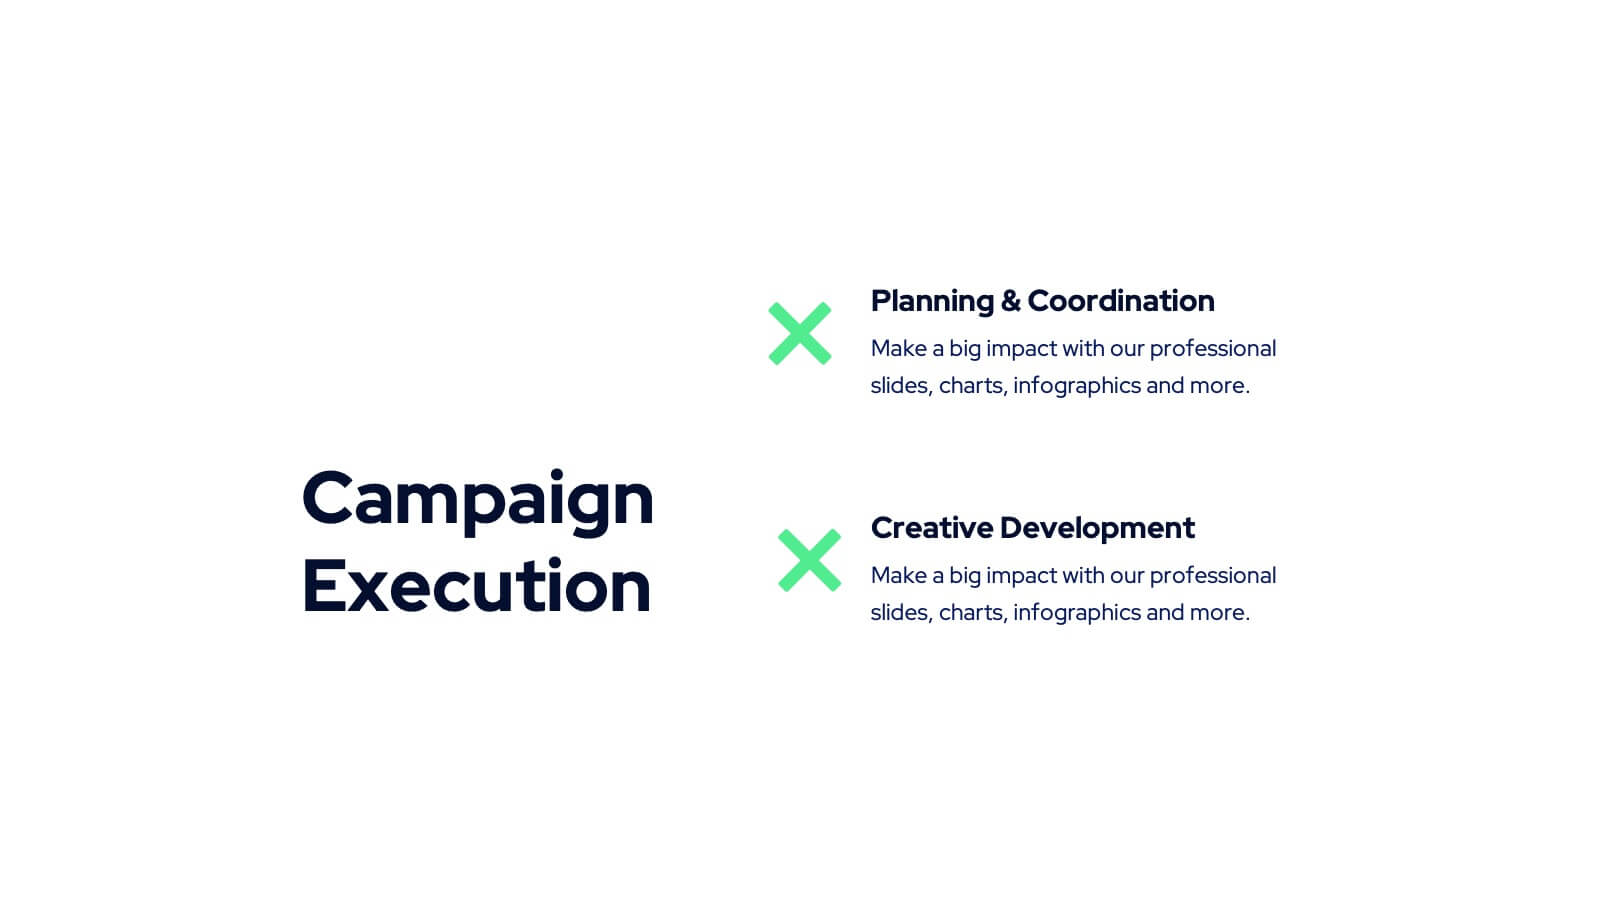
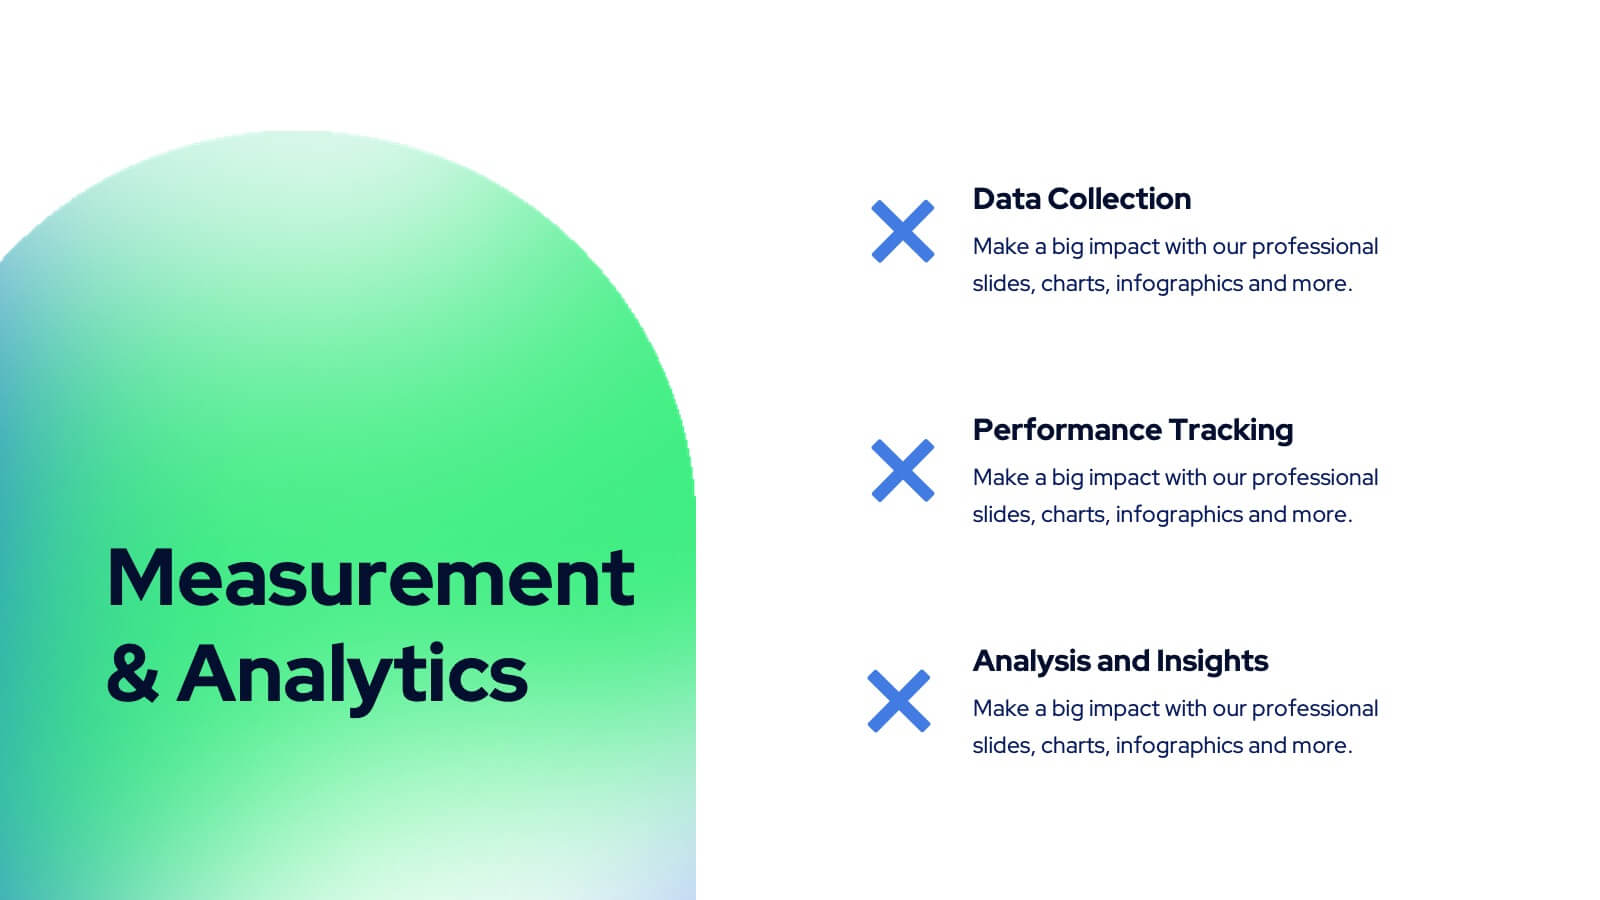
Tanzanite Full-Service Agency Project Plan Presentation
Showcase your agency's strengths with this bold and modern portfolio presentation template! From client success stories and case studies to market analysis and strategy development, this template highlights your expertise and approach. Perfect for agencies looking to present their services, creative processes, and partnerships. Compatible with PowerPoint, Keynote, and Google Slides, making it easy to impress any audience.


7 slides
Personal SWOT Infographic
Evaluate your individual potential with our personal SWOT infographic. Set against a clean white backdrop, and punctuated with optimistic yellow, intuitive blue, and assertive red, this template meticulously breaks down strengths, weaknesses, opportunities, and threats on a personal level. Adorned with concise infographics, suggestive icons, and adaptable image placeholders, it offers a panoramic introspection into personal growth avenues. Flawlessly designed for Powerpoint, Keynote, or Google Slides. An invaluable asset for career counselors, personal coaches, individuals looking for self-improvement, or anyone aiming for personal development.