


Features
- 4 Unique slides
- Fully editable and easy to edit in Microsoft Powerpoint, Keynote and Google Slides
- 16:9 widescreen layout
- Clean and professional designs
- Export to JPG, PDF or send by email


Do you have any questions?
Recommend


7 slides
Supply Chain Stock Infographic Presentation
A Supply Chain Infographic is a visual representation of information related to the flow of goods and services from suppliers to customers. This template is perfect for businesses and organizations involved in supply chain management, logistics, and procurement who want to communicate complex information in a clear way. This infographic can help engage stakeholders, promote understanding of supply chain-related issues, and drive positive change in the industry. Compatible with Powerpoint, Keynote, and Google Slides this template can be easily edited with different colors, fonts, and text.


4 slides
Artistic Watercolor Theme Presentation
Make a bold creative statement with this Artistic Watercolor Theme Presentation. Featuring a painter’s palette design and vibrant color splashes, this layout is ideal for showcasing four key ideas or creative concepts. Perfect for designers, educators, and artists, the layout is fully customizable in PowerPoint, Keynote, and Google Slides.


8 slides
Economic Impact on Stock Market Presentation
Illuminate your financial presentation with the "Economic Impact on Stock Market" template, ideal for displaying the interconnected influences of economic variables on market performance. These slides feature clear, visual representations through pie charts and percentage indicators, allowing for an engaging analysis of trends and impacts. This template is fully compatible with PowerPoint, Keynote, and Google Slides, ensuring versatility across different presentation platforms.


22 slides
Frost Financial Report Presentation
Transform your brand with this comprehensive rebranding project template! Perfect for presenting brand identity, market analysis, and strategic positioning, it includes slides for logos, color palettes, and brand guidelines. Engage your audience with visually striking designs and detailed content. Compatible with PowerPoint, Keynote, and Google Slides for easy, professional presentations on any platform.


5 slides
Market Improvement Trends and Expansion in Oceania Map Presentation
Present your market insights with clarity using this Oceania-focused expansion map. Highlight four key regions with callouts and data pointers, ideal for tracking growth trends, regional strategies, or entry points. Fully editable and compatible with PowerPoint, Keynote, and Google Slides—perfect for strategic planning, investor decks, and regional market analysis.


6 slides
Problem-Solving with Design Thinking
Communicate your innovation process with clarity using the Problem-Solving with Design Thinking Presentation. This slide visualizes the six key phases of the design thinking methodology (e.g., Empathize, Define, Ideate, Prototype, Test, Implement) arranged in a dynamic hexagonal loop. Each section is color-coded and icon-labeled for easy navigation, with editable titles and space for explanatory text. Ideal for creative workshops, team brainstorming, innovation strategy, and agile process presentations. Fully editable in PowerPoint, Keynote, and Google Slides.


6 slides
Logistics and Procurement Supply Chain Presentation
Optimize your supply chain strategy with the Logistics and Procurement Supply Chain template. Designed to illustrate key logistics processes, procurement flows, and operational efficiency, this structured layout helps you present crucial data with clarity. Fully customizable and compatible with PowerPoint, Keynote, and Google Slides for seamless business integration.


7 slides
Lean Business Model Infographic
Step into the dynamic world of lean startup methodology with our lean business model infographic. Utilizing a striking palette of oranges, blacks, and other vivid colors, this infographic simplifies the intricate components of the lean canvas. It's an invaluable asset for entrepreneurs, business educators, and startup enthusiasts. By offering a bird's-eye view of a startup's proposition, it ensures stakeholders align their strategies efficiently. Regardless of the platform - be it PowerPoint, Keynote, or Google Slides - this infographic seamlessly adapts, enhancing your presentation's professional appeal.


6 slides
Cause-and-Effect Chain Using Fishbone Diagram Presentation
Break down complex issues step by step with the Cause-and-Effect Chain Using Fishbone Diagram Presentation. Ideal for project managers, analysts, or educators, this template helps you visually map out relationships between causes and outcomes. Fully editable in Canva, PowerPoint, and Google Slides for seamless integration into your workflow.


7 slides
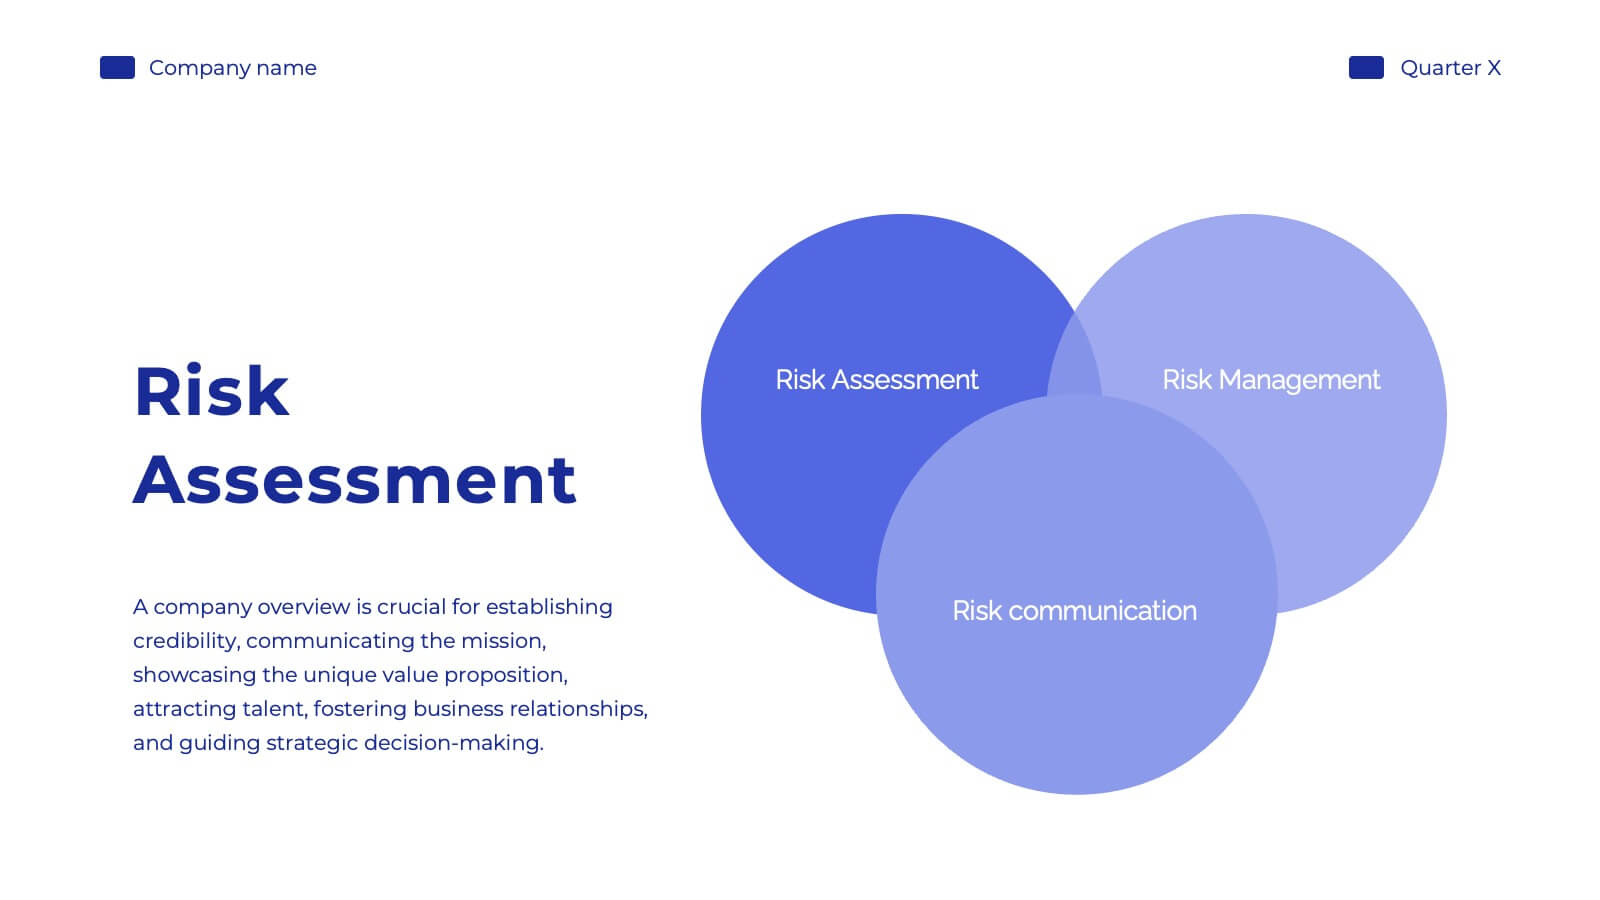
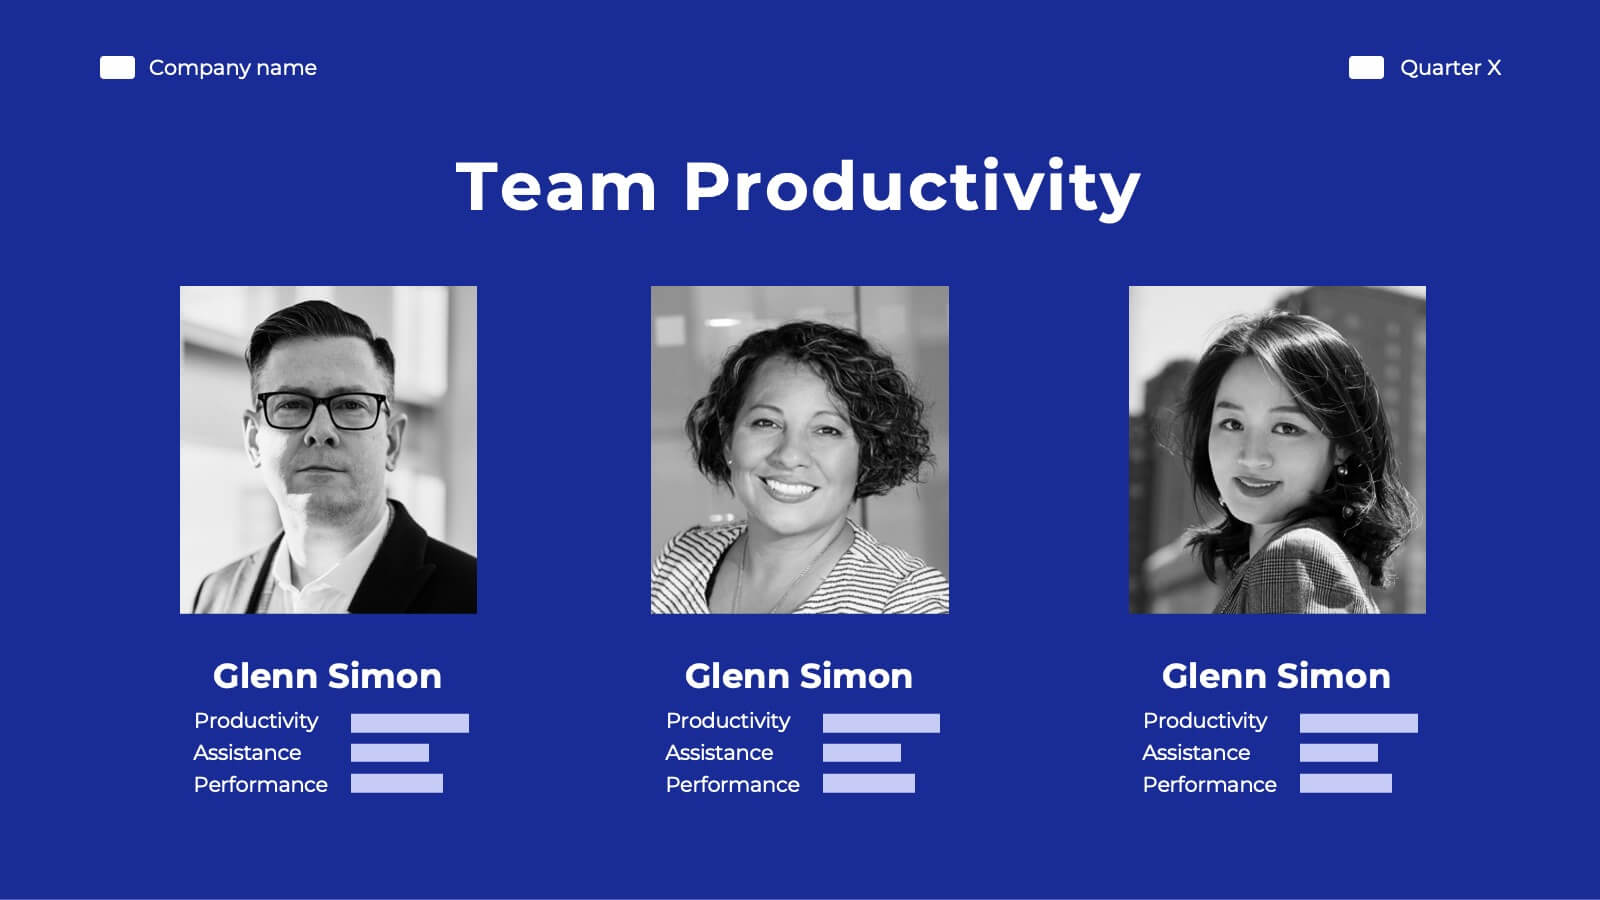
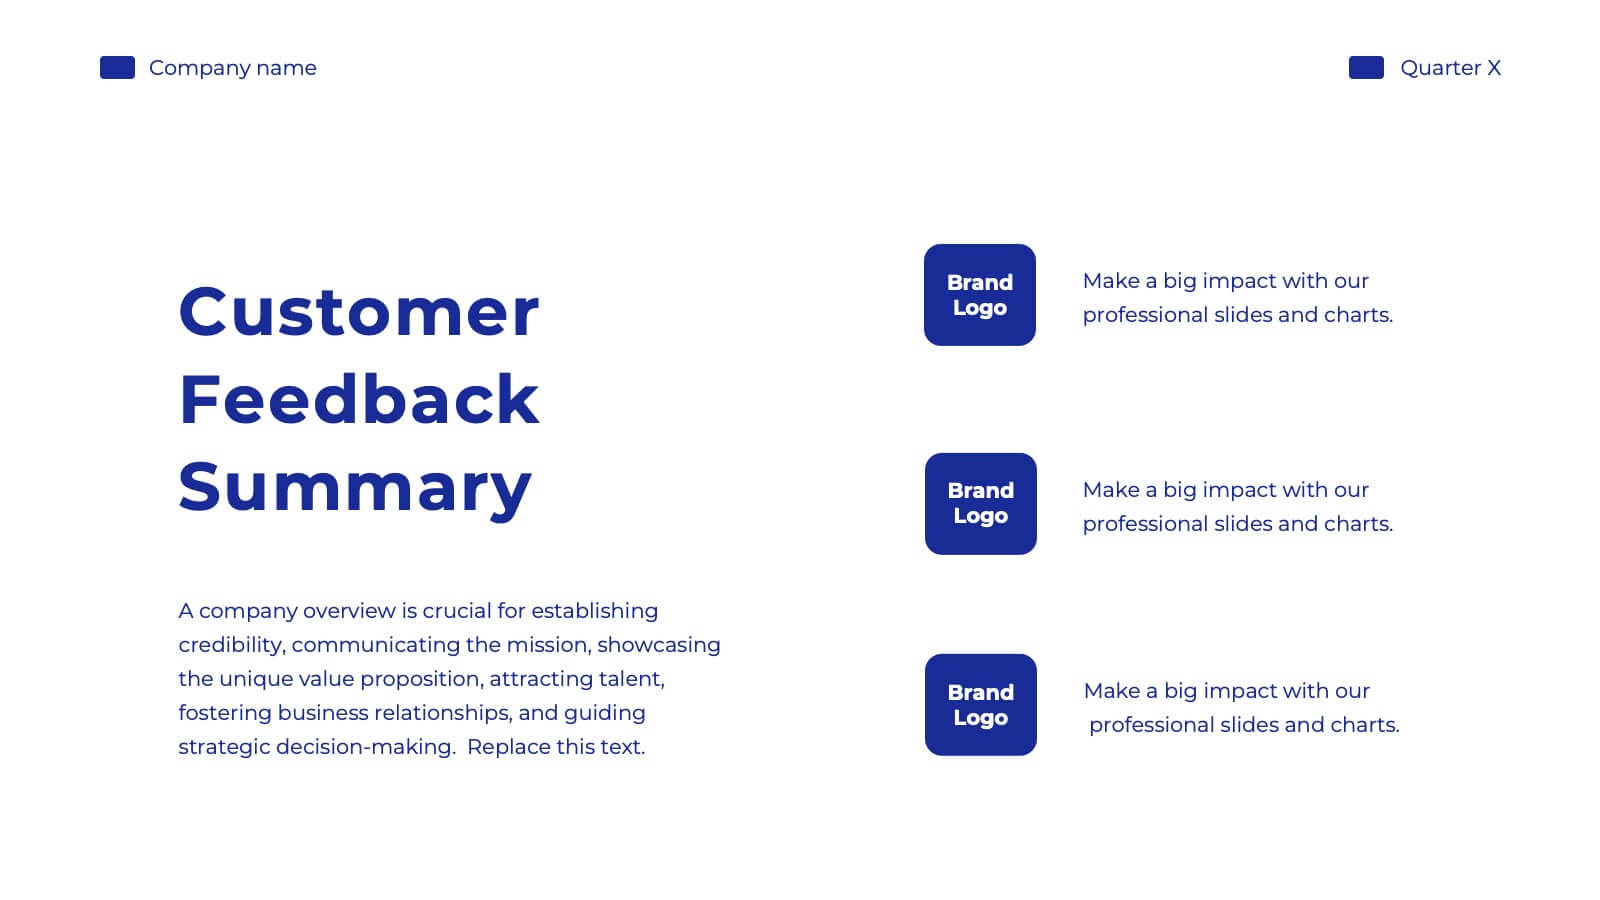
Challenge Infographic Presentation Template
Our Challenge Infographic template is designed for conveying the challenge, purpose, problem and solution of an issue. This template is perfect for presenting ideas and plans on any topic from business to education. It features a clean design that allows you to highlight your ideas with confidence. With this template, you will make your data stand out with a variety of charts, graphs and text to create contrast and guide the audience through your message. Our template is compatible with powerpoint and gives you the ability to customize all of the text boxes, colors and any other elements.


5 slides
Business Process Checklist Presentation
Ensure smooth workflows with the Business Process Checklist template. This visually structured layout simplifies process tracking, highlighting key steps and completion percentages. Perfect for project managers and teams looking to optimize efficiency. Fully editable and compatible with PowerPoint, Keynote, and Google Slides for easy customization and seamless presentation.


20 slides
Firelight Design Portfolio Presentation
This Design Portfolio Presentation Template offers a bold and modern layout to showcase your creative projects, services, and achievements. It features sections for project highlights, awards, client testimonials, and pricing, making it perfect for freelancers and agencies. Fully customizable in PowerPoint, Keynote, and Google Slides.


20 slides
Storynix New Product Proposal Presentation
This beautifully designed presentation template is your perfect tool to showcase a new product with style and professionalism. It covers everything from company overview and product features to pricing strategies and distribution plans, ensuring a comprehensive and persuasive pitch. Compatible with PowerPoint, Keynote, and Google Slides for seamless customization.


5 slides
Layered Circular Model for Strategy Presentation
Communicate complex strategies with ease using the Layered Circular Model for Strategy Presentation. This 3D-style infographic breaks down your framework into five distinct levels, making it ideal for visualizing hierarchies, stages, or priorities. Each layer is fully editable and labeled for customization. Works with PowerPoint, Google Slides, and Canva.


7 slides
Break-Even Model for Revenue Planning Presentation
Simplify financial planning with this break-even model presentation. Designed to visualize the transition from loss to profit, it highlights cost reduction, sales increase, and profit margins. Ideal for strategy sessions, budgeting, or forecasts. Fully editable in PowerPoint, Keynote, and Google Slides for seamless customization across business presentations.


5 slides
Organic Search Growth Plan Presentation
Grow your visibility the natural way with this sleek and easy-to-follow organic strategy slide. Perfect for outlining SEO goals, keyword clusters, and growth tactics, this visual layout makes your presentation clean and compelling. Fully compatible with PowerPoint, Keynote, and Google Slides for flexible editing across platforms.


6 slides
Sales Skills Development Training Presentation
Bring your sales training to life with a sleek, infinity-loop visual that keeps learners engaged from start to finish. This template helps you map out each phase of sales skill development, from lead generation to closing. Fully customizable and compatible with PowerPoint, Keynote, and Google Slides for seamless integration.