


Features
- 8 Unique slides
- Fully editable and easy to edit in Microsoft Powerpoint, Keynote and Google Slides
- 16:9 widescreen layout
- Clean and professional designs
- Export to JPG, PDF or send by email


Do you have any questions?
Recommend


4 slides
Cybersecurity Risk Protection Plan Presentation
Secure your message with a fingerprint-inspired layout that stands out. This Cybersecurity Risk Protection Plan template breaks down risk mitigation strategies into four clear points—ideal for tech, IT, and compliance presentations. Showcase protocols and data protection methods effectively. Works seamlessly with PowerPoint, Keynote, and Google Slides.


5 slides
Suicide Prevention & Awareness Infographics
Suicide Awareness plays a vital role in addressing the global public health issue of suicide. These vertical infographics are powerful and informative designs that aim to raise awareness about suicide prevention, promote mental health, and provide essential information to help individuals recognize the signs and support those in need. With its thoughtful and sensitive design, the template communicates important statistics, facts, and resources. The template is fully customizable, allowing you to personalize the infographics with your own content, including local helpline numbers, support services, or specific awareness campaigns.


8 slides
Workforce Engagement Strategy Presentation
Visualize employee engagement plans with the Workforce Engagement Strategy Presentation. This template includes timeline-style layouts to communicate team initiatives, motivation tactics, and HR strategies effectively. Ideal for team leads, HR managers, and consultants. Fully customizable in PowerPoint, Keynote, and Google Slides to suit your brand and communication goals.


21 slides
Terraflare Project Status Report Presentation
Keep stakeholders updated with this comprehensive project status report template, featuring agenda, key highlights, performance metrics, project progress, risk assessments, and goals. Easily track progress, strategic initiatives, and team productivity. Perfect for PowerPoint, Keynote, and Google Slides, ensuring clear communication of project updates and priorities.


4 slides
Startup Business Plan Slide Deck Presentation
Kickstart your pitch with a clean, modern slide deck that guides your audience through your startup’s core ideas with clarity and confidence. This presentation outlines key business concepts, supporting strategy, goals, and planning in an easy-to-follow structure. Fully compatible with PowerPoint, Keynote, and Google Slides.


6 slides
Organizational Structure Overview Presentation
Map out your team’s structure with clarity using this simple organizational chart template. Ideal for showcasing departments, reporting lines, or team roles, it helps stakeholders quickly understand who’s who and how responsibilities are divided. Perfect for internal meetings, onboarding decks, or company overviews. Works with PowerPoint, Keynote, and Google Slides.


8 slides
Structured Table of Content for Reports Presentation
Create clarity and flow in your professional reports with this Structured Table of Content for Reports slide. Featuring a sleek column design with three main sections, each block offers space for a title, description, and a matching icon. Ideal for business reviews, strategy documents, and formal proposals. This layout ensures your audience knows exactly what to expect. Fully customizable in PowerPoint, Keynote, and Google Slides.


26 slides
Nahla Presentation Template
Brand guidelines are the set of rules that define the overall look and feel of your brand. They allow you to build a brand identity. A brand style guide is the ultimate resource for communicating your brand’s identity to everyone on your team. Use the Nahla template to help define your company's branding the correct way. This is a highly customizable, responsive template. Create a unique ambience that your customers and audience can recognize across all platforms. Nahla provides a platform for the design team to help shape the direction of your brand, while ensuring consistency.


4 slides
Comparison Table Slide Presentation
Quickly highlight the differences between options with the Comparison Table Slide Presentation. This layout features a clean, structured table with checkmarks and Xs to visually compare features, services, or product tiers. Ideal for pricing plans, feature breakdowns, or side-by-side evaluations. Each column is color-coded for clarity and impact. Fully customizable in PowerPoint, Keynote, and Google Slides.


6 slides
Innovation Process Infographic
The innovation process refers to the systematic and structured approach that organizations follow to generate, develop, and implement new ideas, products, services, or processes to create value and drive growth. This infographic template visually illustrates the steps involved in the innovation process, from idea generation to implementation. The infographic includes several stages, each with its own set of activities and objectives. The template visuals to simplify complex concepts and guide viewers through the journey of innovation. This is compatible with Powerpoint, Keynote, and Google Slides.


5 slides
Western Europe Political Map Slide Presentation
Showcase political insights and regional data with a clear, modern map design that highlights countries across Western Europe. Perfect for comparing demographics, election data, or market performance, this layout combines clarity with visual impact. Fully compatible with PowerPoint, Keynote, and Google Slides for easy customization and professional presentations.


12 slides
Market Research Data Insights Presentation
Gain Valuable Market Insights! The Market Research Data Insights Presentation is designed to help businesses analyze trends, customer behavior, and competitive landscapes. Featuring a structured circular layout, this template ensures data is easy to interpret and present. Fully customizable and compatible with PowerPoint, Keynote, and Google Slides for seamless editing.


6 slides
5 Forces Model Business Analysis Presentation
Showcase your business insights with a bold, flowing design that makes each competitive force easy to compare and understand. This presentation helps you break down market pressures, highlight strategic opportunities, and communicate analysis with clarity and confidence. Fully editable and compatible with PowerPoint, Keynote, and Google Slides.


4 slides
Patient Management in Medical Practice Presentation
Present medical processes with clarity using this lung-inspired diagram. Ideal for outlining patient care stages, treatment protocols, or clinical workflows. With four editable points, this design supports healthcare presentations in pulmonology, internal medicine, or hospital administration. Fully compatible with PowerPoint, Keynote, and Google Slides for easy customization.


12 slides
Strategic Planning with Strategy Wheel Presentation
Visualize your roadmap with this sleek strategy wheel template. Perfect for showcasing up to six strategic stages, this layout highlights progression while keeping your content organized and engaging. Ideal for business plans, project development, or performance cycles. Fully editable in PowerPoint, Keynote, and Google Slides.


23 slides
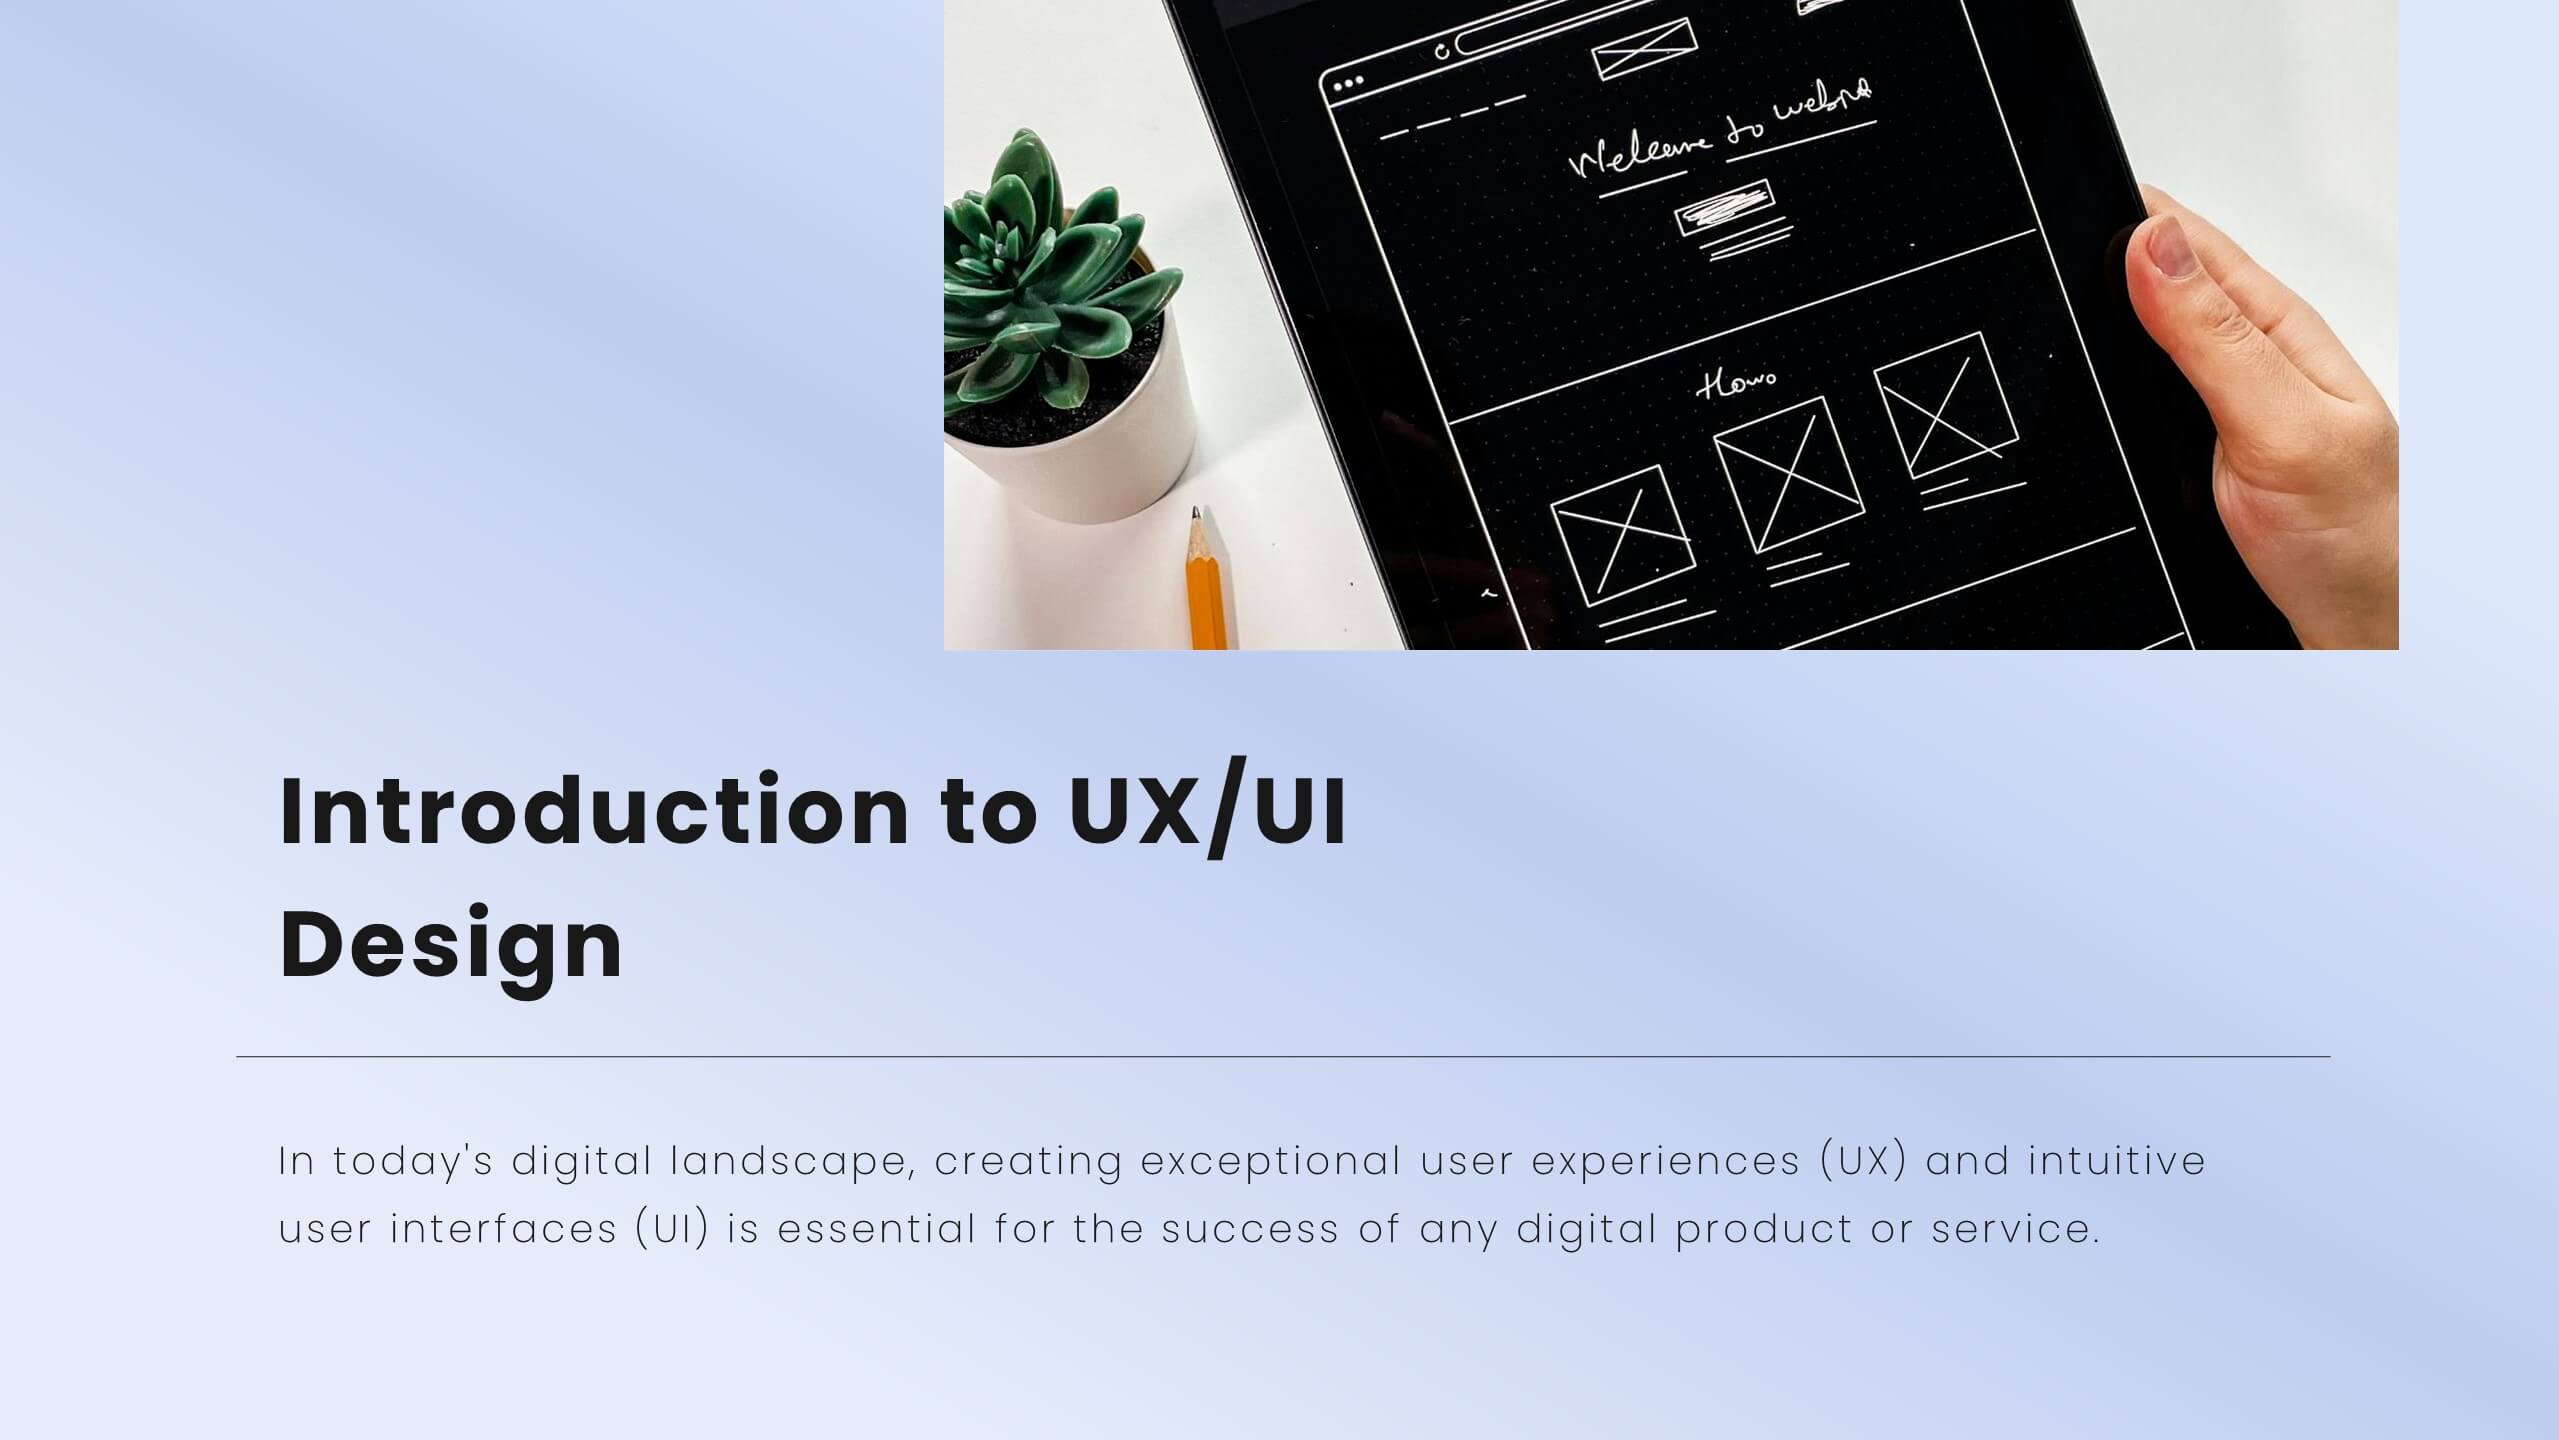
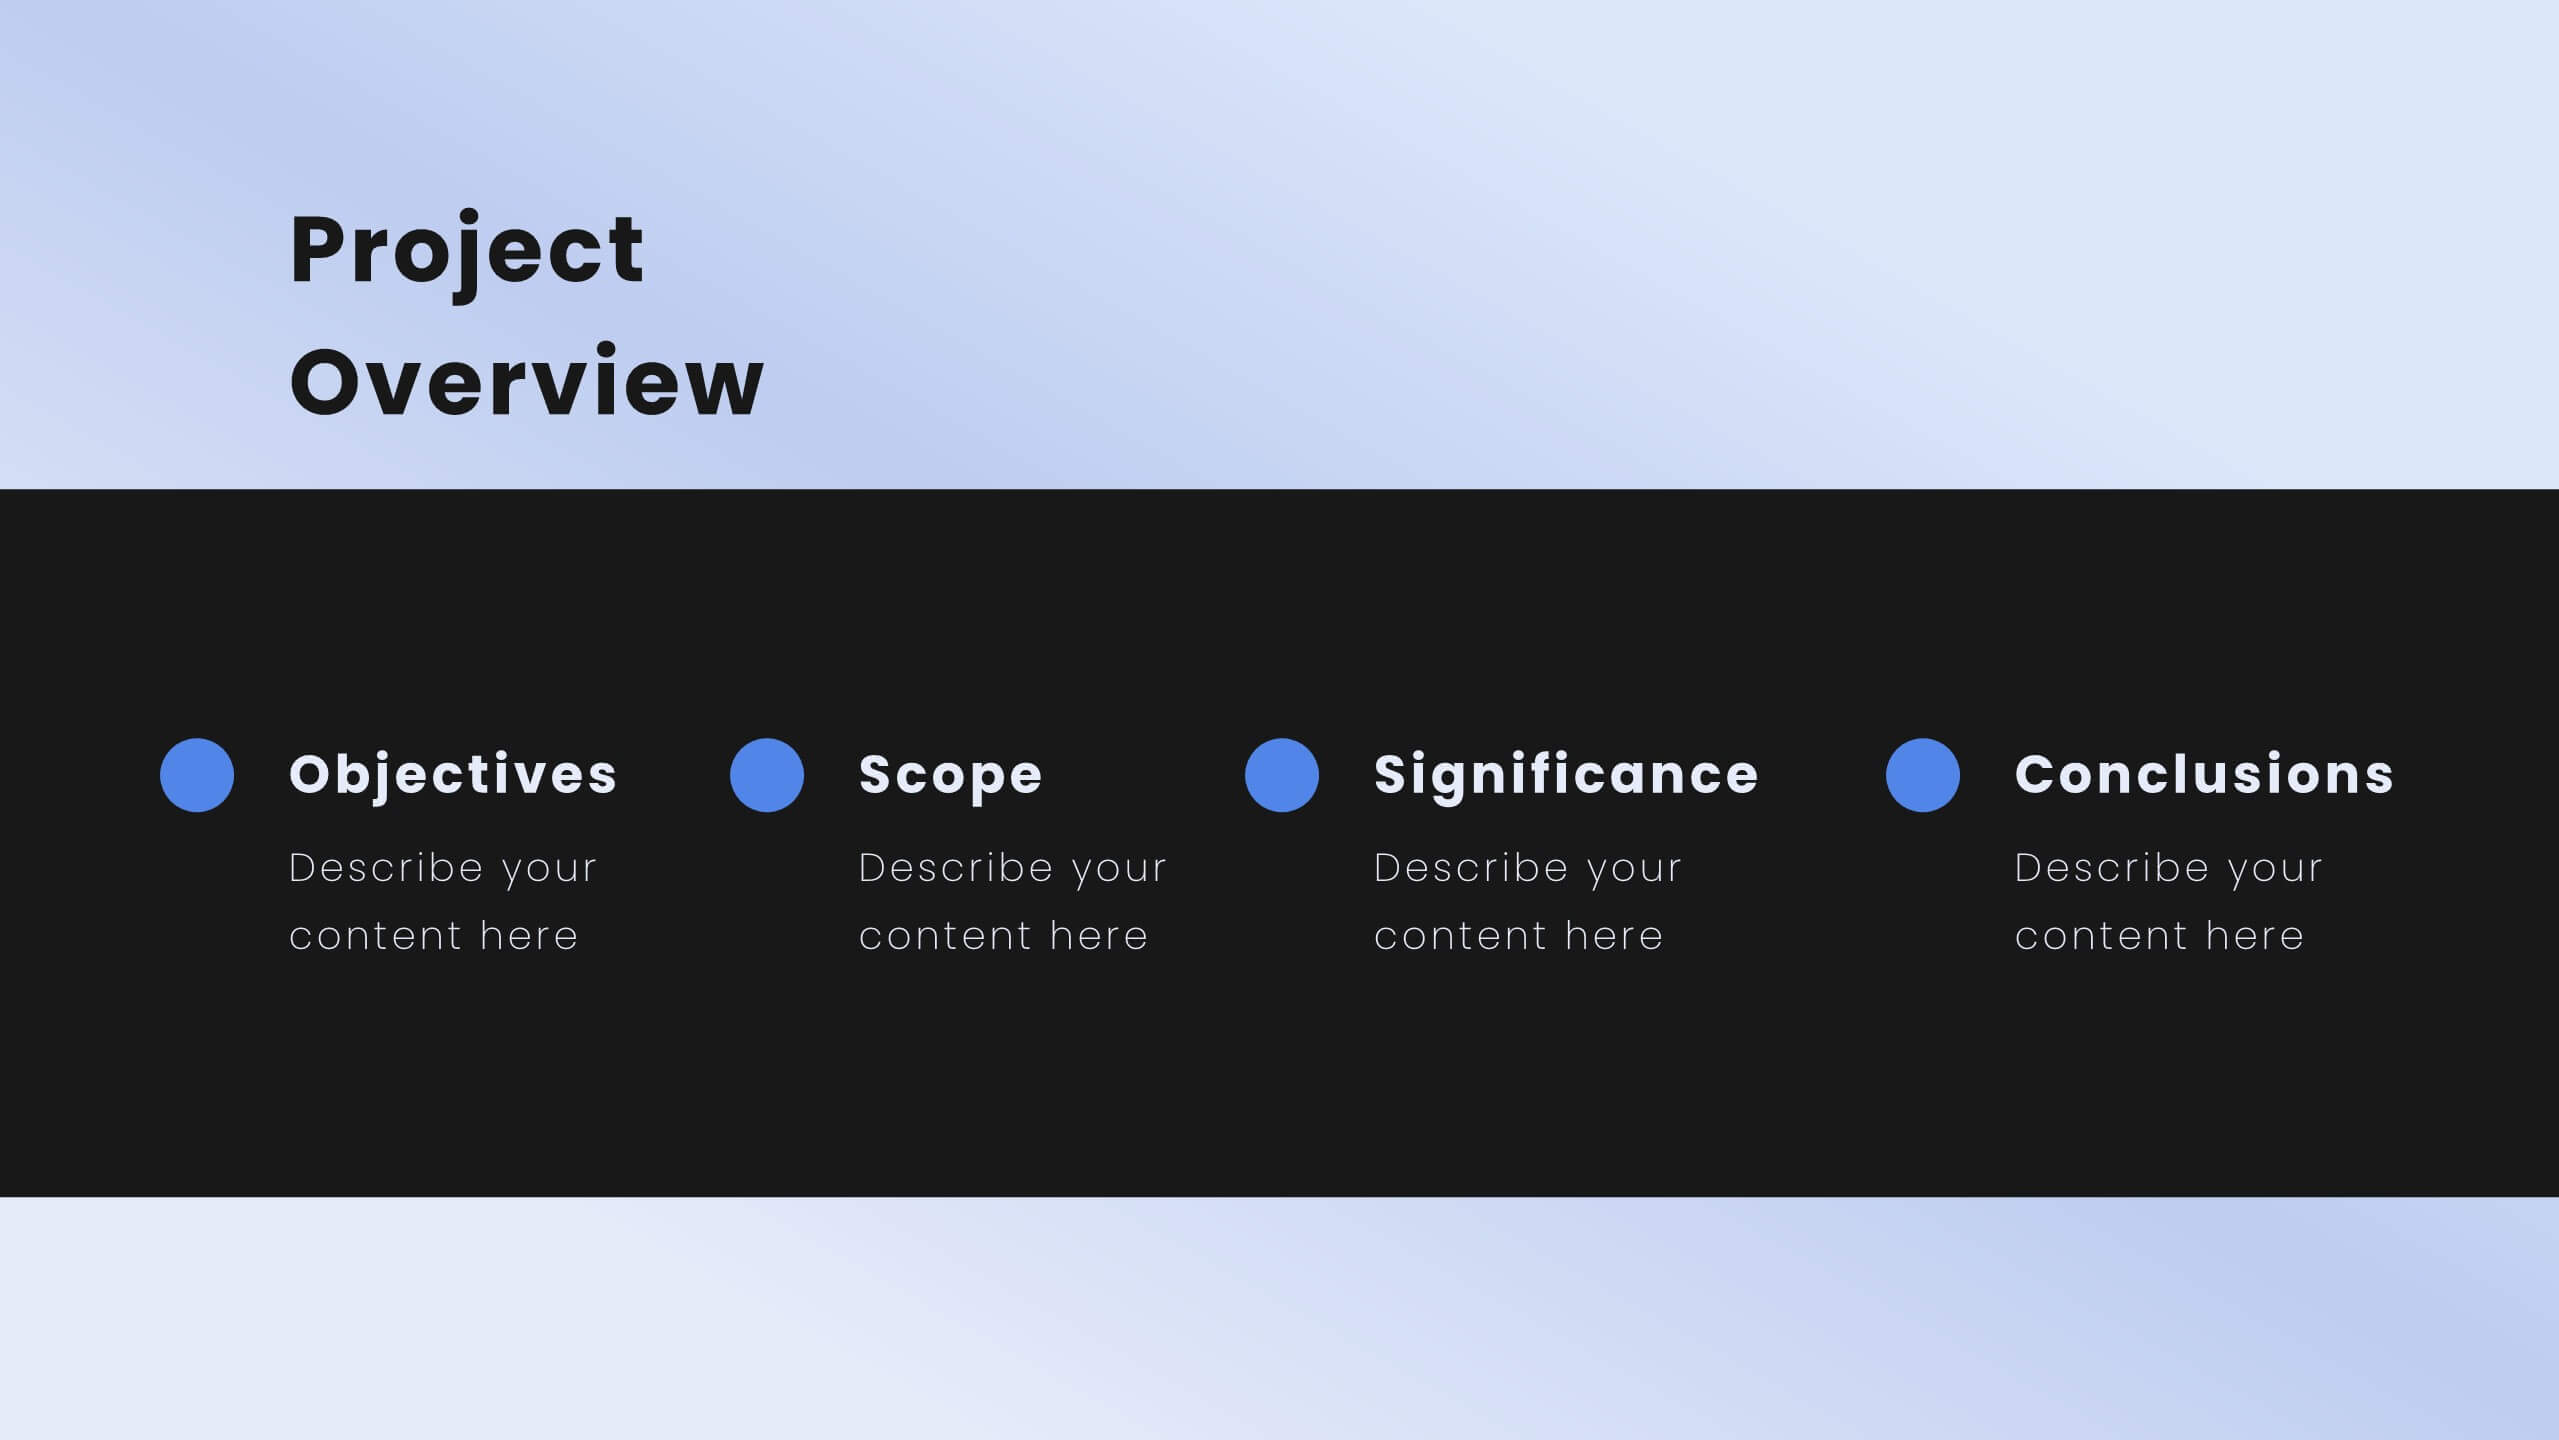
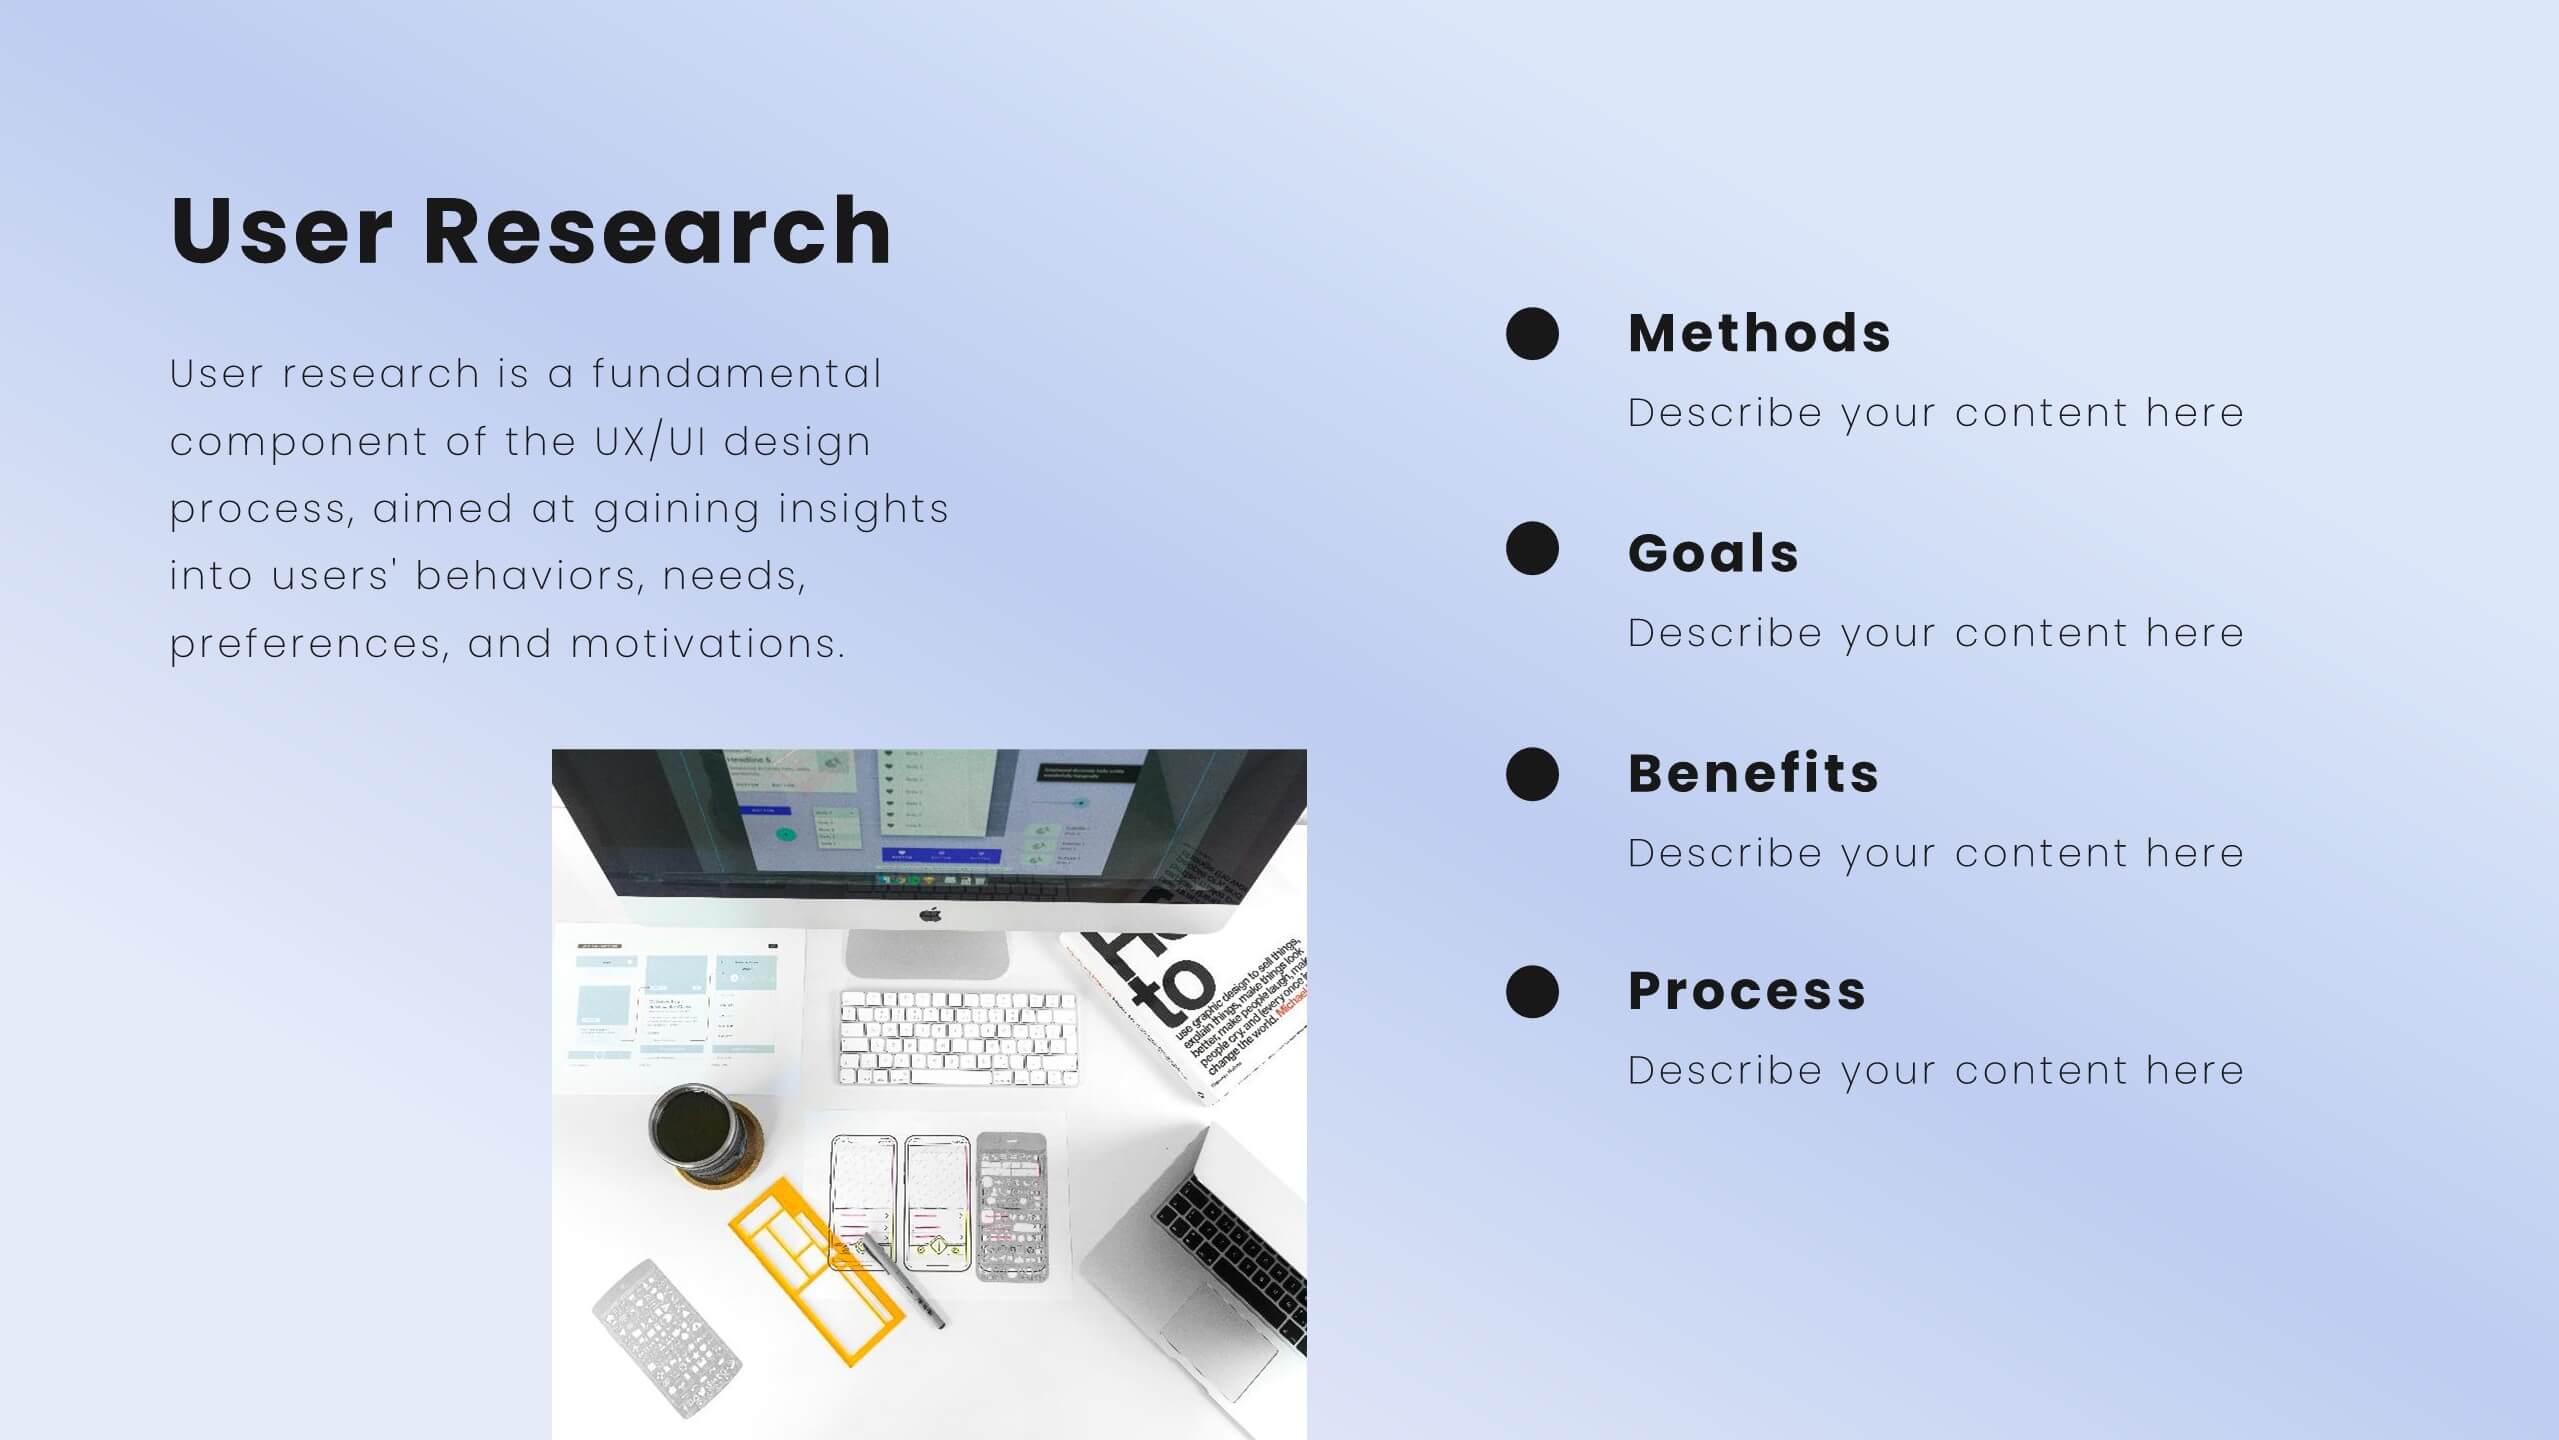
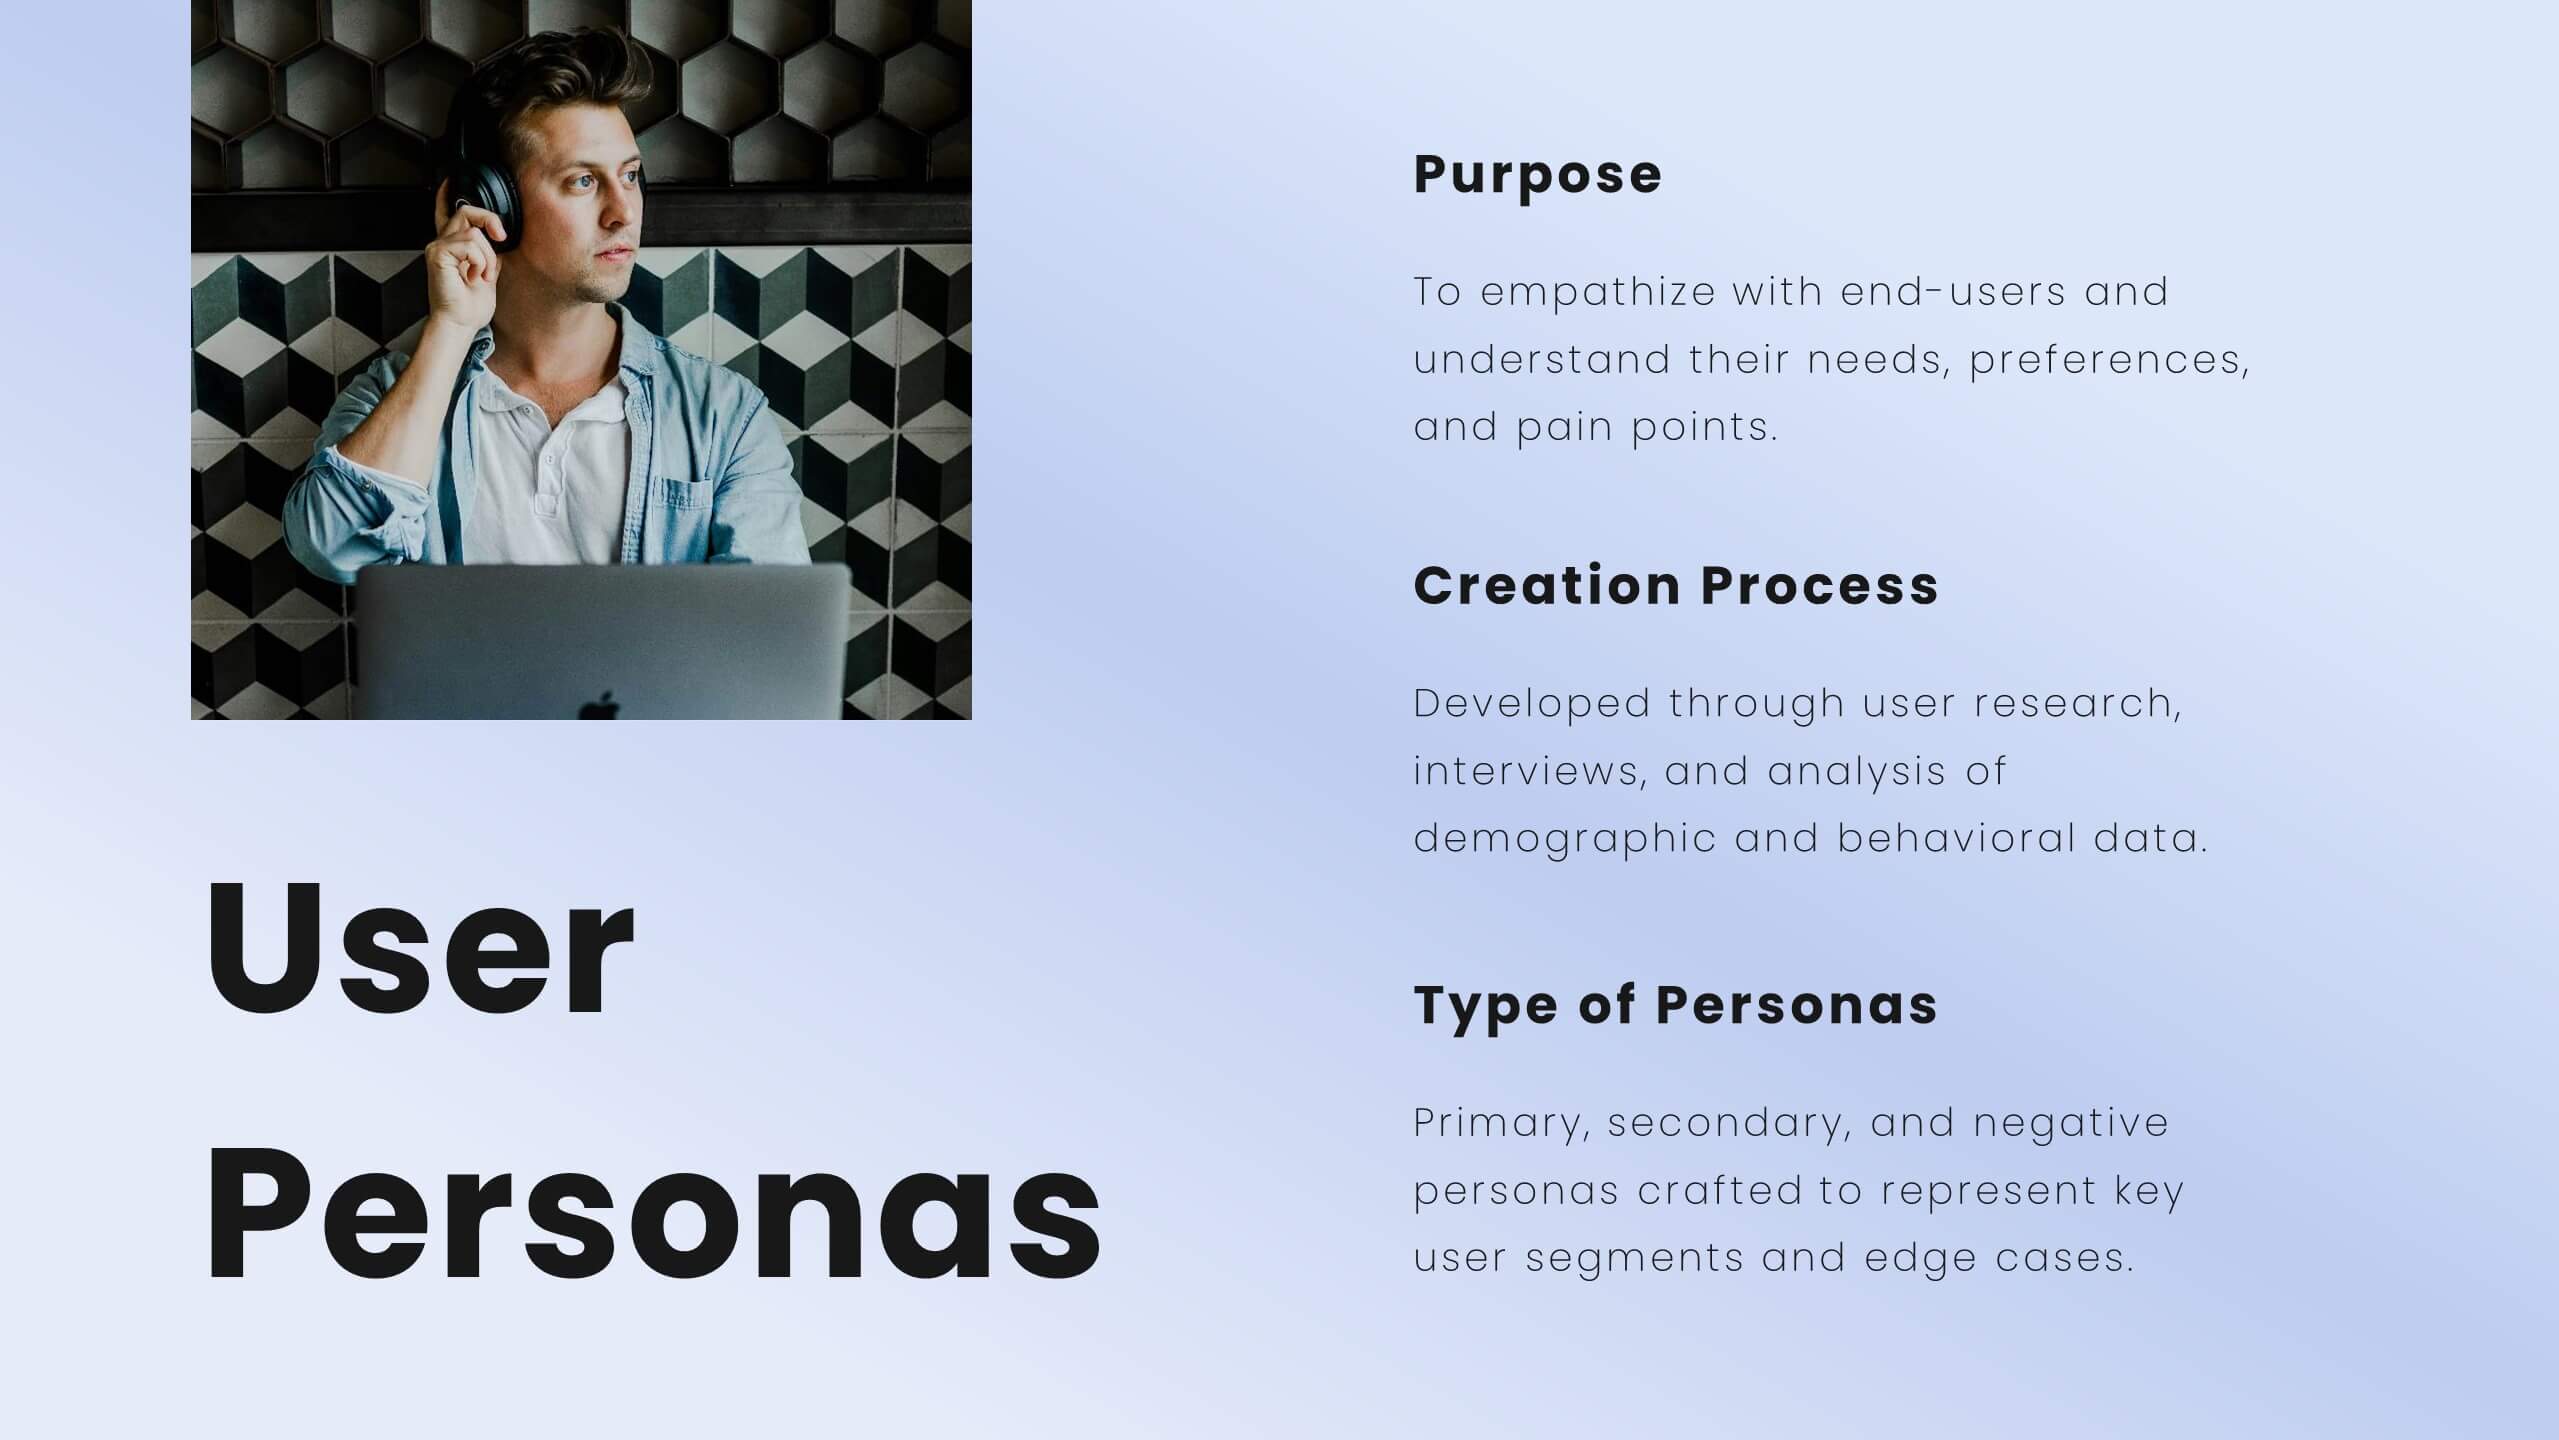
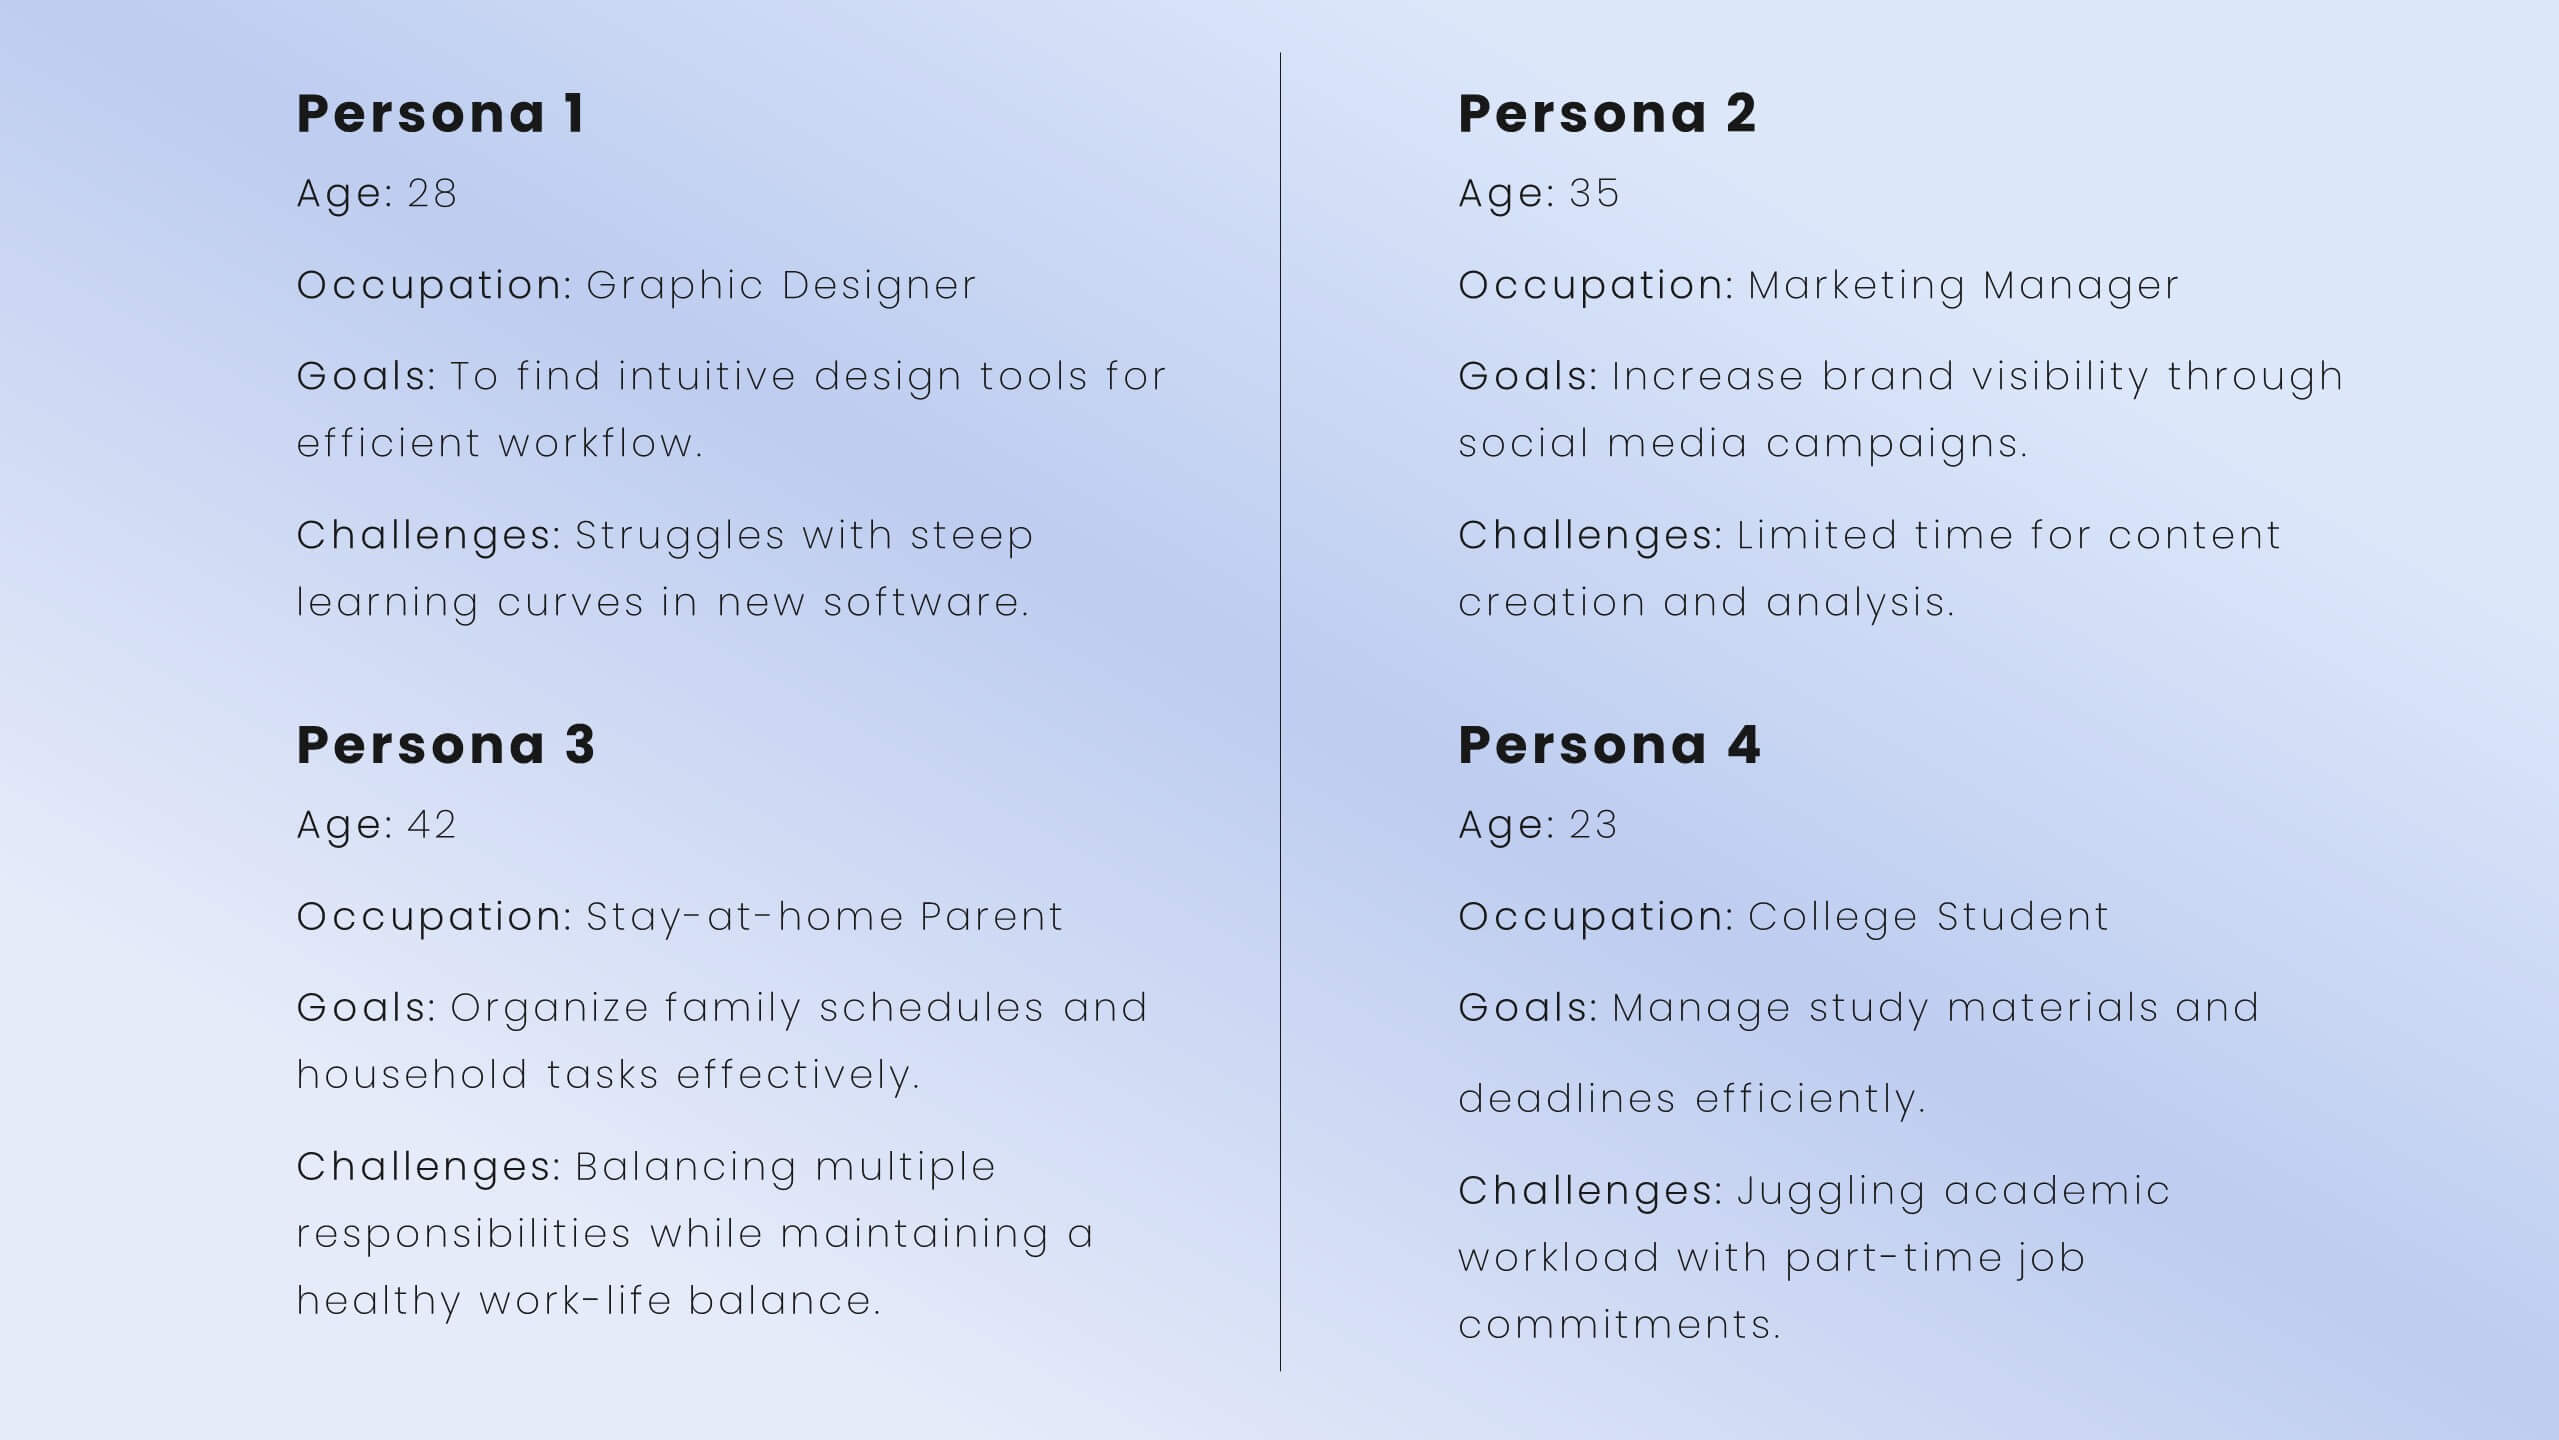
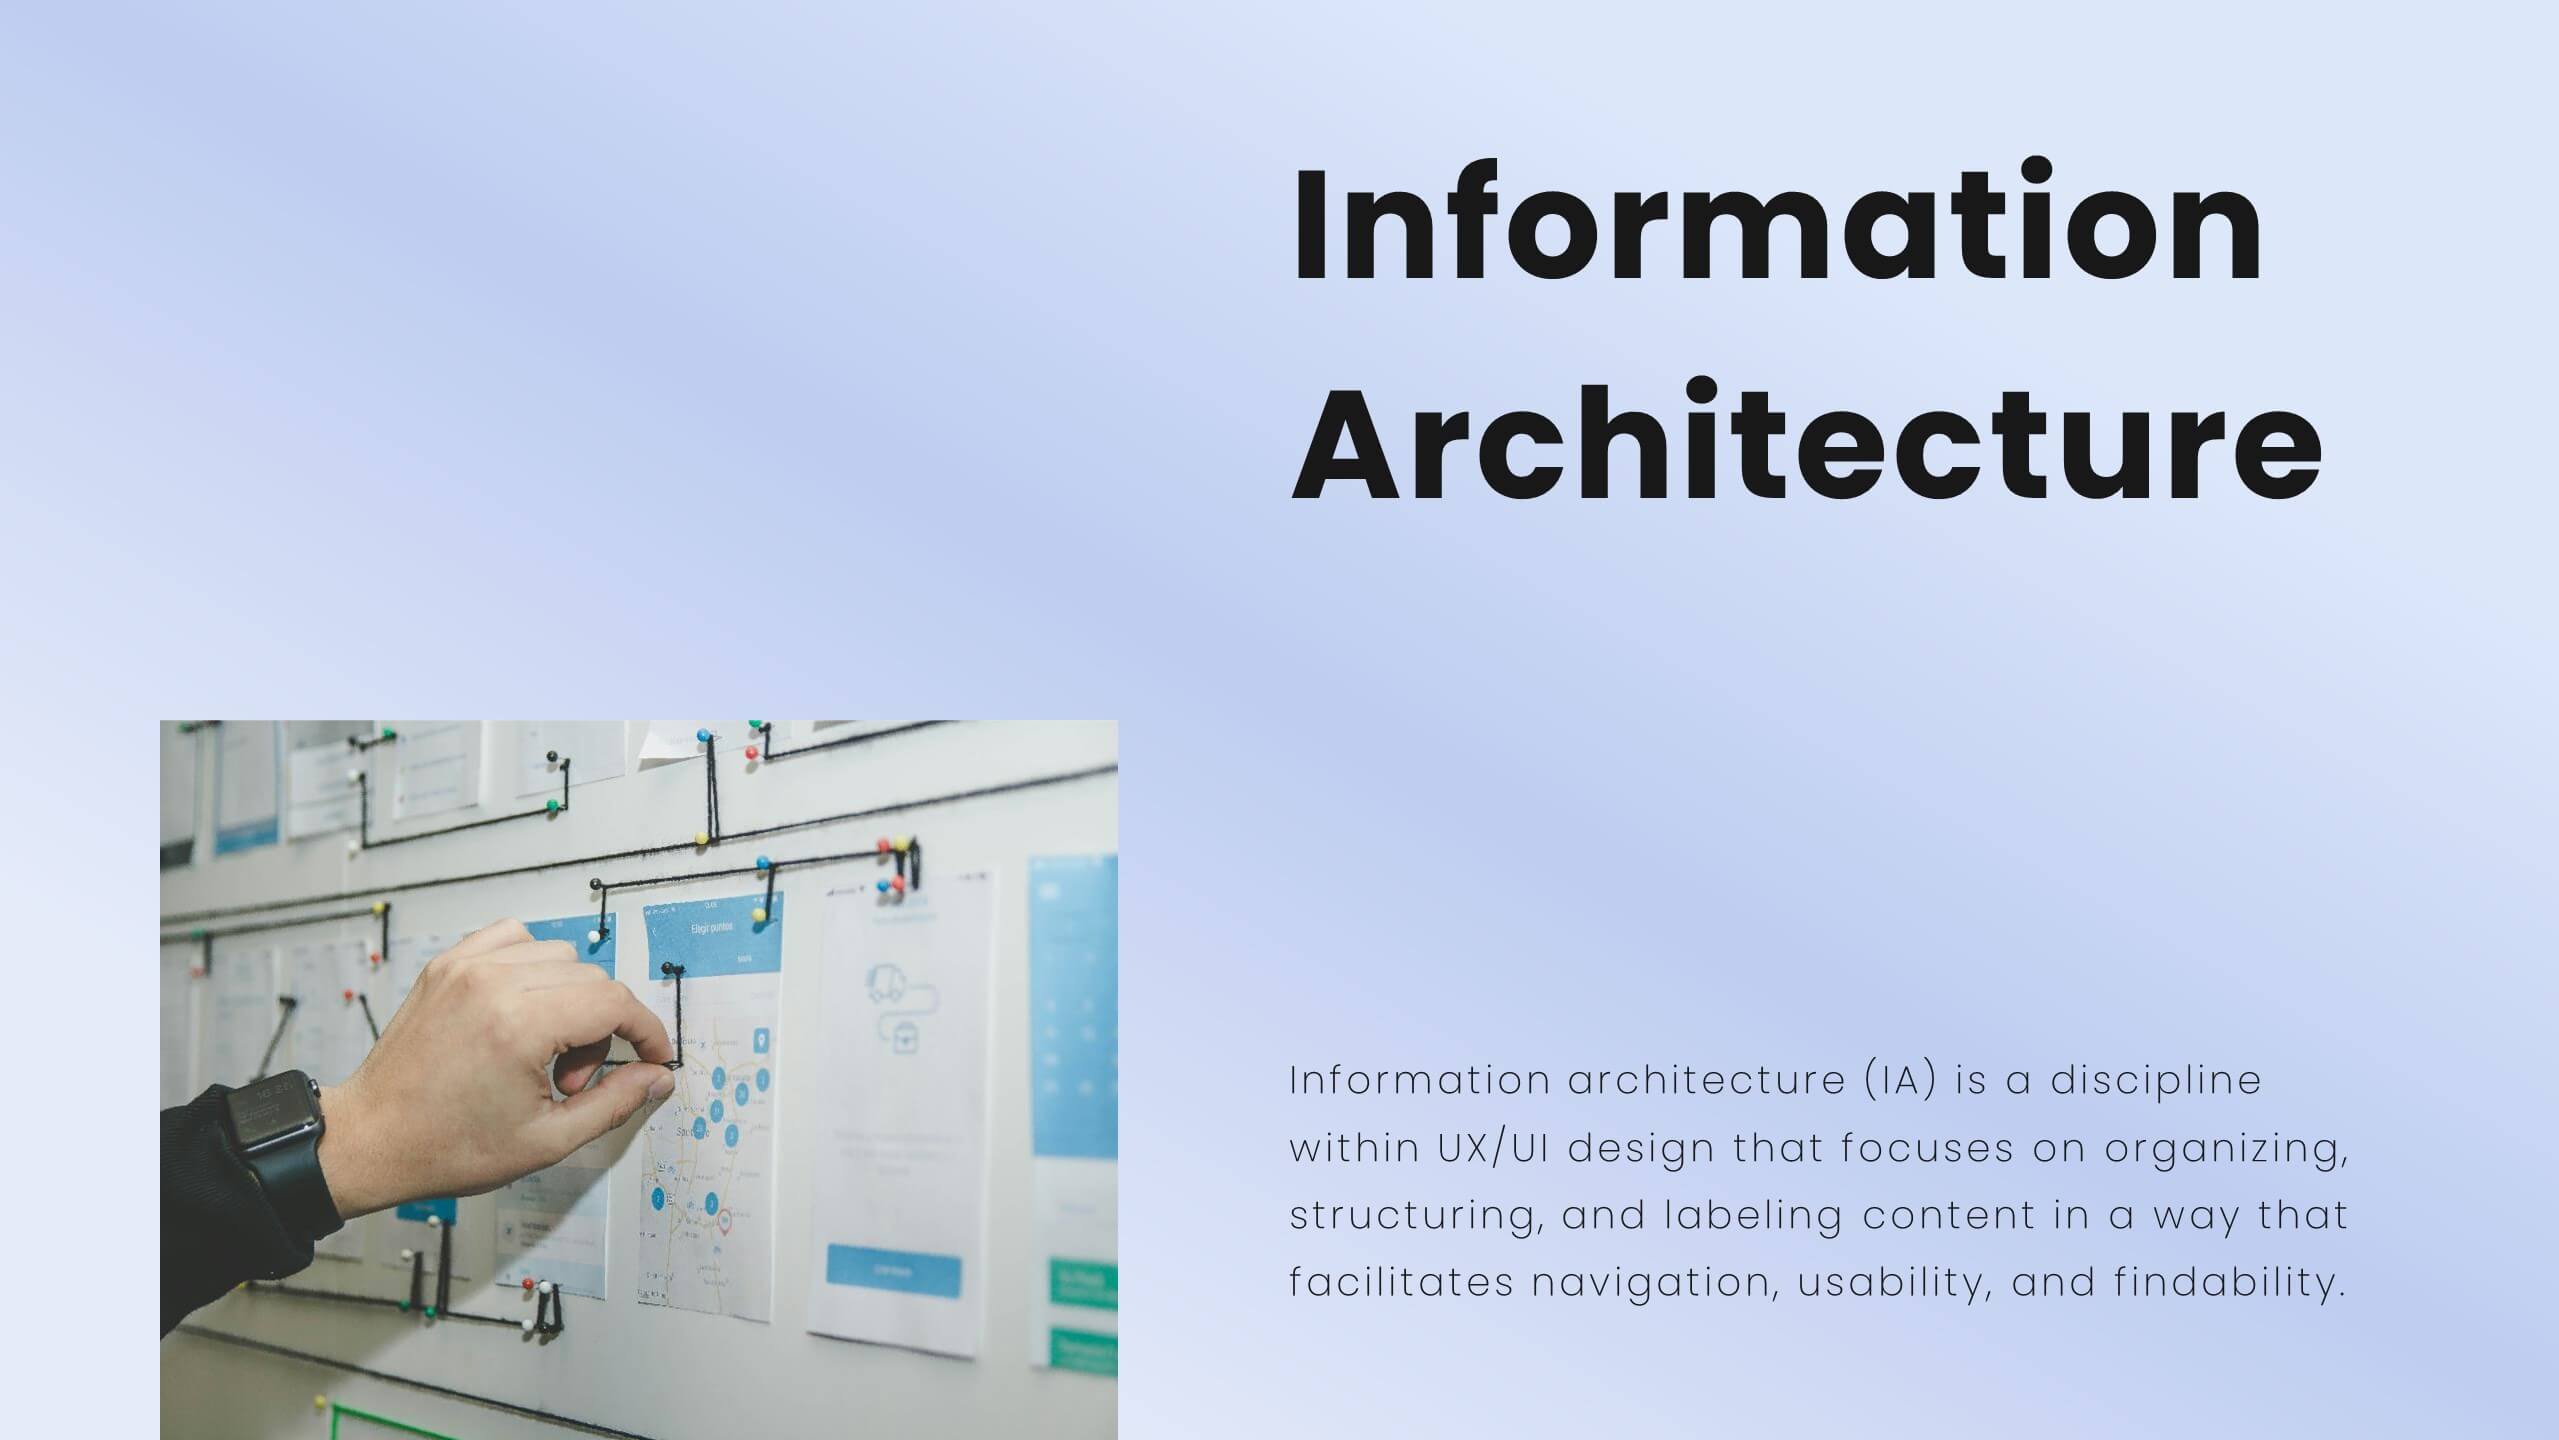
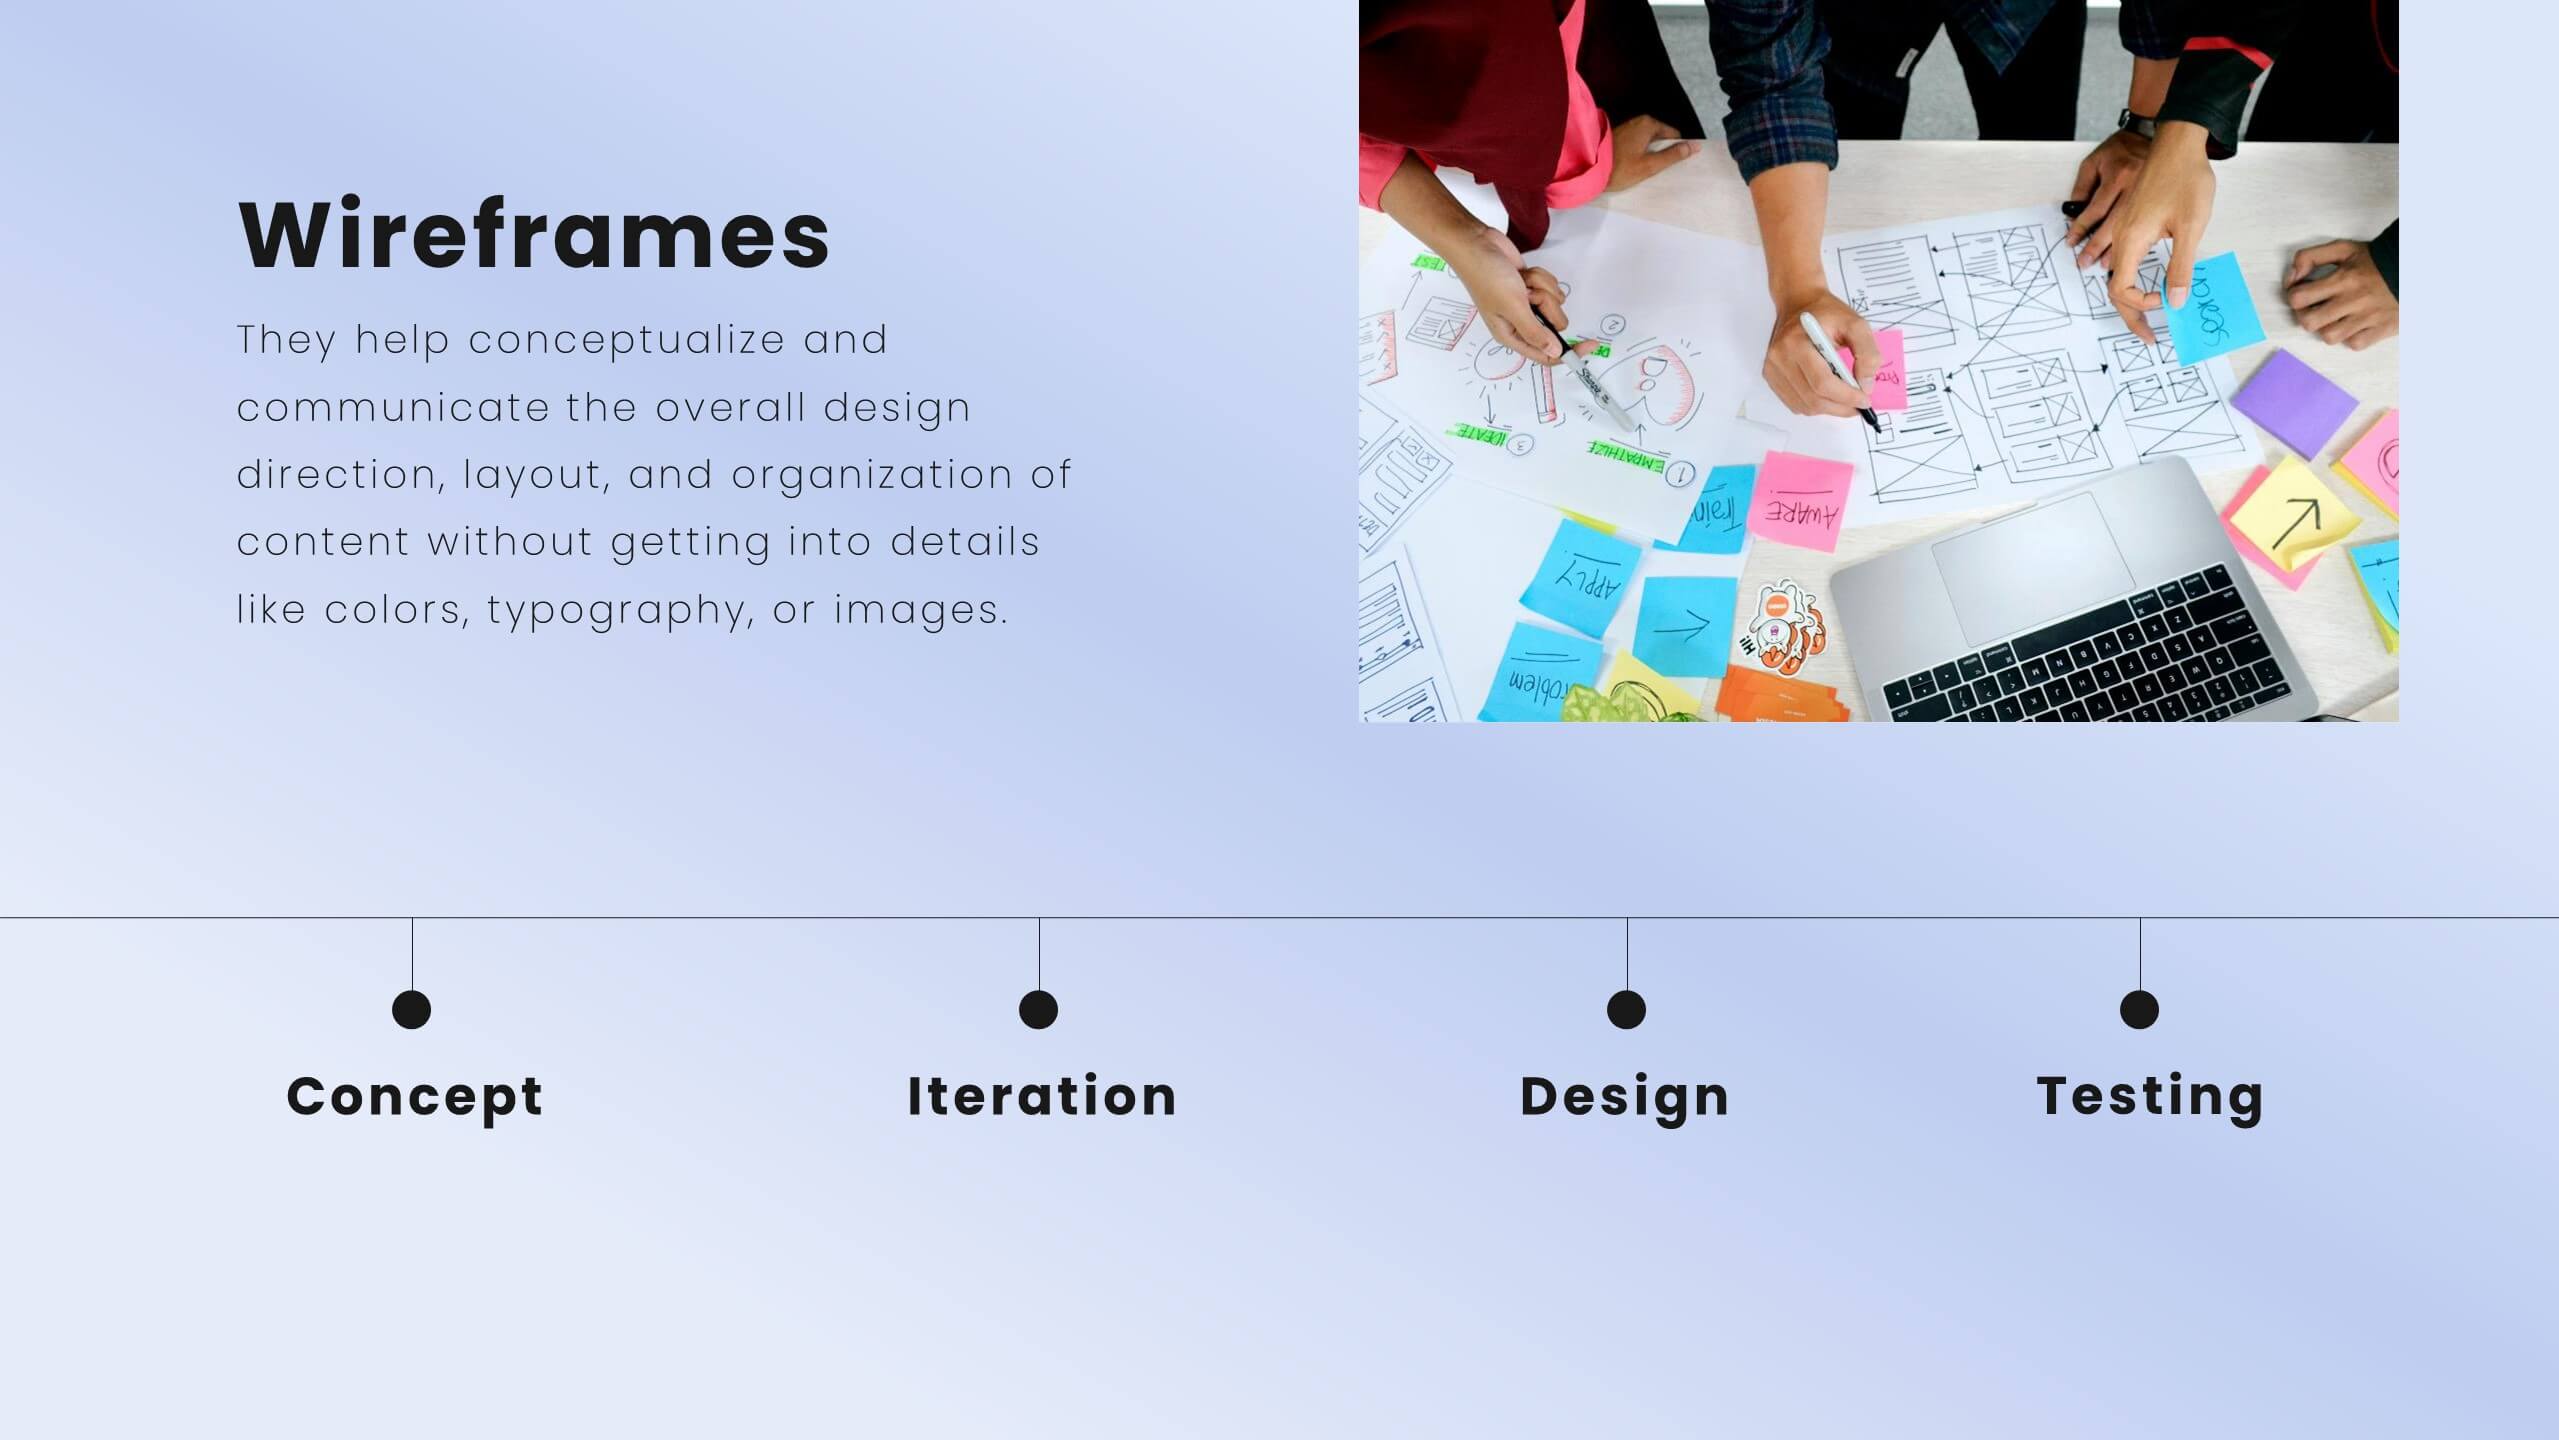
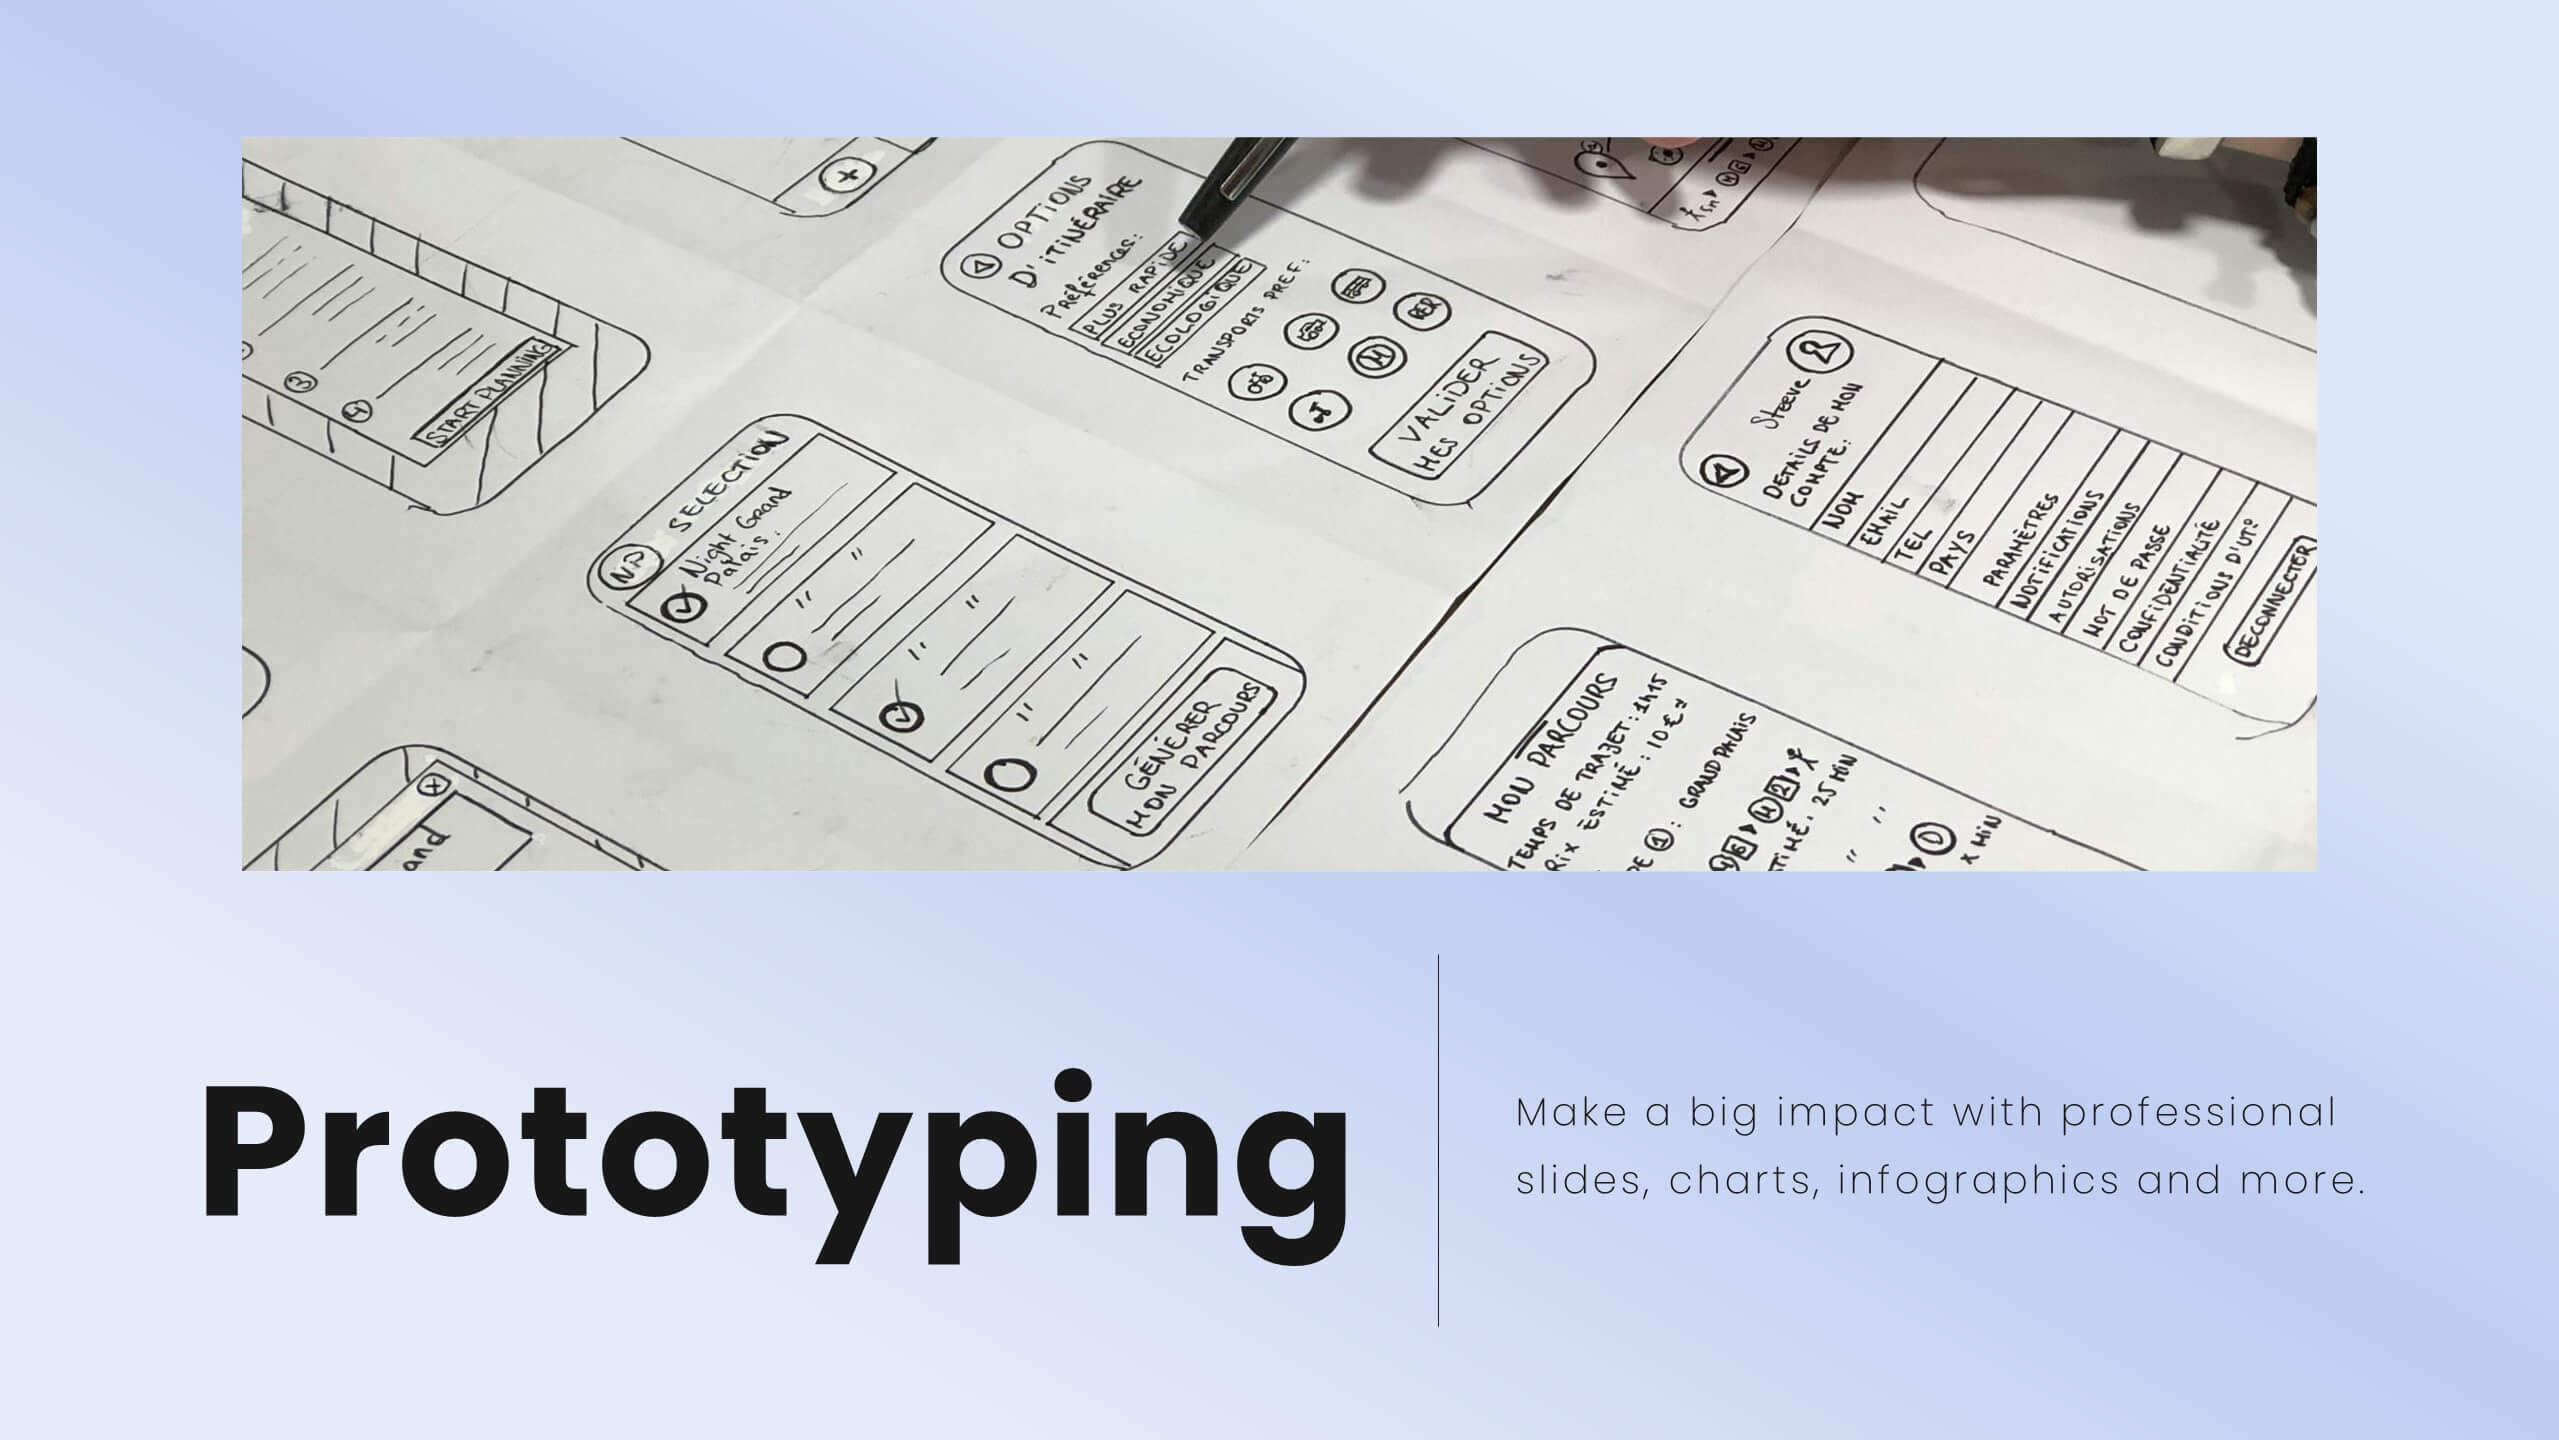
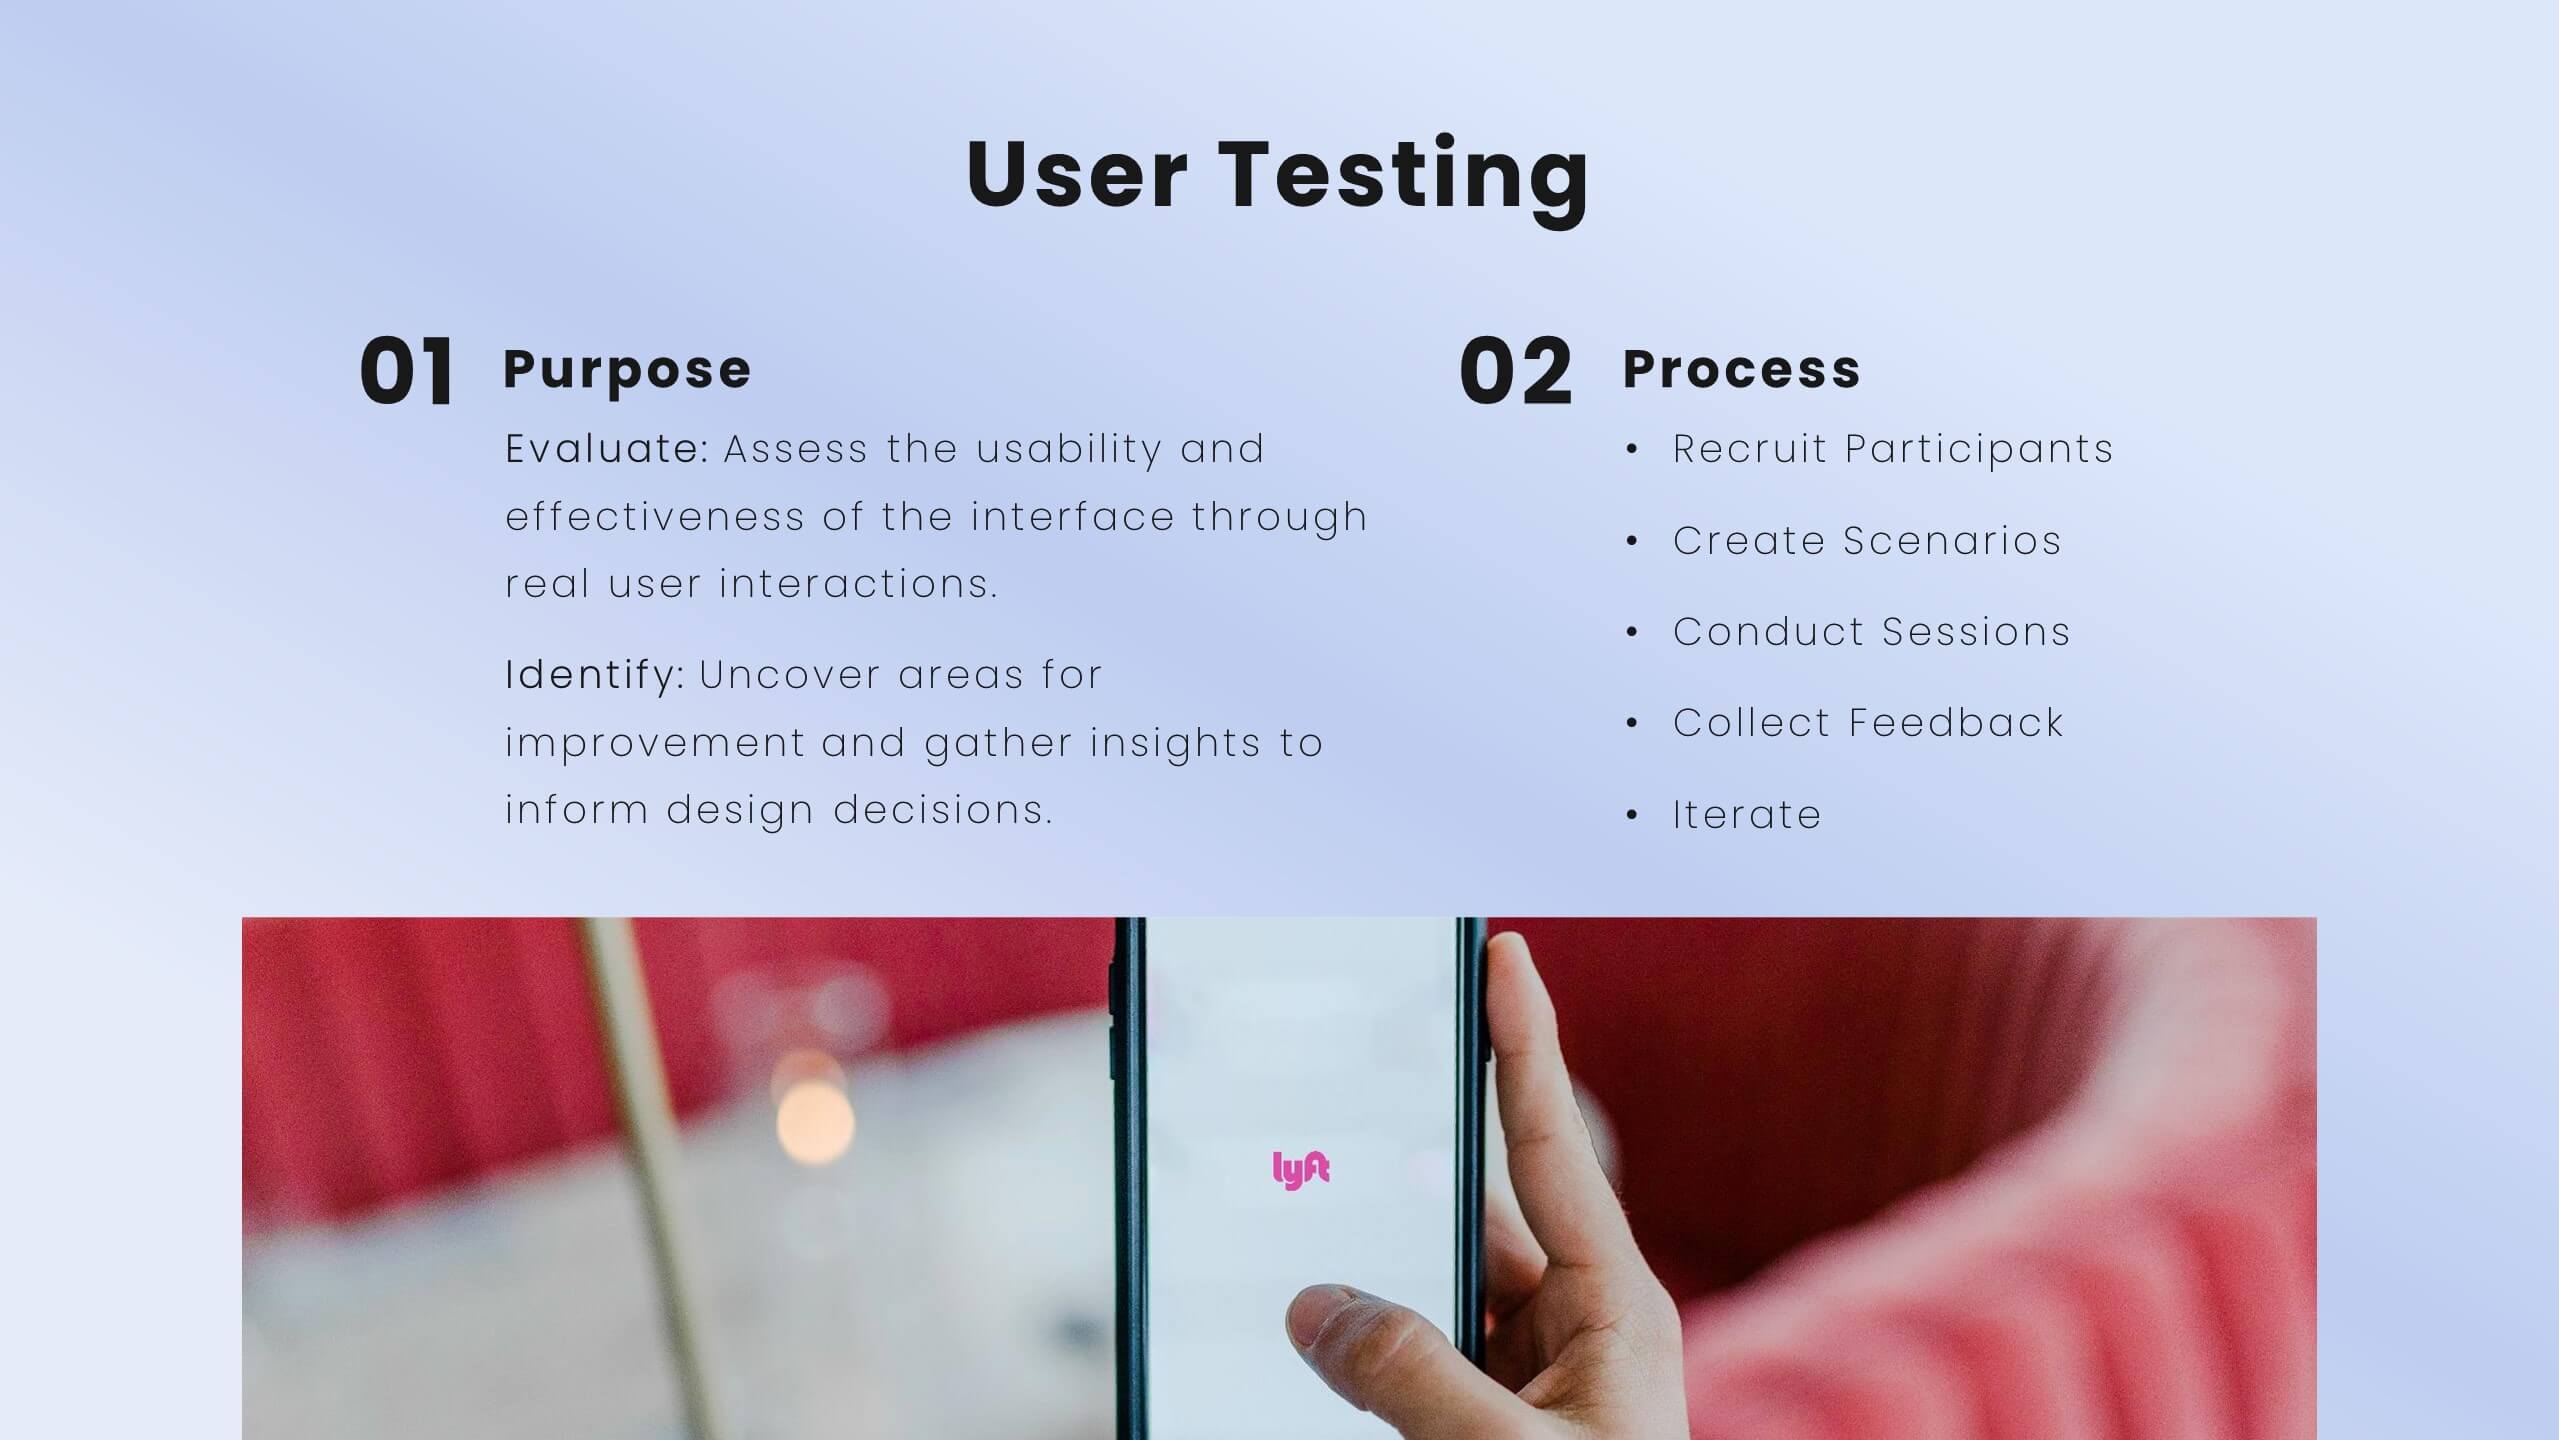
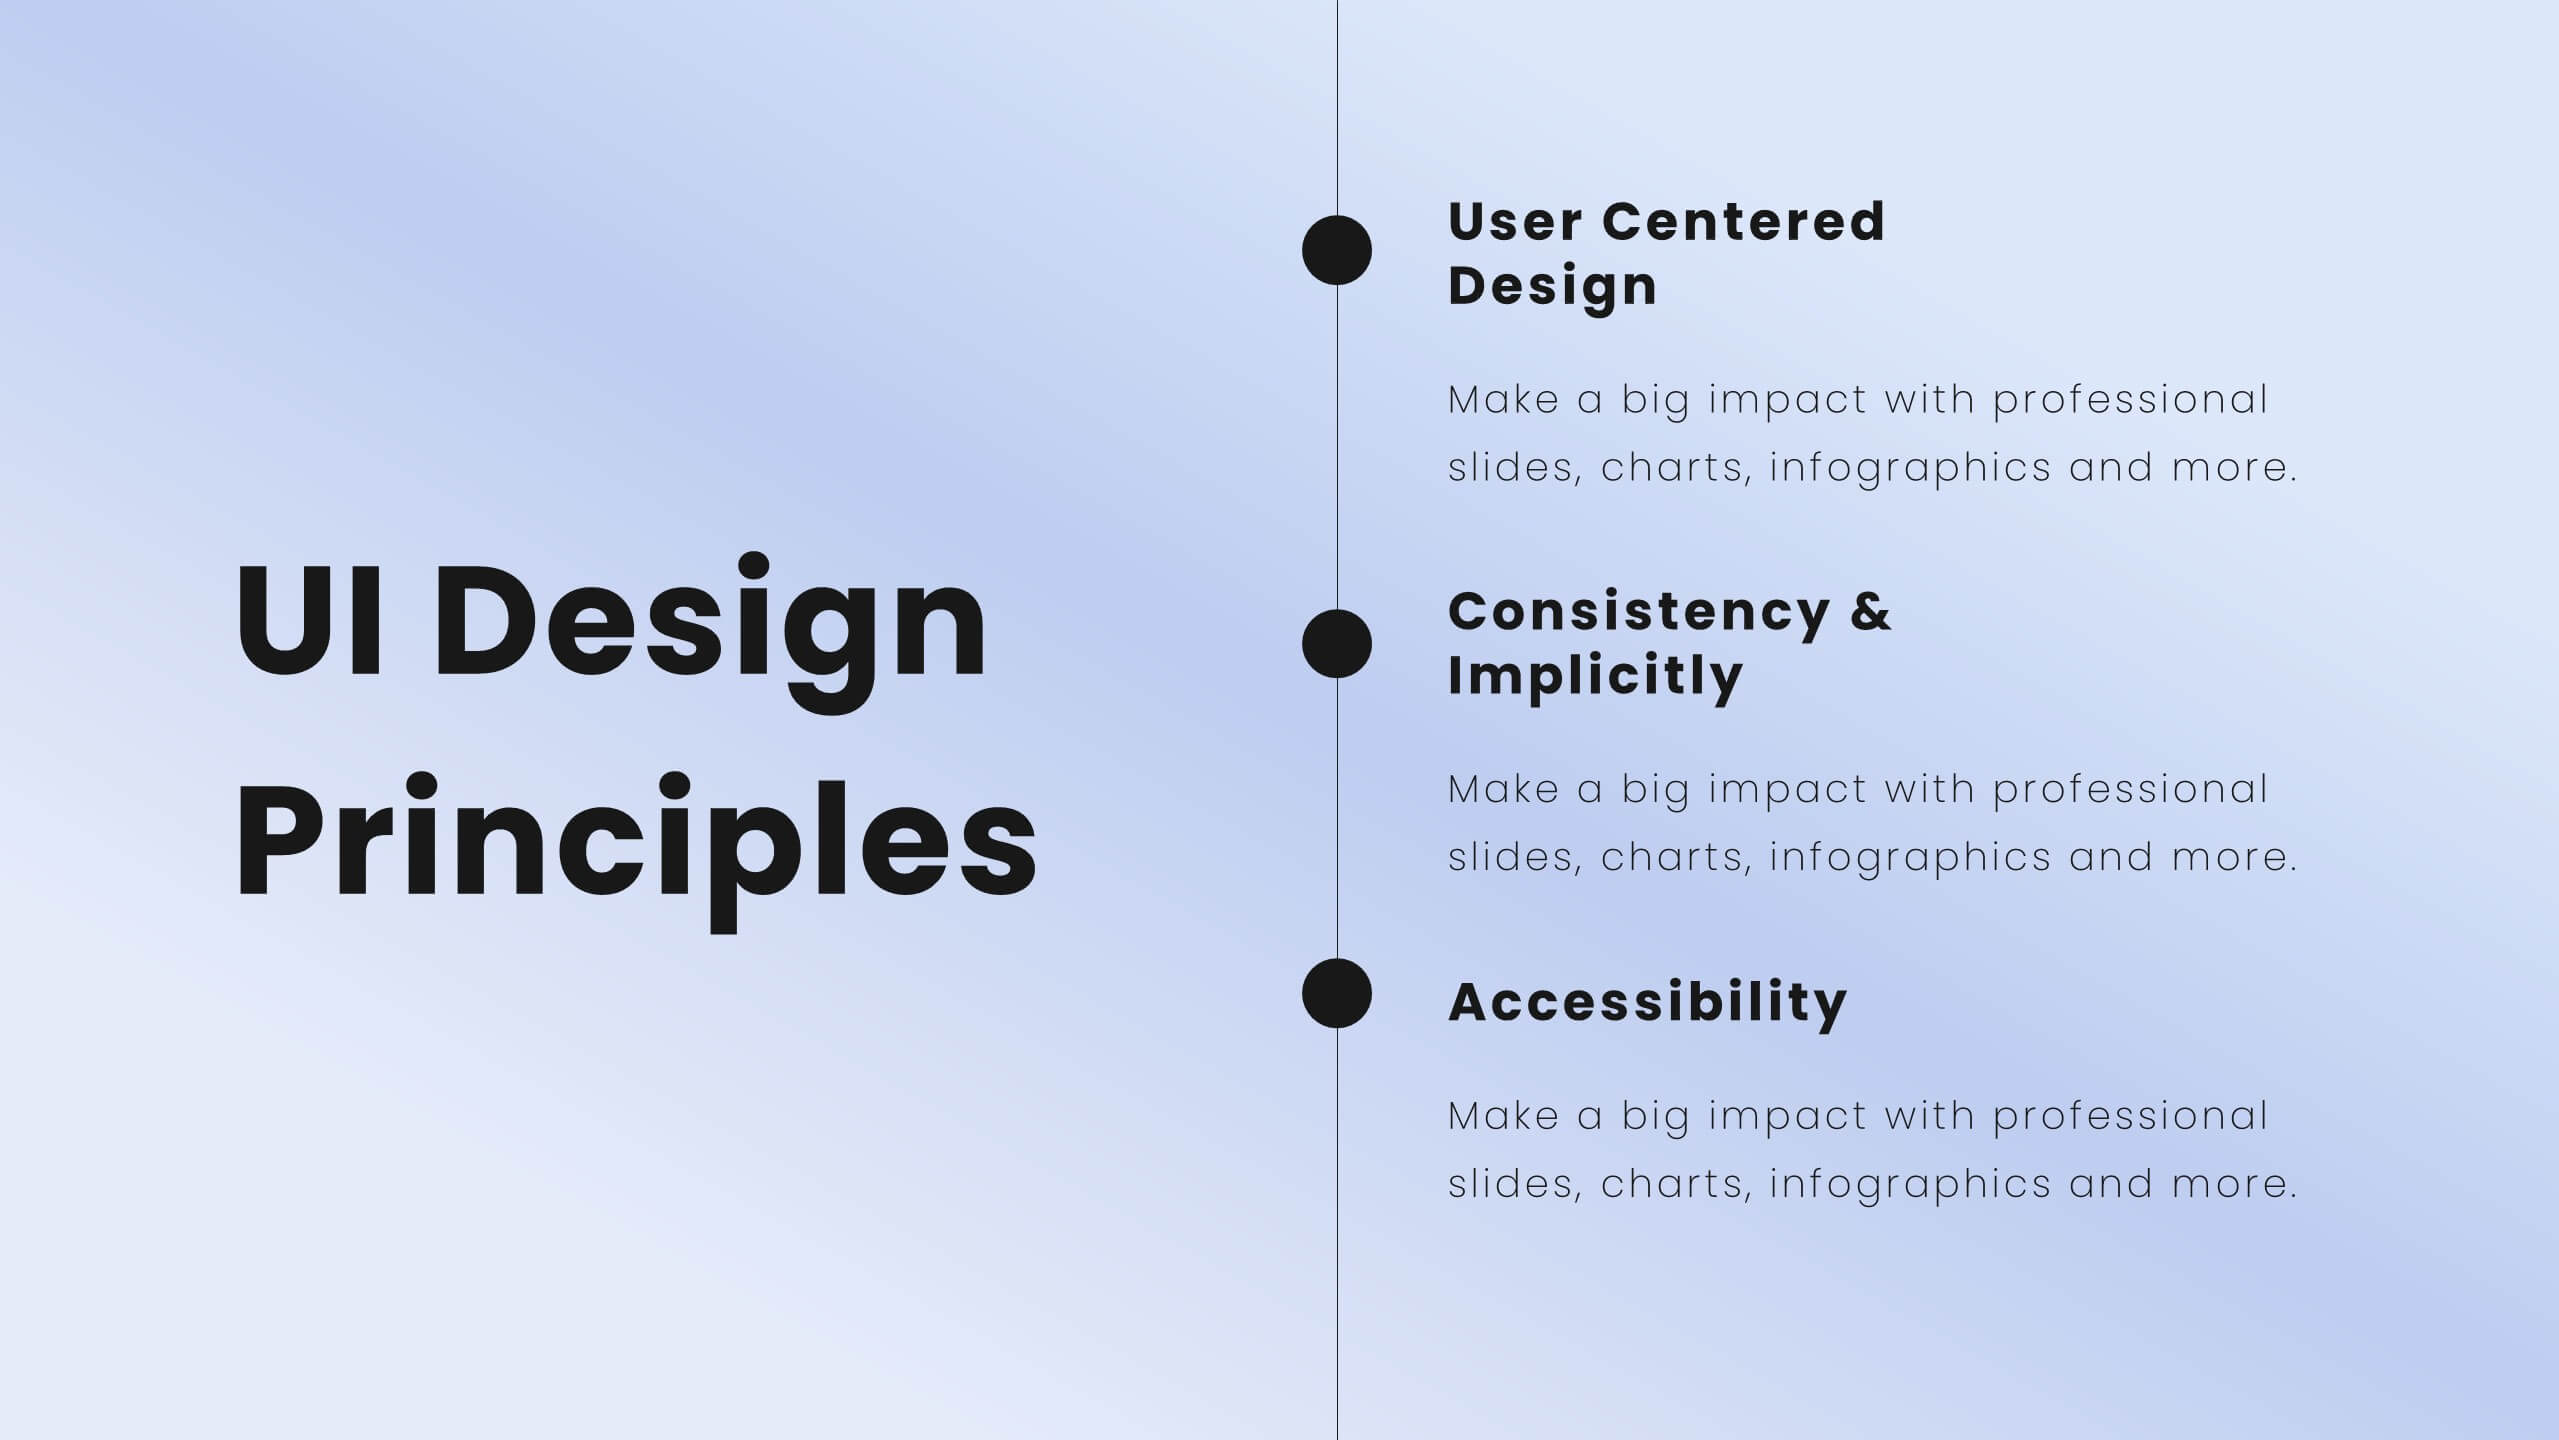
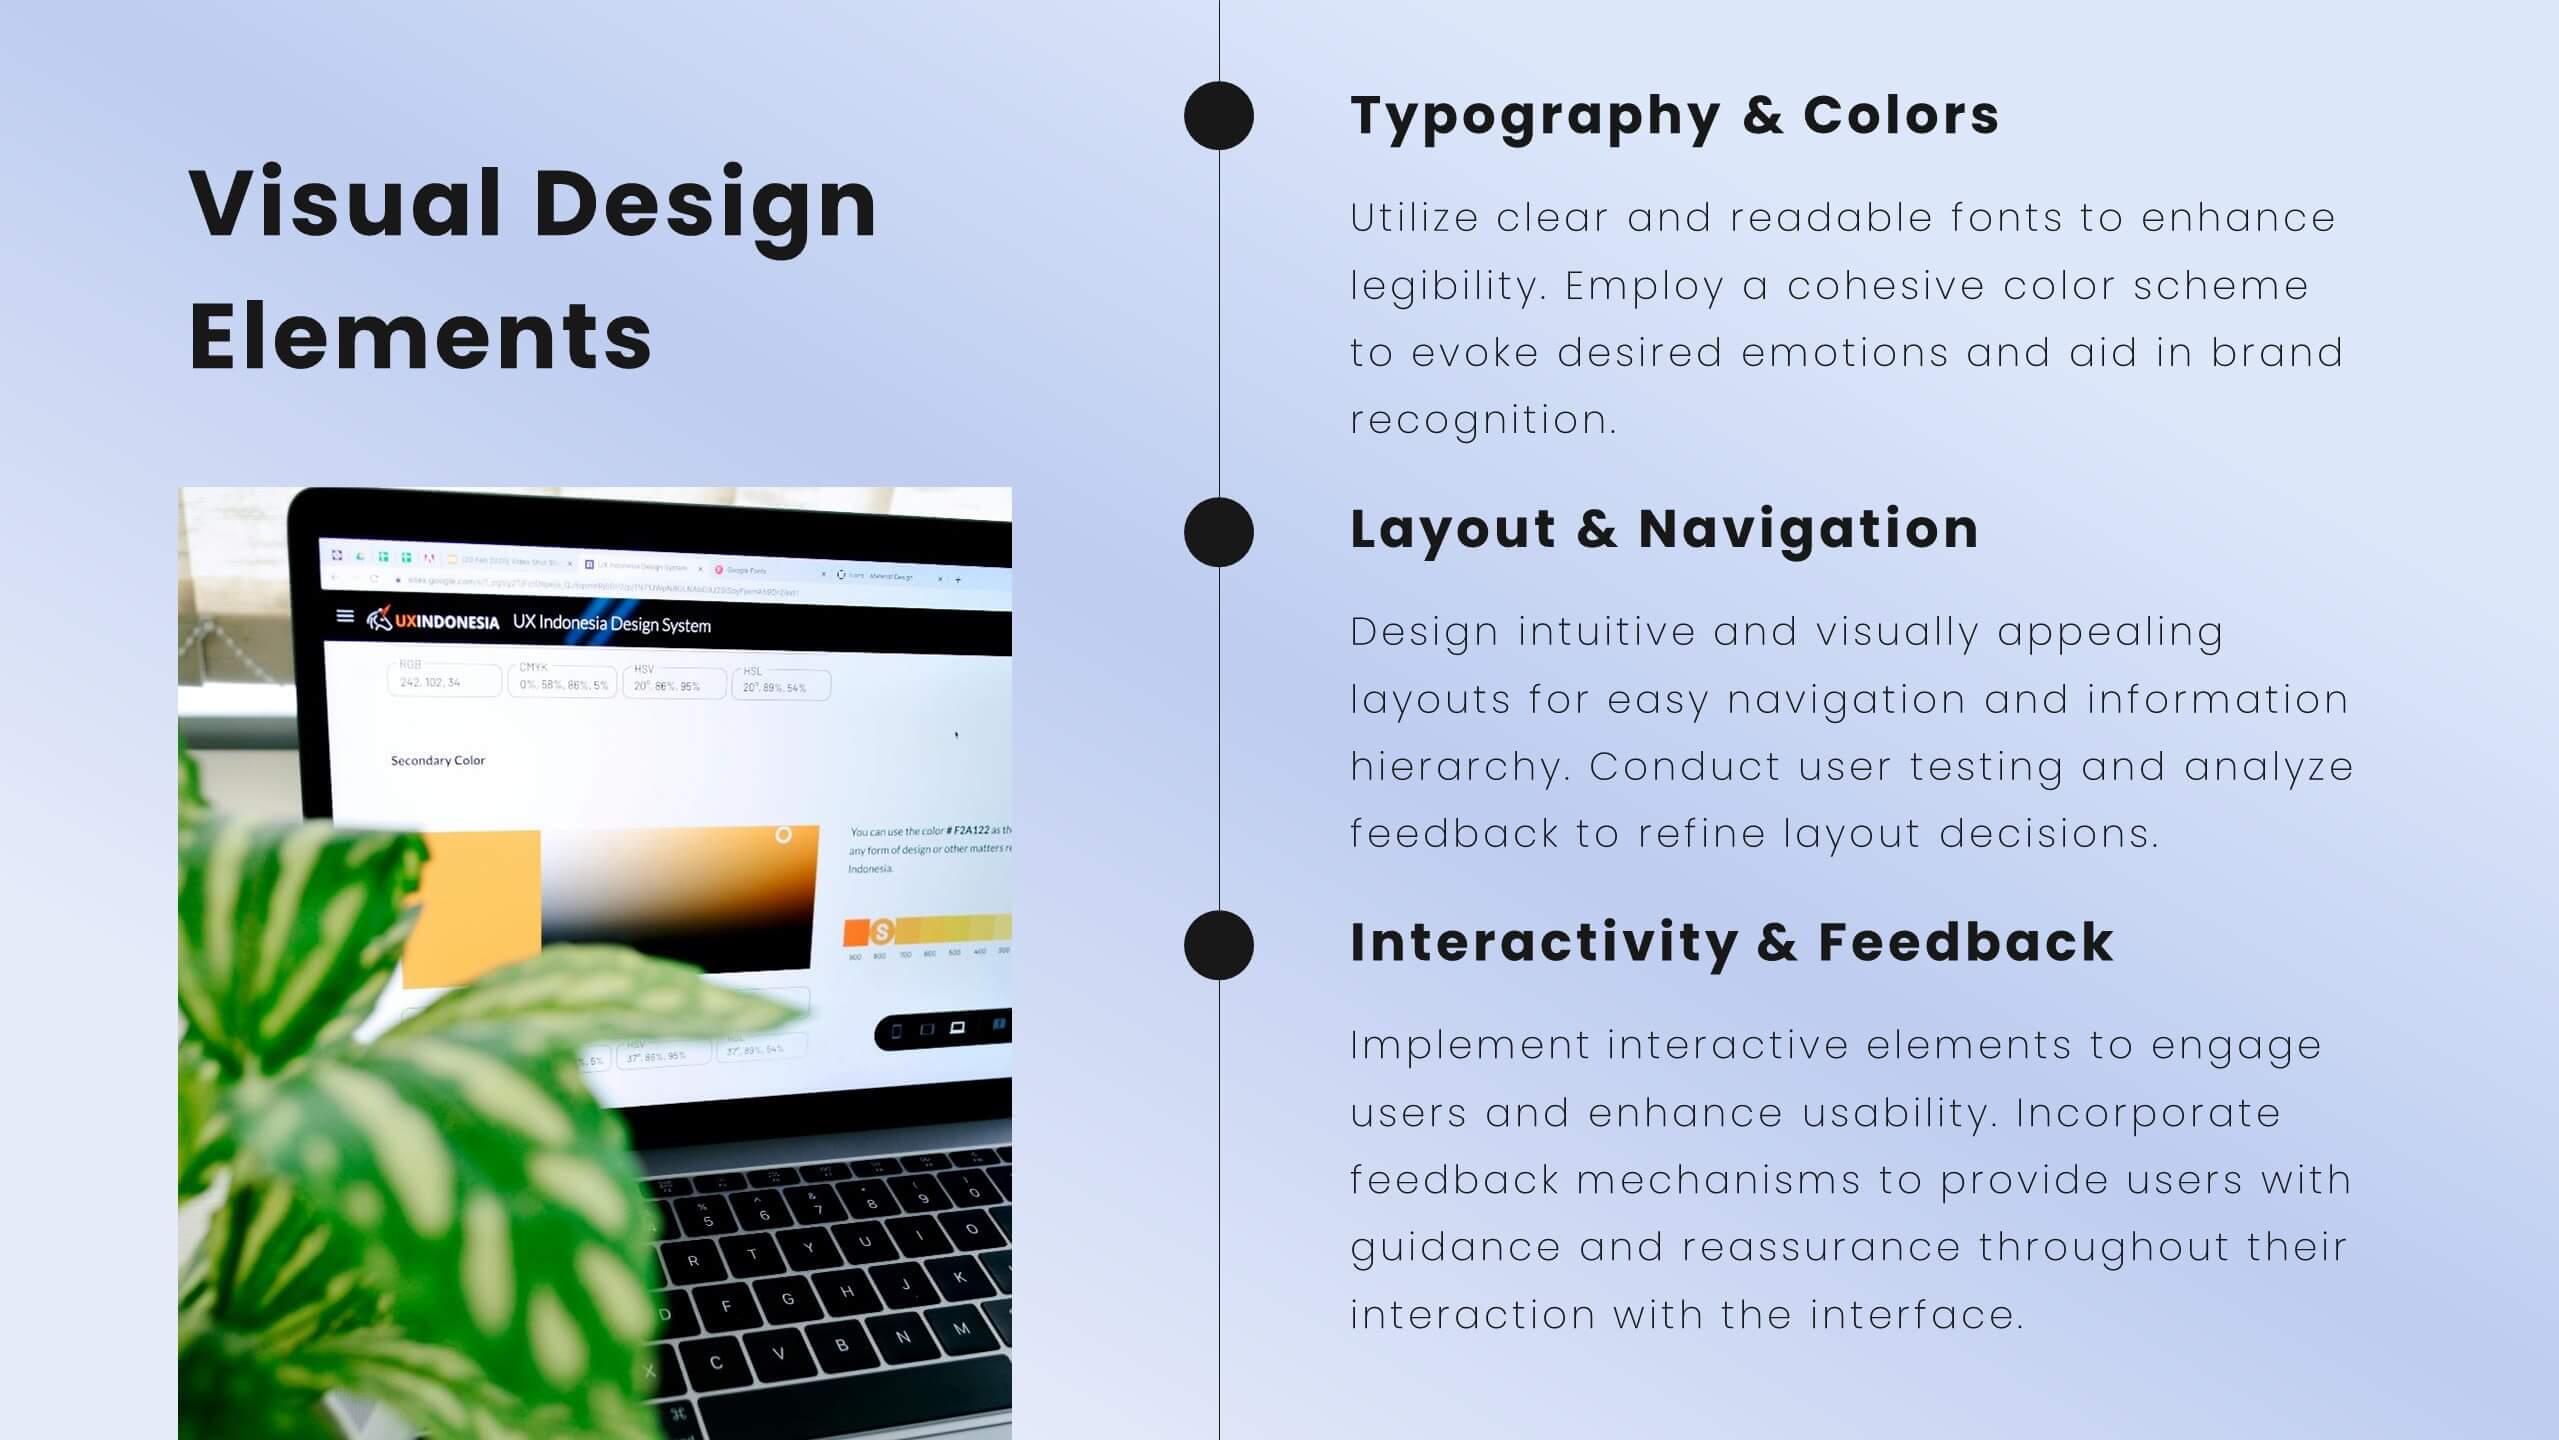
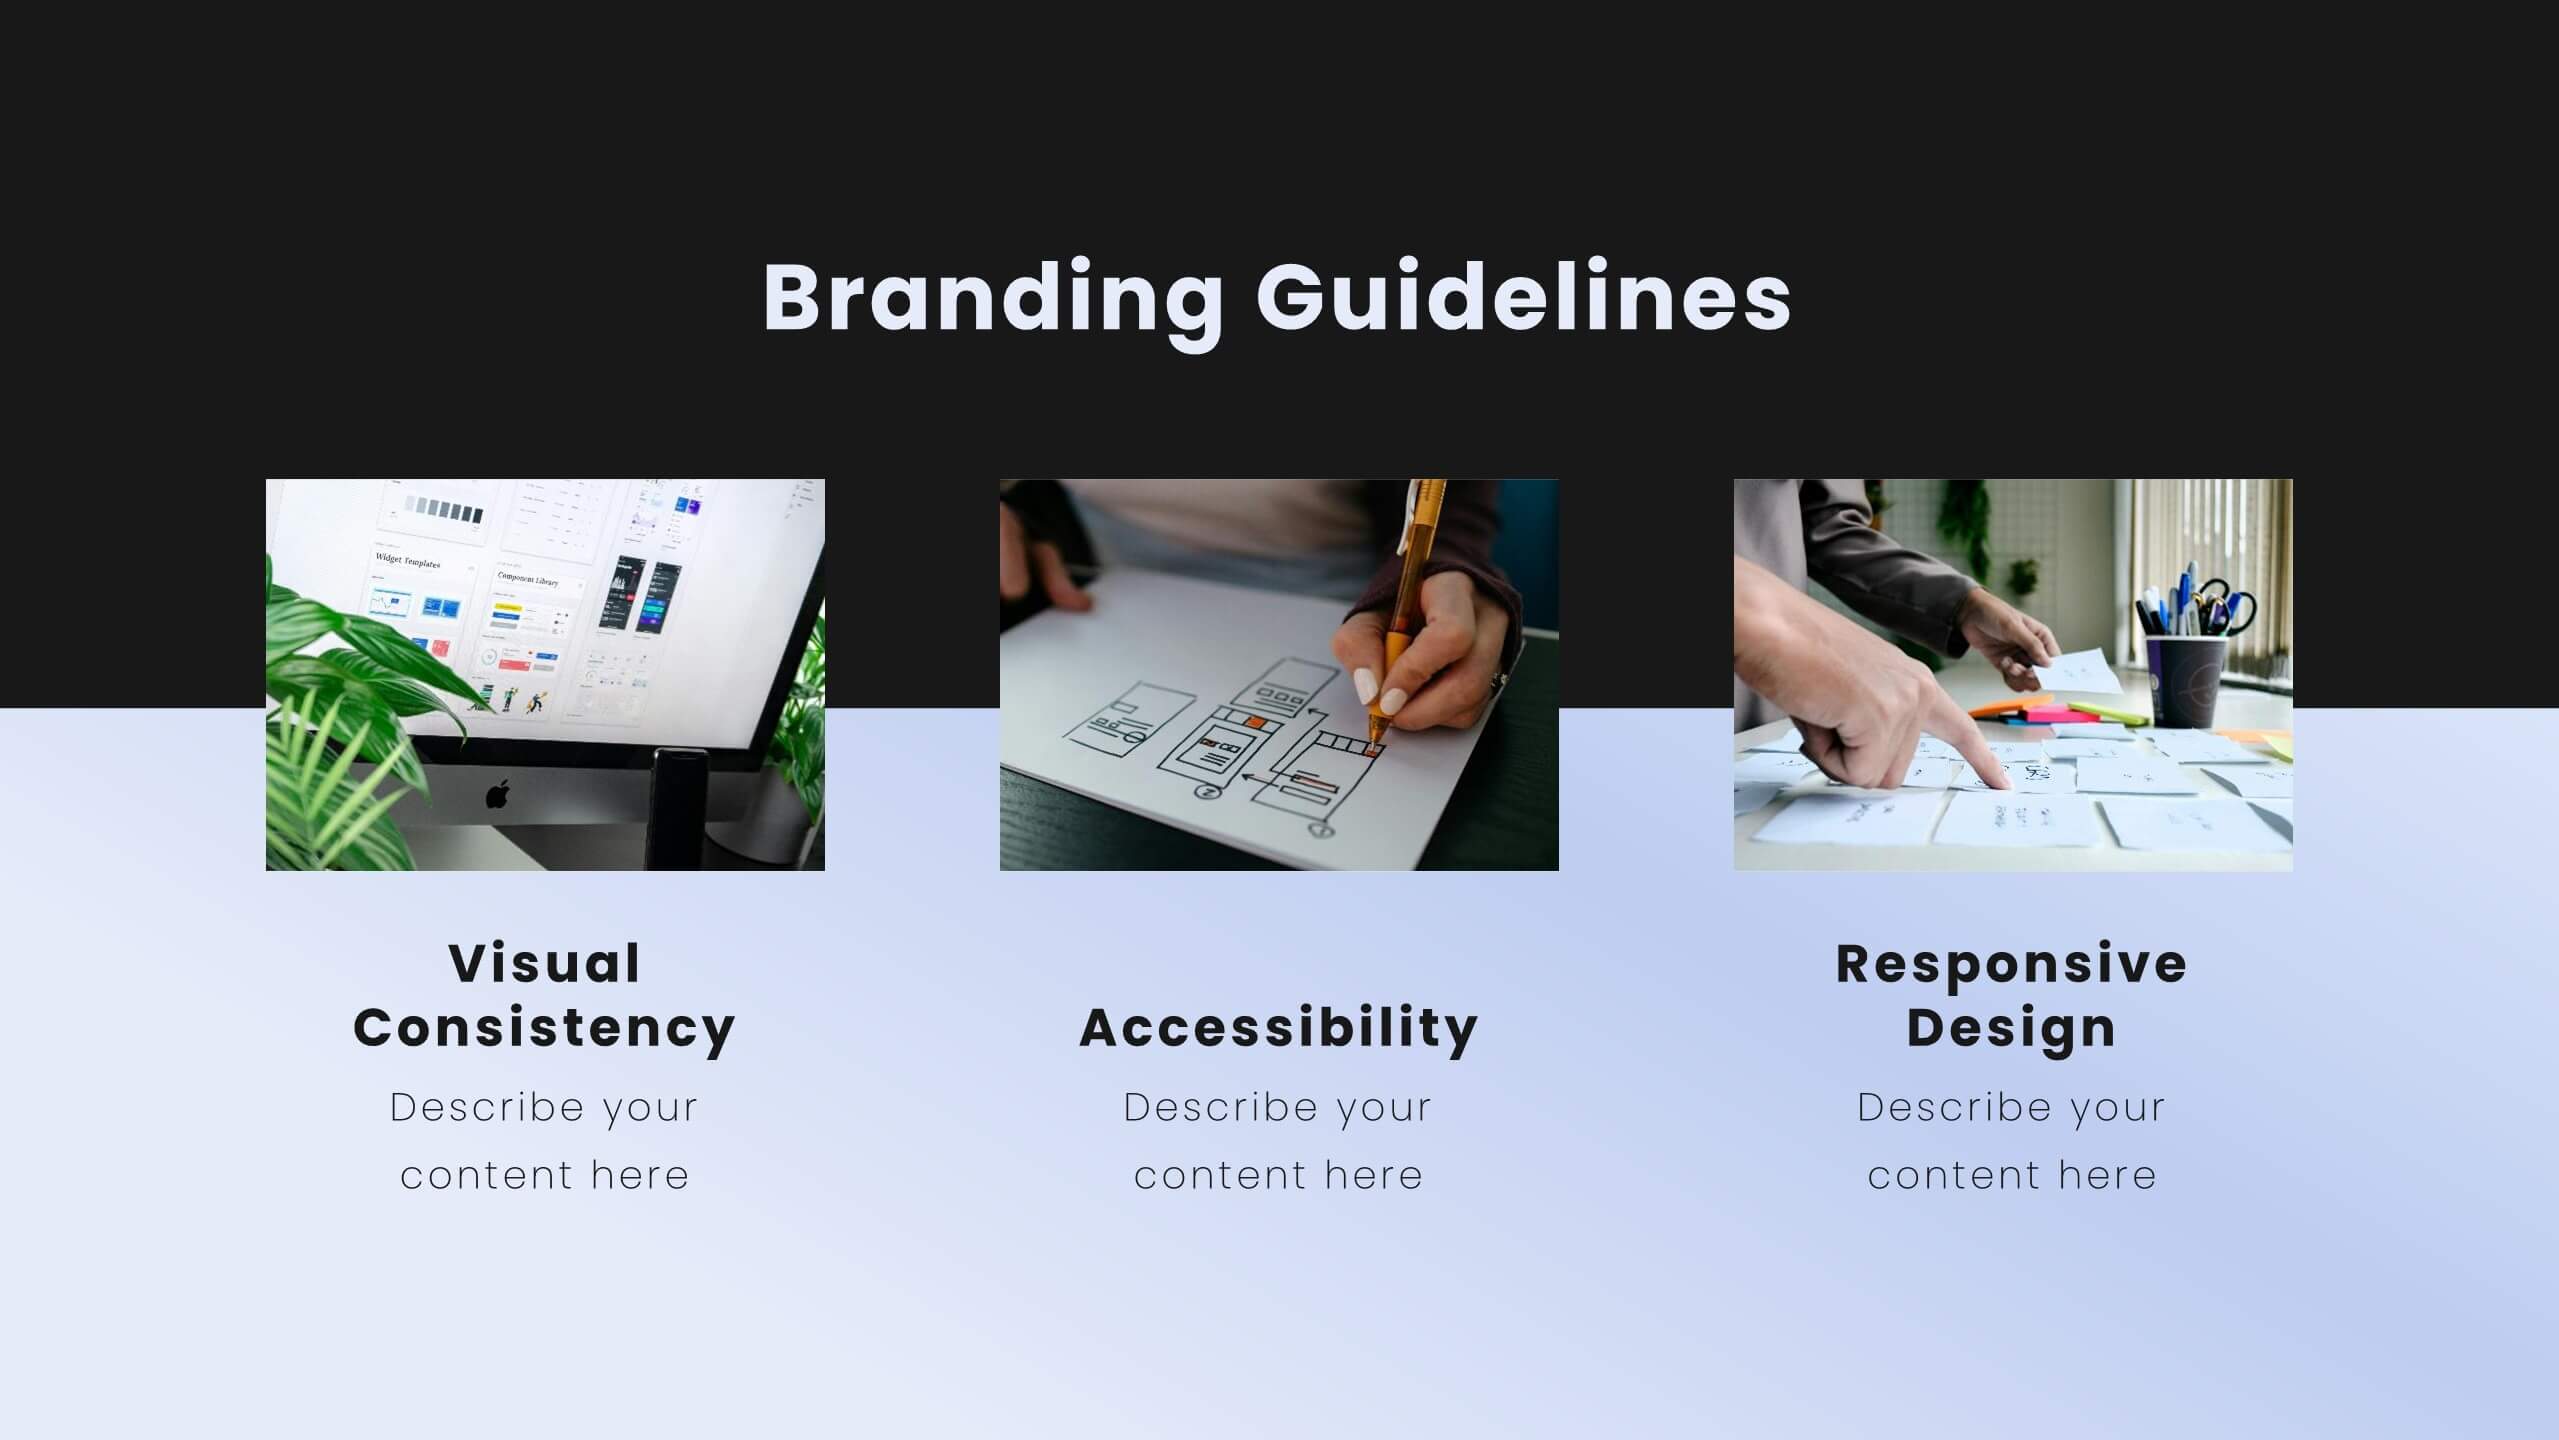
Jigsaw User Experience Proposal Presentation
Enhance user experience with this comprehensive UX proposal template! Perfect for outlining user research, personas, and design principles. Ideal for UX/UI designers aiming to present their strategies and solutions. Compatible with PowerPoint, Keynote, and Google Slides, this template ensures your UX proposals are clear, professional, and impactful. Create exceptional user experiences today!


10 slides
Social Media Marketing Growth Presentation
Boost your social media strategy with this dynamic infographic template! Perfect for illustrating marketing growth, engagement tactics, and content performance, it features an intuitive flow that simplifies complex data. Ideal for presentations to teams and clients, it’s fully customizable and works seamlessly with PowerPoint, Keynote, and Google Slides.