


Features
- 3 Unique slides
- Fully editable and easy to edit in Microsoft Powerpoint, Keynote and Google Slides
- 16:9 widescreen layout
- Clean and professional designs
- Export to JPG, PDF or send by email


Do you have any questions?
Recommend


4 slides
Investment Analysis Finance Presentation
Target your financial insights with this Investment Analysis Finance Presentation. Designed with a bold bullseye diagram and four labeled pointers, this slide helps communicate core focus areas, ROI, risk zones, or asset distribution. Ideal for pitch decks, portfolio reviews, and financial reports. Fully editable in PowerPoint, Keynote, and Google Slides—perfect for analysts, investors, and finance professionals.


22 slides
Thistlewisp Advertising Agency Proposal Presentation
Win clients and showcase your agency’s capabilities with this sleek and comprehensive proposal presentation! It highlights essential sections like mission and vision, client success stories, case studies, market trends, and creative processes to create a compelling pitch. Ideal for client presentations, this template is fully compatible with PowerPoint, Keynote, and Google Slides.

21 slides
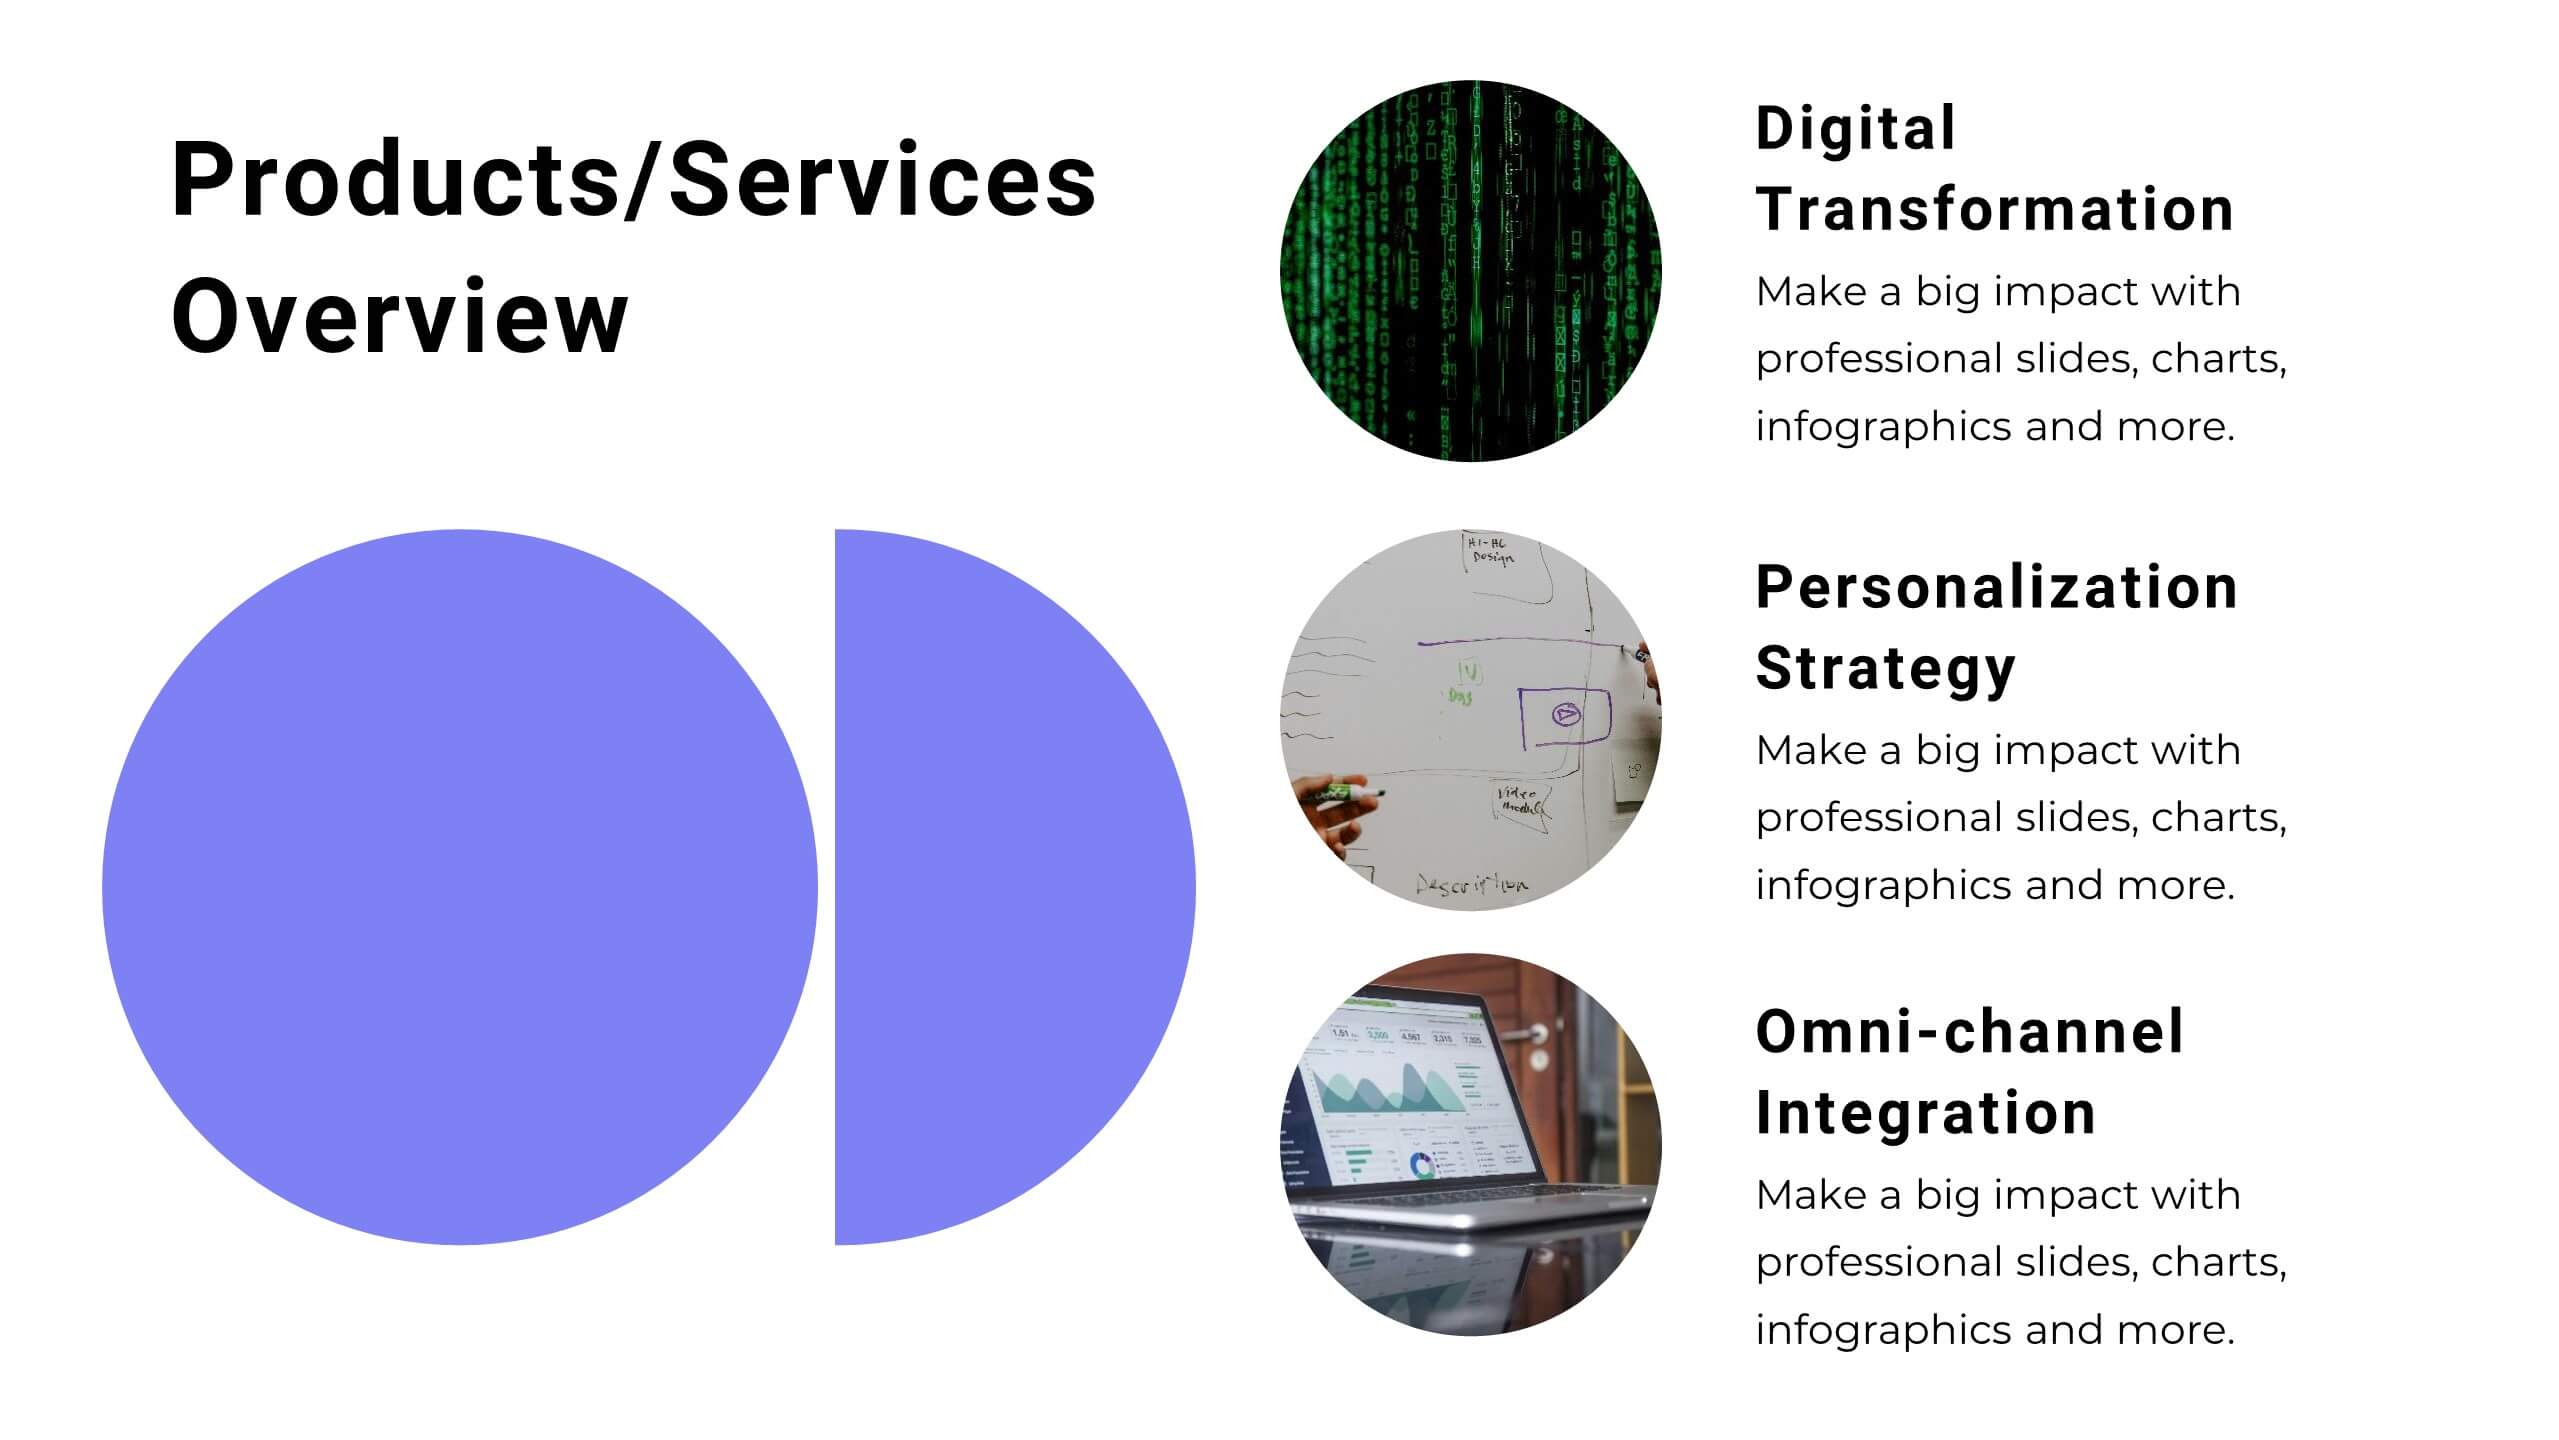
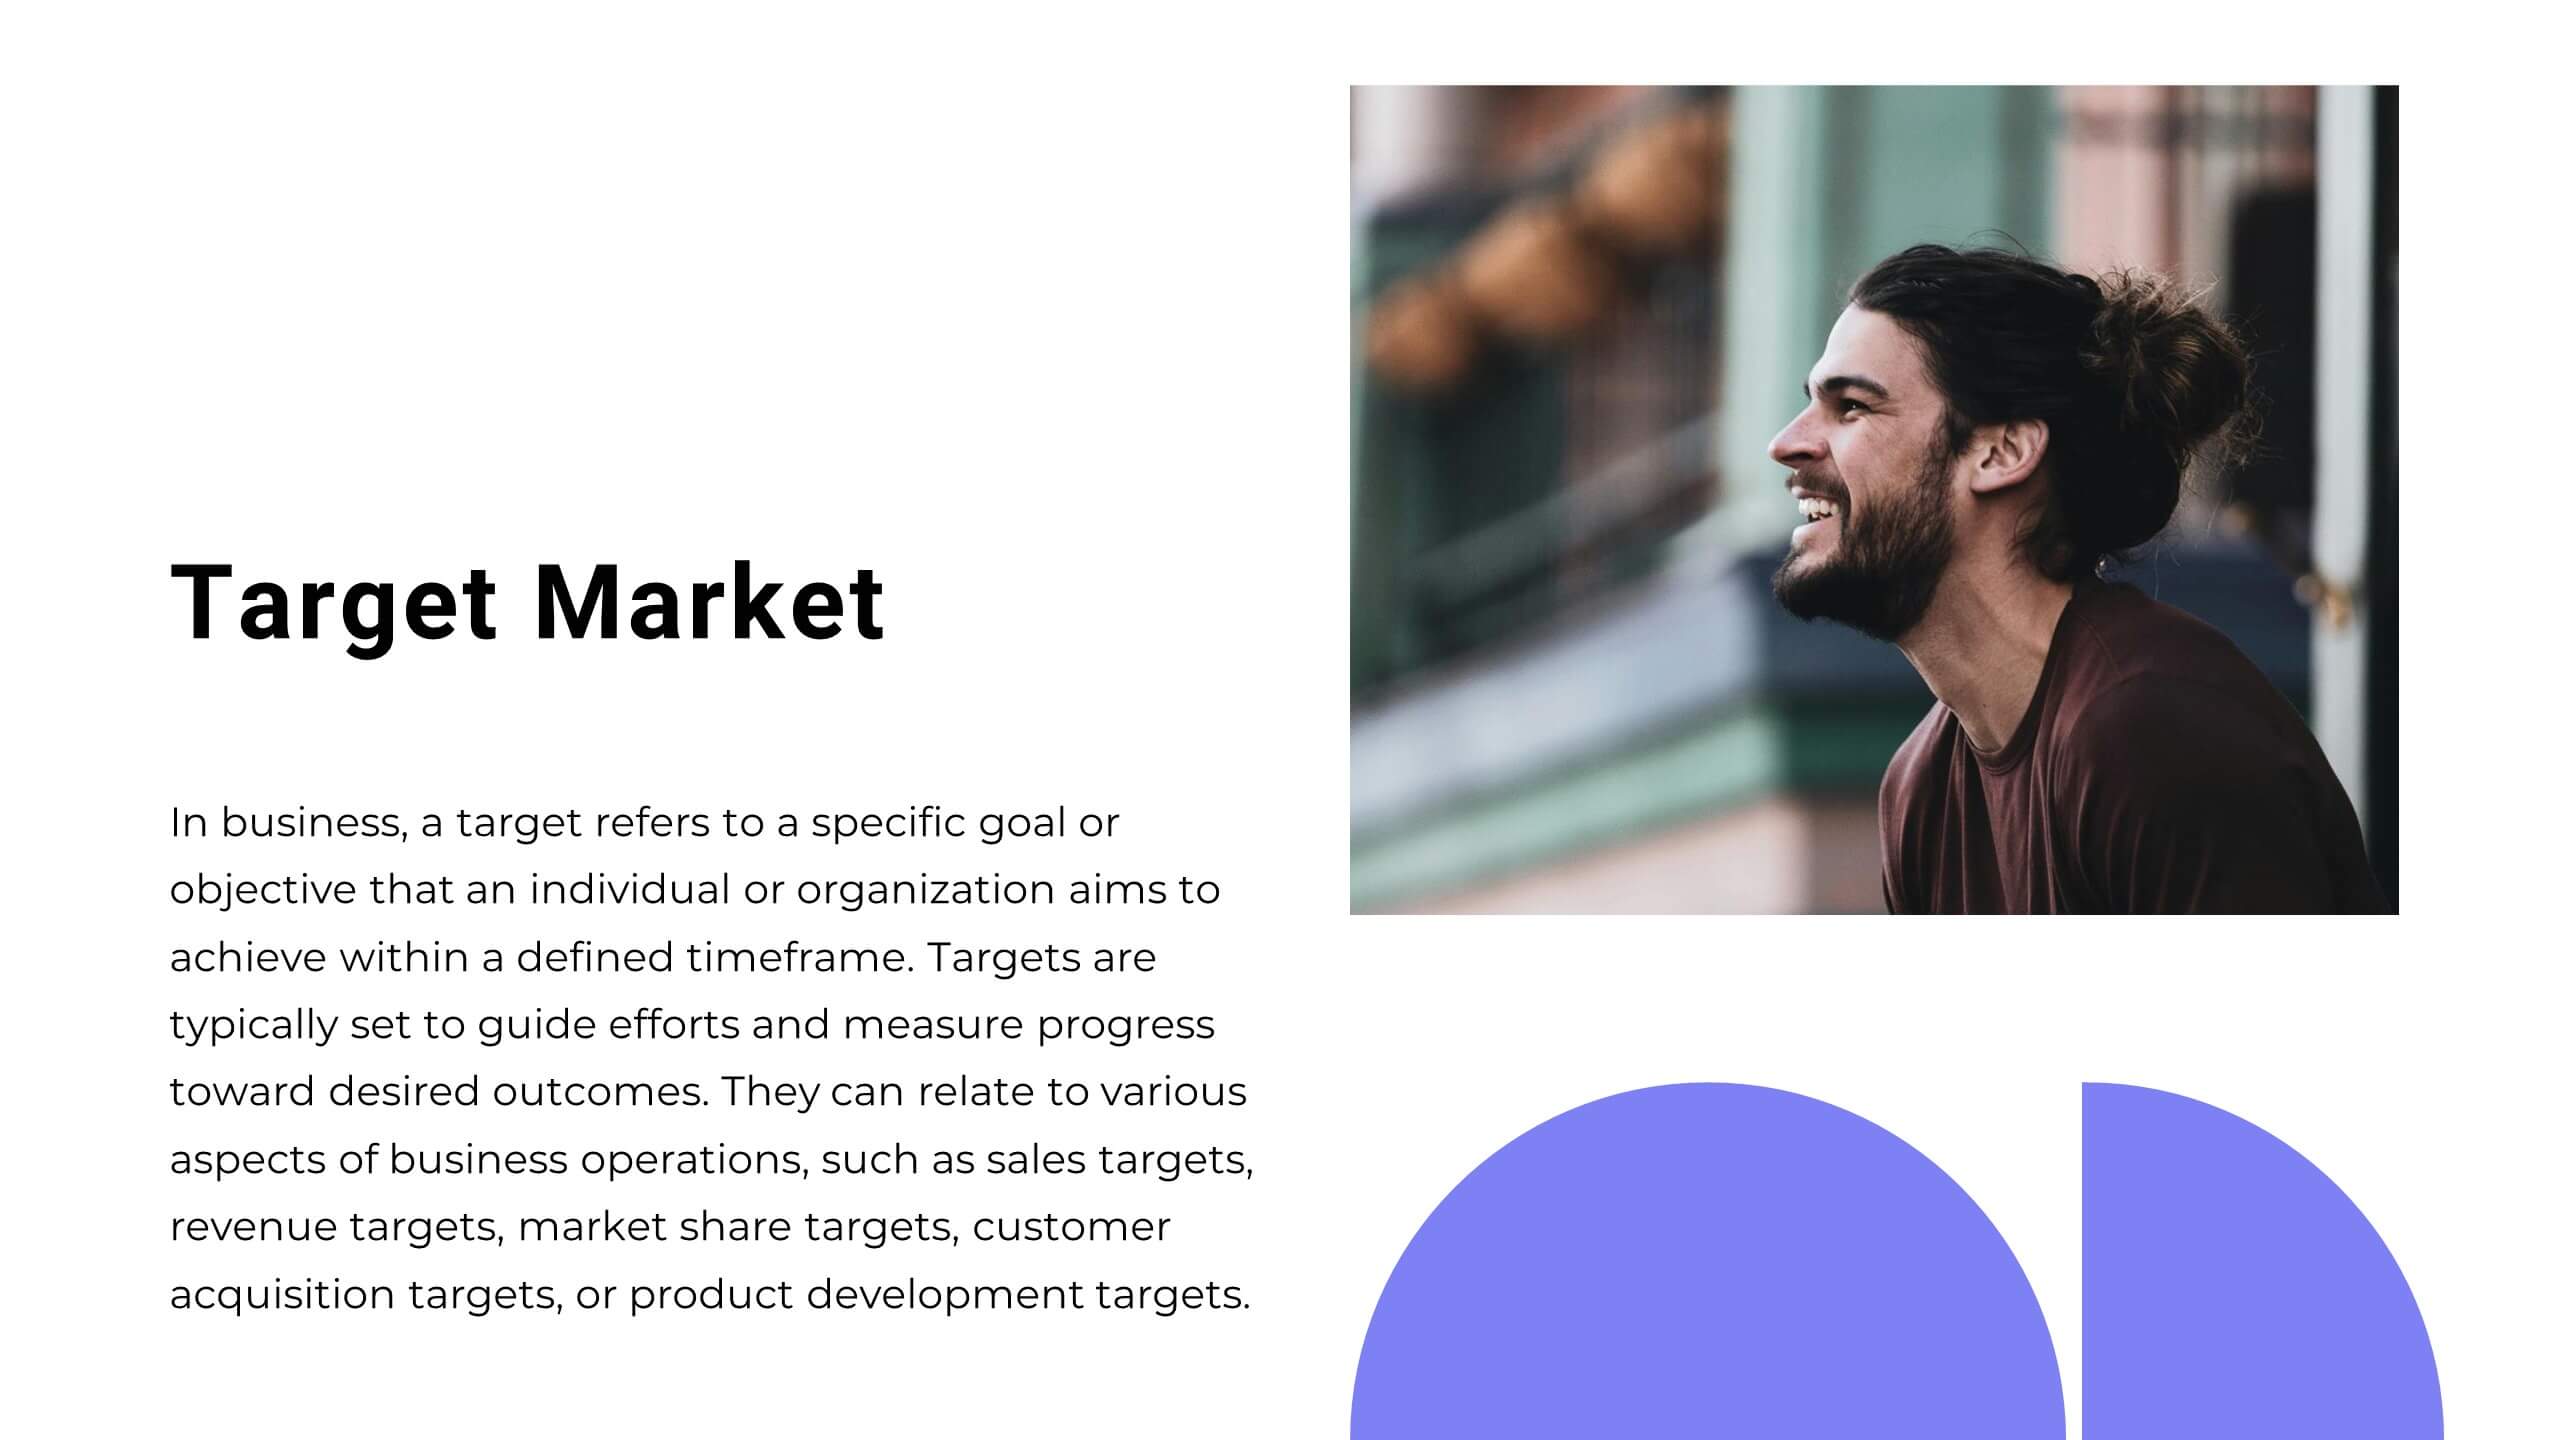
Vibrant Startup Pitch Deck Presentation
This dynamic and modern Startup Pitch Deck template is perfect for showcasing your startup's vision, strategy, and growth potential. Featuring a sleek design with bold visuals, this template guides you through key sections such as mission and vision, product/service overview, target market, and financial projections. It’s tailored to help you tell a compelling story that resonates with investors and stakeholders. The template is fully customizable in PowerPoint, Keynote, or Google Slides, ensuring you can adapt it to your specific needs and create a memorable presentation that leaves a lasting impression.


12 slides
User Experience Journey Presentation
The "User Experience Journey Presentation" template offers a comprehensive visualization of the stages involved in user interaction with a product or service. This infographic template maps out each phase of the user experience journey, depicted in a sequence of steps marked from A to F, each stage highlighted with unique icons and a gradient color scheme enhancing visual appeal and understanding. Suitable for UX professionals, marketers, and product developers, this template aids in illustrating the process from initial contact to post-use evaluation, emphasizing key points at each stage. It is an invaluable tool for presentations aimed at enhancing customer satisfaction and optimizing user interaction strategies.


5 slides
Types of Natural Disasters Infographics
Immerse in the dynamic realm of nature with our types of natural disasters infographics. Utilizing an earthy color scheme of blue, tan, and red, this template plunges viewers into the heart of environmental extremities. It's an invaluable resource for educators, students, and environmentalists. Compatible with Powerpoint, Keynote, and Google Slides. The design, brimming with creative vigor, incorporates striking graphics and icons, offering a vivid exploration of the various forces that shape our planet. This compilation doesn't just inform but captivates, turning statistics and data into compelling storytelling.


7 slides
Solutions to Problems Infographic
These slides are designed to outline and explore solutions to identified problems in a clear and effective manner. Each slide uses a clean layout with a consistent color theme that enhances readability and focus. They effectively combine text and graphical elements to showcase problem-solving strategies, making the slides ideal for business presentations or strategic meetings. The inclusion of icons and diagrams aids in visualizing the problem-solving process, and the structured design ensures that the information is presented in a logical sequence. This approach not only aids in communicating the solutions effectively but also engages the audience by making complex information easier to understand. These templates can be adapted for various industries and scenarios, where clear communication of problem-solving steps is crucial. They are especially useful for team discussions, stakeholder presentations, and strategic planning sessions.


5 slides
Business Influence Stakeholder Analysis
Highlight influence and interest with this layered stakeholder analysis pyramid. Designed for strategic presentations, this layout categorizes engagement levels—Pull Communications, Push Communications, Consultant, Participation, and Partnership—across a 3D stacked model. Ideal for stakeholder mapping, influence management, and communication strategy planning. Fully editable in PowerPoint, Keynote, and Google Slides.


5 slides
Annual Achievements and Highlights Presentation
Celebrate your progress with the Annual Achievements and Highlights Presentation. This timeline-style layout guides viewers along a visual path of milestones year by year. Each pin represents a key accomplishment, backed by icons and editable text for context. Perfect for end-of-year reviews or company retrospectives. Compatible with PowerPoint, Google Slides, and Canva.


4 slides
Identifying Performance Gaps
Clearly showcase the steps needed to bridge critical performance gaps with this modern template. Ideal for strategic planning, business reviews, and goal-setting sessions. Highlight each stage of growth with dynamic visuals. Fully customizable for PowerPoint, Keynote, and Google Slides.


7 slides
Aviation Management Infographic
Aviation management encompasses the effective and efficient operation of various facets within the aviation industry. This vibrant and informative infographic is designed to take you through the skies of efficient aviation operations and successful management strategies. Compatible with Powerpoint, Keynote, and Google Slides. This template involves planning, organizing, directing, and coordinating the activities of airlines, airports, and other organizations related to aviation and aerospace. The featured jet visuals symbolizes the aviation industry's movement and efficiency, setting the tone for the informative adventure.


8 slides
Achievements and Goals Milestone
Illustrate your team's journey with this visually engaging milestone roadmap. Featuring a step-by-step block design with space for five key accomplishments, it's perfect for goal tracking, progress reviews, or roadmap presentations. Fully editable in PowerPoint, Keynote, and Google Slides.


7 slides
Modern Education Infographic
Immerse yourself in the evolving world of learning with our Modern Education Infographic. With a crisp white canvas, the design incorporates an energizing mix of orange, the trust-building hue of blue, and a dash of passionate red. This template boasts modern infographics, bespoke icons, and versatile image placeholders, offering a visual guide to contemporary educational methods, tools, and trends. Precision-made for Powerpoint, Keynote, or Google Slides. Ideal for educators, curriculum developers, edtech startups, or any professional keen on showcasing the transformation in learning techniques.


5 slides
Scalability Metrics for Business Growth Presentation
Visualize business growth stages with this tiered pyramid-style slide. Each layer highlights key performance metrics with editable percentage labels, perfect for scaling strategies or KPI reports. Simple, structured, and impactful—ideal for business planning, team briefings, or investor updates. Fully customizable in PowerPoint, Keynote, and Google Slides for seamless editing.


5 slides
New Product Innovation Plan Presentation
Bring your ideas to market with confidence using this clear and engaging presentation. Designed to showcase every stage of product development, it helps visualize innovation steps, research insights, and launch strategies with impact. Fully editable and compatible with PowerPoint, Keynote, and Google Slides for effortless customization and professional results.


6 slides
Roadmap Milestones Infographic
Chart your project's progress with our Roadmap Milestones Infographic, optimized for Powerpoint, Google Slides, and Keynote. This infographic is expertly designed to visualize the journey of your project from conception to completion. The roadmap's layout is intuitive and user-friendly, making it simple to customize with your specific project stages, timeframes, and critical tasks. Whether you're outlining a new business initiative, or planning an event, this template helps you lay out a path to success that your team can follow. With this Roadmap infographic, you can keep stakeholders informed and your team aligned on the project's goals and progress.


6 slides
Corporate Hierarchy Structure
Visualize your organization’s leadership and team structure with this clean, modern hierarchy chart. Ideal for corporate overviews, HR planning, or team introductions in company profiles and proposals. Fully editable in PowerPoint, Keynote, and Google Slides.


6 slides
Project Timeline Infographic Presentation
Streamline your workflow with this Project Timeline Infographic template. Perfect for visualizing milestones, tracking progress, and organizing tasks, this design is fully editable to suit any project needs. Adjust colors, icons, and text effortlessly. Compatible with PowerPoint, Keynote, and Google Slides for smooth presentations and collaboration.