


Features
- 21 Unique Slides
- Fully editable and easy to edit in Microsoft Powerpoint, Keynote and Google Slides
- 16:9 widescreen layout
- Clean and professional designs
- Export to JPG, PDF or send by email


Do you have any questions?
Recommend


25 slides
Keystone Market Research Presentation
Present your market research with confidence using this stylish, contemporary template. Perfect for detailing research objectives, data collection, and key findings, it features a sleek design with vibrant colors. Highlight critical aspects like market trends, results interpretation, and recommendations to captivate your audience. Compatible with PowerPoint, Keynote, and Google Slides, it ensures seamless presentations on any platform.


20 slides
Legacy Product Launch Presentation
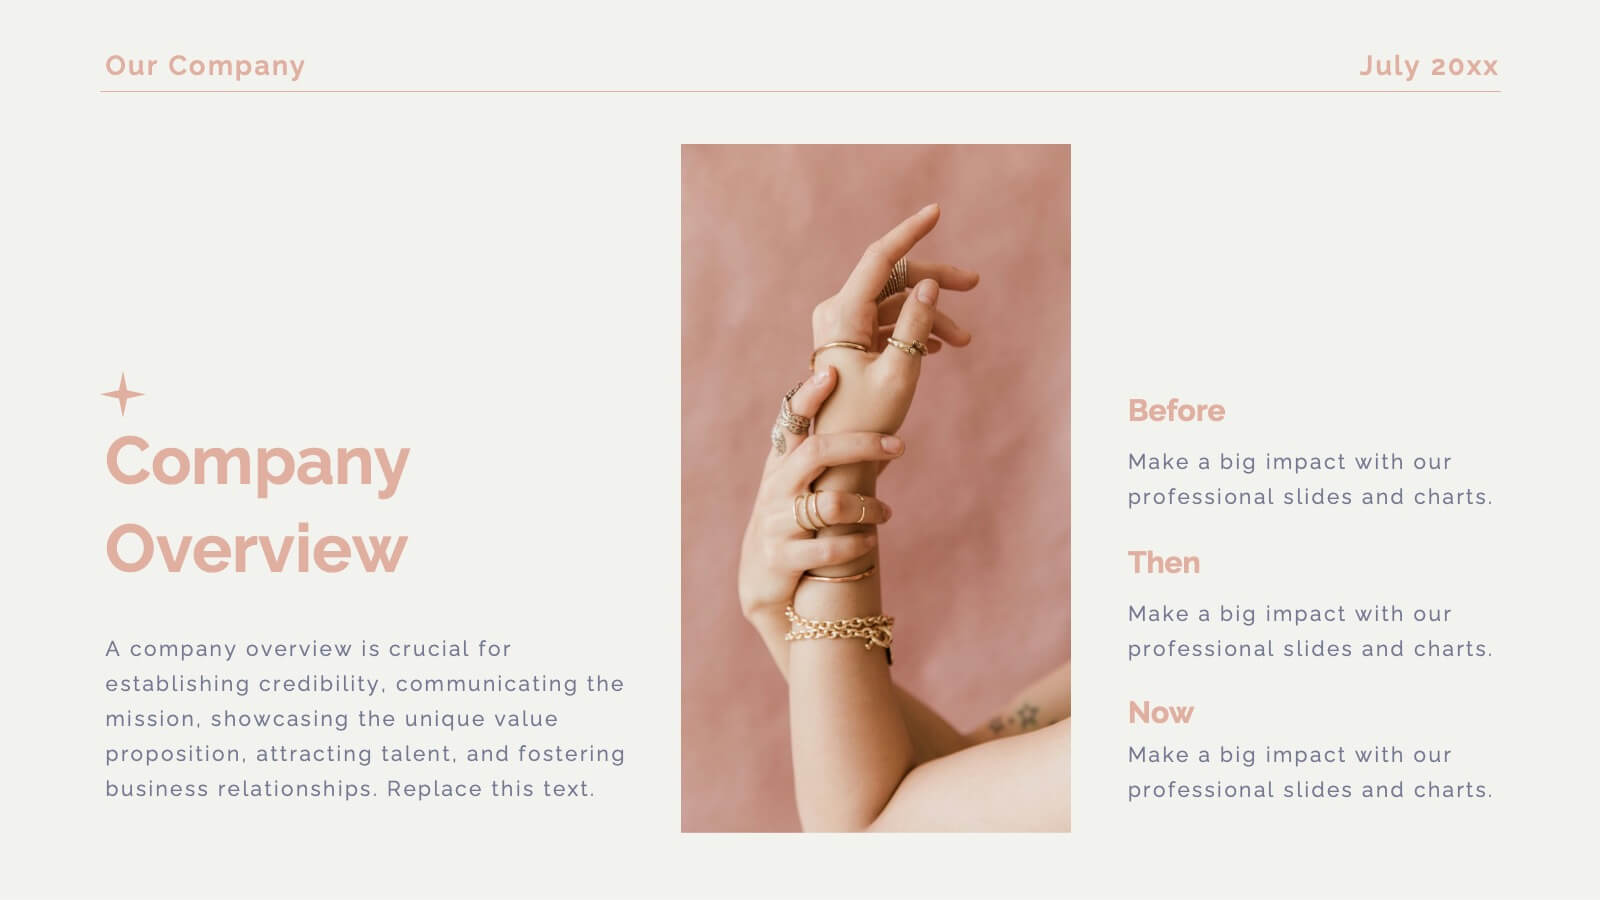
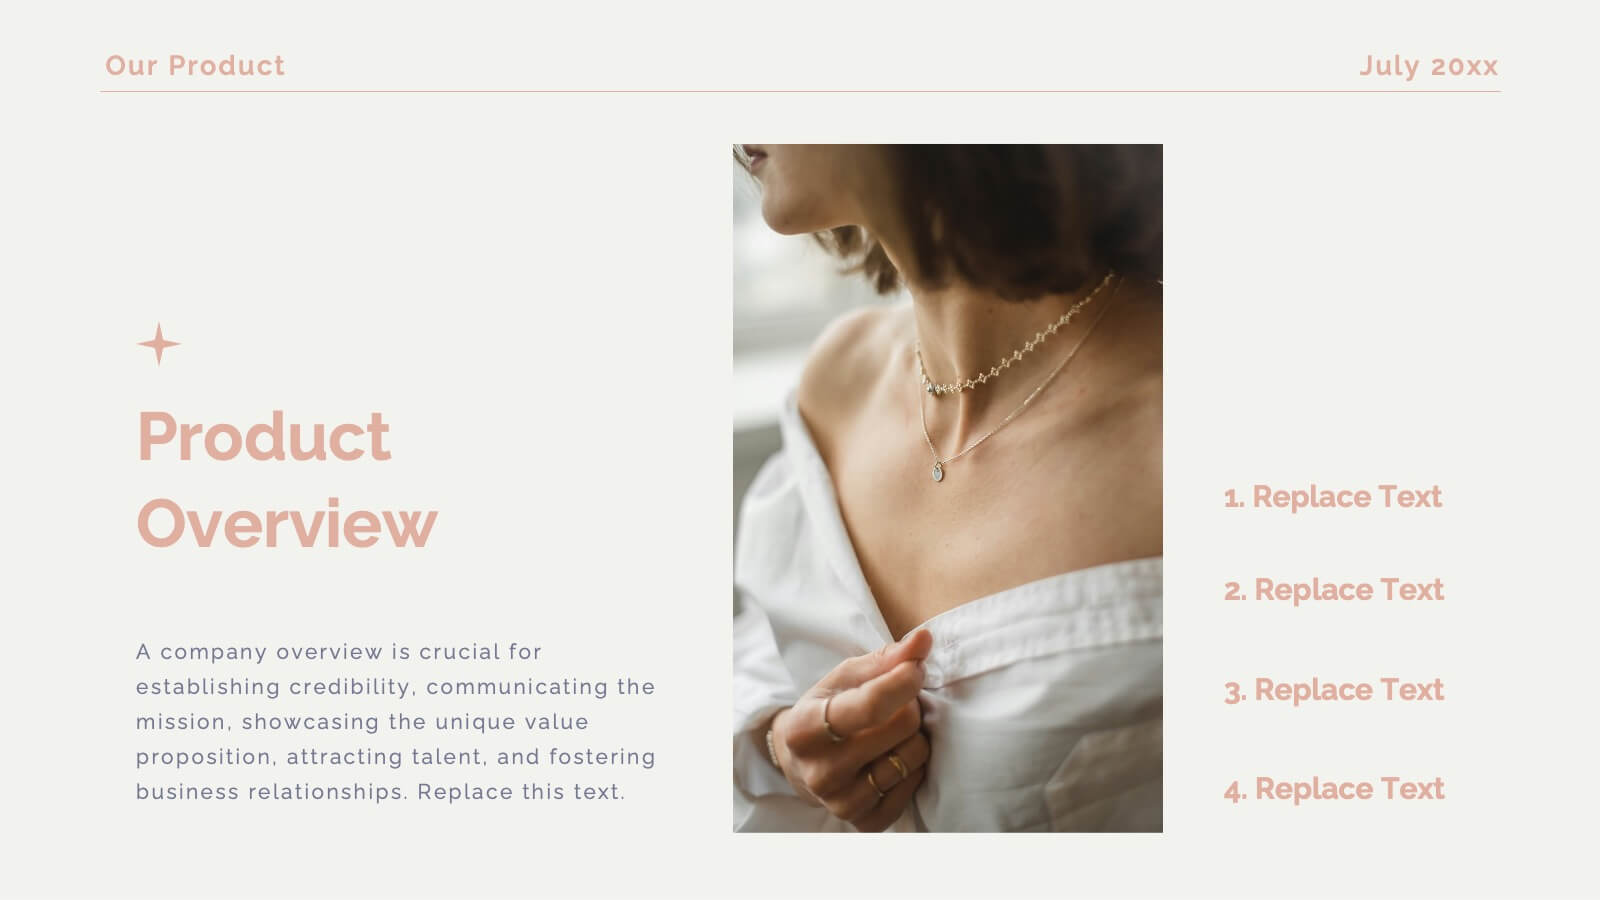
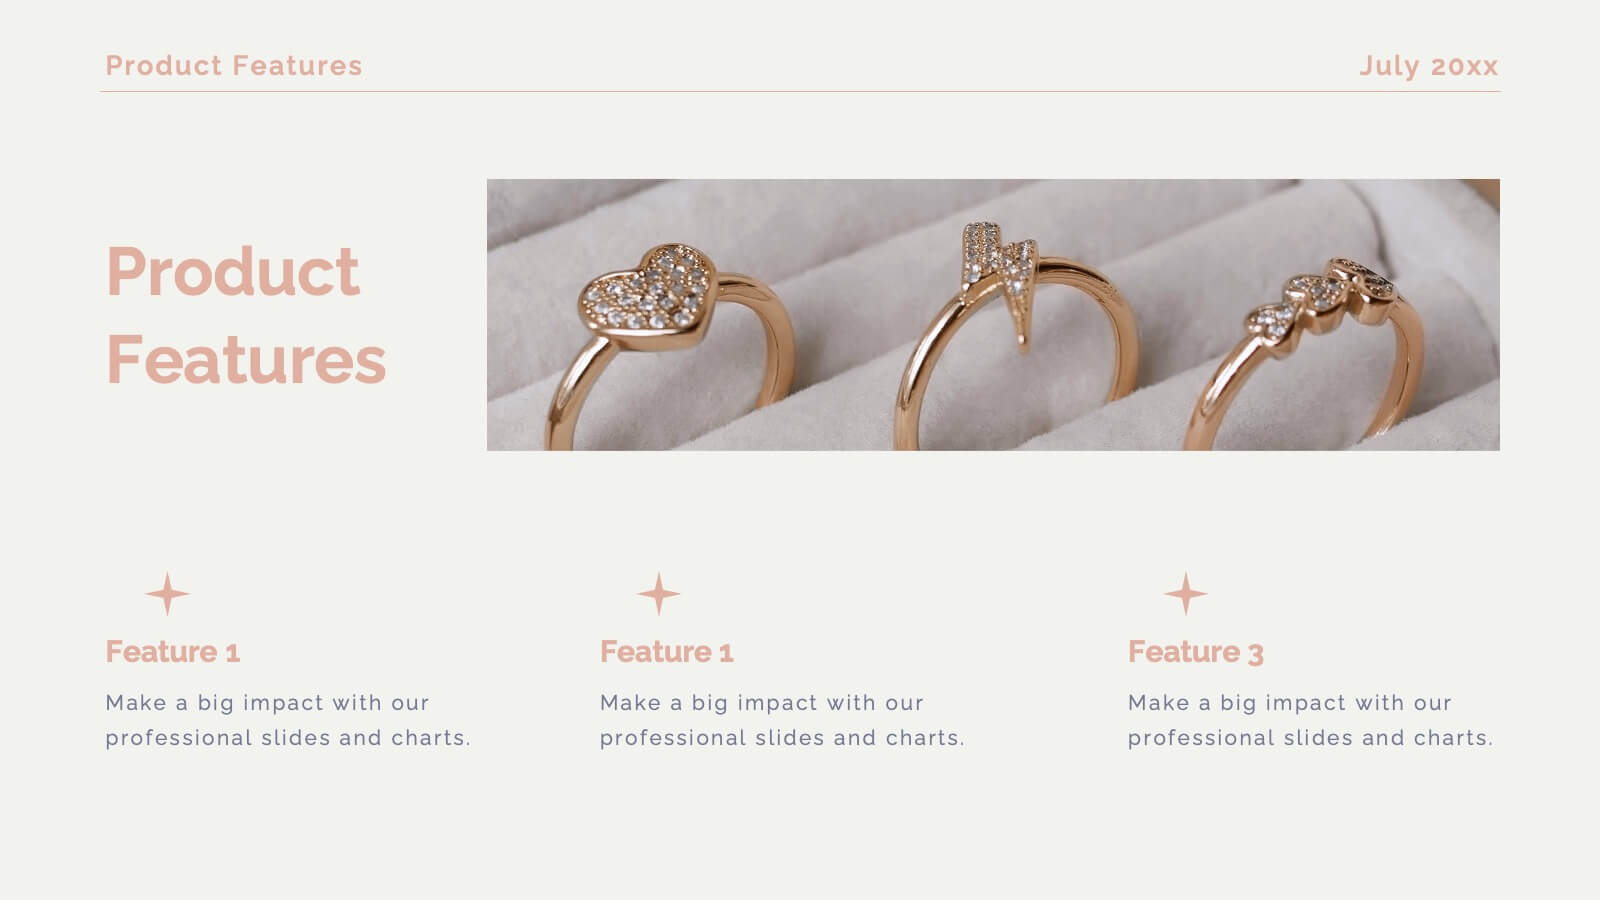
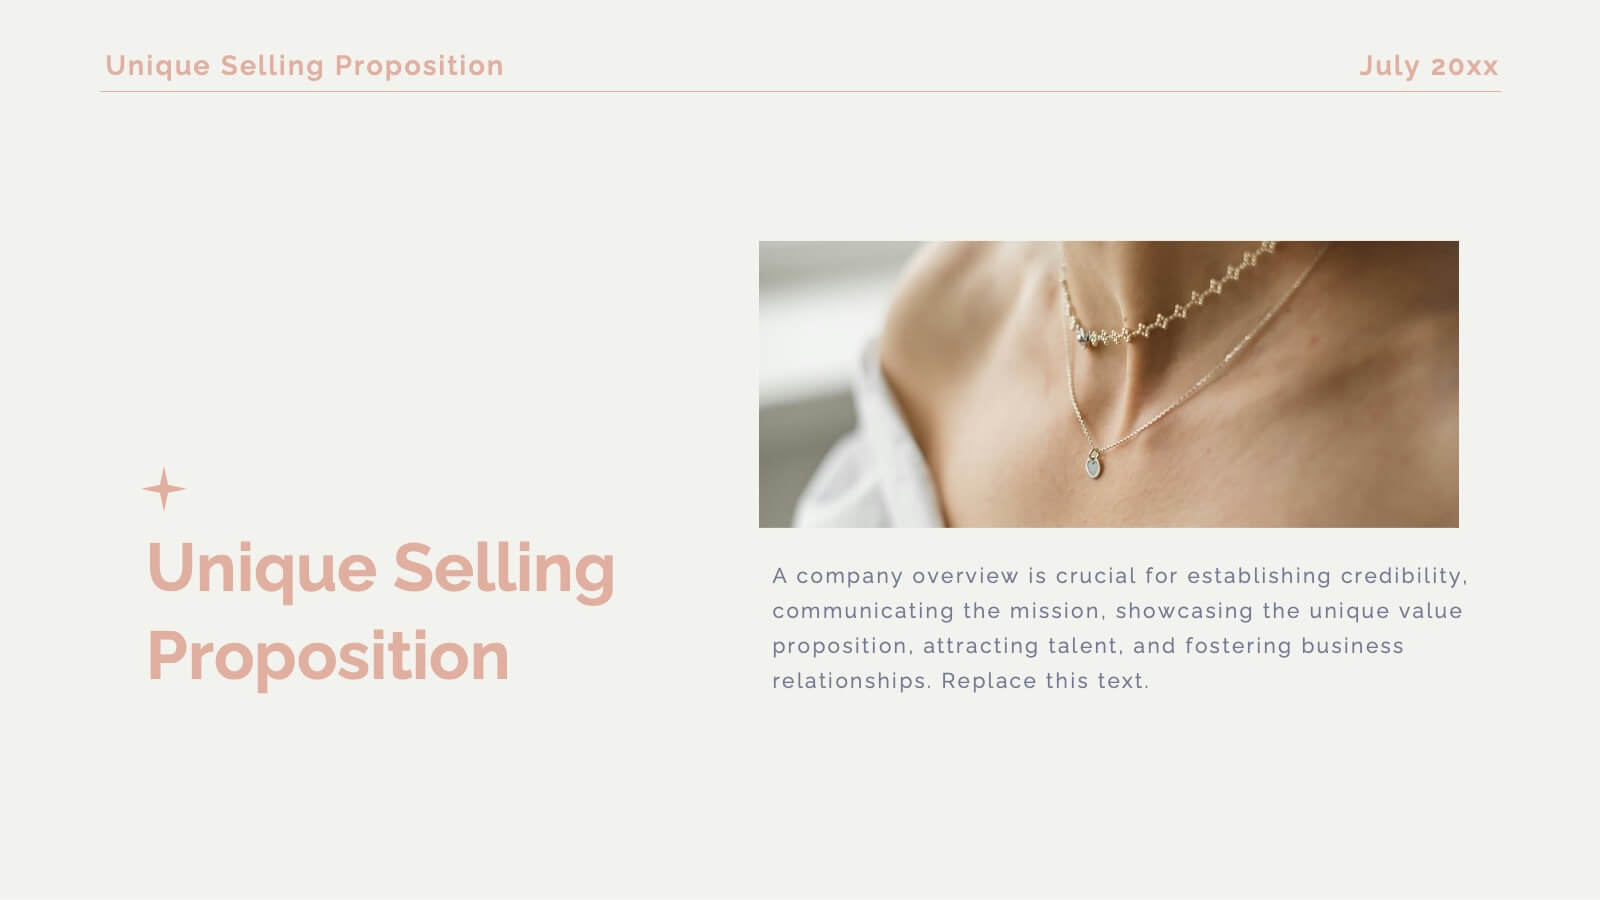
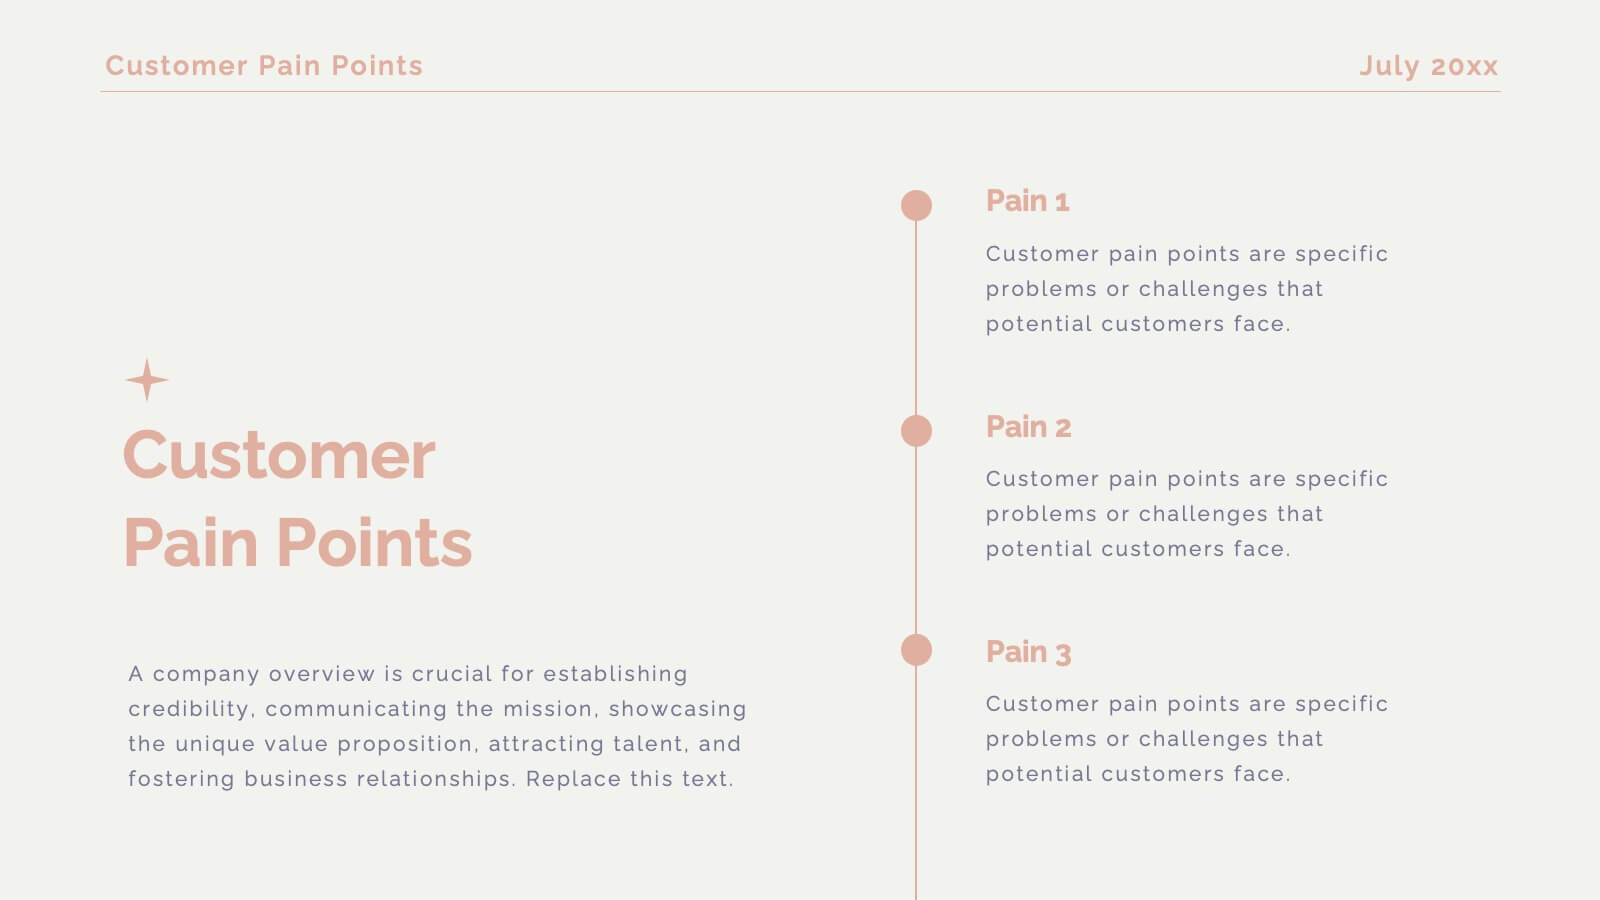
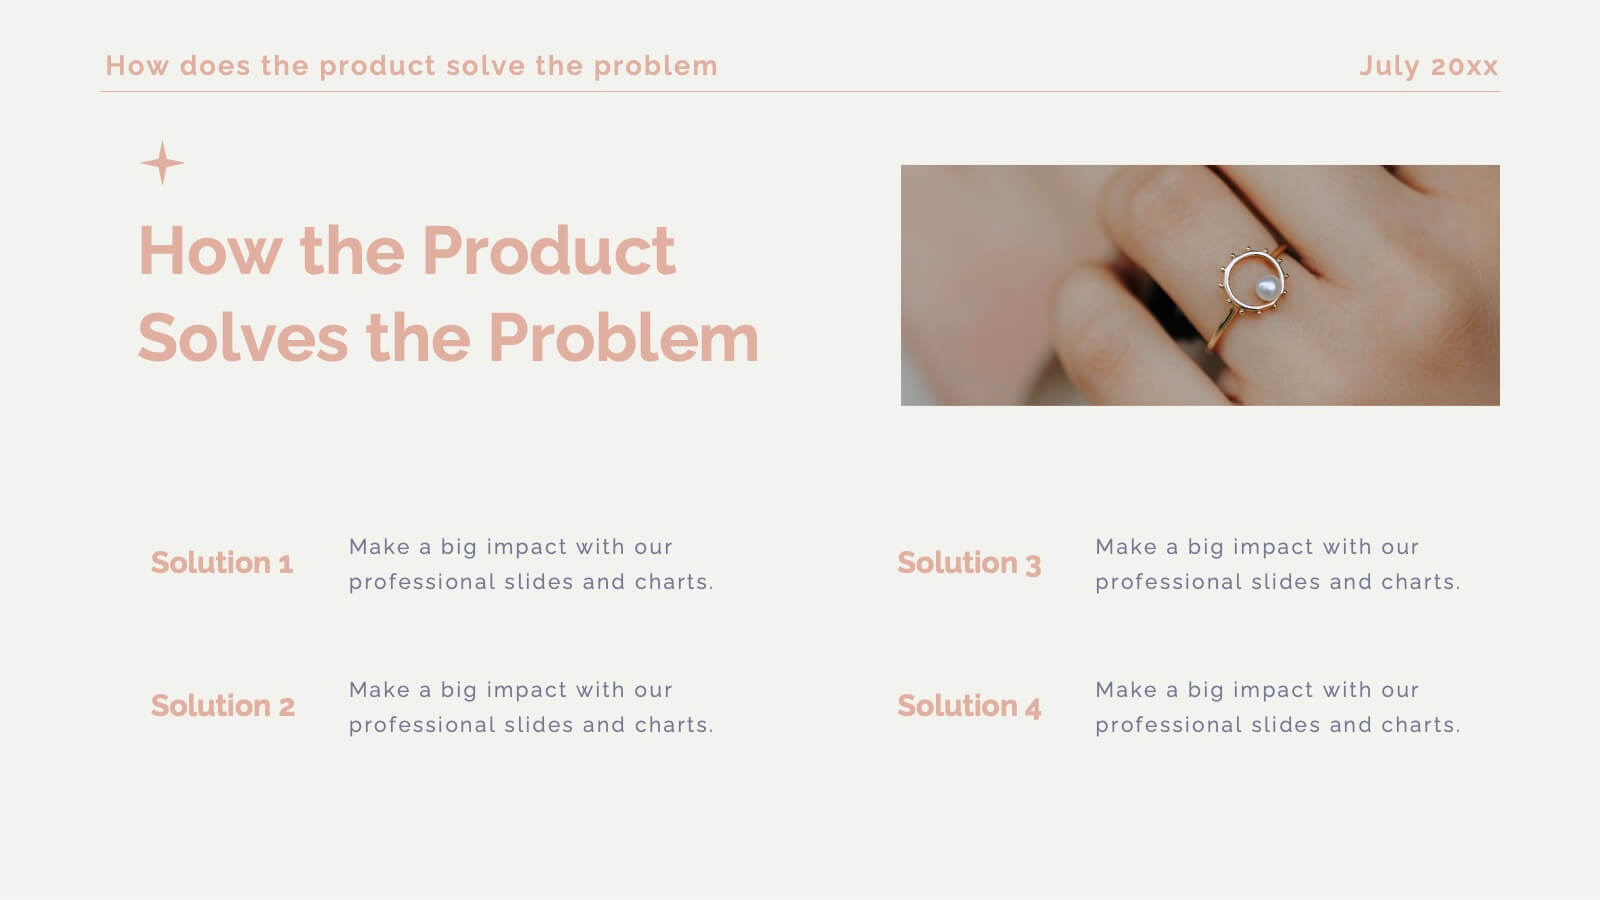
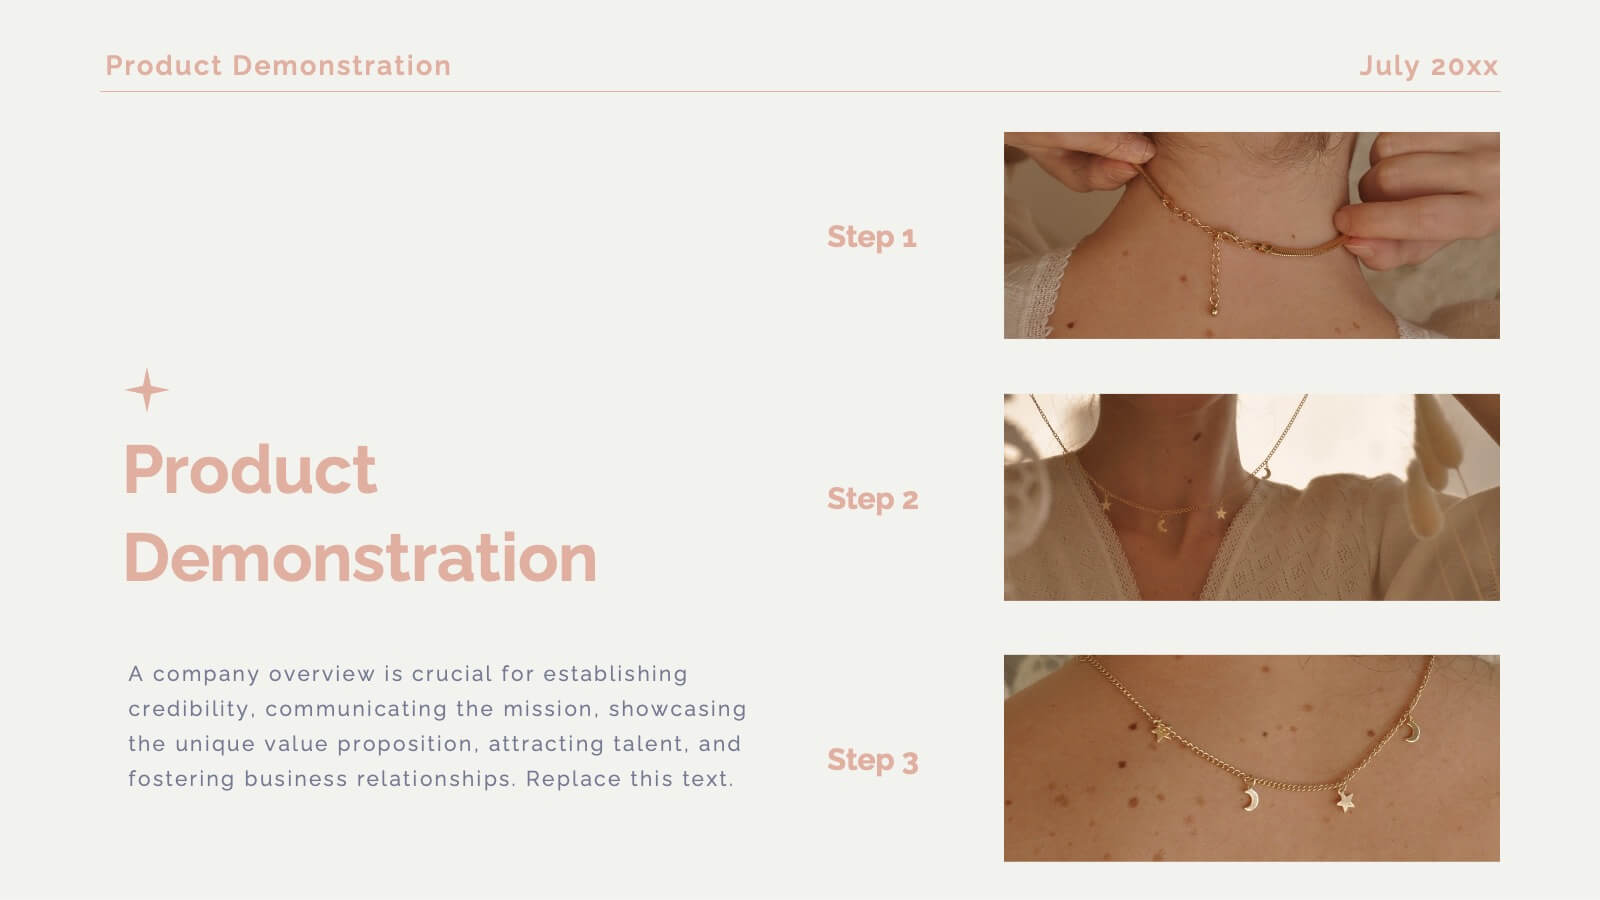
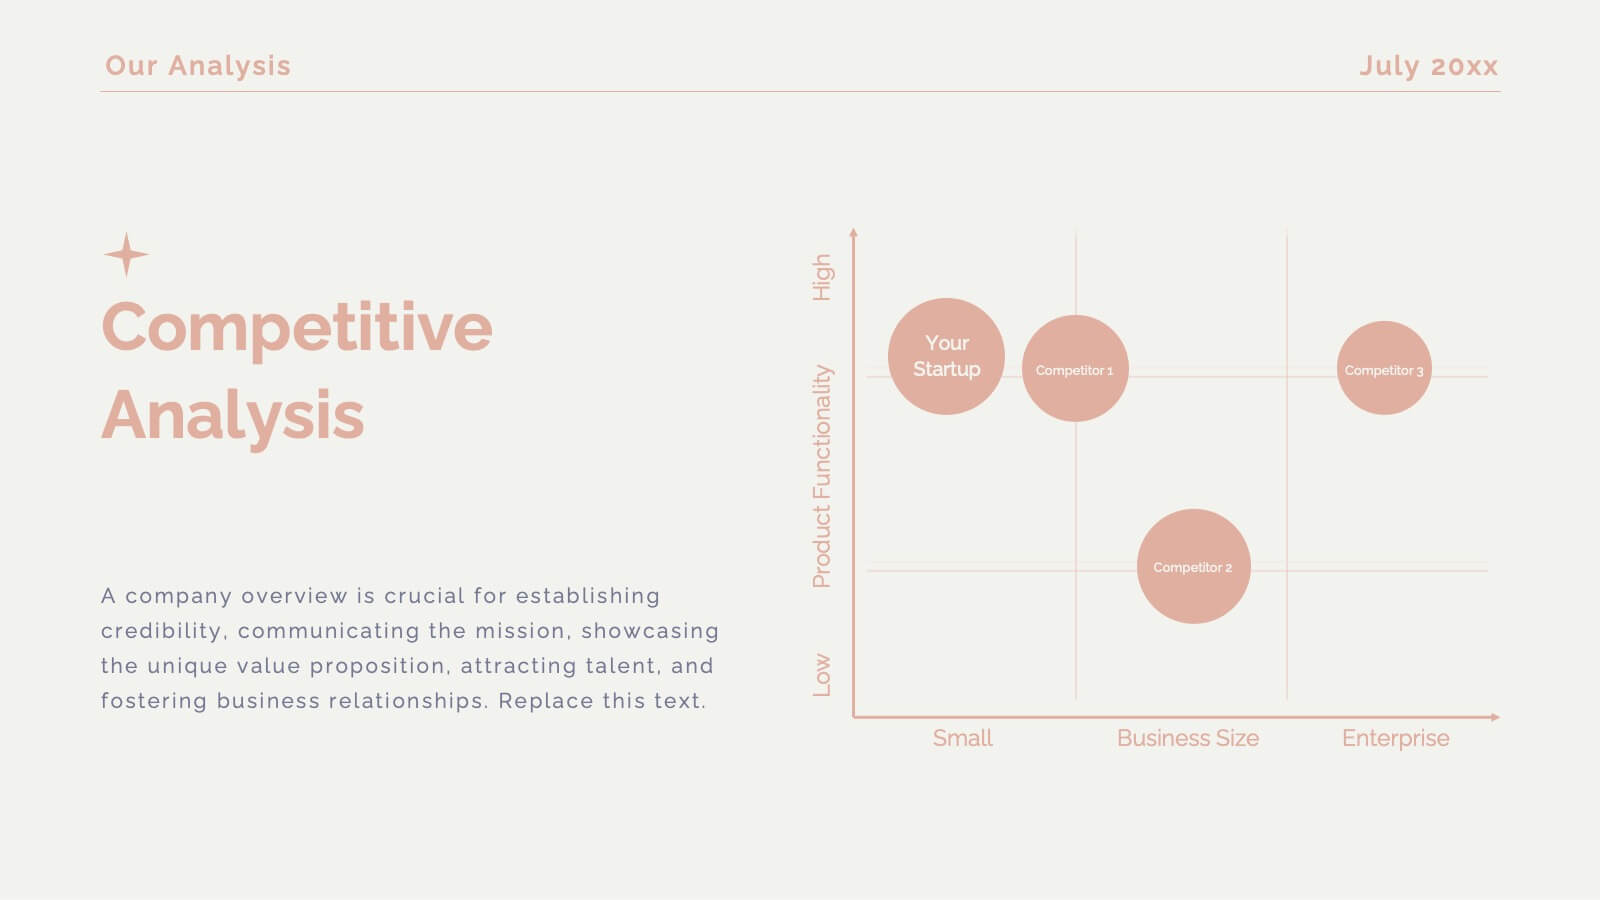
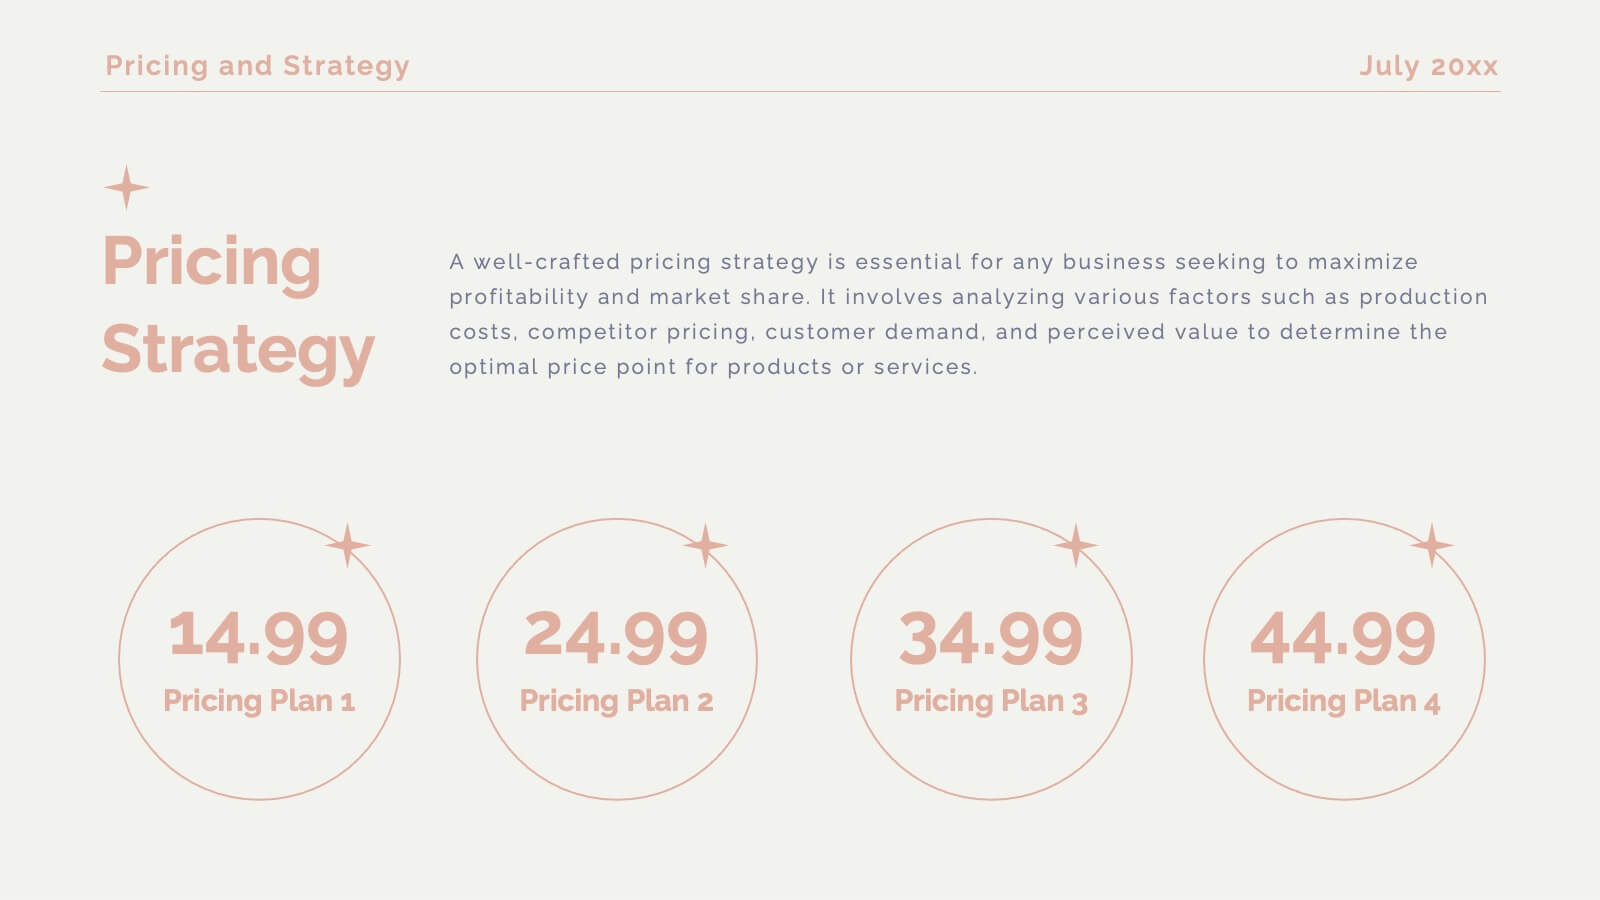
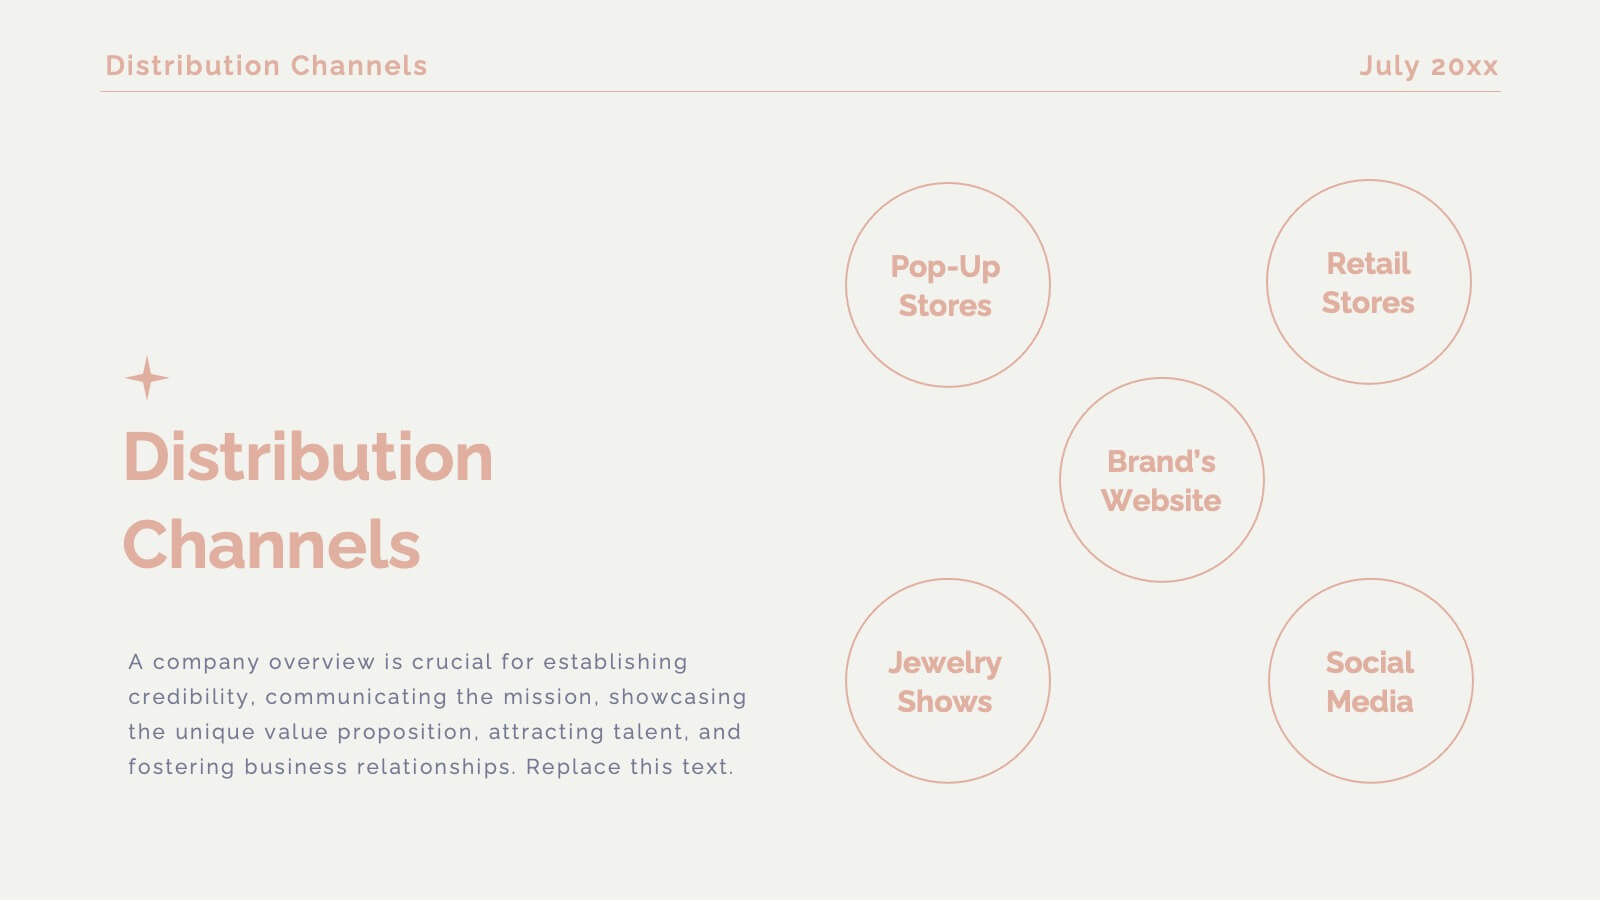
Get ready to unveil your product with a stunning and sophisticated launch template designed to captivate and convert! This template offers everything you need to present your product in the most compelling way possible, from an inviting welcome slide to an in-depth company overview that sets the stage for your brand’s story. The sleek design highlights key product features, unique selling propositions, and a thorough competitive analysis that positions your product as the market leader. With sections dedicated to customer pain points, solutions, and a powerful product demonstration, this template ensures your audience understands the value and impact of your offering. It also includes critical details like pricing strategy, distribution channels, and manufacturing processes, giving a full picture of your product’s journey from concept to market. Compatible with PowerPoint, Keynote, and Google Slides, this template is your ultimate tool for a successful product launch that leaves a lasting impression!


23 slides
Zenith Product Launch Pitch Deck Presentation
Launch your product successfully with this compelling pitch deck! Perfect for presenting company overview, problem statements, and market opportunities. Ideal for startups and entrepreneurs aiming to attract investors and stakeholders. Compatible with PowerPoint, Keynote, and Google Slides, this template ensures your pitch is clear, persuasive, and professional. Secure your product's success today!


7 slides
Team Leadership and Management Presentation
Unlock the secrets of effective team leadership and management with our detailed presentation template. Designed for training sessions and workshops, it provides clear guidance on key leadership principles and team management tactics through engaging graphics and strategic layouts. Ideal for enhancing team dynamics and leadership skills.


28 slides
Glowspire Brand Guidelines Proposal Presentation
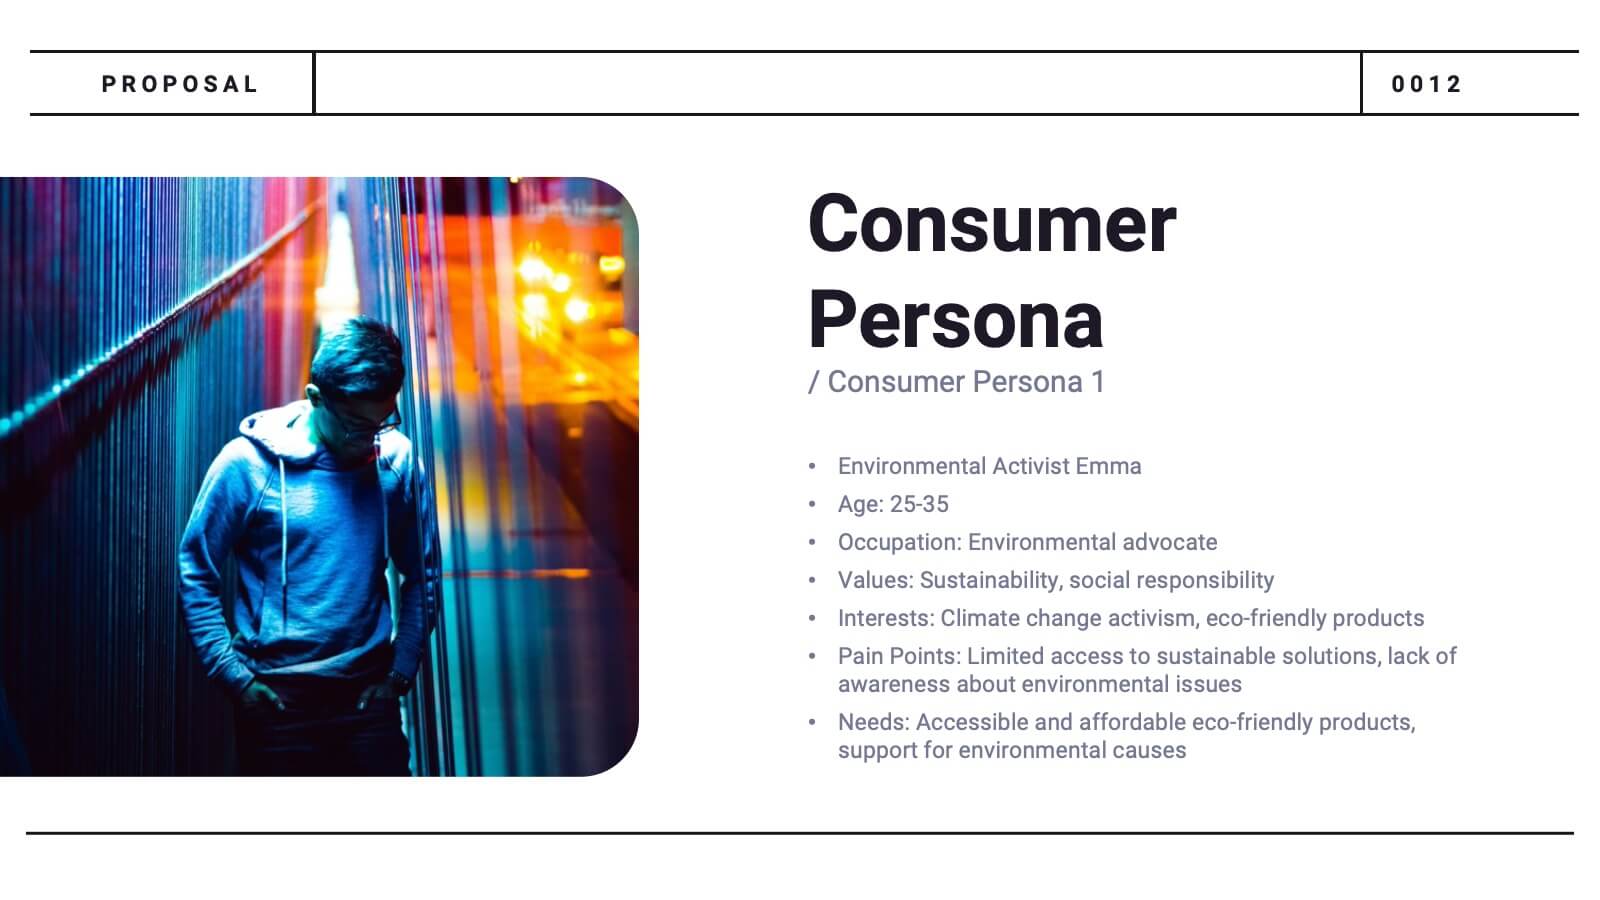
This brand identity template covers essential components: logo, imagery, color, typography, and voice & tone. It includes slides for consumer persona, market analysis, USP, brand positioning, and strategy. Ideal for establishing a cohesive brand, it highlights brand touchpoints across digital, print, packaging, and advertising mediums. Customizable for various platforms.


26 slides
Home Solar Power System Presentation
Harness the incredible power of the sun and transform your home with our vibrant and detailed presentation on home solar power systems! Discover the benefits and functionalities of solar energy, designed to help you understand how solar panels work, their environmental impact, and cost savings. Our engaging template covers essential topics like installation processes, efficiency comparisons, and maintenance tips. It includes a variety of infographics, charts, and diagrams to illustrate complex information clearly and effectively. Perfect for homeowners, energy consultants, or anyone interested in sustainable living, this template offers a visually appealing and informative guide to adopting solar power. Customize each slide to fit your needs, whether you're presenting to a small group or a large audience. Compatible with PowerPoint, Keynote, and Google Slides, this template ensures a smooth and professional presentation experience. Ideal for showcasing the future of clean energy and encouraging the switch to renewable resources.


6 slides
5-Stage Circular Cycle Presentation
Energize your workflow with a clean, circular layout that turns five interconnected steps into a clear, engaging story. This presentation helps you explain any repeating process or continuous cycle with simplicity and flow, making complex ideas easier to follow. Compatible with PowerPoint, Keynote, and Google Slides.


22 slides
Reverium Startup Funding Proposal Presentation
Secure investor interest with this thoughtfully designed startup funding proposal template. Tailored for early-stage ventures, this presentation walks your audience through your business journey, product offerings, market potential, and financial projections in a clear and captivating format. Highlight your unique value proposition, growth strategies, and competitive edge with modern, easy-to-edit slides. Present your founding story, team expertise, and detailed market analysis to build credibility and foster trust. Conclude with a compelling call to action and funding requirements to solidify your pitch. Compatible with PowerPoint, Google Slides, and Keynote, this template ensures seamless customization for any startup looking to present a polished and professional funding proposal. Perfect for pitch meetings, investor decks, and capital raising initiatives.


6 slides
Business Investment Market in Africa Map Presentation
Highlight key investment hotspots across Africa with this clean, location-based map template. Featuring labeled markers, progress bars, and editable data points, it’s ideal for showcasing project focus, regional funding, or development opportunities. Customize easily in PowerPoint, Keynote, or Google Slides to create compelling, data-driven business and finance presentations.


8 slides
Effective Leadership Strategy
Visualize leadership pillars with this bold hexagonal layout designed to showcase four key components of effective leadership. Each colored segment allows you to present core strategies like vision, communication, decision-making, and team empowerment. Perfect for business training, organizational development, or executive briefings. Fully customizable in PowerPoint, Keynote, and Google Slides.


26 slides
Tempo Brand Identity Presentation
Introduce and elevate your brand with this versatile presentation template designed to reflect your company's vision and values. Perfect for businesses looking to showcase their brand strategy, components, and touchpoints with clarity and professionalism. This presentation features thoughtfully designed slides covering brand identity components, visual guidelines, target audience insights, and future development plans. Use dedicated sections to outline your unique selling proposition, positioning, and strategy. With its clean layout and attention to detail, it's ideal for presenting a cohesive and impactful brand narrative. Compatible with PowerPoint, Google Slides, and Keynote, this template is fully customizable. Edit colors, text, and images to align with your brand aesthetics and messaging. Deliver your presentation with confidence, ensuring your audience is inspired by a polished and professional brand identity.


4 slides
Operational Flow Mapping and Control Presentation
Streamline complex processes with the Operational Flow Mapping and Control Presentation. This template uses a clear, hierarchical layout to visualize workflows, decision points, and operational branches. Ideal for SOPs, business systems, or process improvement plans. Fully editable in Canva, PowerPoint, and Google Slides to fit any project or team need.


5 slides
Western Europe Political Map Slide Presentation
Showcase political insights and regional data with a clear, modern map design that highlights countries across Western Europe. Perfect for comparing demographics, election data, or market performance, this layout combines clarity with visual impact. Fully compatible with PowerPoint, Keynote, and Google Slides for easy customization and professional presentations.


6 slides
Circular Wheel Diagram Presentation
Bring motion and balance to your ideas with this clean, circular design that connects every element in a seamless flow. Ideal for showcasing continuous processes, team dynamics, or strategic cycles, it keeps your message clear and engaging. Fully compatible with PowerPoint, Keynote, and Google Slides for easy editing.


6 slides
5-Stage Workflow Presentation
Turn complex processes into clear, visual stories with this structured step-by-step layout. Ideal for showcasing project stages, workflows, or development phases, it guides your audience through each milestone with precision and flow. Fully editable and compatible with PowerPoint, Keynote, and Google Slides for easy customization and professional results.


26 slides
Adlyn Presentation Template
Making low-calorie foods a part of your daily diet protect against the risk of heart disease, diabetes, and cancer. They make you feel full while reducing the daily calorie intake, which can help with weight loss. The Adlyn template is a concise, easy-to-use template that’s designed to help you inform your audience on the importance of low-calorie foods. This template is perfect for site builders, food bloggers, and writers looking to create informative content on food facts and healthy living. Using Adlyn you can add daily tips about nutrition and exercise along with a list of healthy foods.


5 slides
Big Data Analytics Process Presentation
Visualize your data journey with this clean and professional slide layout. Featuring four circular icons around a central cloud graphic, it’s ideal for showcasing data collection, processing, analysis, and storage. Perfect for tech briefings or analytics teams. Fully editable and compatible with PowerPoint, Keynote, and Google Slides.