


Features
- 4 Unique slides
- Fully editable and easy to edit in Microsoft Powerpoint, Keynote and Google Slides
- 16:9 widescreen layout
- Clean and professional designs
- Export to JPG, PDF or send by email


Do you have any questions?
Recommend


5 slides
2024 Financial Report Summary Presentation
Turn complex financial data into a clear visual story that’s easy to follow and engaging to present. This clean, data-focused design helps highlight yearly performance, key insights, and budget breakdowns with precision. Fully editable and compatible with PowerPoint, Keynote, and Google Slides for effortless customization and presentation delivery.


4 slides
Sales and Reach Across Asia Map Presentation
Visualize your company’s market presence with the Sales and Reach Across Asia Map Presentation. Featuring clean markers, color-coded regions, and icon-labeled highlights, this template helps you clearly showcase key sales zones, distribution channels, or growth markets across Asia. Perfect for business reviews, expansion pitches, and performance updates. Fully editable in PowerPoint, Keynote, Google Slides, and Canva.


21 slides
Eidolon Digital Strategy Presentation
Craft a forward-thinking presentation with a dynamic template designed for digital strategies. Highlight key components such as current landscape analysis, market trends, and competitive insights to provide a comprehensive overview of your strategic vision. Use the SWOT analysis and key challenges slides to identify opportunities and areas of growth. Showcase your value proposition and strategic initiatives, backed by detailed plans for resource allocation, risk management, and implementation timelines. The template also includes sections for performance metrics, communication strategies, and team roles and responsibilities, ensuring every detail is covered. With its sleek and professional design, this template is fully editable and compatible with PowerPoint, Google Slides, and Keynote, making it an ideal choice for businesses, consultants, or agencies aiming to communicate their digital strategies with precision and impact.


6 slides
Industry Analysis with Porter's Forces Presentation
The Industry Analysis with Porter's Forces Presentation offers a clean and strategic layout for visualizing competitive dynamics. This deck illustrates the five forces—Buyers, Suppliers, Competitors, Substitutions, and New Entry—in a semi-circular flow that makes relationships easy to understand. Each force is paired with editable text and icons for clarity. Ideal for market research, business strategy, or consulting work. Fully compatible with PowerPoint, Keynote, and Google Slides.


20 slides
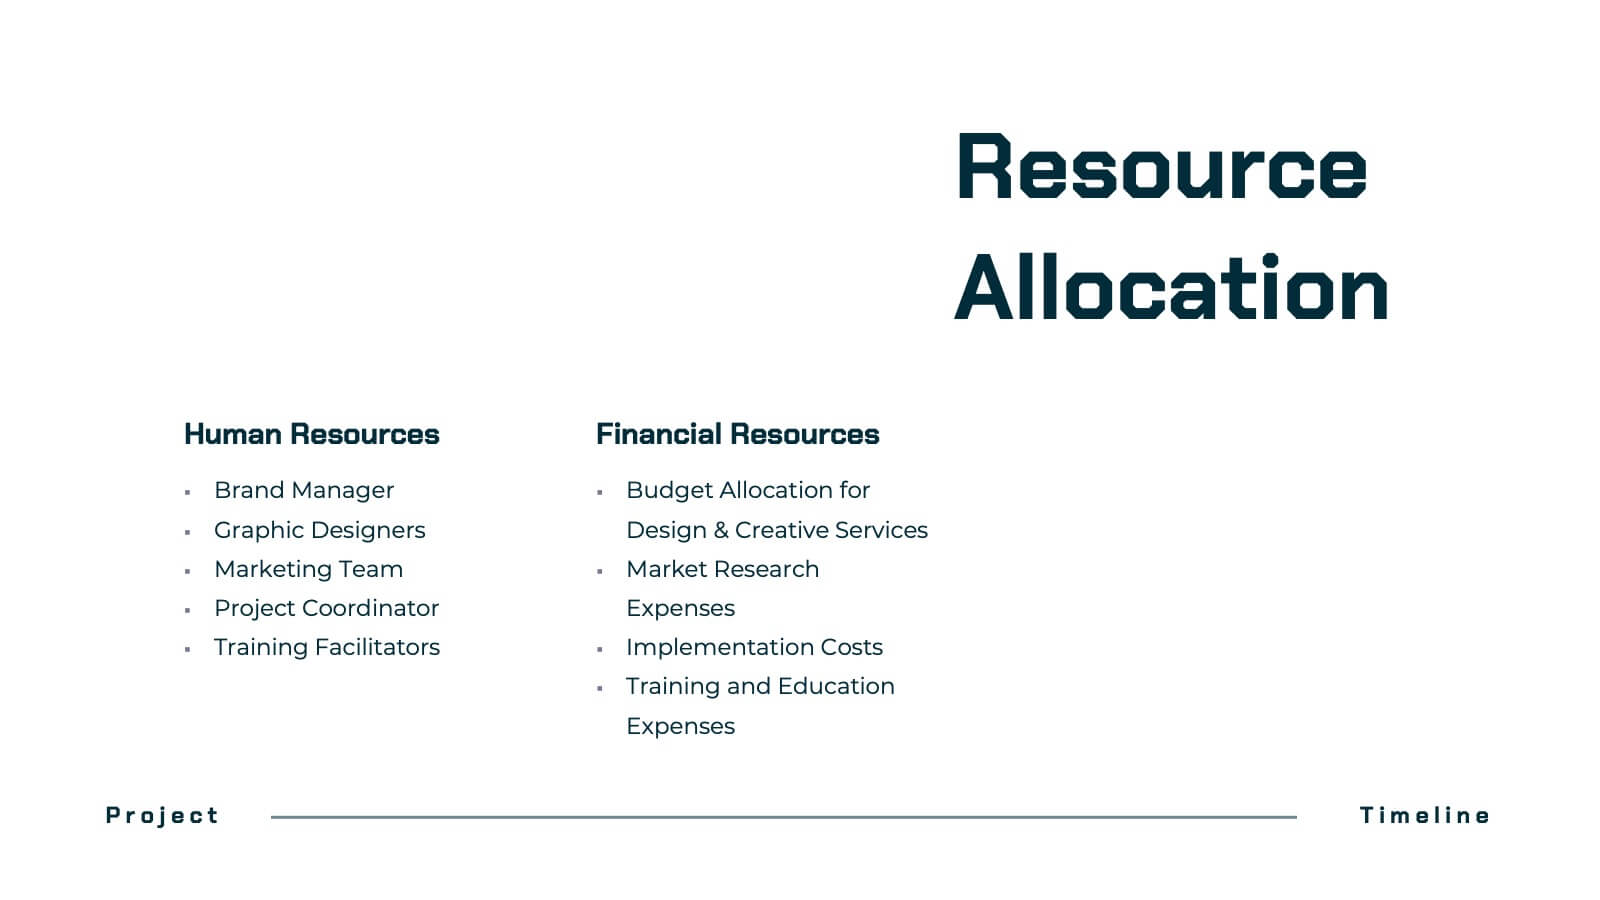
Dynastream Project Timeline Presentation
Stay on track with this detailed and well-organized project plan presentation designed for success! Covering essential areas like scope, objectives, timeline, budget breakdown, and risk management, it ensures every aspect of your project is clear and actionable. Perfect for team meetings or stakeholder updates, this template is fully compatible with PowerPoint, Keynote, and Google Slides.


6 slides
Monthly Agenda and Events Presentation
The "Monthly Agenda and Events" presentation template features a calendar format, segmented by months, for detailed planning and tracking of events. Each month is color-coded for easy reference and contains placeholders for listing specific tasks or events. This template is perfect for individuals and teams who need to organize and visualize monthly activities, providing a clear overview of upcoming commitments and timelines, ensuring that all events and tasks are completed efficiently throughout the year.


6 slides
Pillar Ideas Infographic
"Pillar ideas" usually refer to the fundamental principles, concepts, or key components that form the foundation of a particular topic, strategy, or framework. This infographic template outlines and explains the core pillars or key principles of a particular topic, concept, or strategy. These pillars are essential for understanding and implementing the core aspects of that subject. The pillars included in the infographic provide structure and a clear understanding of the foundational elements that contribute to the success and effectiveness of various endeavors. This template is compatible with Powerpoint, Keynote, and Google Slides.


4 slides
Mirror Data Distribution Butterfly Format Presentation
Present side-by-side comparisons with clarity using the Mirror Data Distribution Butterfly Format Presentation. This layout helps visualize balanced data sets, performance comparisons, or goal vs. outcome metrics with mirrored bars and intuitive icons. Fully customizable in Canva, PowerPoint, Google Slides, and Keynote to match your brand's aesthetic and message.


12 slides
Risk Management and Security Compliance Presentation
Enhance your organizational resilience with the 'Risk Management and Security Compliance' presentation template. This intuitive design helps you communicate complex compliance standards and risk mitigation strategies effectively. Ideal for training sessions, board meetings, and compliance audits, ensuring your team stays informed and proactive in managing risks.


6 slides
Corporate Company Profile Presentation
Showcase Your Business with a Professional Company Profile! The Corporate Company Profile template is designed to present your brand, values, and key highlights in a structured and visually appealing format. Featuring modern circular image placements, strategic content sections, and sleek infographics, this template is ideal for introducing your company, highlighting milestones, and communicating your business strategy. Fully editable in PowerPoint, Keynote, and Google Slides, this design ensures seamless customization for any industry.


7 slides
Data Analysis Process Infographic
Illuminate the intricacies of the data-driven world with our Data Analysis Process Infographic. Set against the crisp backdrop of white and accented with the brilliance of yellow, the growth-centric green, and the depth of blue, our template brings clarity to the complex realm of data analytics. Outfitted with sharp infographics, intuitive icons, and adaptable image placeholders, it translates raw data into actionable insights. Exquisitely crafted for Powerpoint, Keynote, or Google Slides. A crucial tool for data scientists, business analysts, strategists, or any organization looking to harness the power of data. Analyze with precision; let every slide unravel the stories data tells.


6 slides
Real Estate and Building Development Presentation
Present key insights into the real estate market with the Real Estate and Building Development template. Designed for property investors and urban planners, this visual framework highlights financial trends, project phases, and market analysis. Fully customizable and compatible with PowerPoint, Keynote, and Google Slides for seamless presentation delivery.


5 slides
Business Process Checklist Presentation
Ensure smooth workflows with the Business Process Checklist template. This visually structured layout simplifies process tracking, highlighting key steps and completion percentages. Perfect for project managers and teams looking to optimize efficiency. Fully editable and compatible with PowerPoint, Keynote, and Google Slides for easy customization and seamless presentation.


5 slides
Supply Chain Management Plan Presentation
Streamline your presentation with a sleek and organized design built to illustrate process flow and logistics. Perfect for explaining production stages, delivery systems, or business operations, this visual layout brings clarity and structure to your message. Compatible with PowerPoint, Keynote, and Google Slides for effortless customization and use.


7 slides
Watercolor Plan Infographic
A watercolor plan infographic refers to an infographic design or style that incorporates elements of watercolor painting. Dive into the world of dreams and aspirations with our watercolor plan infographic template. This artistic and visually captivating infographic guides you through your plans and goals with the fluidity and creativity of watercolors. This infographic is a visually stunning and inspiring template that transforms the process of goal setting into an artistic masterpiece, encouraging individuals to paint their dreams with vivid hues of determination and creativity.


23 slides
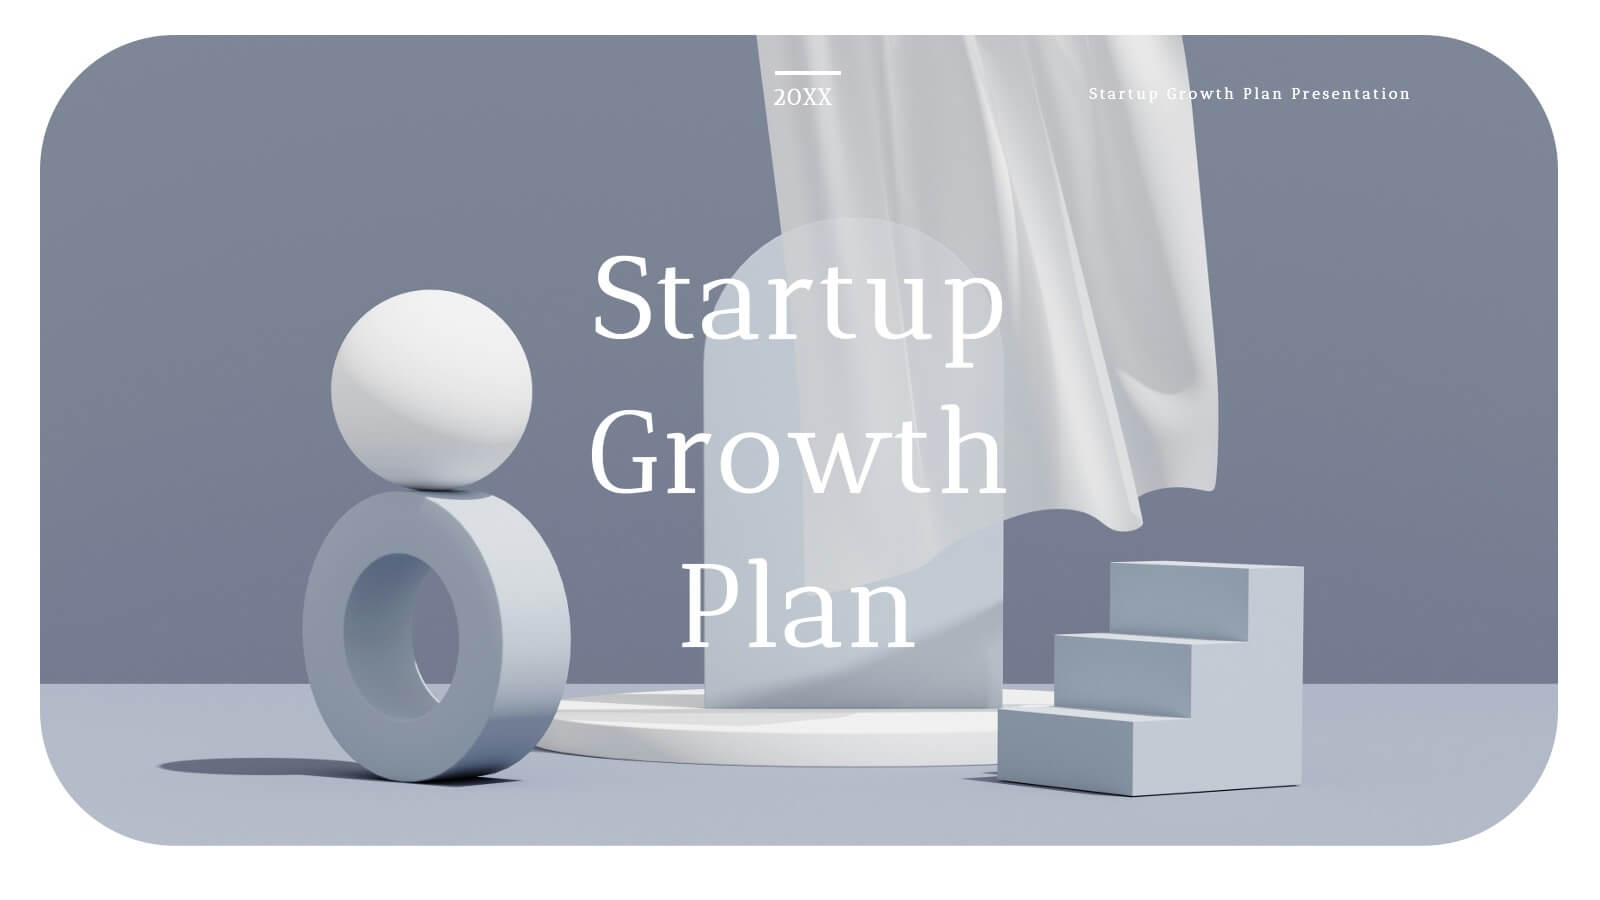
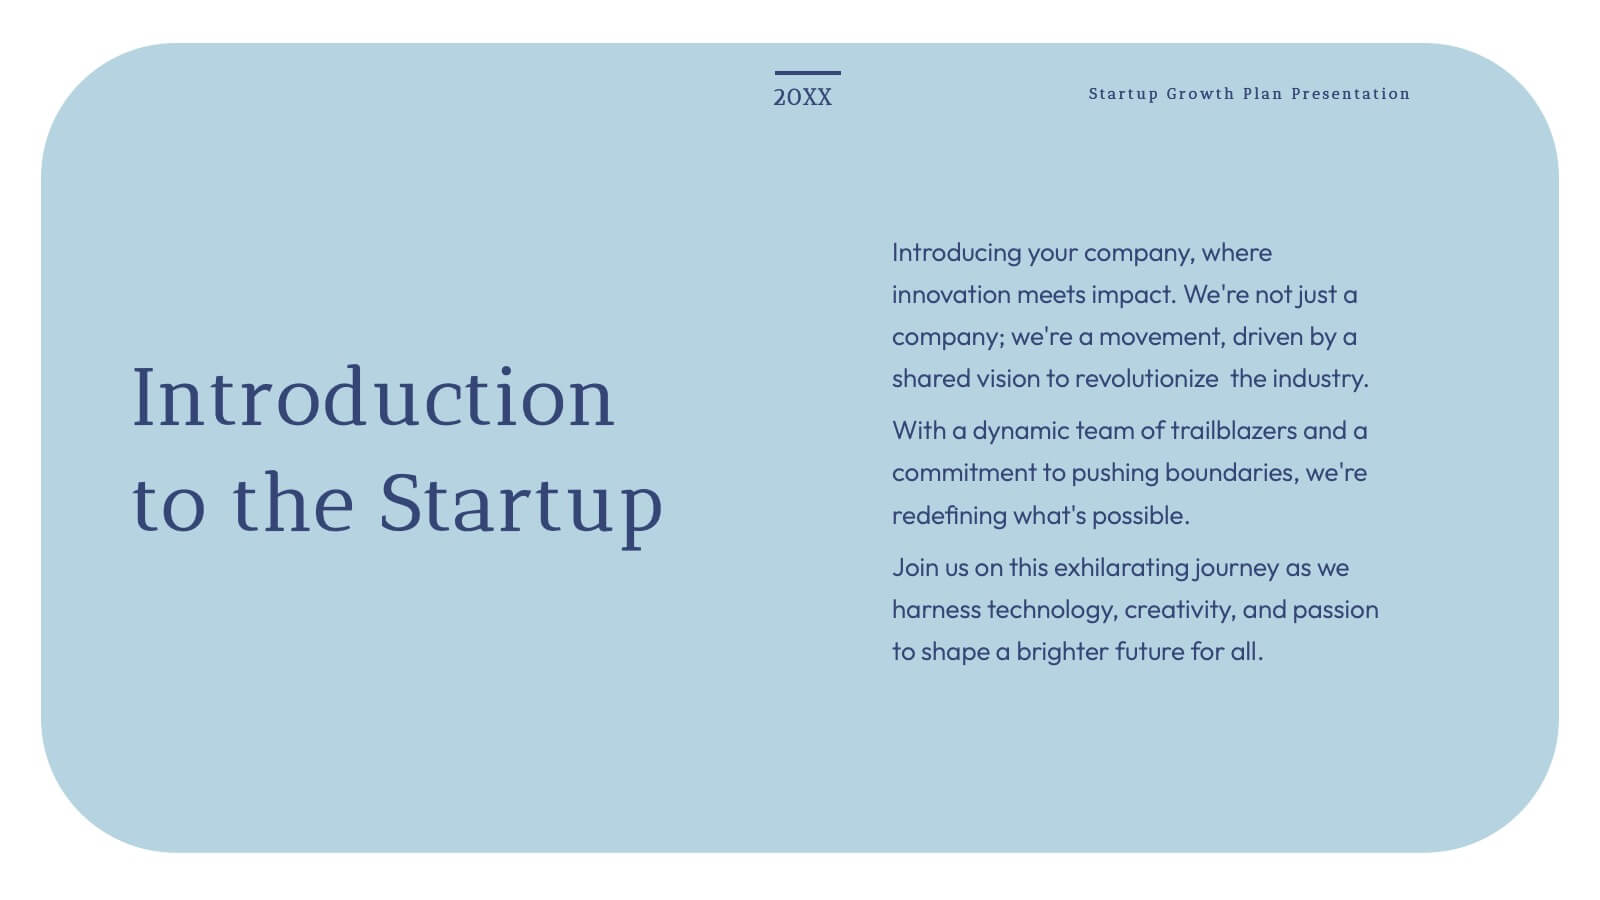
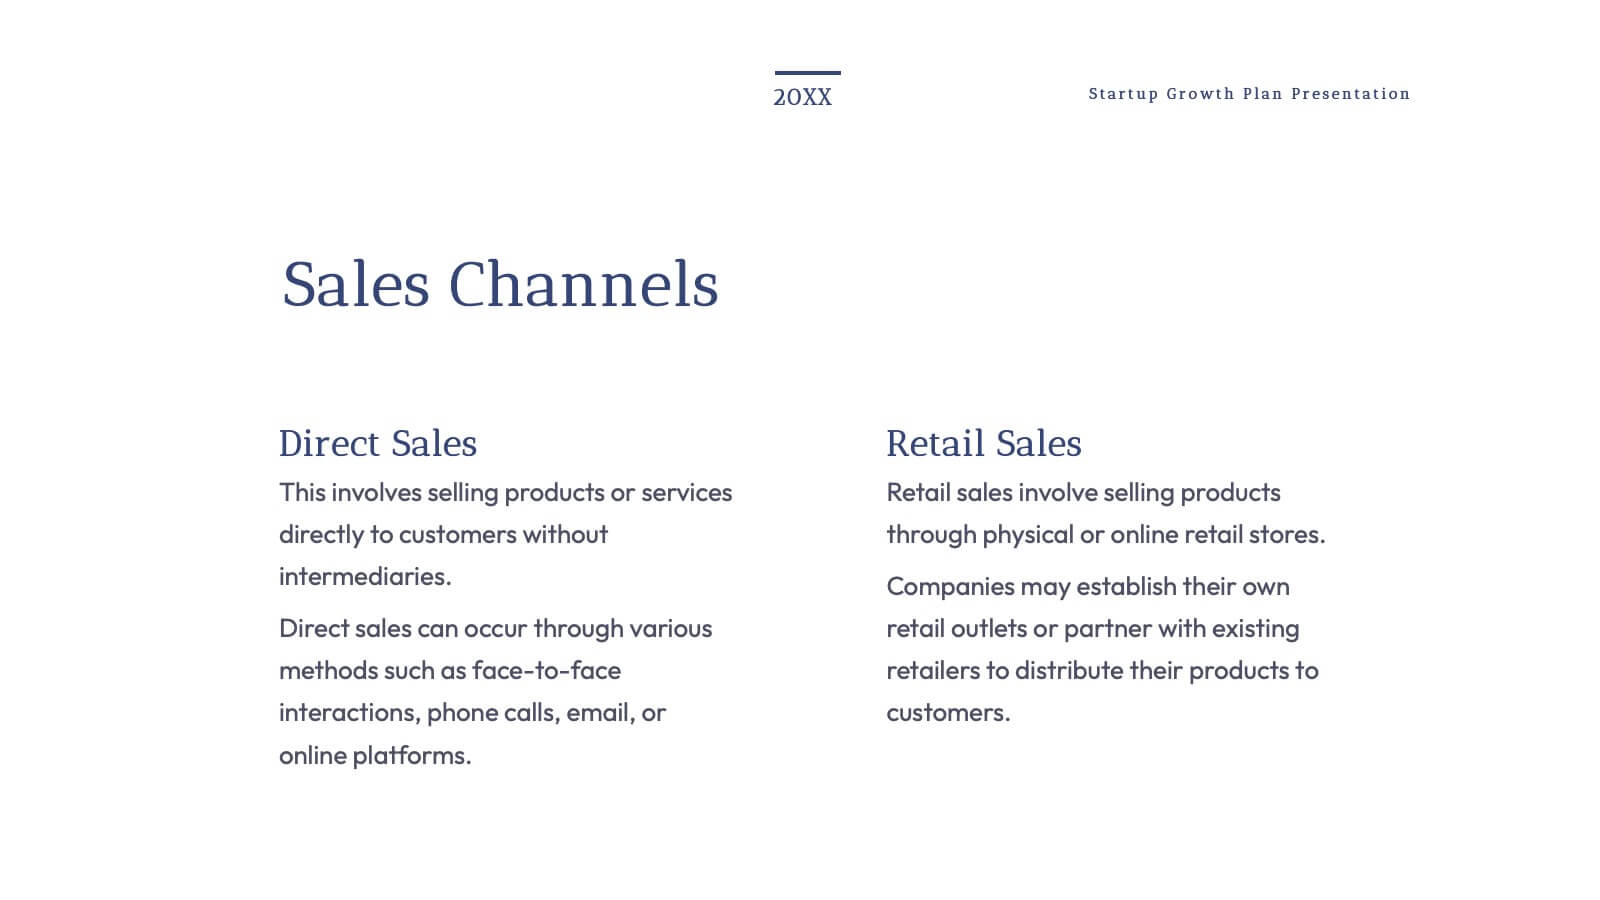
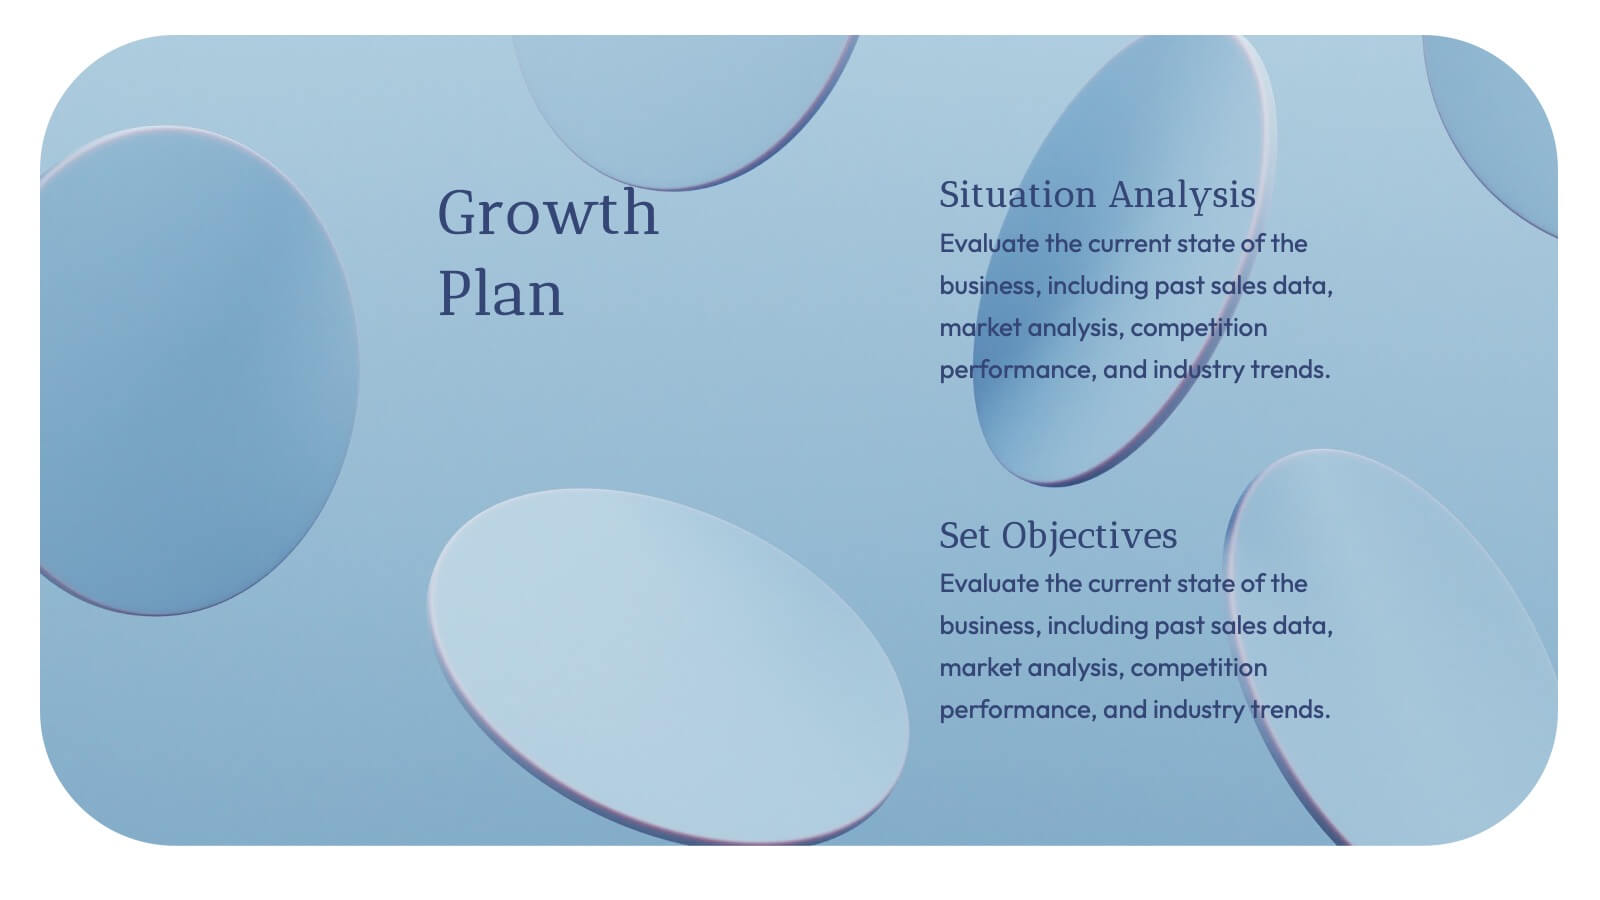
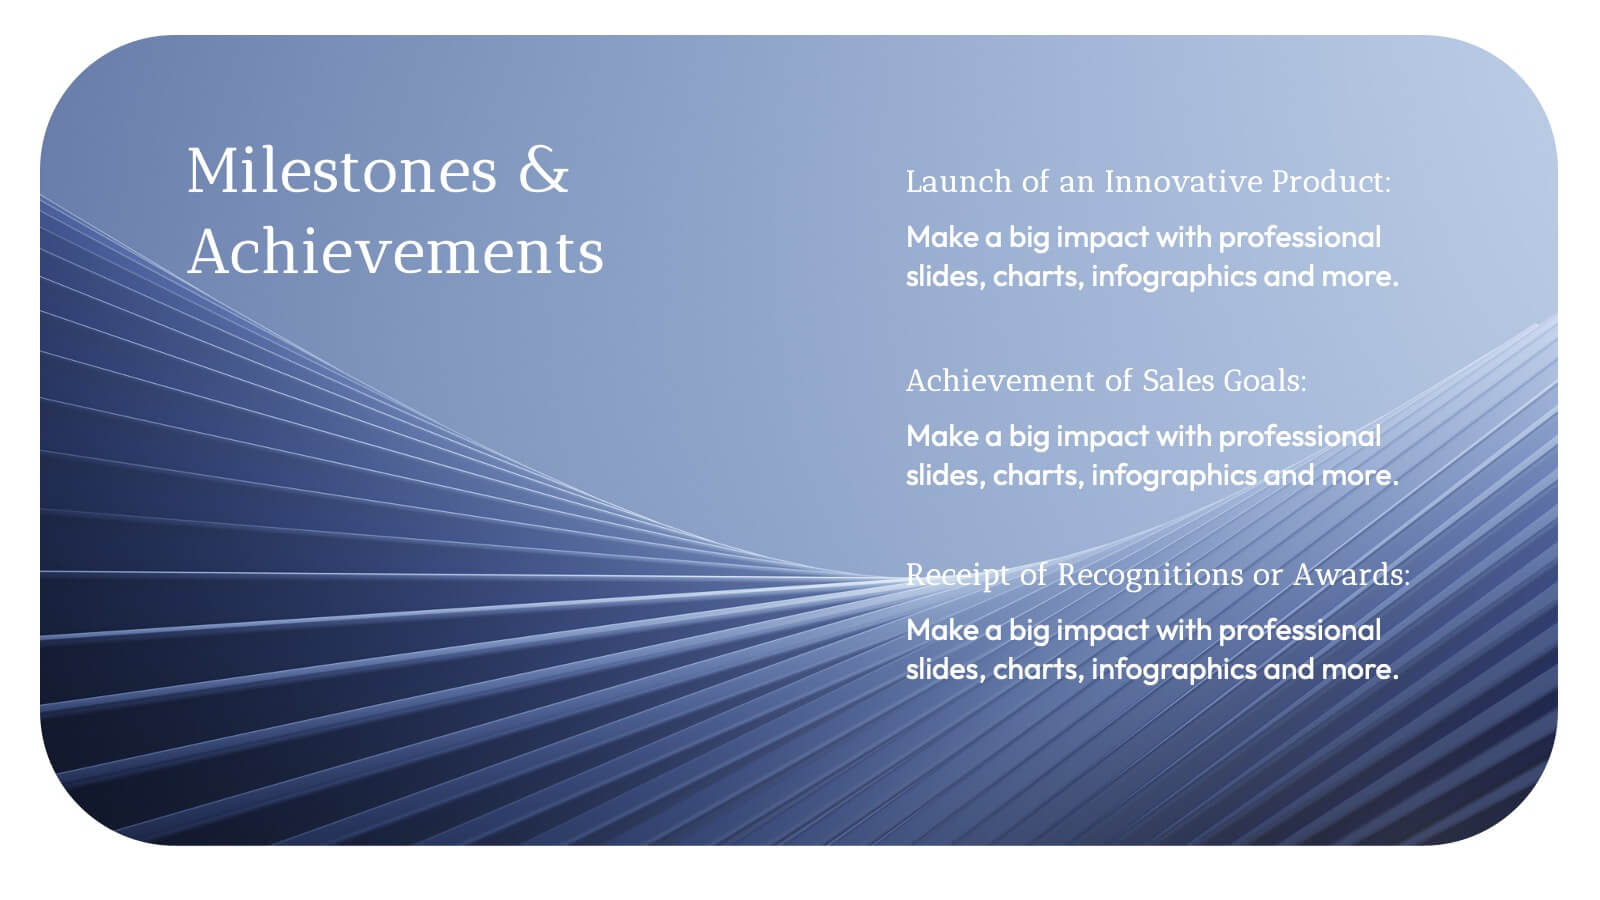
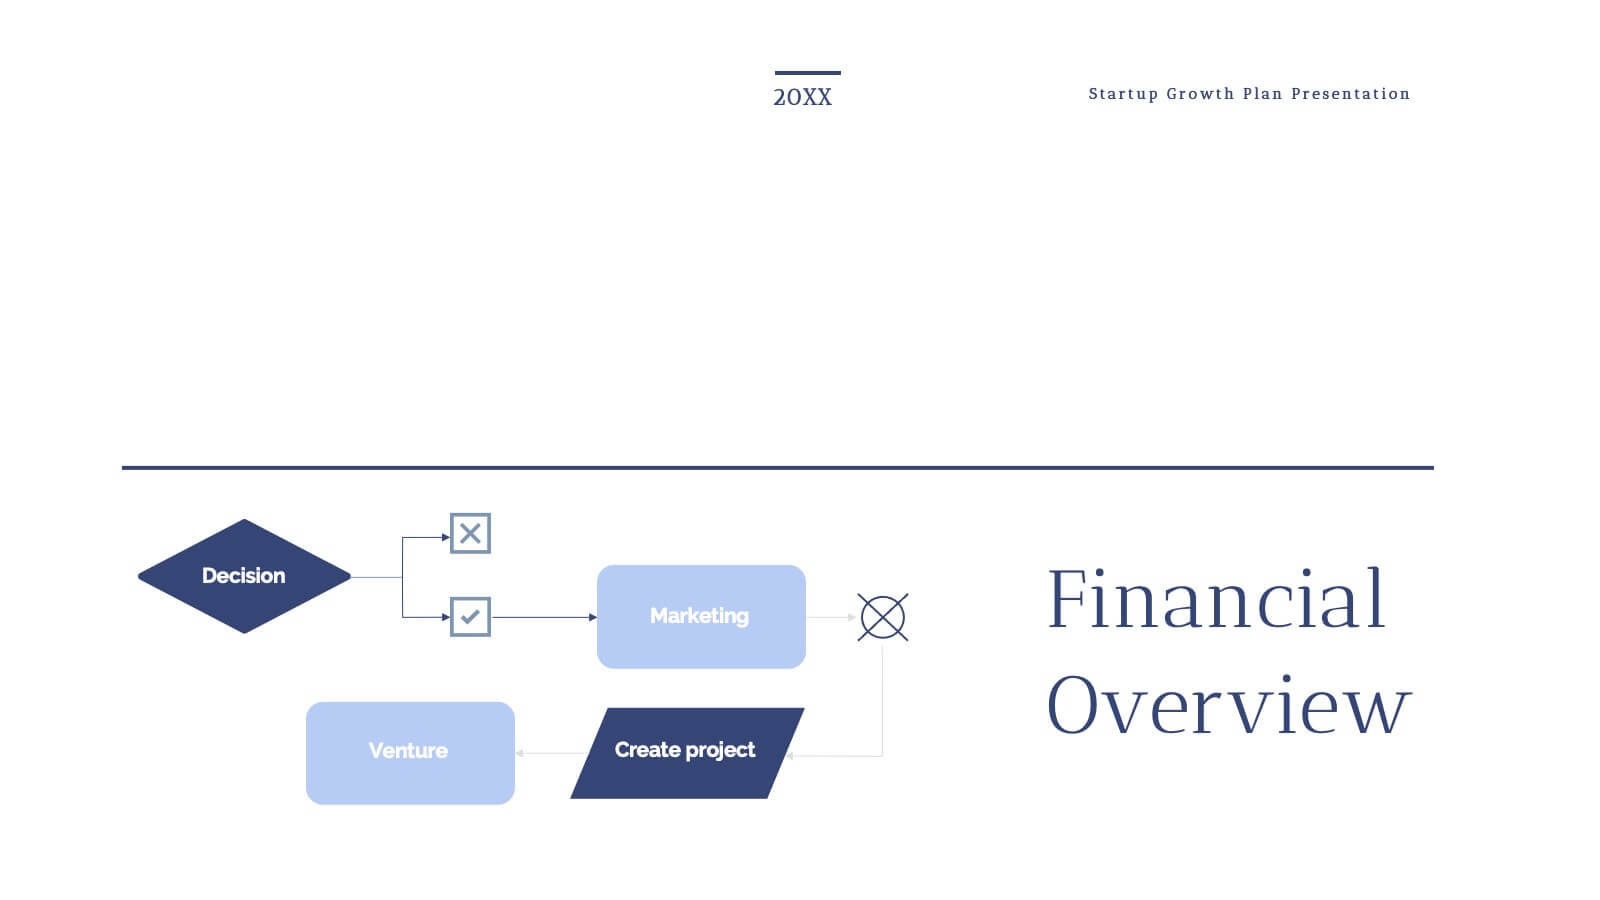
Grecian Startup Growth Plan Presentation
Elevate your pitch with this stunning Grecian-inspired presentation template, perfect for outlining your startup's growth plan! Showcase your business strategy, revenue projections, and scaling opportunities with a clean, elegant design that grabs attention. Impress investors and stakeholders with every slide. Compatible with PowerPoint, Keynote, and Google Slides for seamless customization.


34 slides
Accelerator Pitch Deck
Welcome to our Accelerator Pitch Deck presentation! This template is designed to help you create a captivating pitch deck for your startup or business to showcase your venture to potential programs or investors. With its sleek and modern design, this template will help you effectively communicate your business idea, market opportunity, growth plans, and financial projections to capture the attention of programs and investors. This template can also cover other various aspects of your business, including your problem and solution, market validation, customer acquisition, competitor analysis, milestones, team introduction, and more.