


Features
- 26 Unique slides
- Fully editable and easy to edit in Microsoft Powerpoint, Keynote and Google Slides
- 16:9 widescreen layout
- Clean and professional designs
- Export to JPG, PDF or send by email


Do you have any questions?
Recommend


4 slides
Scrum & Agile Sprint Presentation
Bring movement and clarity to your workflow with a dynamic loop-and-sprint visual that makes progress feel intuitive and easy to track. This presentation helps you outline iterations, refine tasks, and communicate team priorities with confidence. Fully editable and compatible with PowerPoint, Keynote, and Google Slides.


6 slides
Product Life Cycle Stages and Management Presentation
Visualize the journey from product development to market maturity with this modern, conveyor-style layout. Designed to represent five sequential phases, this presentation is perfect for product managers, marketing teams, or business strategists explaining launch strategies, performance tracking, or growth planning. Fully editable in PowerPoint, Keynote, and Google Slides.
4 slides
Arrow Path Business Journey Presentation
Visualize growth, decisions, and direction with the Arrow Path Business Journey Presentation. This dynamic slide is designed to illustrate key stages, multiple outcomes, or strategic forks in the road. Great for showing parallel team tracks, phased development, or transformation journeys. Fully editable and works seamlessly in PowerPoint, Google Slides, and Canva.

21 slides
Trident Product Development Plan Presentation
Present your product development strategy with this sleek, professional template! Highlight company overview, product features, and unique selling proposition. Ideal for showcasing market analysis, pricing strategy, and production process. Perfect for developers and project managers. Compatible with PowerPoint, Keynote, and Google Slides.


20 slides
Nebula Project Proposal Presentation
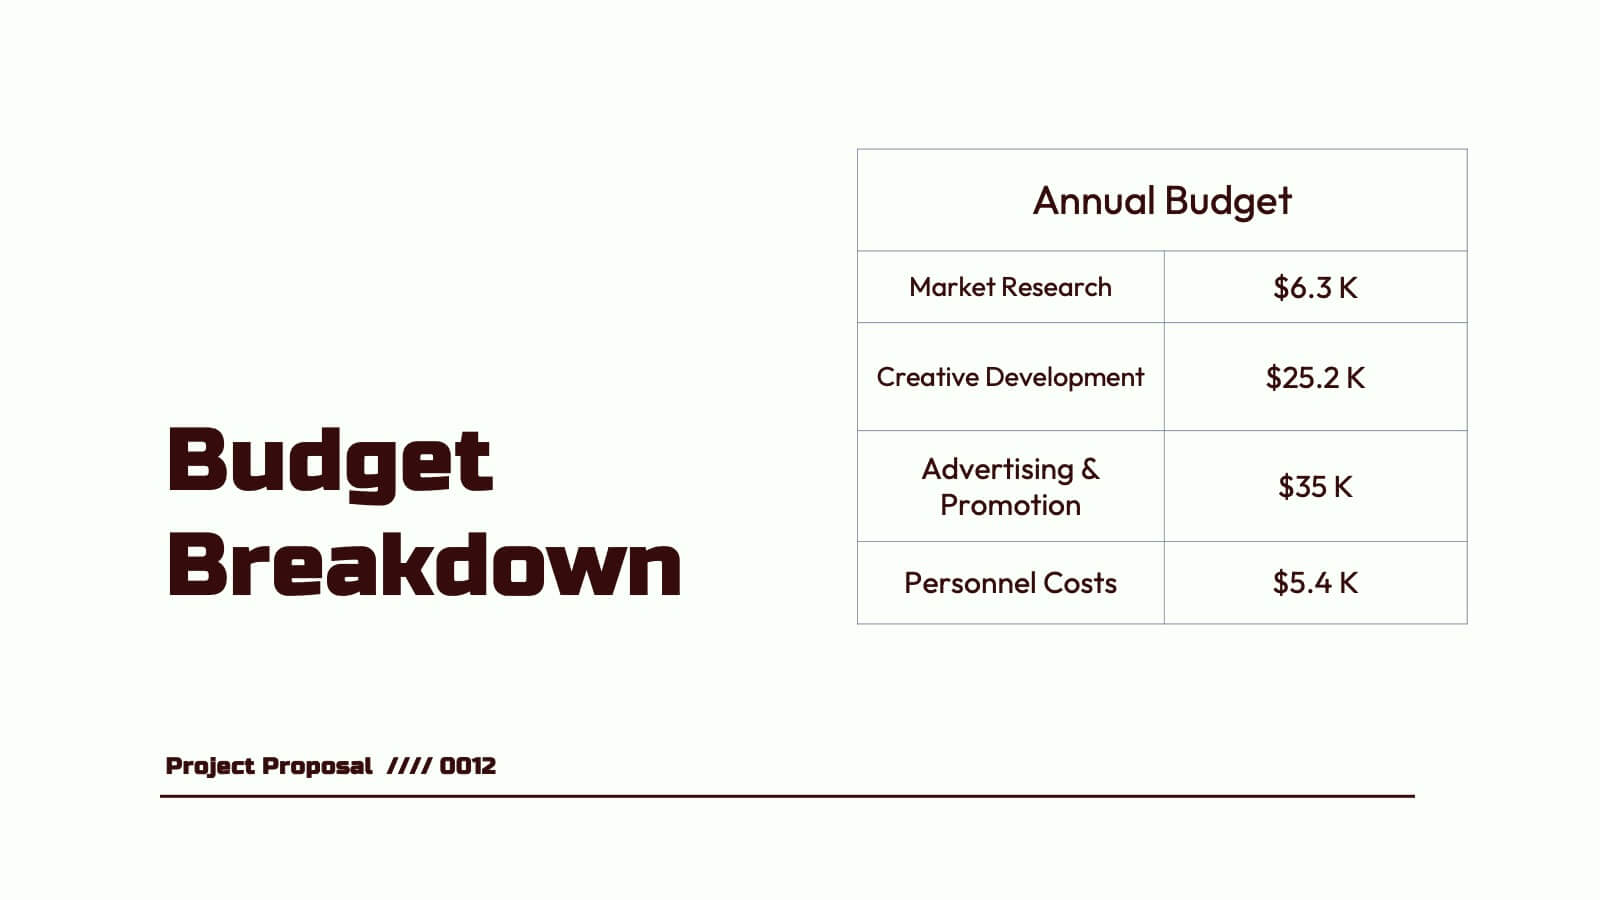
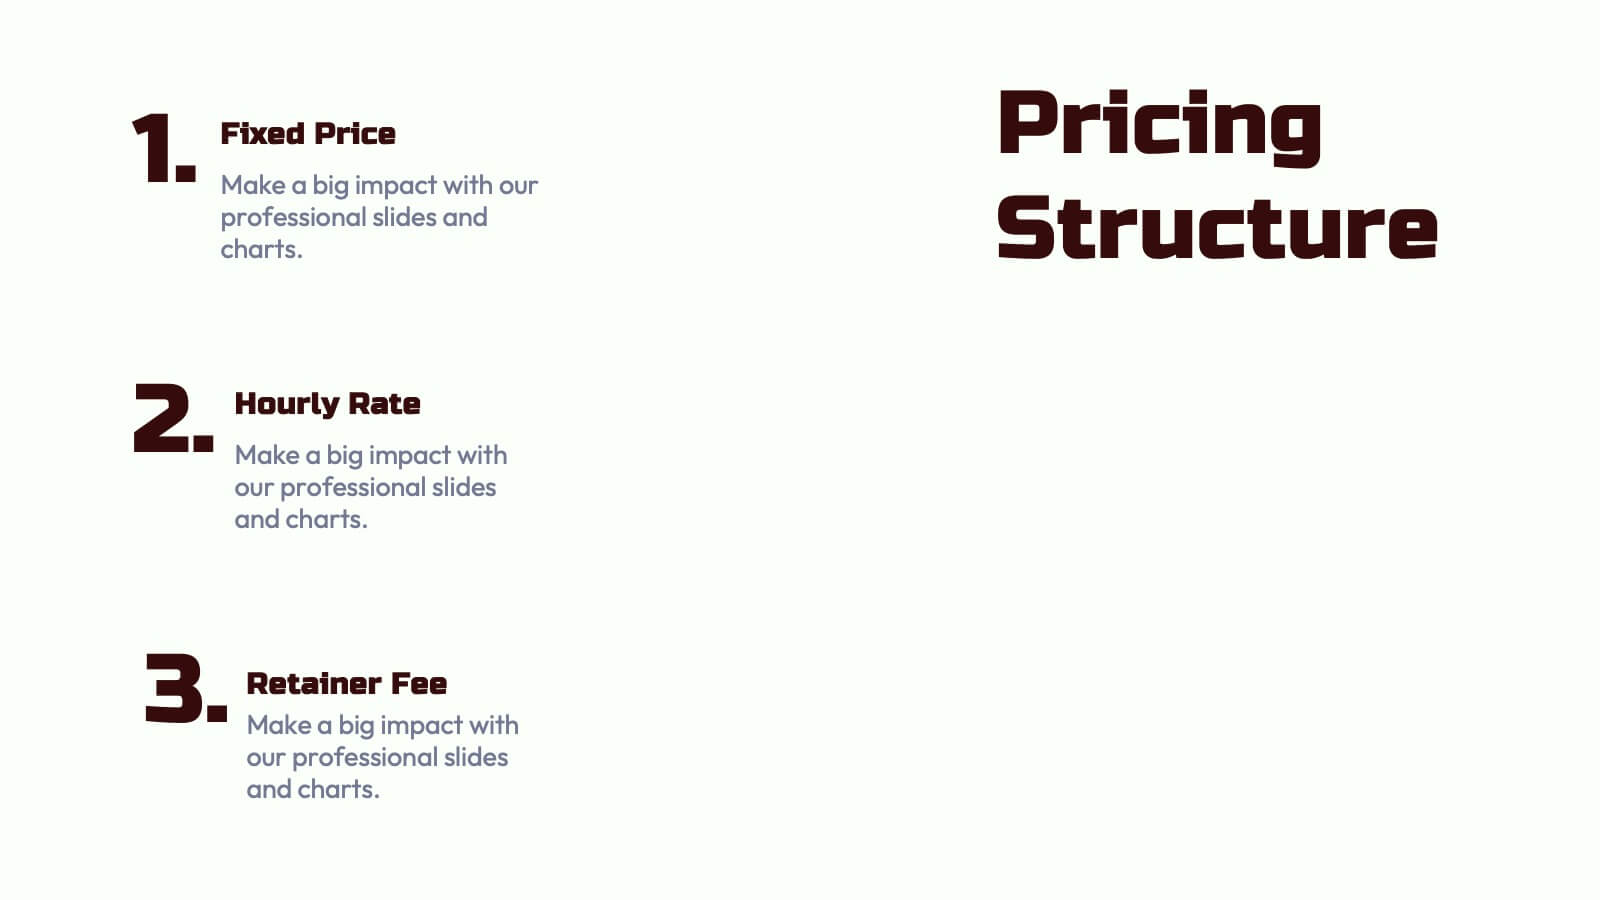
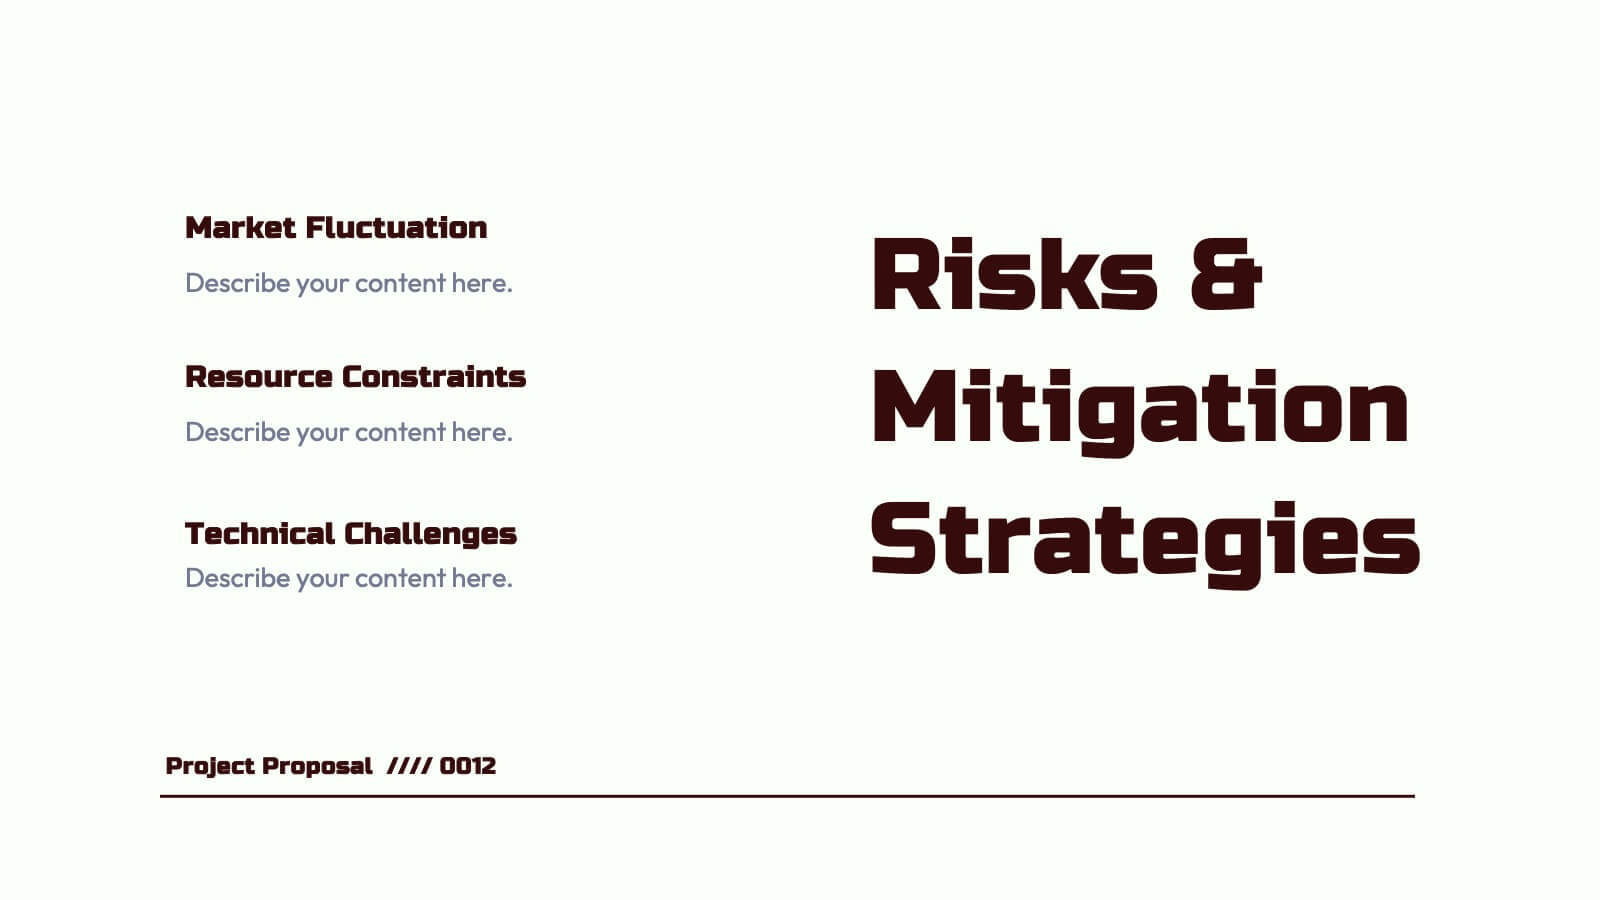
Create a compelling project proposal with this structured, professional template! It includes sections for problem statements, proposed solutions, goals, timelines, and pricing. Perfect for organizing your ideas clearly and professionally, it's fully customizable and compatible with PowerPoint, Keynote, and Google Slides. This template makes it easy to present your proposals effectively and win clients.


12 slides
Customer Satisfaction Smile Rating Presentation
Measure customer happiness with this engaging customer satisfaction smile rating template! Featuring a visual scale from dissatisfaction to delight, this design helps businesses track feedback and identify improvement areas. Ideal for reports, surveys, and performance reviews. Fully customizable and compatible with PowerPoint, Keynote, and Google Slides.


5 slides
Stakeholder Expectations and Influence Matrix Presentation
Visualize your stakeholder dynamics with the Stakeholder Expectations and Influence Matrix Presentation. This slide uses a four-quadrant model—Monitor, Keep Informed, Keep Satisfied, Manage Closely—to map influence versus interest. Perfect for strategic planning, stakeholder communication, and project alignment. Editable in PowerPoint, Keynote, and Google Slides.


6 slides
Business Calendar and Monthly Overview Presentation
Bring structure to your chaos with a bold and colorful visual planner! This easy-to-use layout helps track tasks, deadlines, or projects across multiple months in one glance. Ideal for team coordination or solo planning. Fully editable and compatible with PowerPoint, Keynote, and Google Slides for seamless calendar-based presentations.


5 slides
Collaborative Learning Techniques Overview Presentation
Highlight team-based education methods with the Collaborative Learning Techniques Overview Presentation. This layout is perfect for mapping out peer-led discussions, group projects, or cooperative learning strategies using a visual 4-step flow. The clean, screen-themed icons make it ideal for educators, trainers, or eLearning creators. Fully editable in Canva, PowerPoint, Keynote, and Google Slides.


6 slides
5-Stage Circular Cycle Presentation
Energize your workflow with a clean, circular layout that turns five interconnected steps into a clear, engaging story. This presentation helps you explain any repeating process or continuous cycle with simplicity and flow, making complex ideas easier to follow. Compatible with PowerPoint, Keynote, and Google Slides.


4 slides
Current vs Future State Gap Presentation
Take your audience on a journey of progress with this dynamic slide, designed to clearly compare where things stand today and where they’re headed next. It helps highlight key gaps, improvement areas, and strategic opportunities with a simple, visual flow. Fully compatible with PowerPoint, Keynote, and Google Slides.


4 slides
Editable SWOT Layout Slide Presentation
Kickstart your strategy session with a clean, modern slide that makes evaluating strengths, weaknesses, opportunities, and threats feel simple and organized. This presentation helps teams break down key insights using a balanced, easy-to-read layout designed for clarity and impact. Perfect for planning and decision-making. Fully compatible with PowerPoint, Keynote, and Google Slides.


5 slides
Water Sustainability & Resource Use Presentation
Visualize environmental impact with this unique cloud-and-rainfall diagram layout. Ideal for presenting five key points related to sustainability, resource management, or water usage. Each droplet icon guides attention across your content clearly. Fully editable and compatible with PowerPoint, Keynote, and Google Slides for effortless customization and impactful storytelling.


20 slides
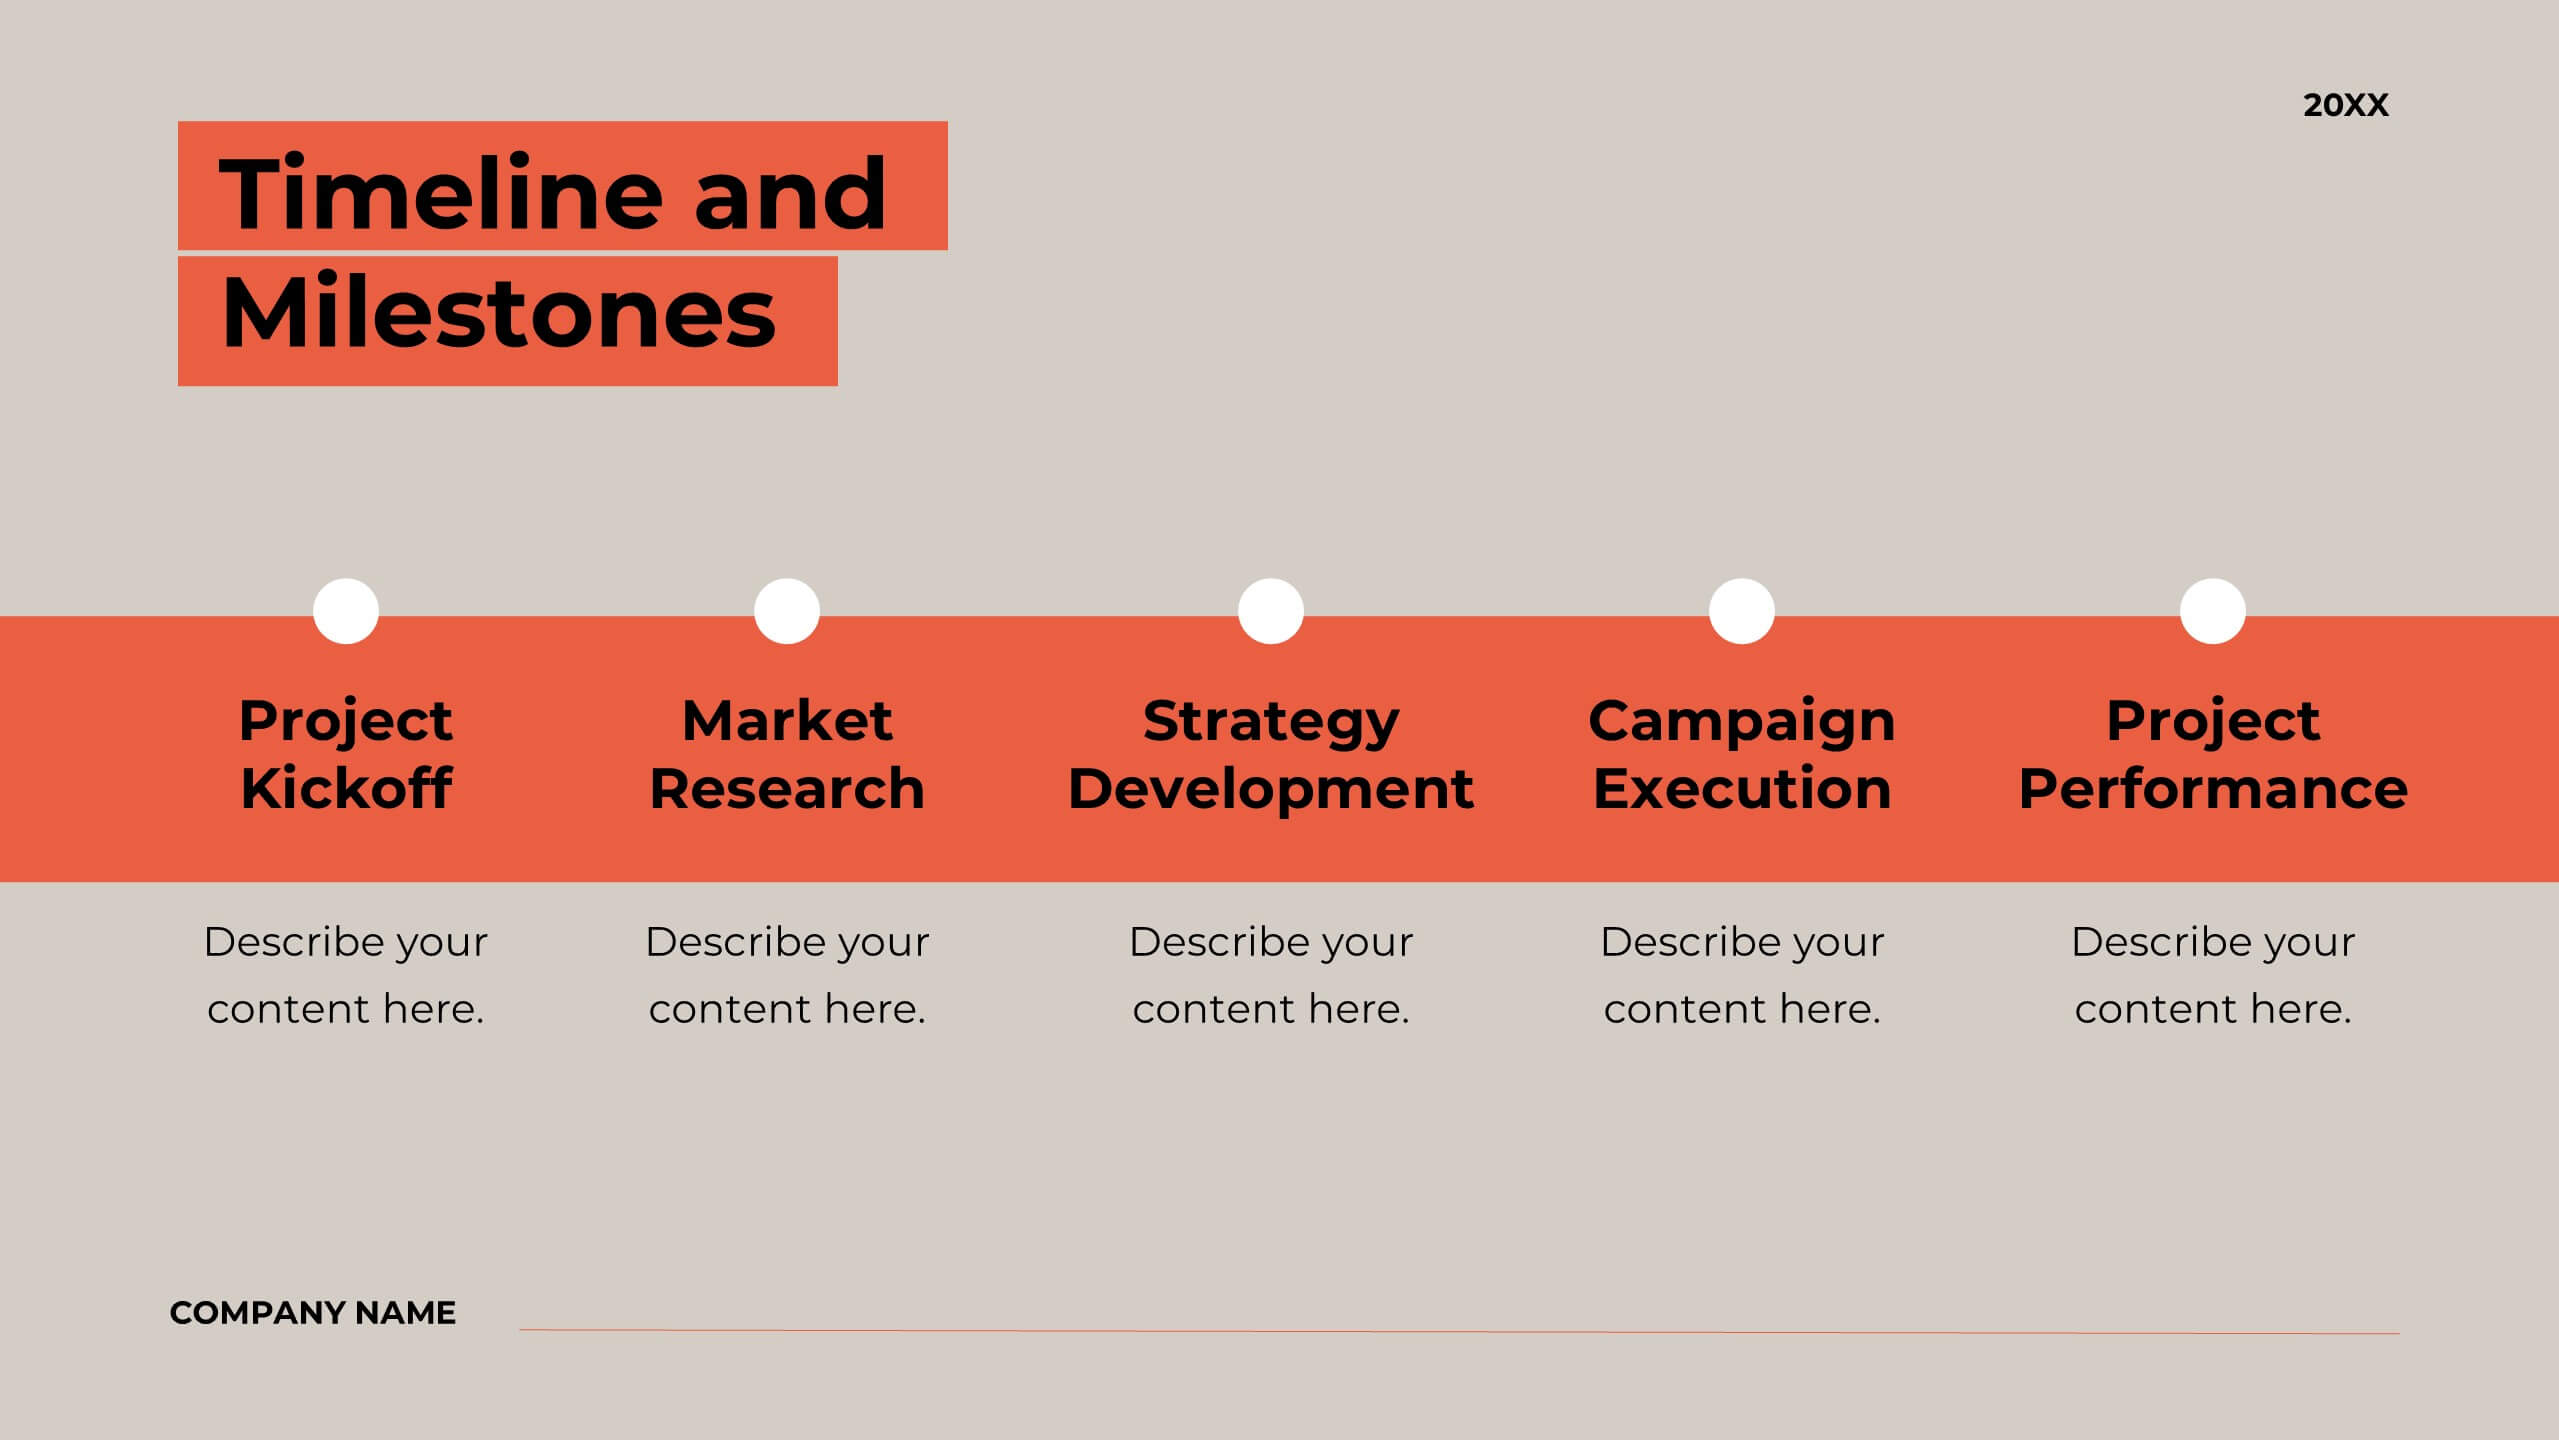
Bentom Marketing Proposal Presentation
This marketing proposal template is crafted to communicate your strategy with impact. With sections covering company overview, project summary, objectives, methodology, budget breakdown, and deliverables, it provides a professional layout for presenting key details to clients. Tailor it to fit your needs, and present confidently using PowerPoint, Keynote, or Google Slides.


4 slides
HR Onboarding and Hiring Plan Deck Presentation
Streamline recruitment and training workflows with the HR Onboarding and Hiring Plan Deck. This presentation template helps visualize hiring stages, orientation paths, and employee milestones using structured flowcharts. Ideal for HR professionals and team leads. Fully editable in PowerPoint, Keynote, and Google Slides for easy customization and organizational branding.


4 slides
Key Stakeholder Identification Presentation
A great presentation starts with clarity, and this slide brings your message to life with bold, visual focus. Use it to break down key stakeholder groups, highlight their roles, and communicate insights with ease. Clean lines and intuitive icons keep everything clear and engaging. Fully compatible with PowerPoint, Keynote, and Google Slides.


6 slides
Task Management Checklist
Stay on top of your workflow with this visually engaging task management checklist slide. Designed to help teams track progress across multiple tasks or project stages, this layout includes six editable sections with icon markers and color-coded completion states. Fully compatible with PowerPoint, Keynote, and Google Slides.