


Features
- 6 Unique slides
- Fully editable and easy to edit in Microsoft Powerpoint, Keynote and Google Slides
- 16:9 widescreen layout
- Clean and professional designs
- Export to JPG, PDF or send by email


Do you have any questions?
Recommend


5 slides
Marijuana Industry Infographics
The Marijuana Industry refers to the cultivation, production, distribution, and sale of marijuana or cannabis-related products. These vertical infographics are designed to provide an overview of the marijuana industry. They offer a comprehensive look at the various aspects of the industry, including its history, growth, legalization, medical and recreational uses, and more. Inform and educate your viewers about the various aspects of the marijuana industry. Present data, trends, and insights related to the industry. This template is an effective tool for presenting key information about the marijuana industry in a visually engaging manner.


26 slides
E-commerce Presentation
Venture into the digital marketplace with a presentation template that embodies the innovative spirit of e-commerce. This template, with its vibrant colors and modern design elements, is tailored to highlight the fast-paced world of online retail. The slides offer a digital storefront for your ideas, from introducing the creative minds behind the operation to showcasing the latest trends in online shopping. Utilize engaging layouts to compare products, outline sales strategies, or highlight consumer behavior with clear, concise infographics. With promotional slide options to announce special deals and a design that captures the convenience and excitement of shopping with a click, this collection is an essential tool for marketers, online retailers, and startups. It’s optimized for conveying complex data in a user-friendly format, ensuring your audience stays engaged and informed. Compatible with PowerPoint, Keynote, and Google Slides, it’s the perfect cart to carry your message in the bustling online marketplace.


6 slides
Industry Analysis with Porter's Forces Presentation
The Industry Analysis with Porter's Forces Presentation offers a clean and strategic layout for visualizing competitive dynamics. This deck illustrates the five forces—Buyers, Suppliers, Competitors, Substitutions, and New Entry—in a semi-circular flow that makes relationships easy to understand. Each force is paired with editable text and icons for clarity. Ideal for market research, business strategy, or consulting work. Fully compatible with PowerPoint, Keynote, and Google Slides.


5 slides
USA Economy Infographics
The U.S. economy has a significant impact on the global economy and serves as a benchmark for economic performance. These vertical infographics are the perfect tool to present your key facts, statistics, and trends to help the audience understand the economic landscape of the country. The visually appealing design included, coupled with concise and relevant information, helps to effectively communicate the complexities of the economy. Whether used for educational purposes or as a reference tool, these templates provides a comprehensive overview of the USA economy and its key components. Fully compatible with Powerpoint, Keynote, and Google Slides.


26 slides
Modern Company Profile Striped Presentation
Present your company with style, our modern company profile presentation, is the perfect template to showcase your business in a contemporary and stylish way. This template combines professionalism with a touch of flair and striped elements, making it ideal for modern businesses looking to make a lasting impression. Ideal for tech startups, creative agencies, or a professional service firms, this presentation will help you convey your company's professionalism. Fully customizable and compatible with Powerpoint, Keynote, and Google Slides. This makes it easy for potential clients, partners, and investors to reach out!


10 slides
Healthcare Innovations in Medicine Presentation
Showcase groundbreaking advancements with the Healthcare Innovations in Medicine Presentation template. Designed to highlight medical breakthroughs, research developments, and technological advancements, this visually appealing layout is ideal for healthcare professionals, researchers, and medical institutions. Fully customizable and compatible with PowerPoint, Keynote, and Google Slides, this template ensures your presentation is clear, engaging, and impactful.


4 slides
Elegant Watercolor Background Presentation
Add a touch of sophistication to your presentation with soft watercolor textures that create a calming, professional atmosphere. Perfect for creative projects, proposals, or portfolios, this elegant design blends artistry with clarity. Fully compatible with PowerPoint, Keynote, and Google Slides for seamless customization and a refined visual finish.


23 slides
Soundscape Marketing Strategy Plan Presentation
Craft a compelling marketing strategy with a modern and sophisticated presentation template designed for marketers, agencies, and entrepreneurs. Perfectly organized, this template allows you to present strategic objectives, SWOT analysis, and competitive landscape insights in a structured manner. Communicate key challenges, value propositions, and resource allocations with sleek, minimalistic slides. Visualize your timeline, team expertise, and communication strategy using editable graphics and streamlined layouts. Dedicated slides for performance metrics and risk management ensure your plan resonates with stakeholders and decision-makers. Compatible with PowerPoint, Google Slides, and Keynote, this fully customizable template empowers you to deliver your strategy with impact and clarity. Elevate your presentation with professional design elements that captivate your audience and drive actionable results.


2 slides
Professional Closing Thank You Presentation
End your presentation on a high note with this professional thank-you slide template! Featuring a clean and modern layout, this design includes space for contact details and a call to action, making it perfect for business meetings, proposals, and networking events. Fully customizable and compatible with PowerPoint, Keynote, and Google Slides.


20 slides
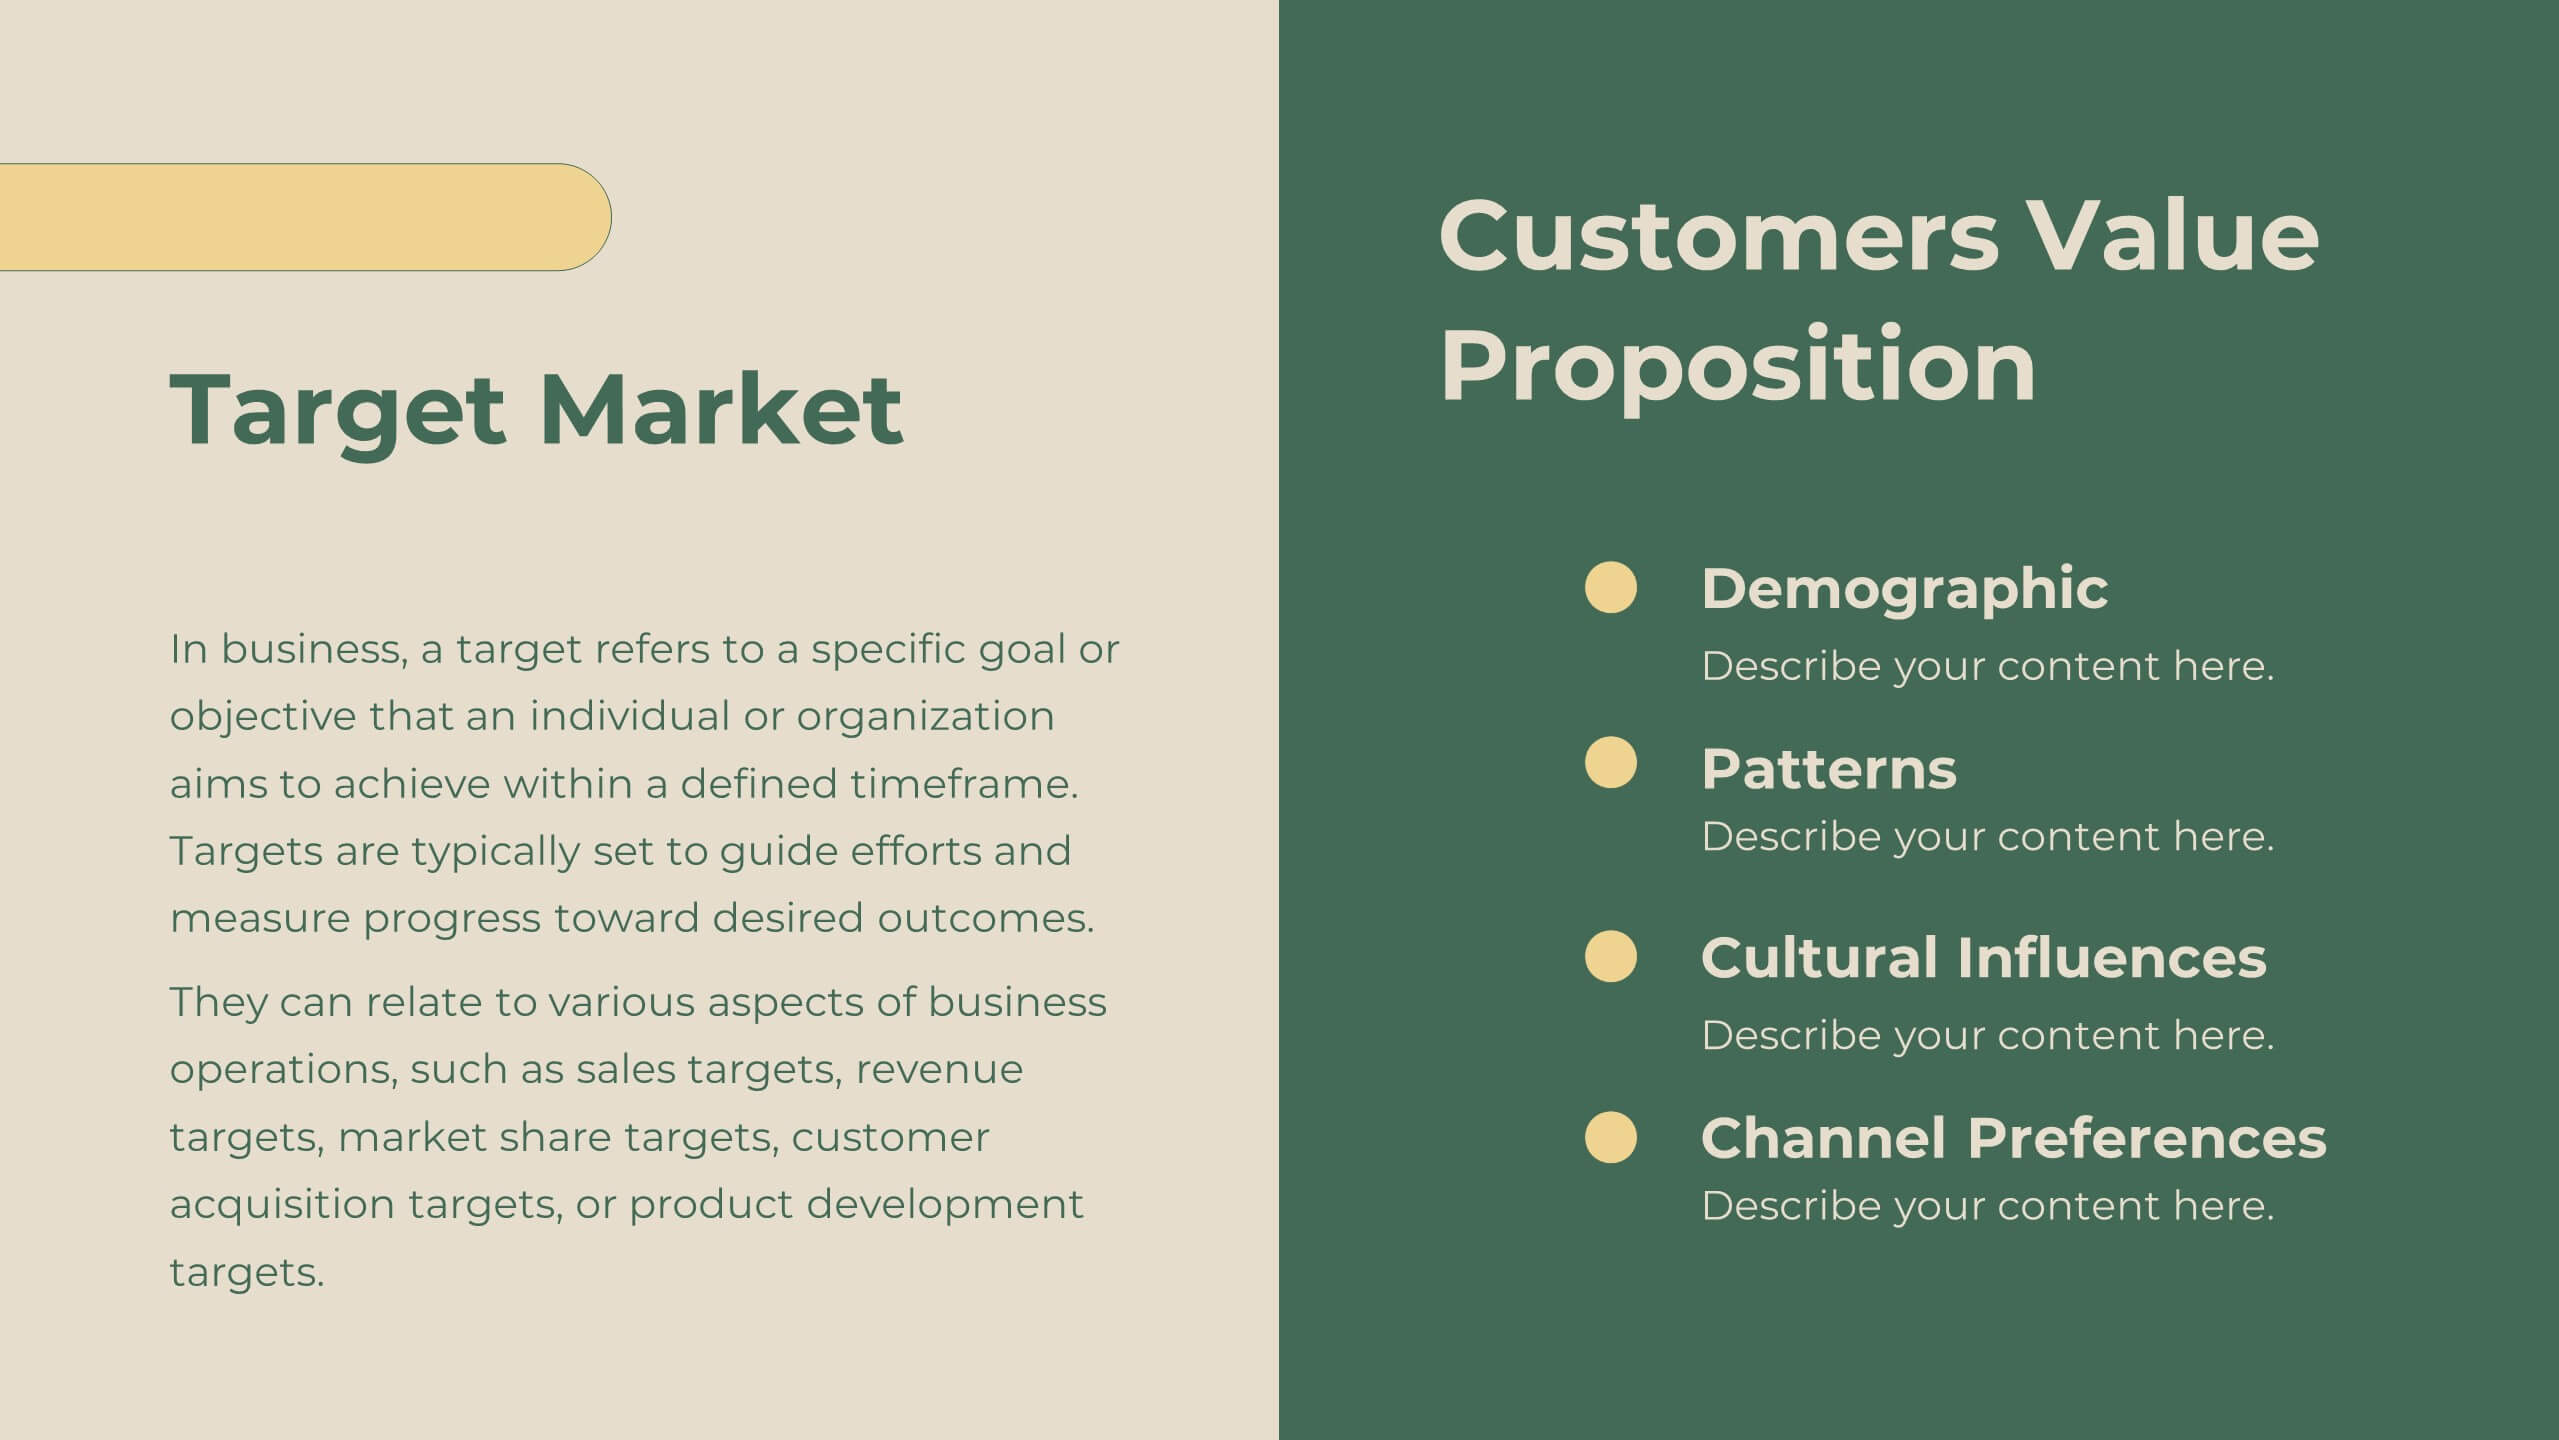
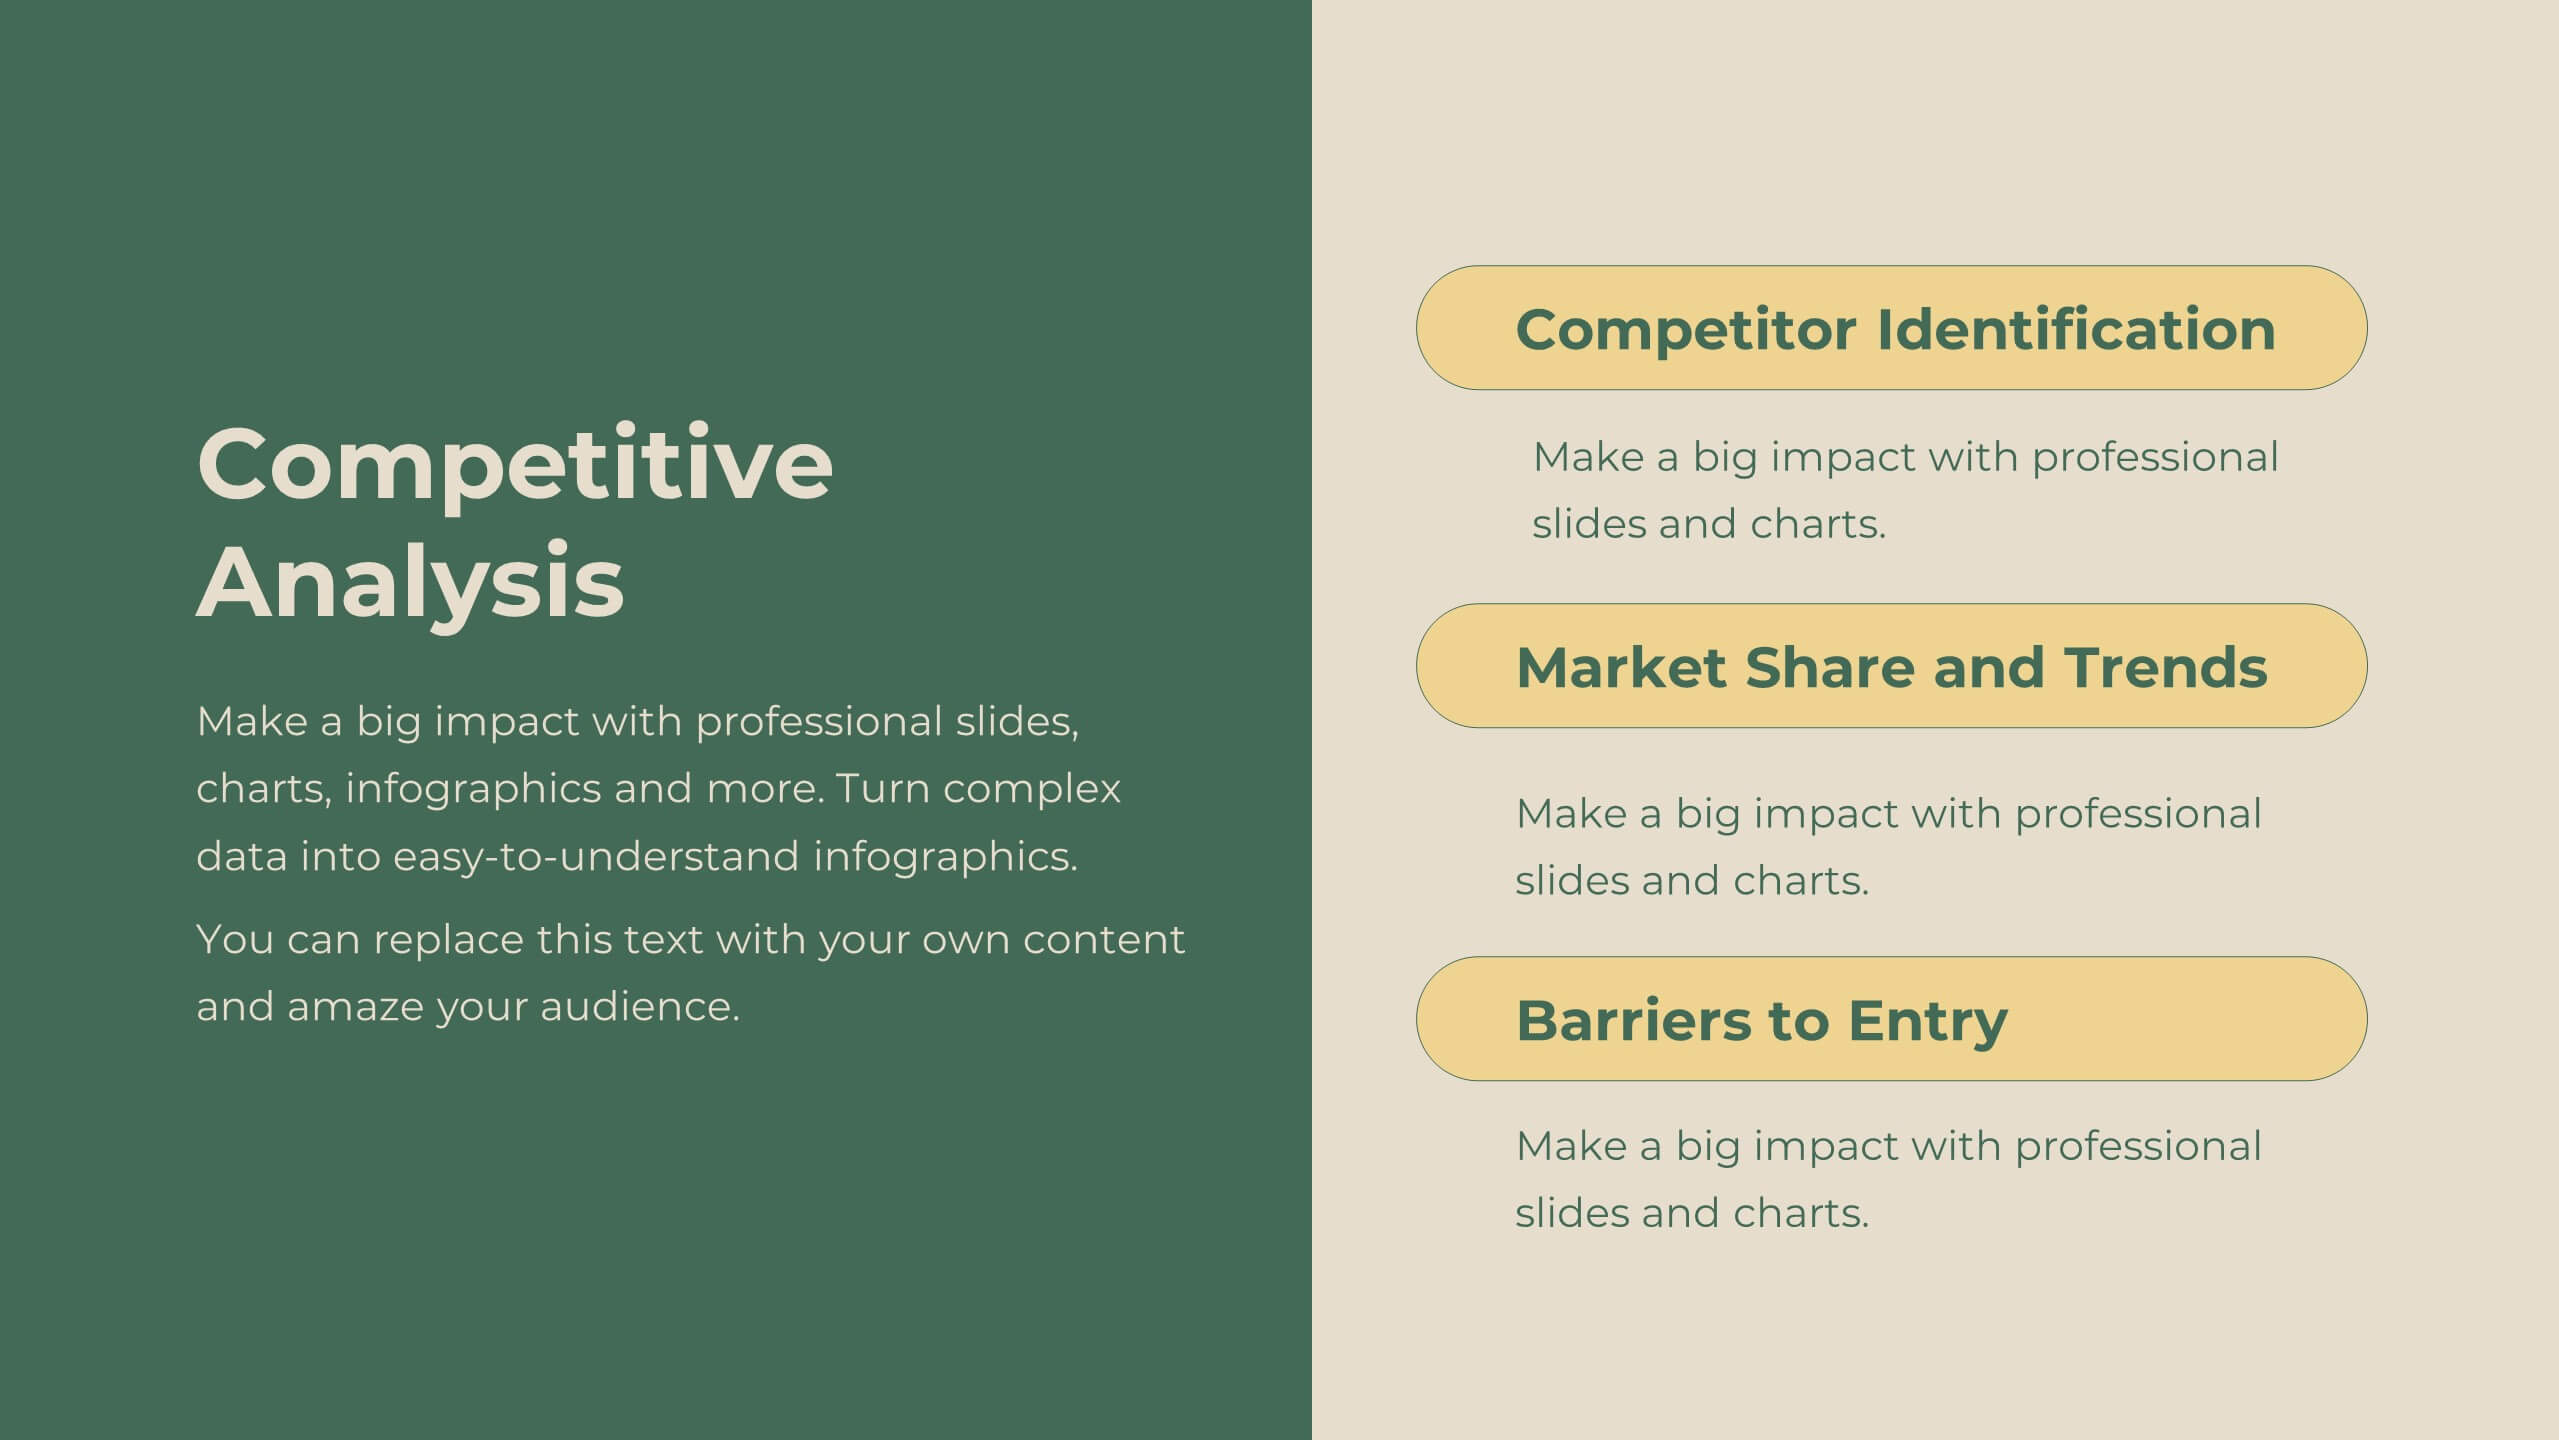
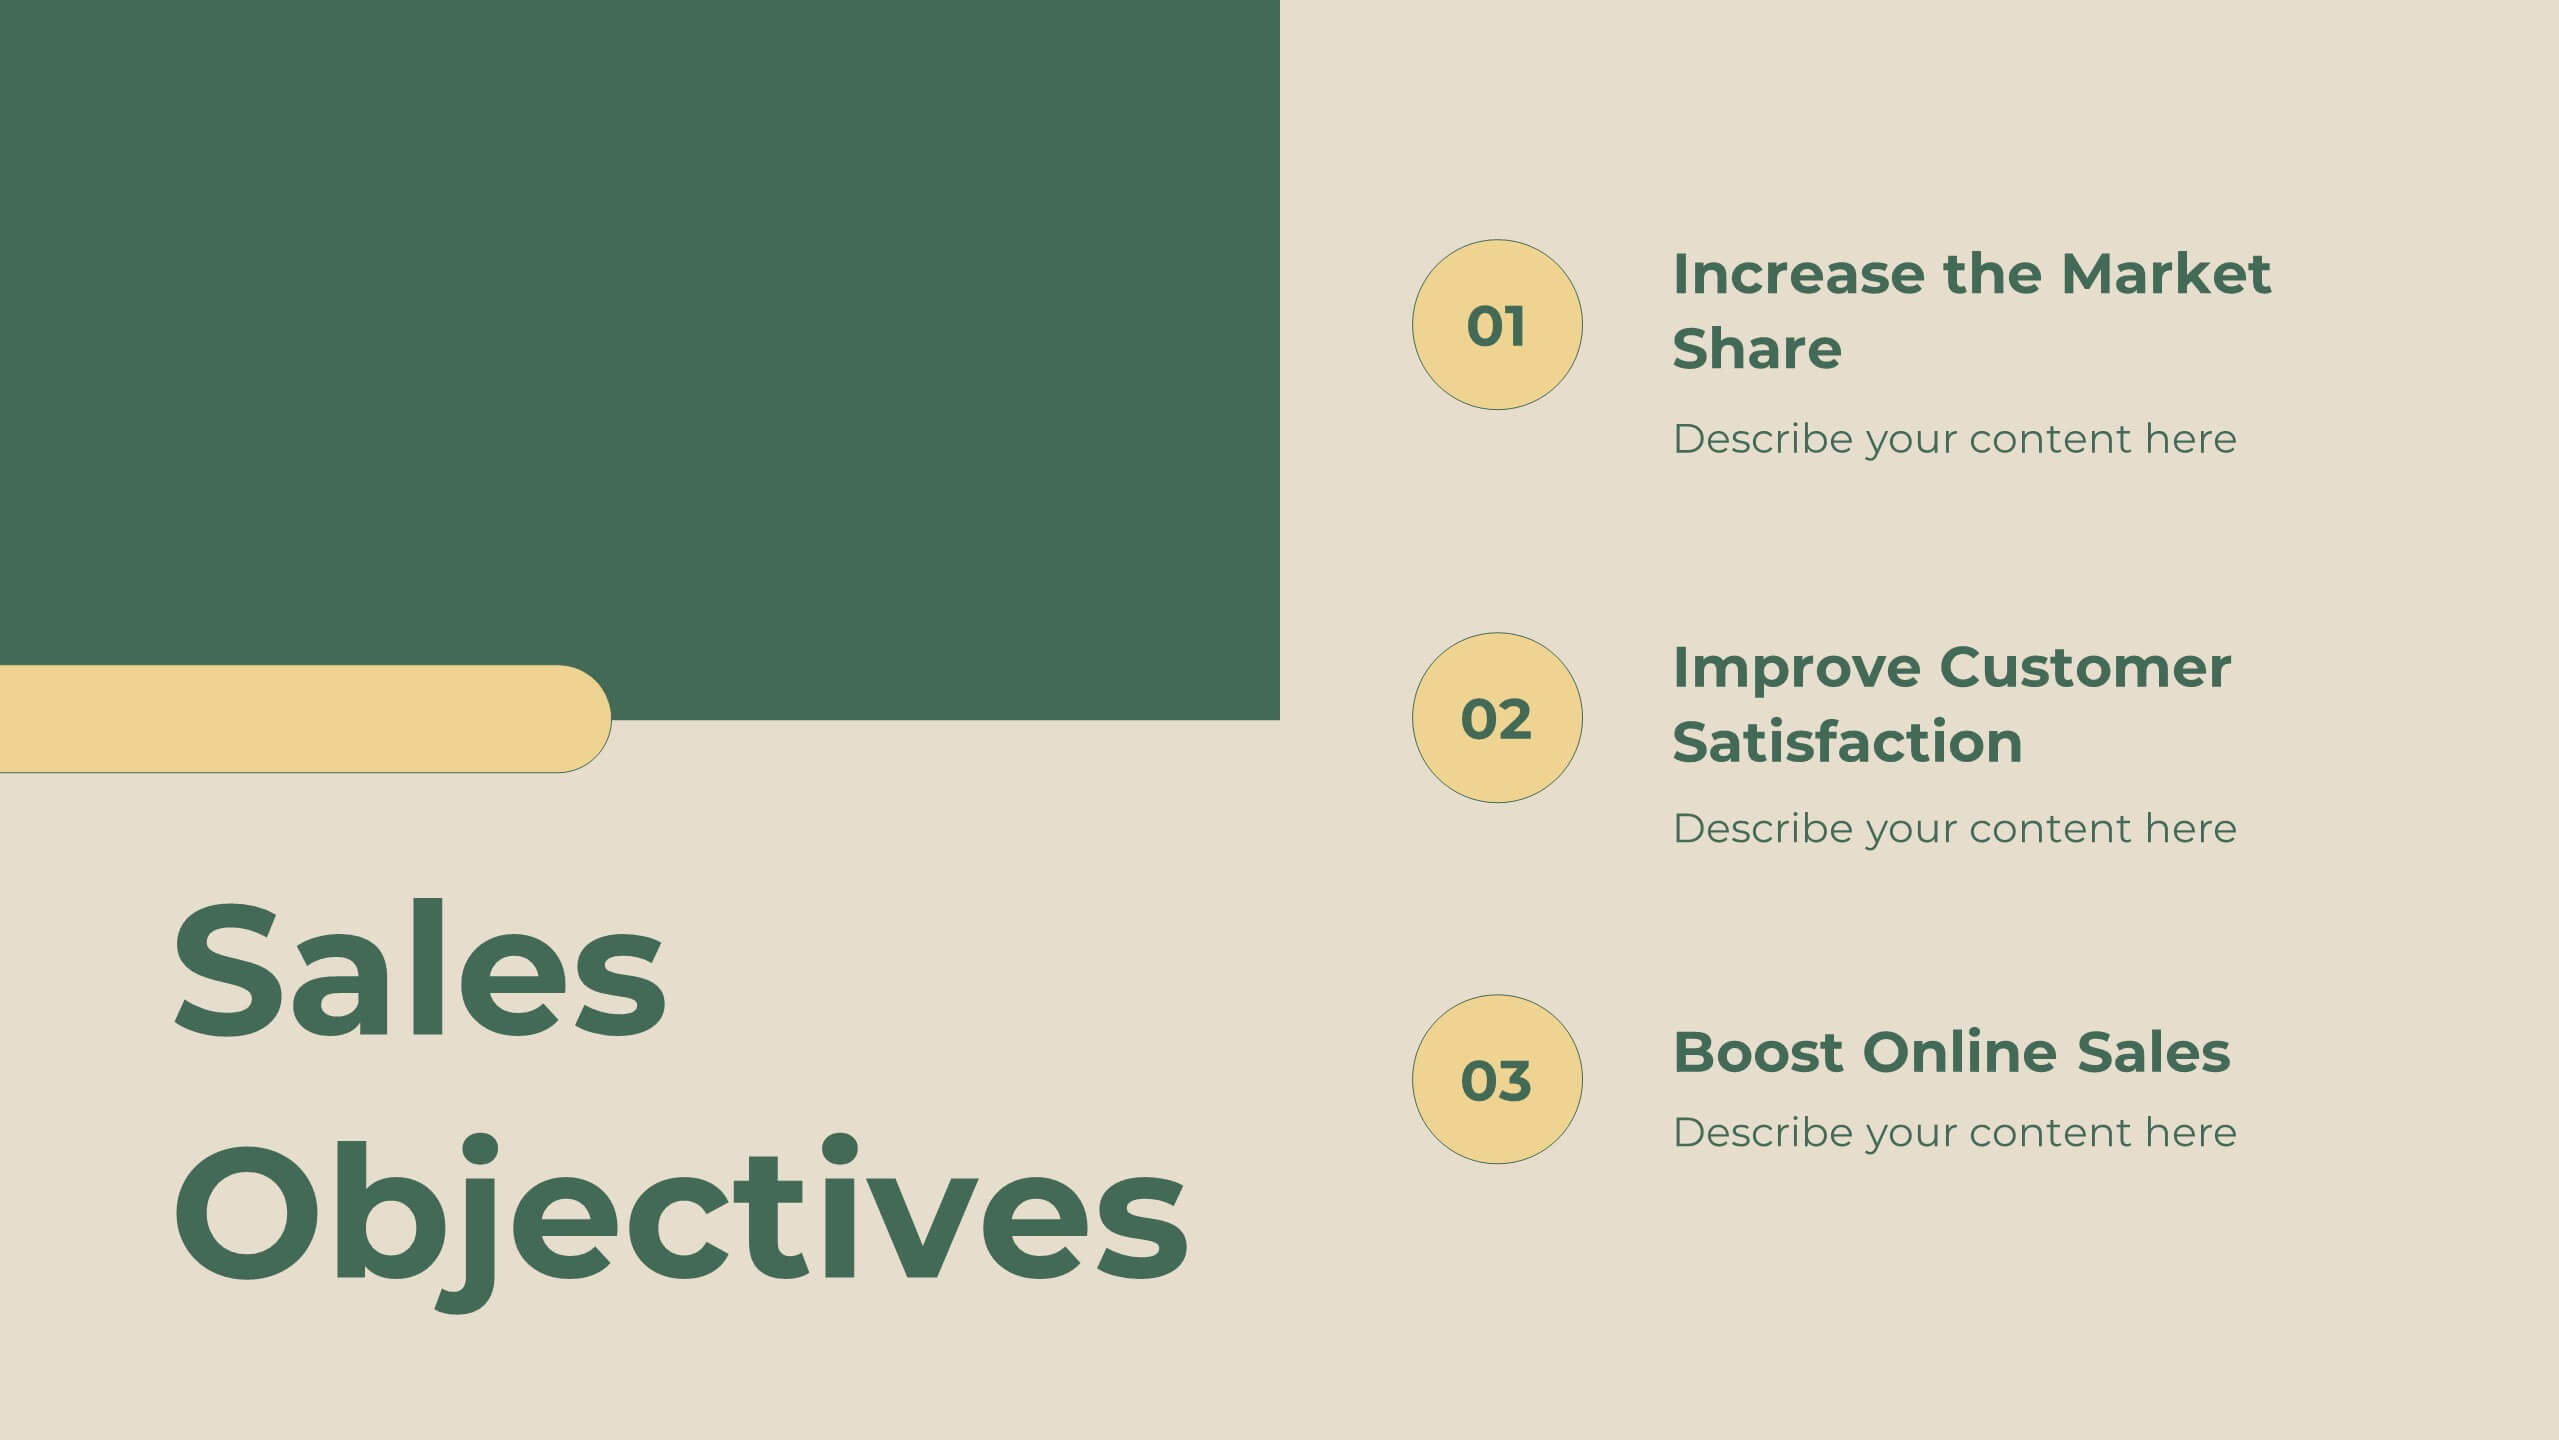
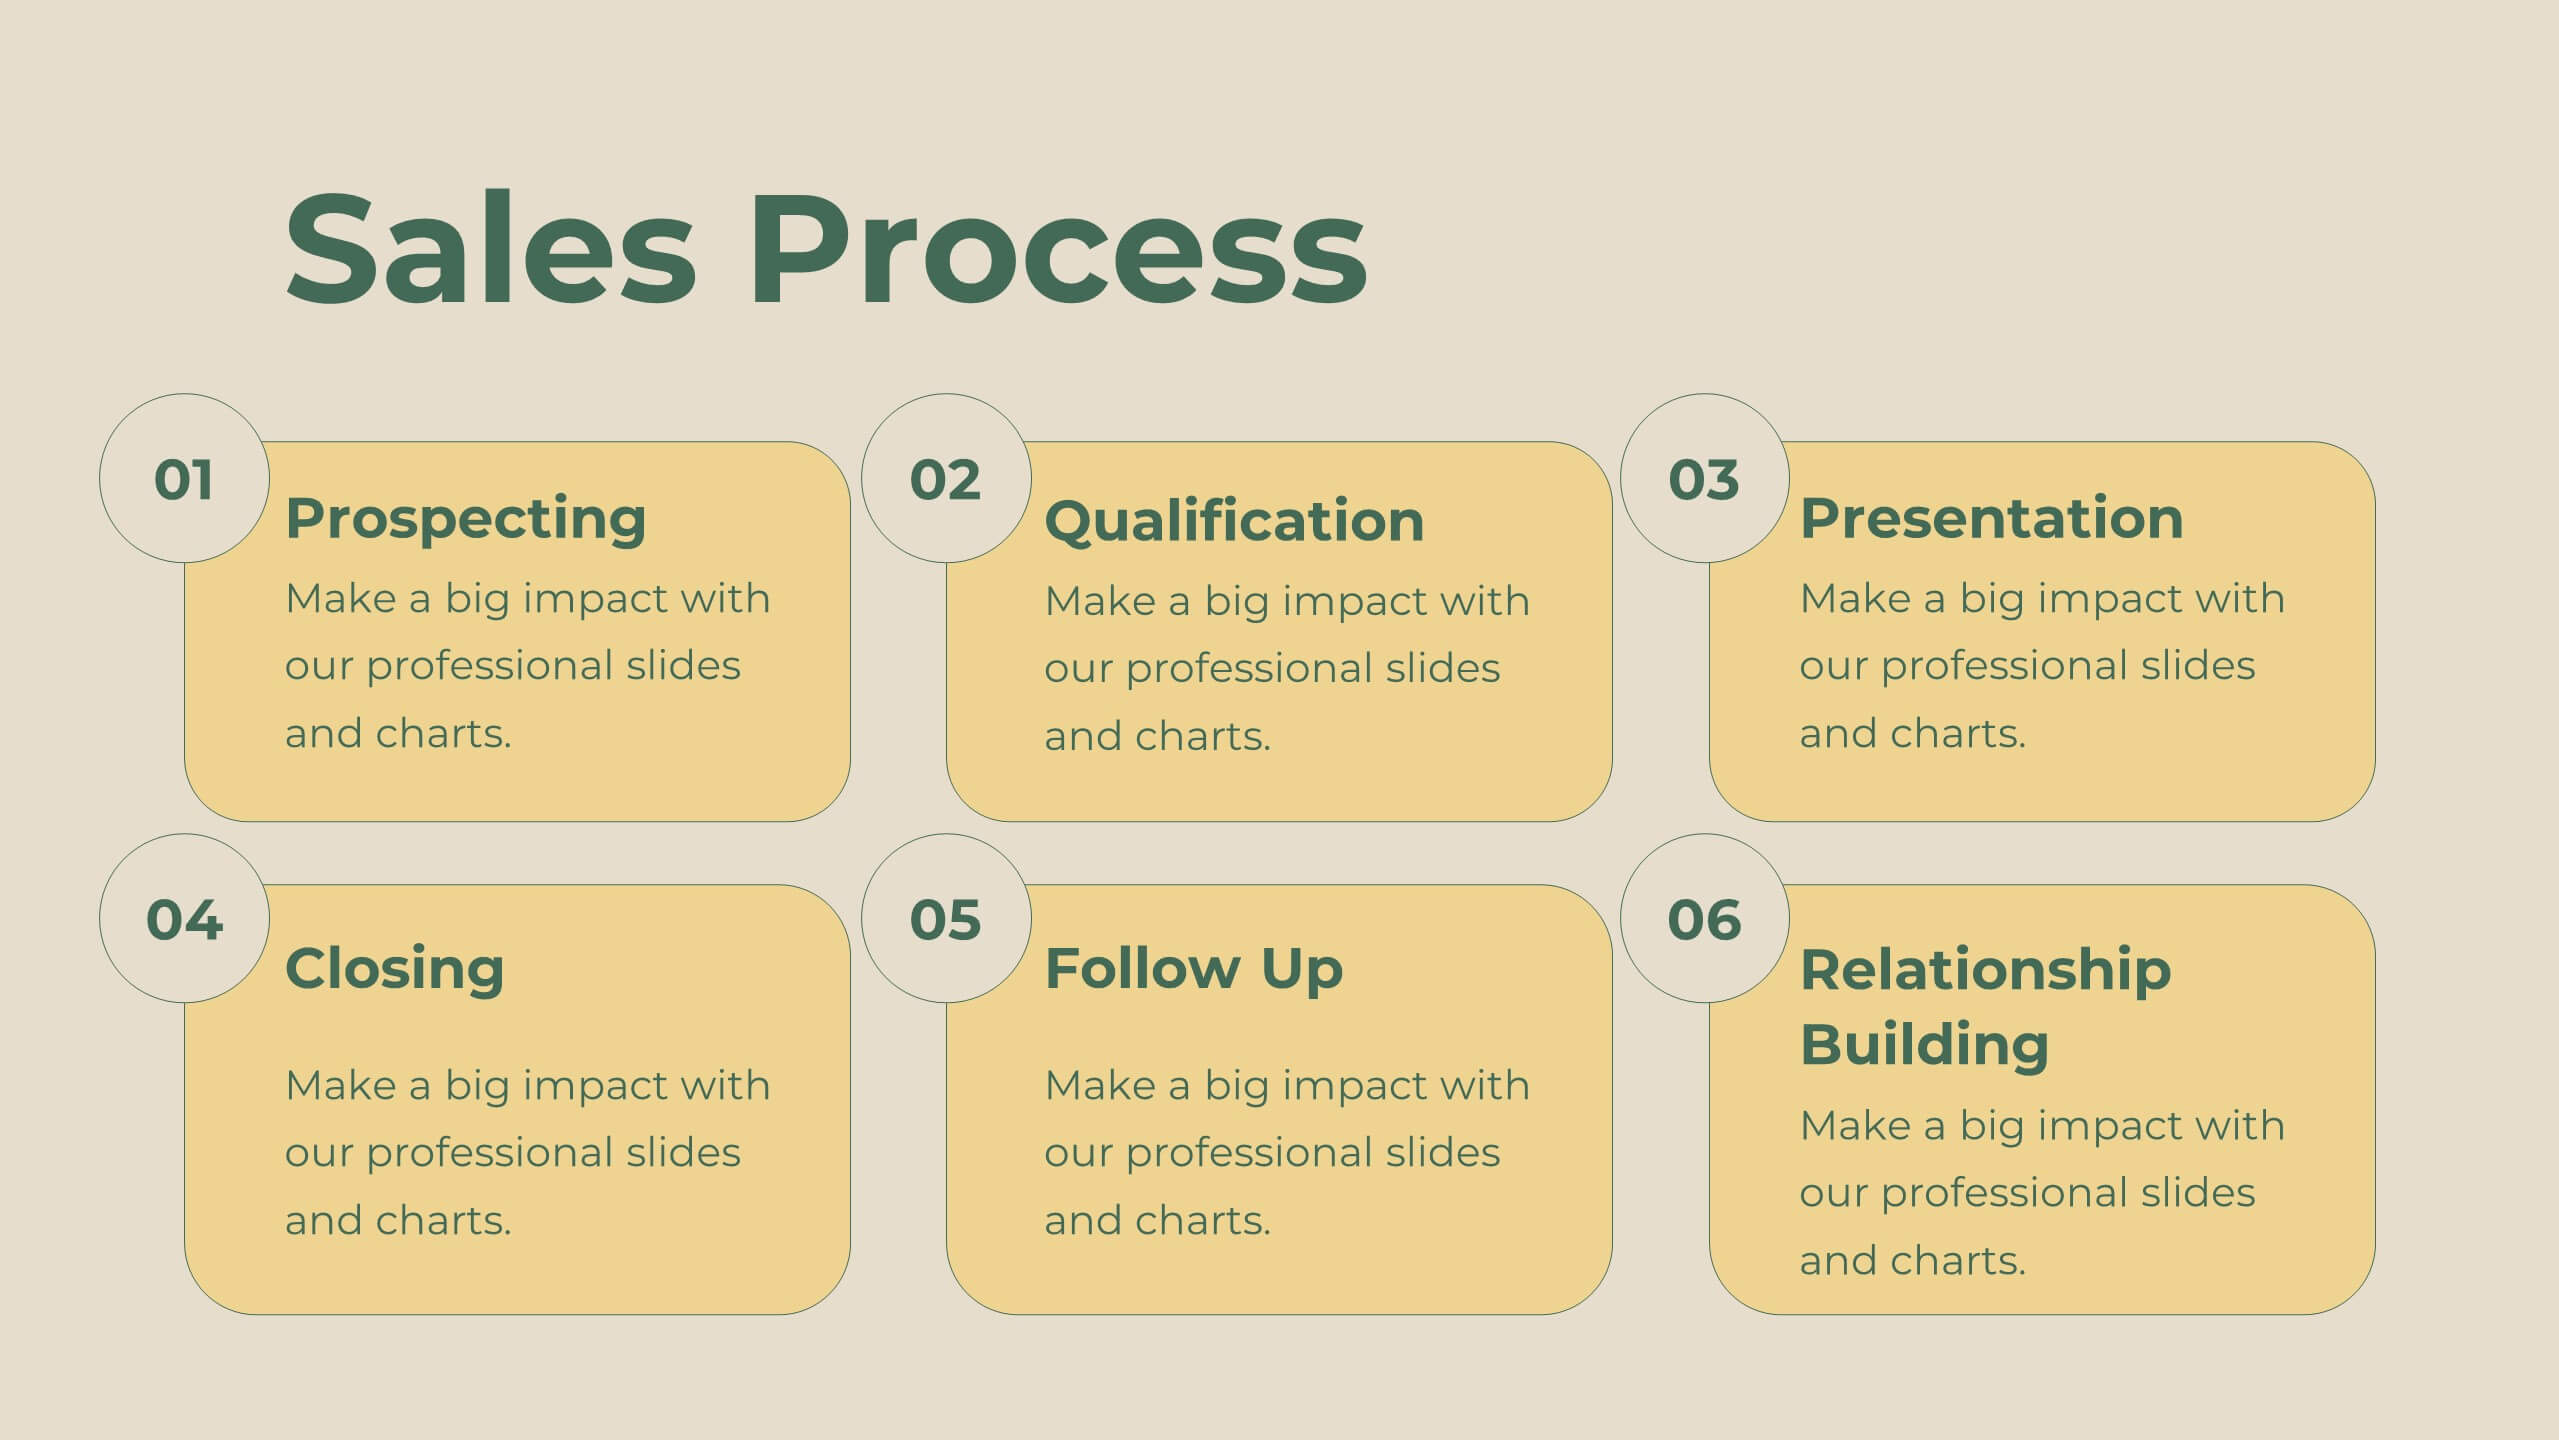
Legacy Sales Strategy Presentation
Boost your sales presentations with this modern template! It features sections for objectives, process, team introduction, customer testimonials, and performance metrics. Ideal for outlining strategies, opportunities, and pricing. Engage your audience with a professional, clean design. Compatible with PowerPoint, Keynote, and Google Slides for seamless integration. Make your sales strategy stand out!


8 slides
Medical Case Study Presentation
Elevate your medical presentations with our "Medical Case Study Presentation" template. This infographic is expertly designed to outline medical case studies or healthcare data, showcasing a central image flanked by related statistics and information. Each segment is linked to a visually distinct icon, representing different health metrics or case points, making it easier to digest complex medical information. This template is perfect for medical professionals, educators, and healthcare analysts, providing a structured way to present findings, research, or patient data effectively. Compatible with PowerPoint, Keynote, and Google Slides, it ensures your medical data is communicated clearly and professionally.


26 slides
Venture Capital Dark Presentation
Present your investment vision with confidence using our Venture Capital presentation template, ideal for PowerPoint, Keynote, and Google Slides. This template is expertly crafted for venture capitalists, startup founders, and financial advisors looking to create persuasive and engaging presentations that attract investment. Our Venture Capital template is designed to showcase the potential of innovative startups to savvy investors. It includes a range of slides that detail market analysis, growth potential, business strategies, and investment opportunities, all laid out in an easy-to-understand format. With this template, you can effectively communicate complex financial data and investment propositions through clear visuals and concise text. Featuring customizable charts, graphs, and diagrams, the template allows for a personalized touch, making it easier to highlight the unique selling points of investment opportunities. Whether you're presenting to angel investors, venture capital firms, or at a funding pitch, this template will help you to articulate your message with clarity and impact. Increase the visibility of your venture capital presentations with our SEO-optimized template and position yourself as a thought leader in the field of investment and startup growth.


5 slides
Geographic Oceania Overview Presentation
Visualize your regional data with a sleek, easy-to-read map highlighting key areas across Oceania. Perfect for presenting geographic insights, business distribution, or market trends, this clean layout ensures every detail stands out clearly. Fully compatible with PowerPoint, Keynote, and Google Slides for simple editing and professional presentations.


26 slides
Flowers Bold Company Profile Presentation
Step into the enchanting garden of happy flowers, where petals dance and colors sing. Our template, awash in sunlit shades of pink, yellow, orange, and blue, encapsulates the very essence of floral joy. Bursting with vibrant graphics, whimsical icons, and cheerful image placeholders, it's a bouquet of design brilliance. Crafted to perfection for Powerpoint, Keynote, or Google Slides. A delightful pick for florists, garden enthusiasts, event planners, or anyone looking to infuse their presentation with a touch of nature's merriment. Blossom your ideas; let your presentations bloom with happiness.


6 slides
Career Objective Infographic
Objective slides help communicate goals, aims, and purpose of the presentation to the audience. This infographic template is a visual representation that communicates your career goals, aspirations, and the value you bring to potential employers. This template serves as a roadmap for your presentation, helping both you and your audience understand the purpose and direction of your objective. Compatible with Powerpoint, Keynote, and Google Slides. This showcases your career objectives and key qualifications. Use a design that reflects your industry and personal brand while conveying your career objectives effectively.


4 slides
Product Life Cycle Stages Explained Presentation
Turn complex business growth phases into a clear visual journey with this clean, modern layout. Ideal for explaining product development, marketing strategies, or performance tracking, it helps you communicate each stage with precision and style. Fully editable and compatible with PowerPoint, Keynote, and Google Slides for seamless customization.


21 slides
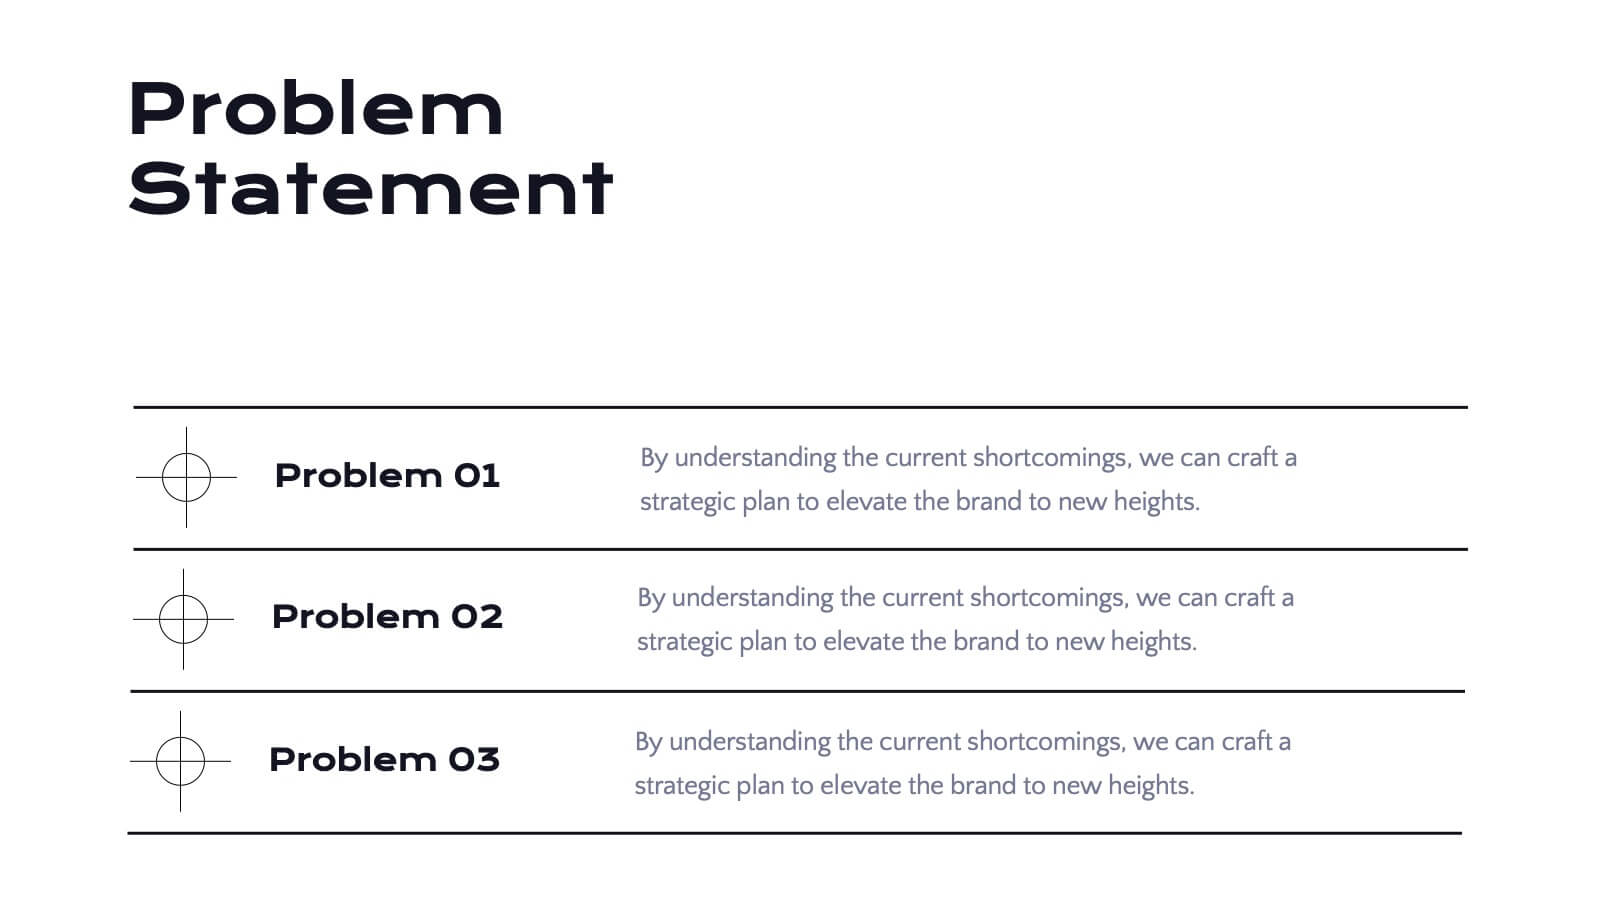
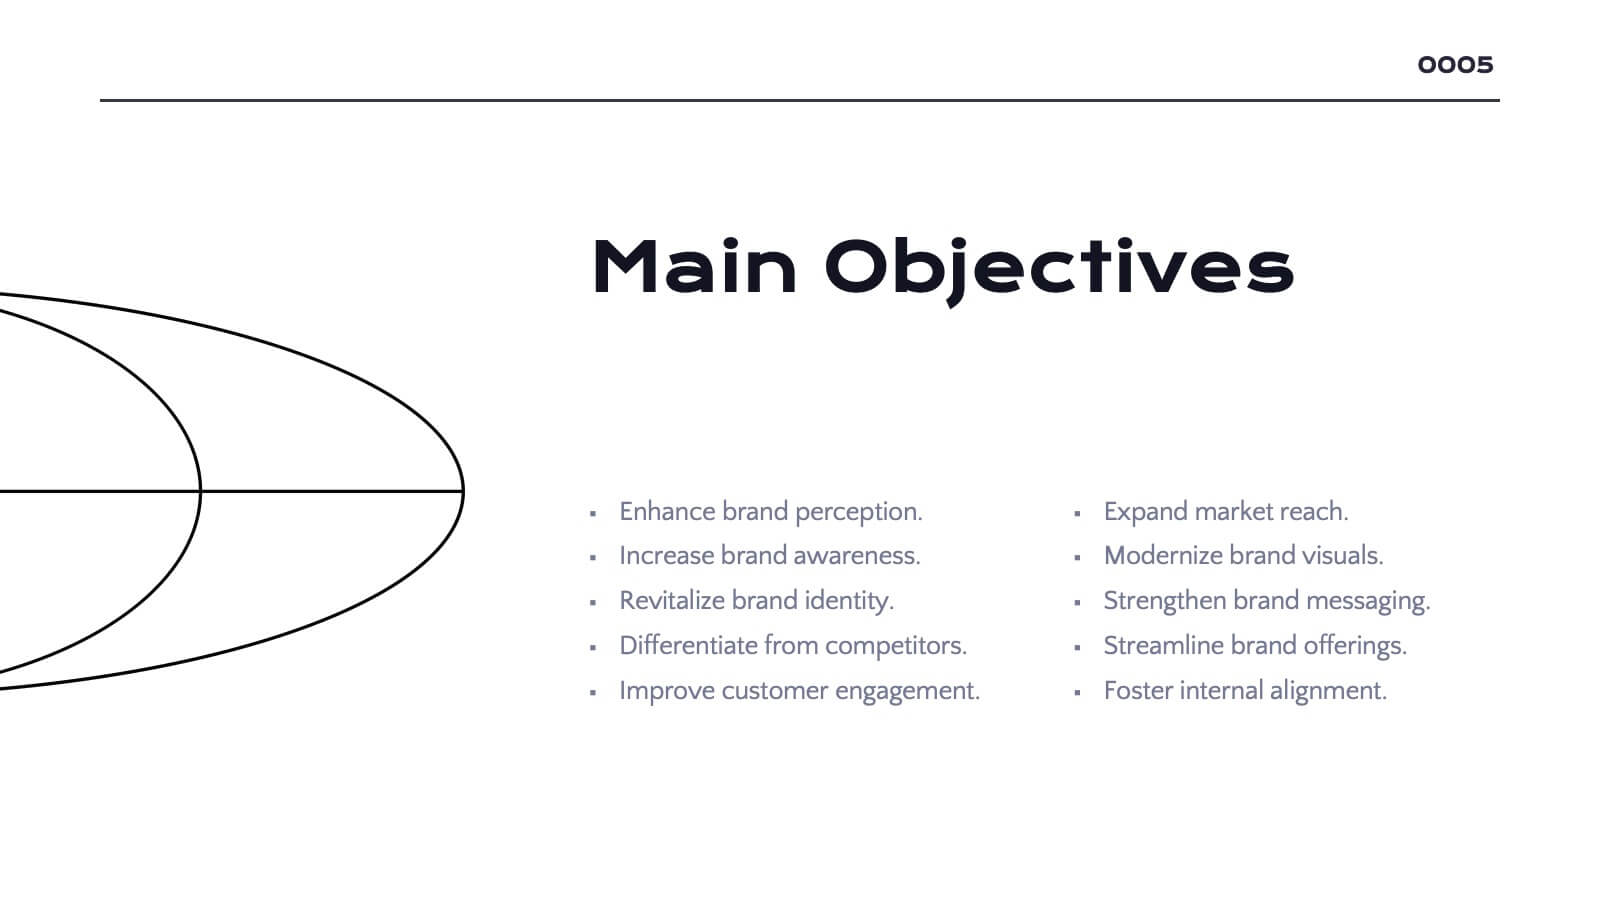
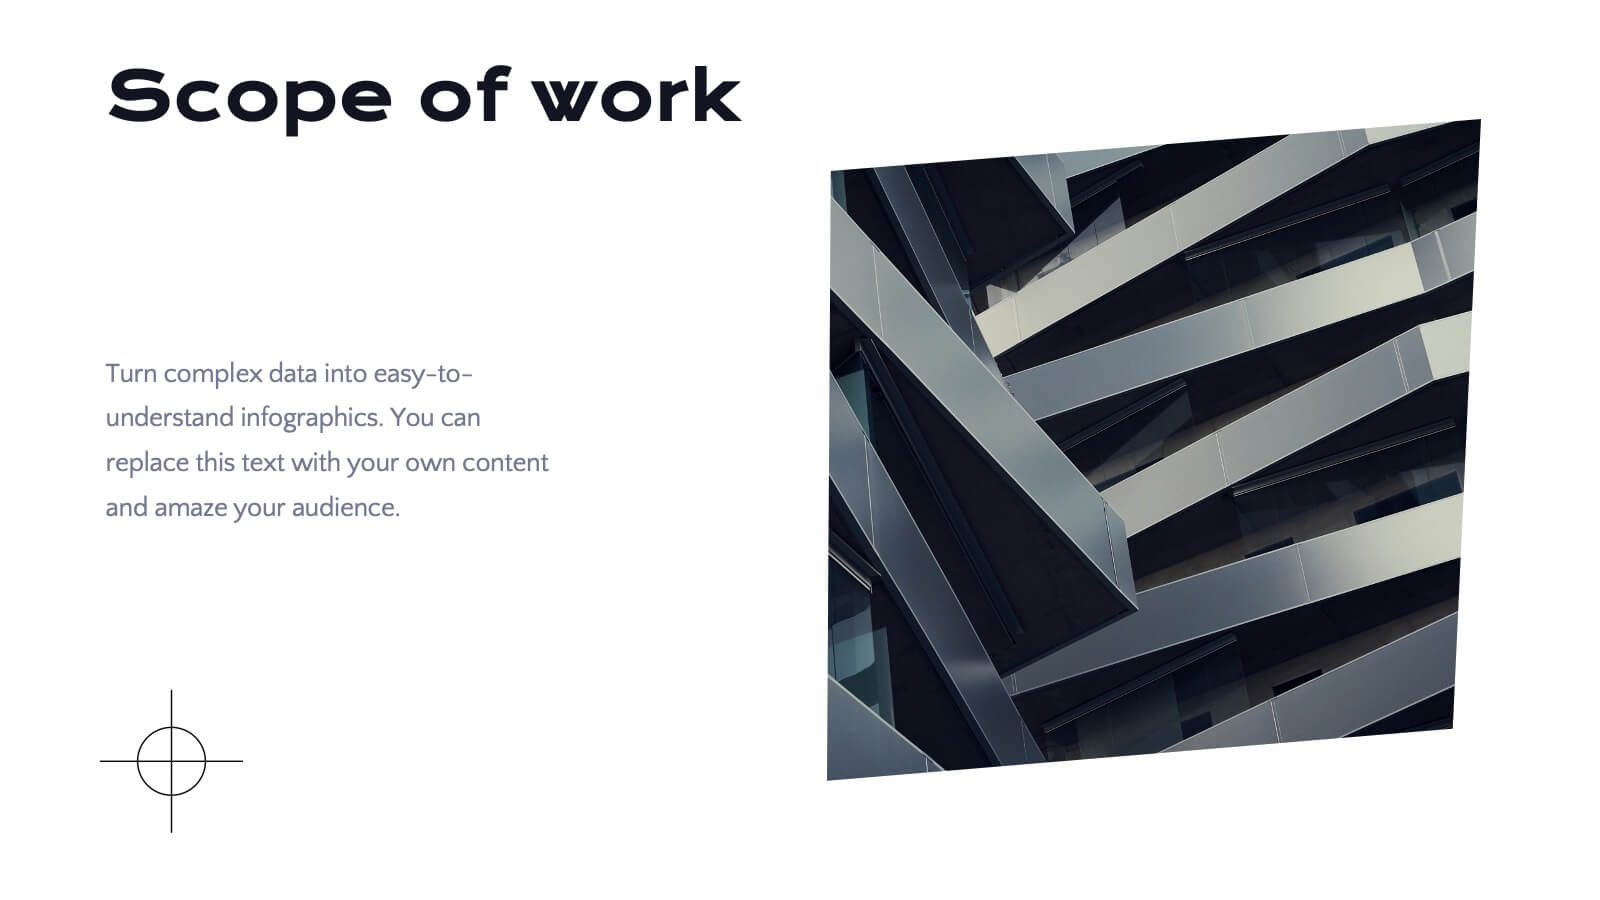
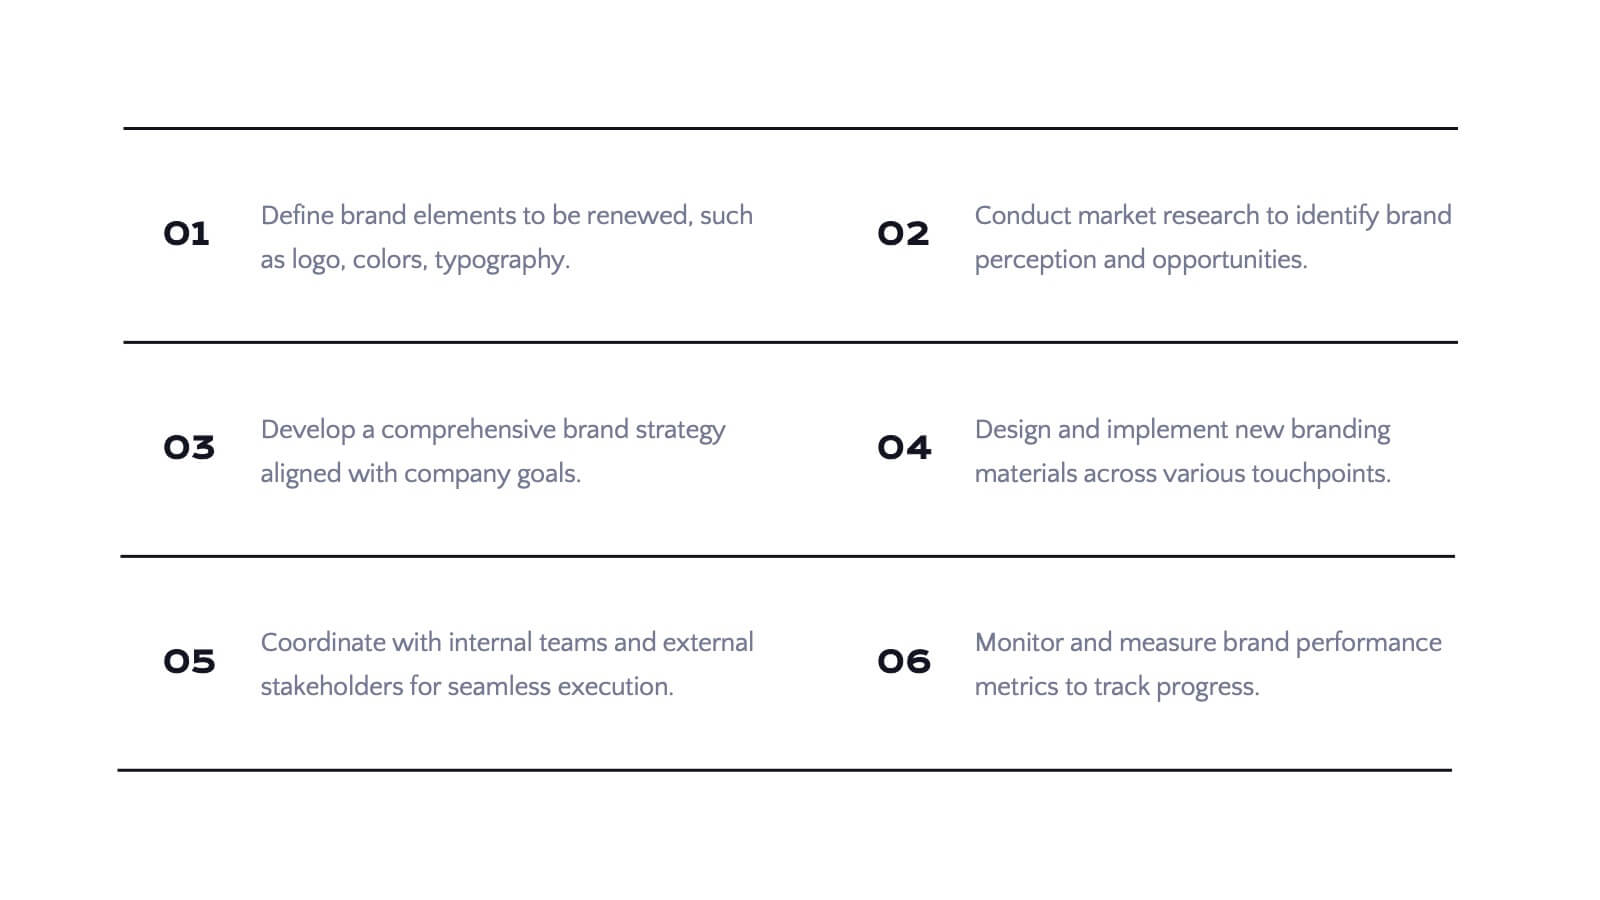
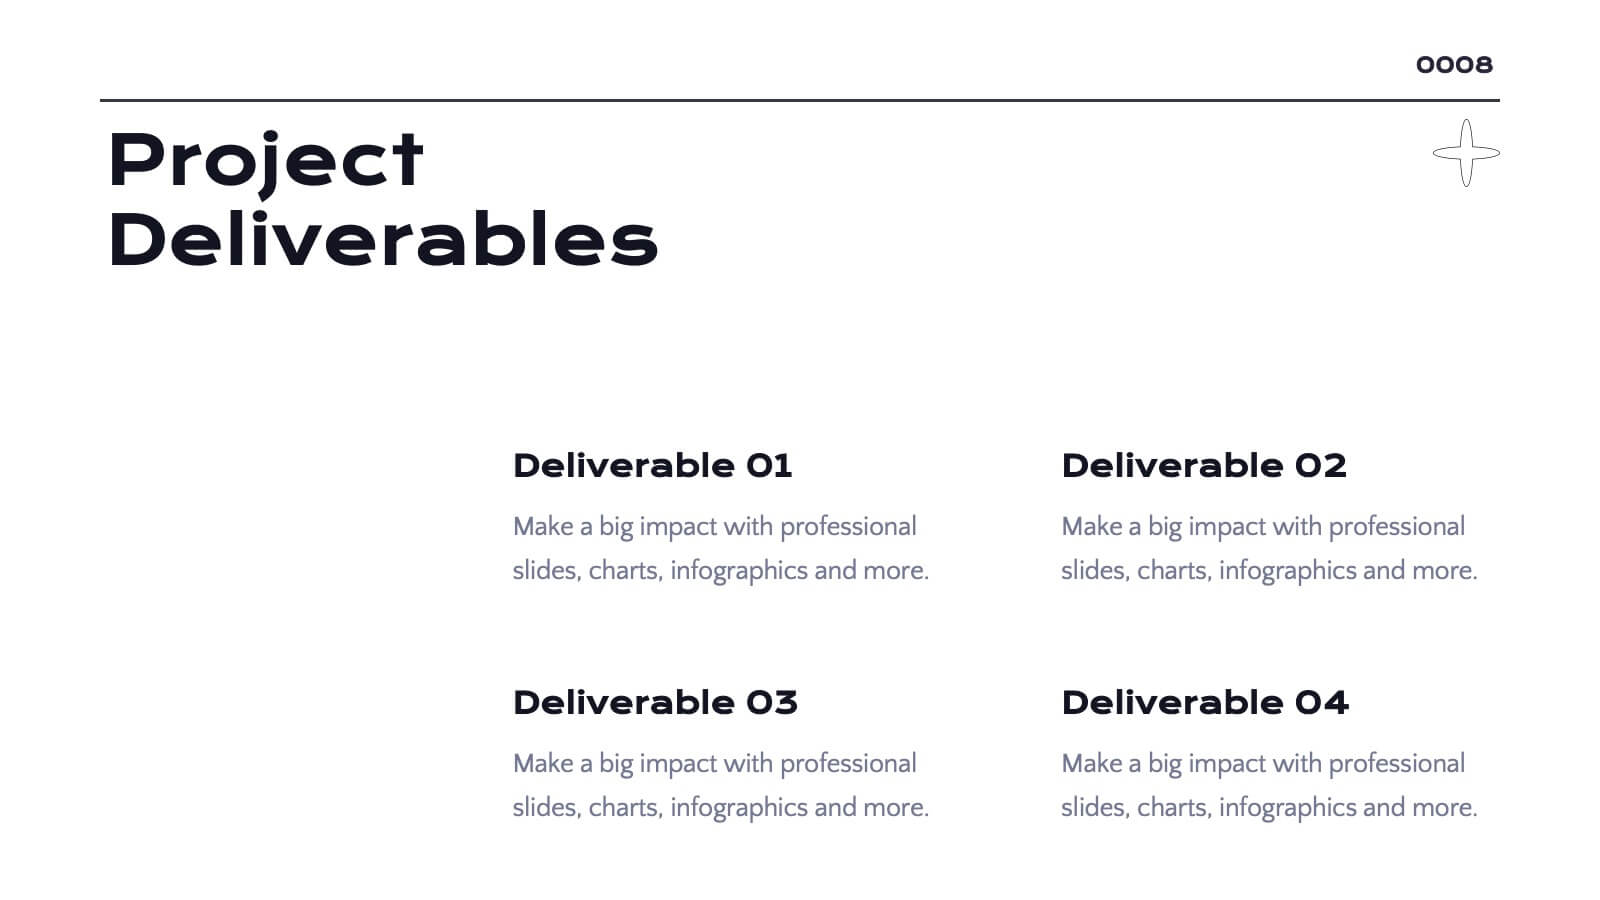
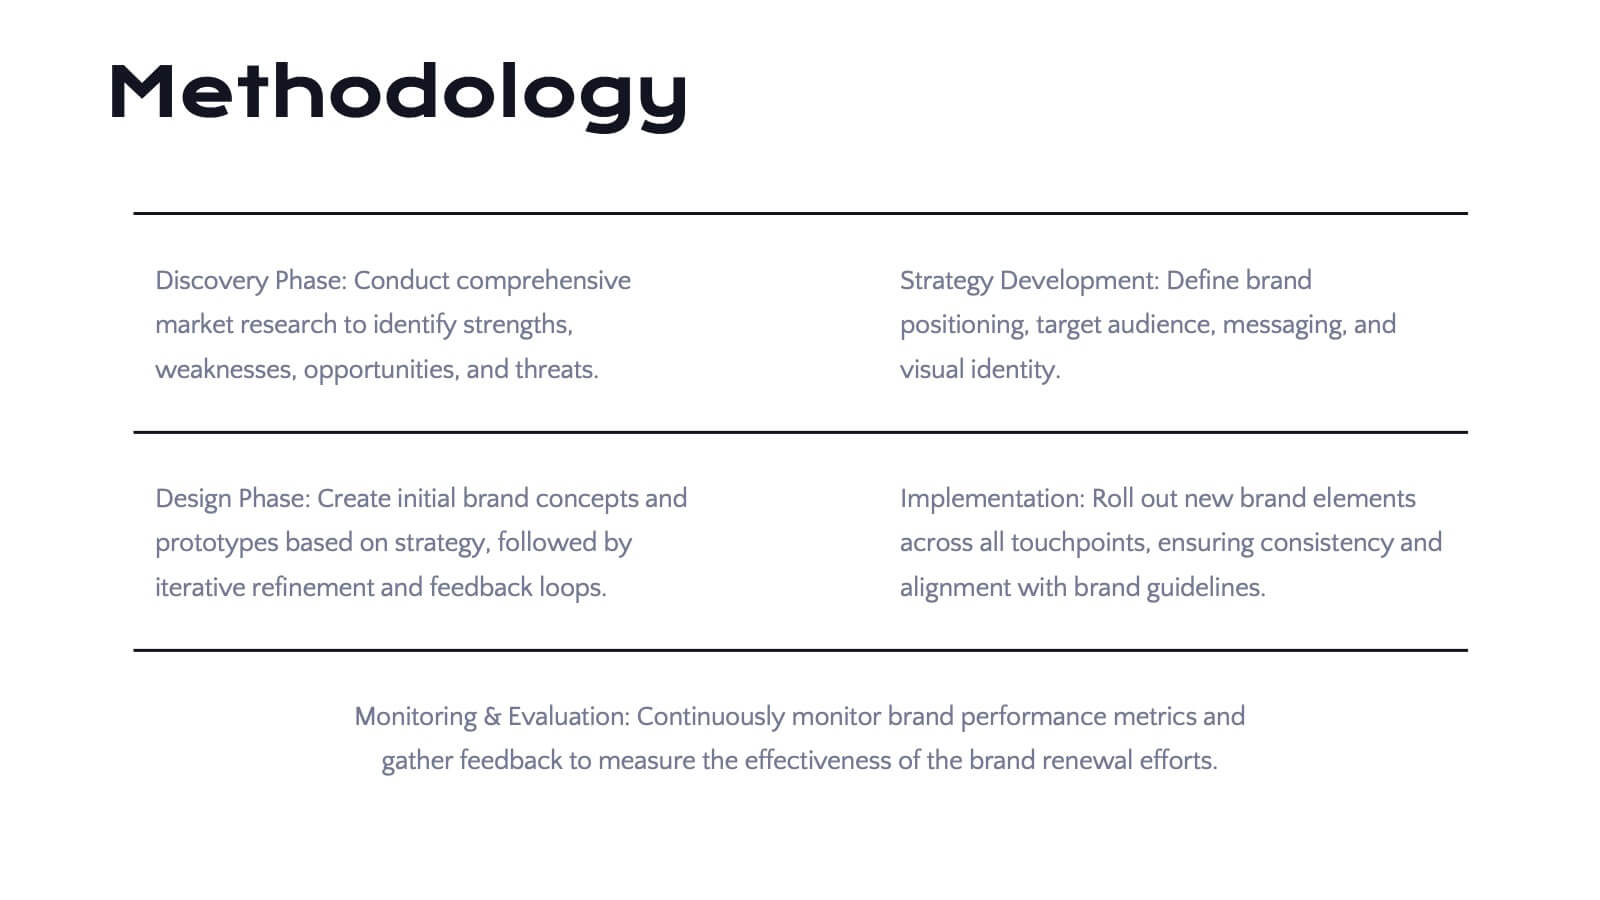
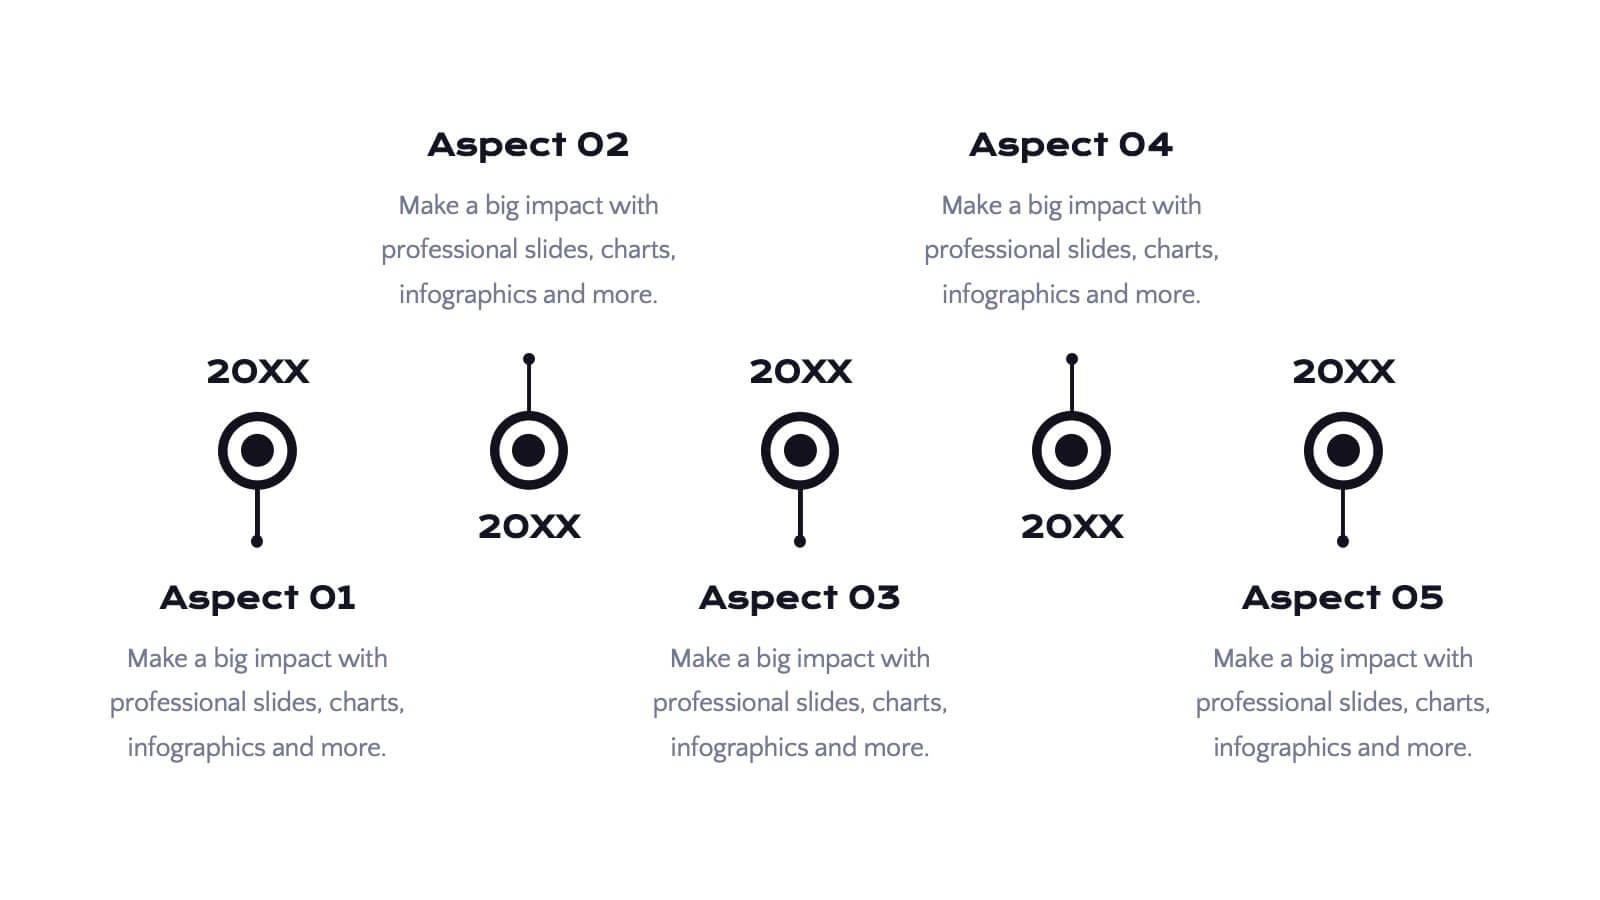
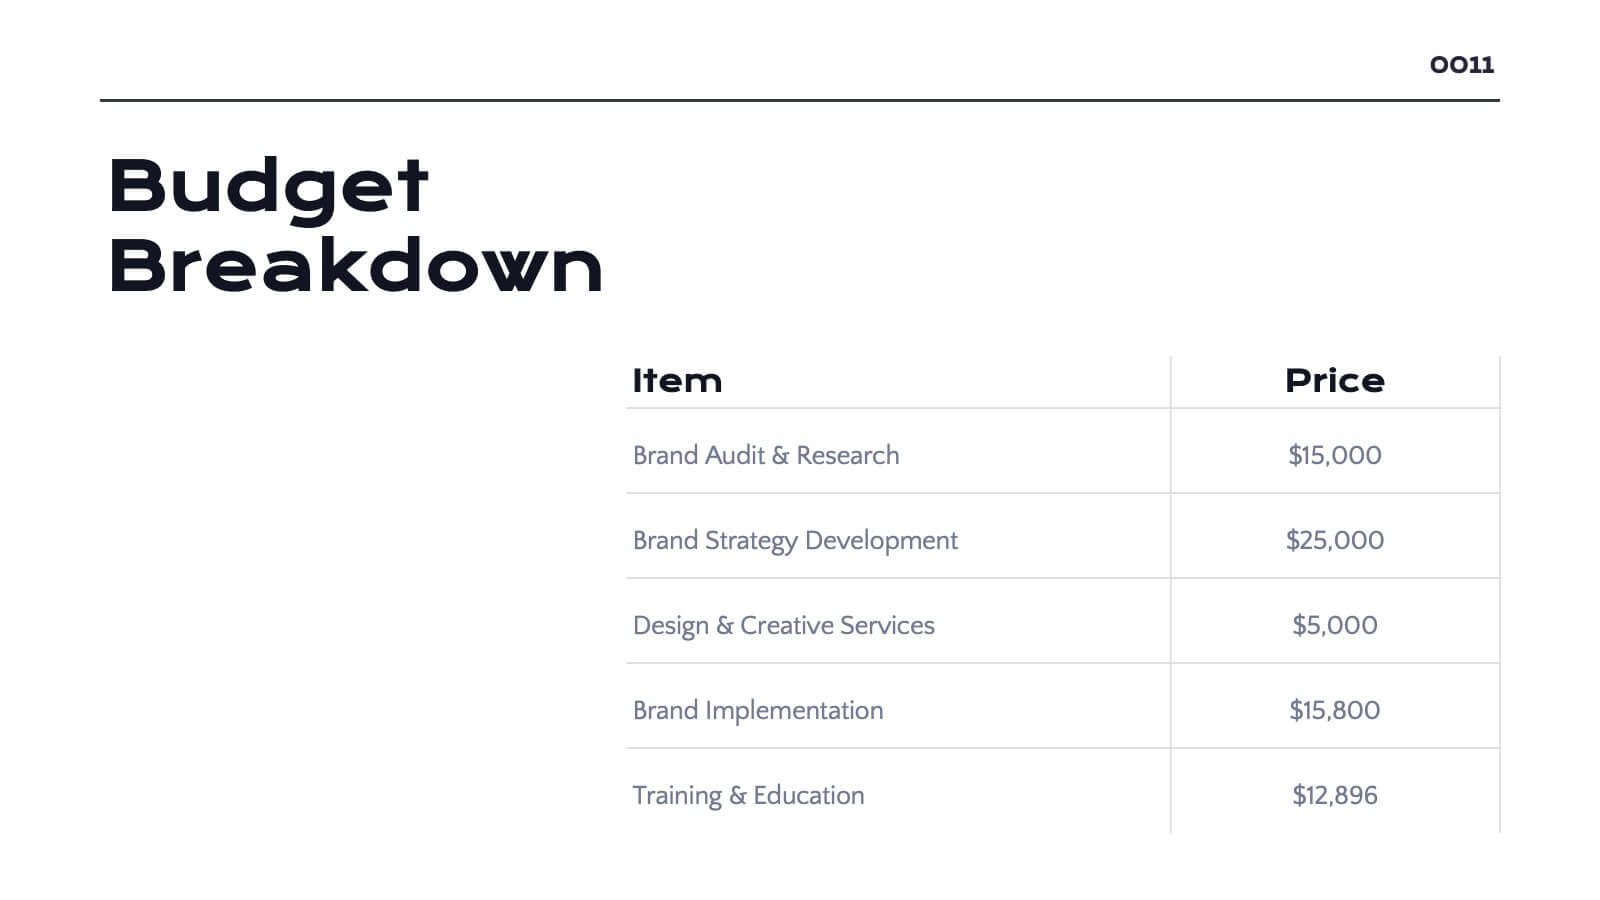
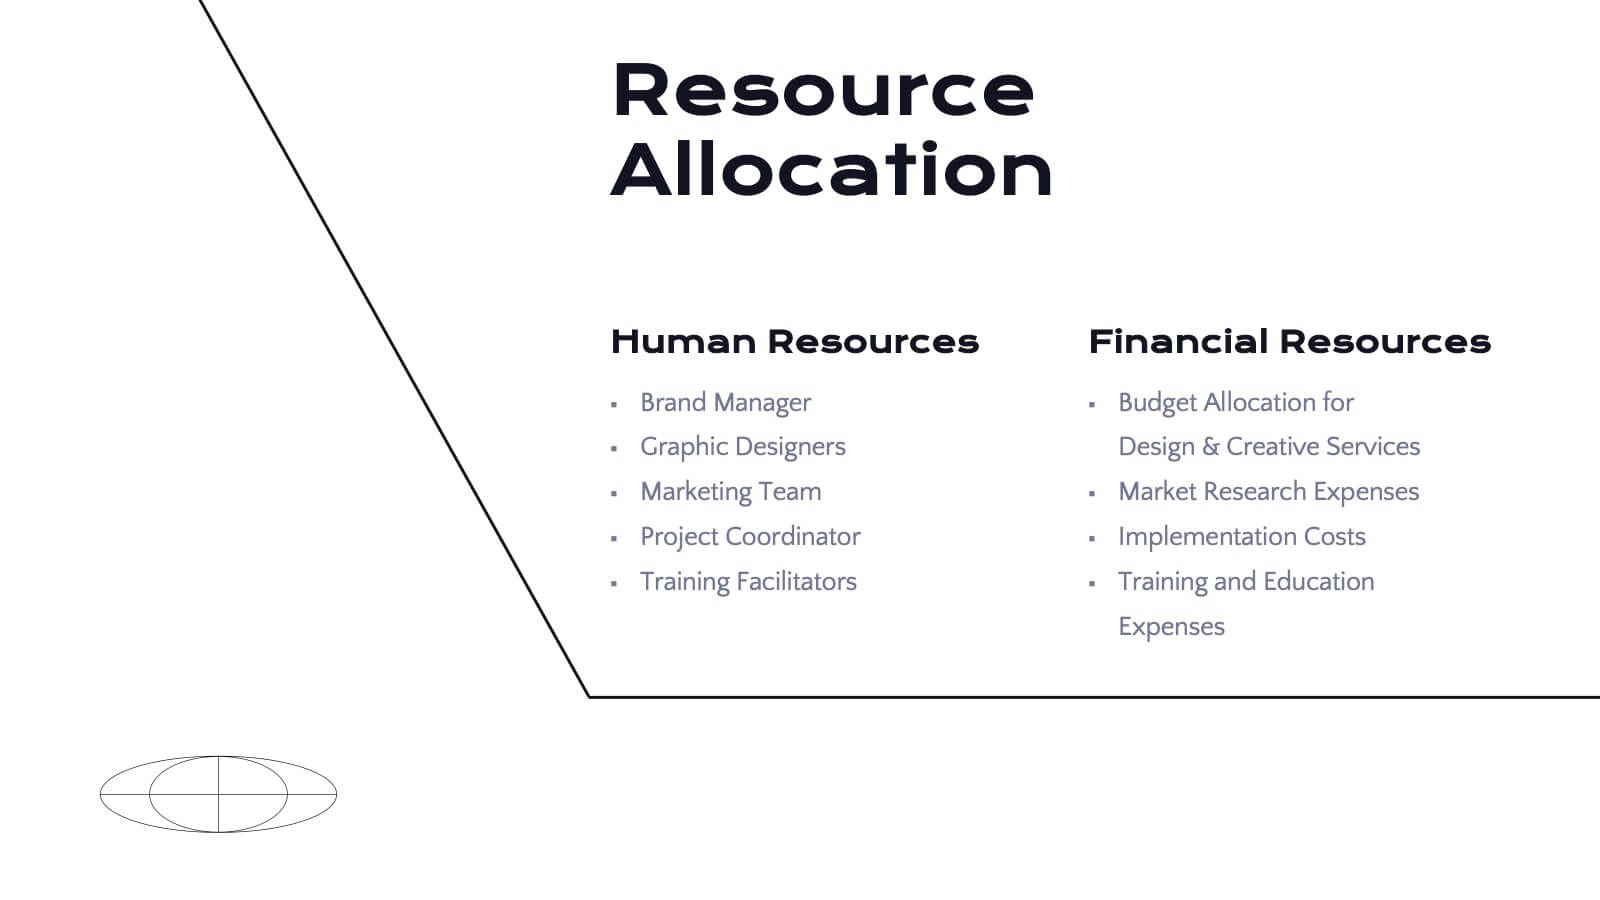
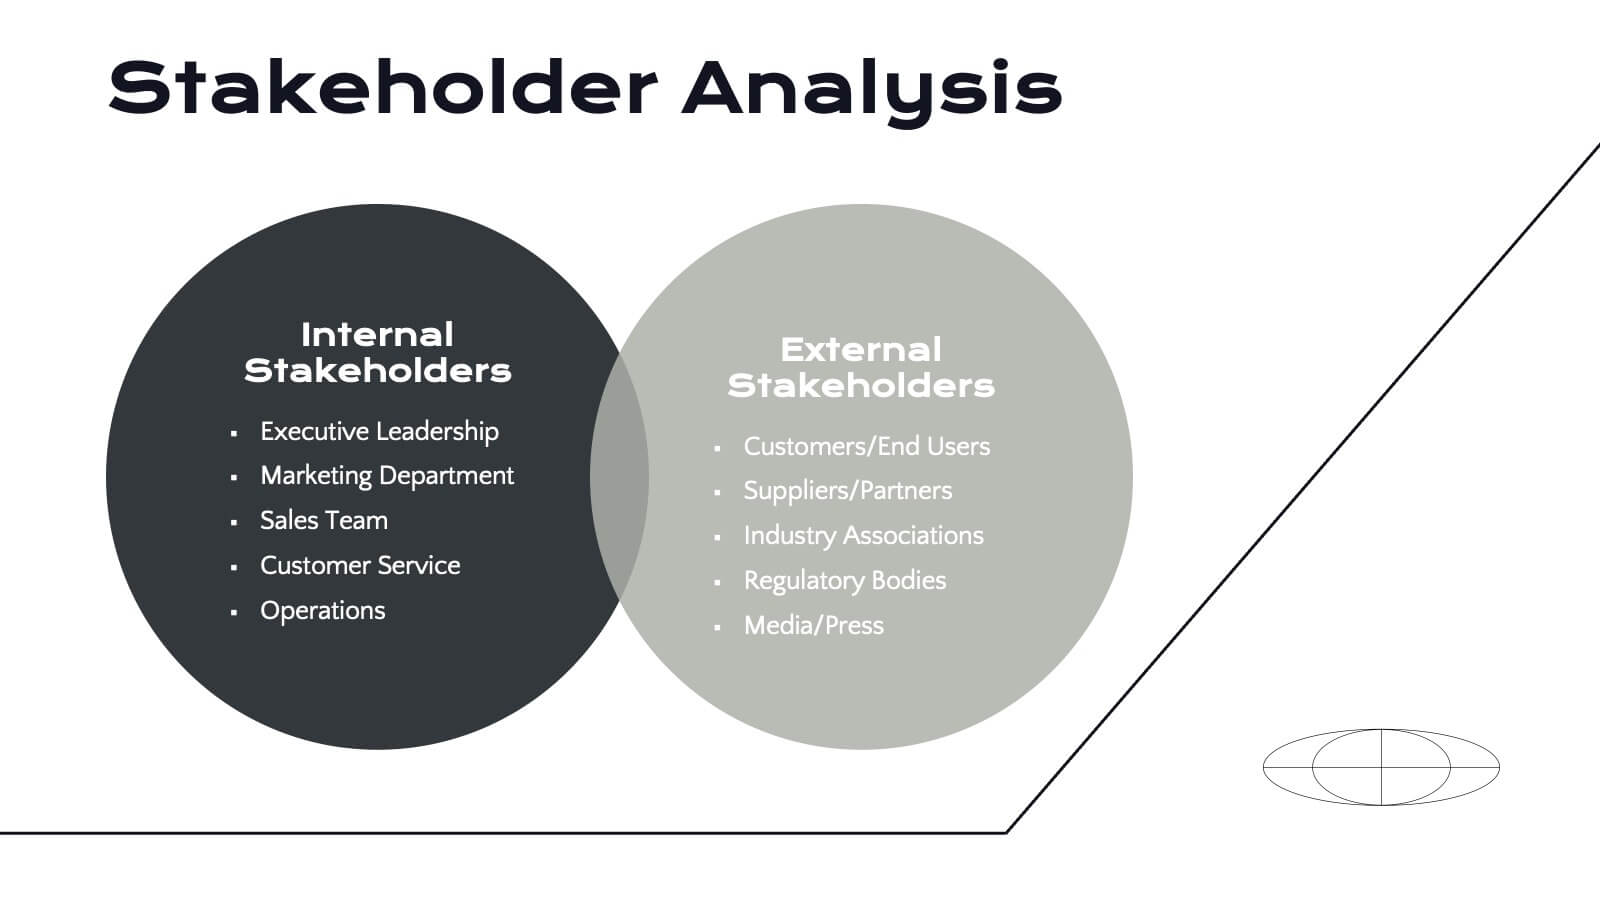
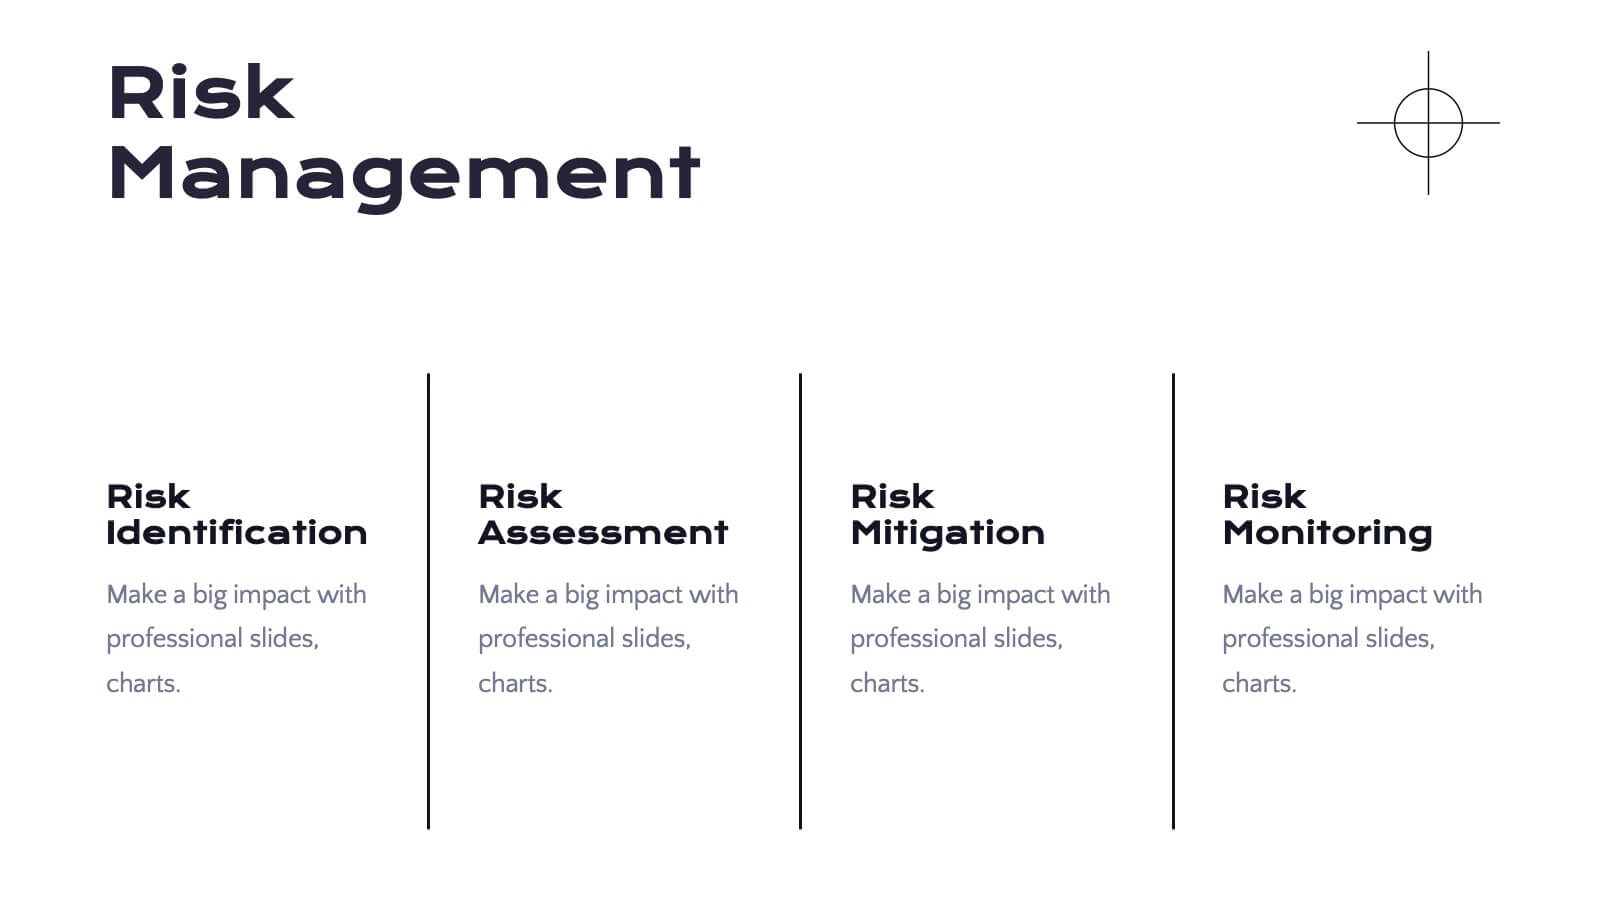
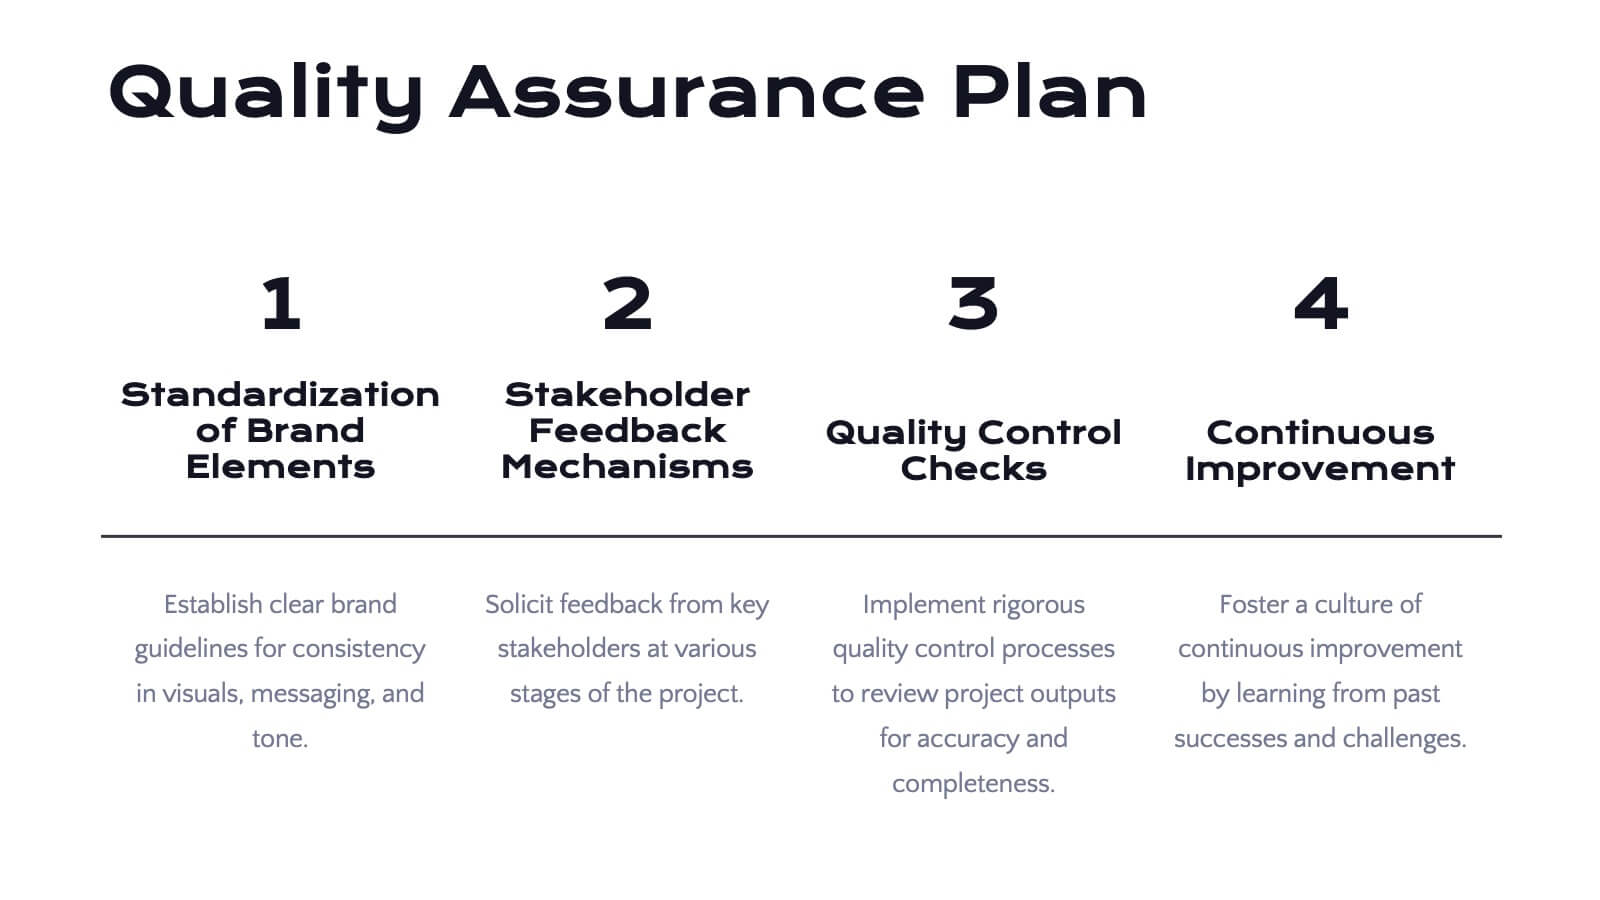
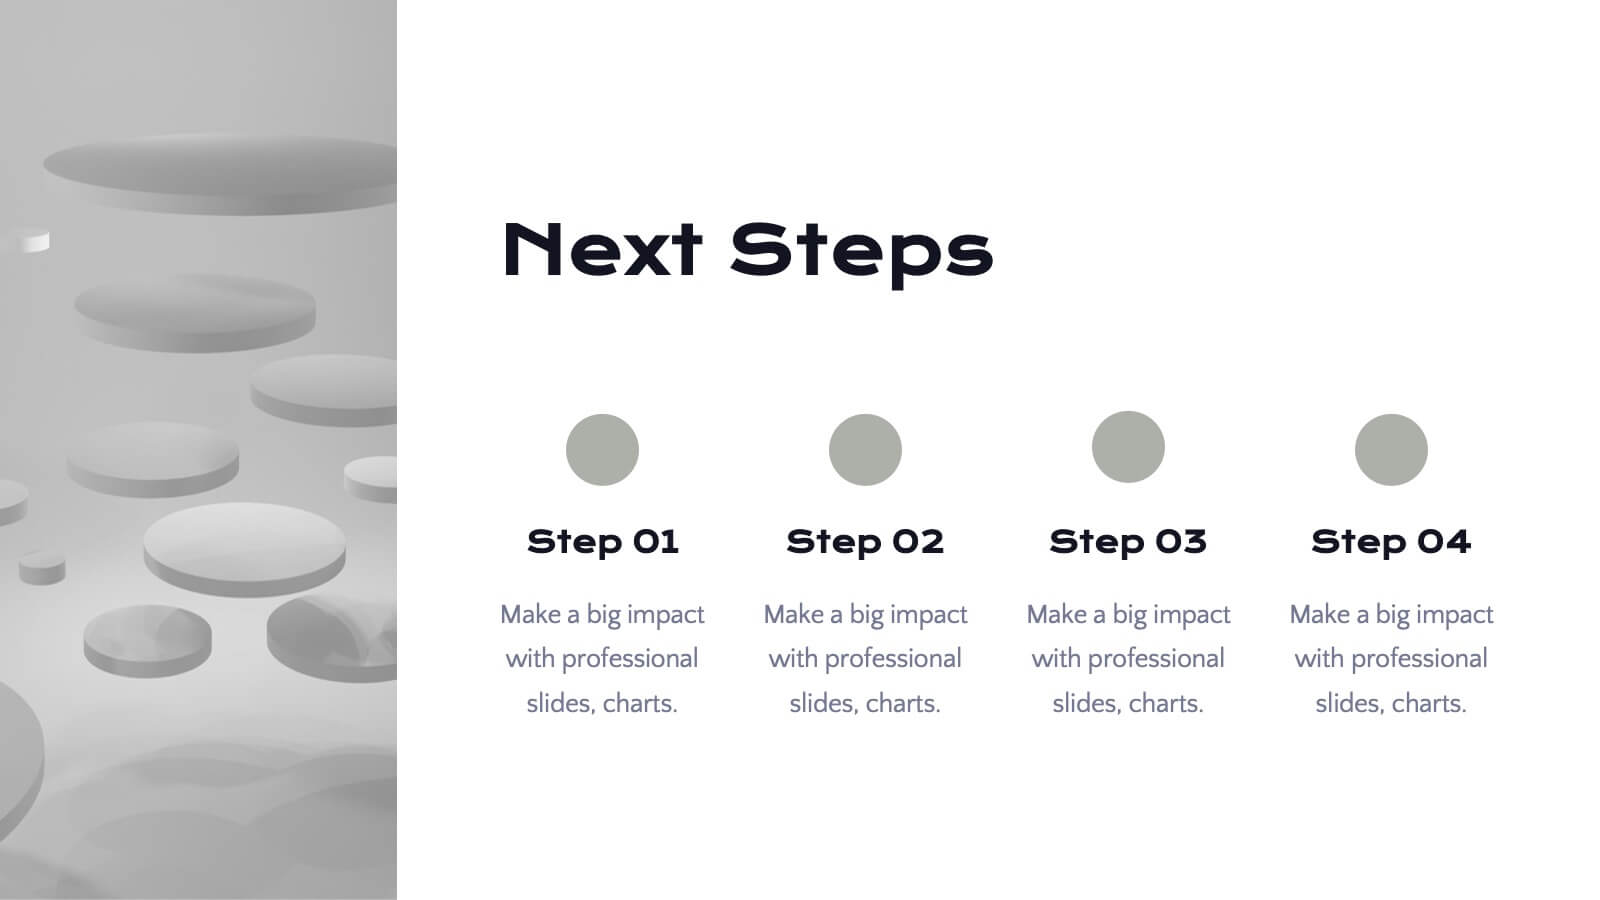
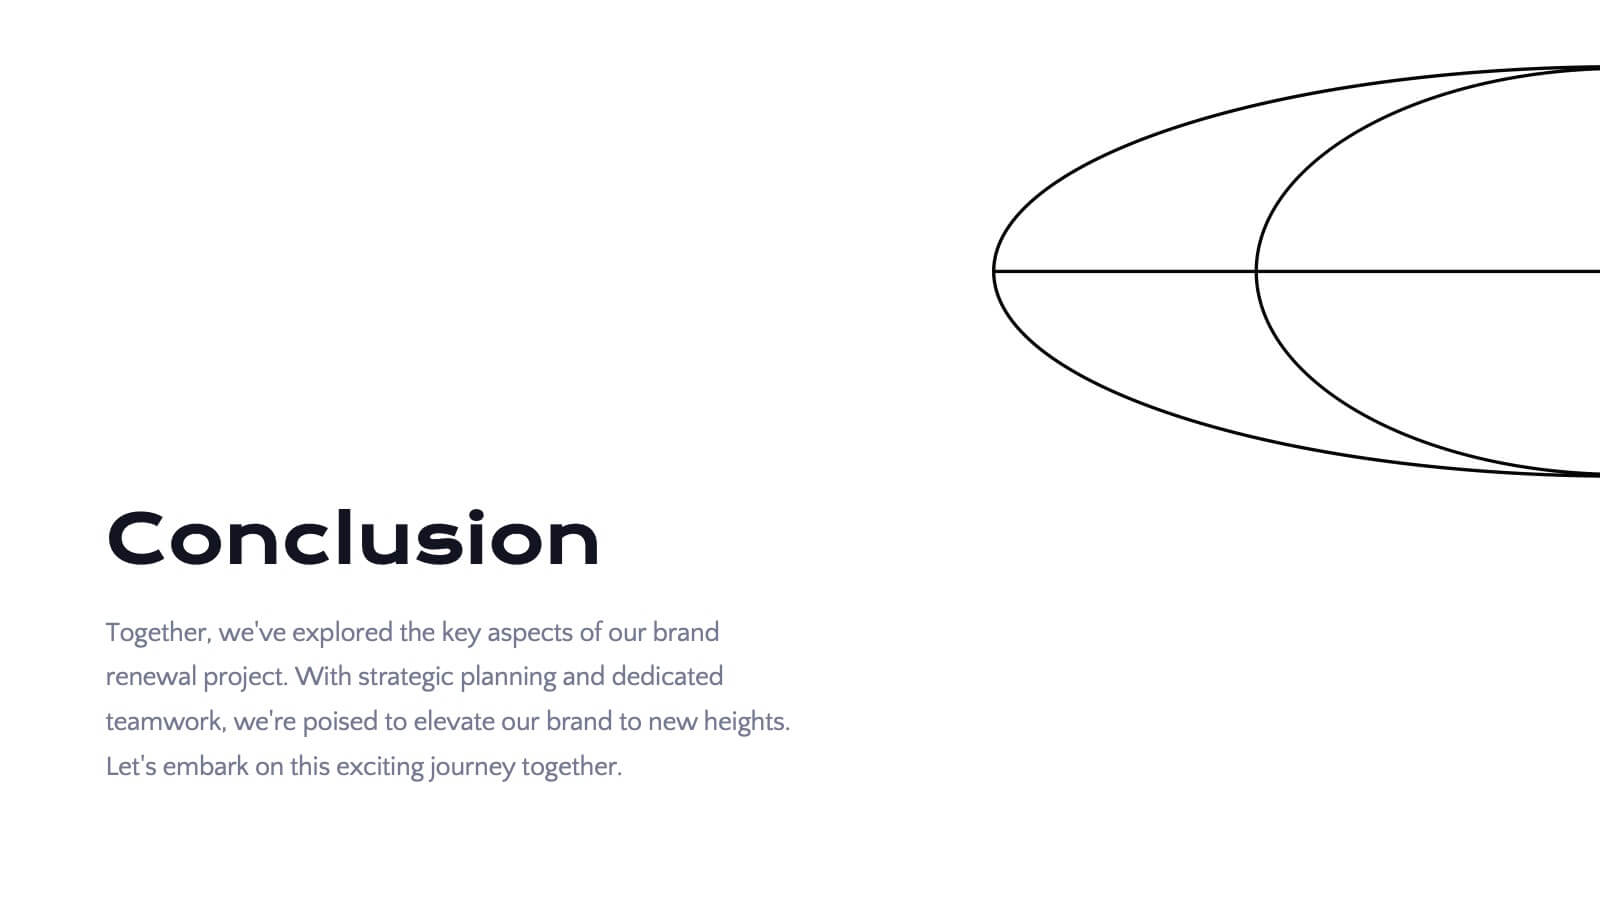
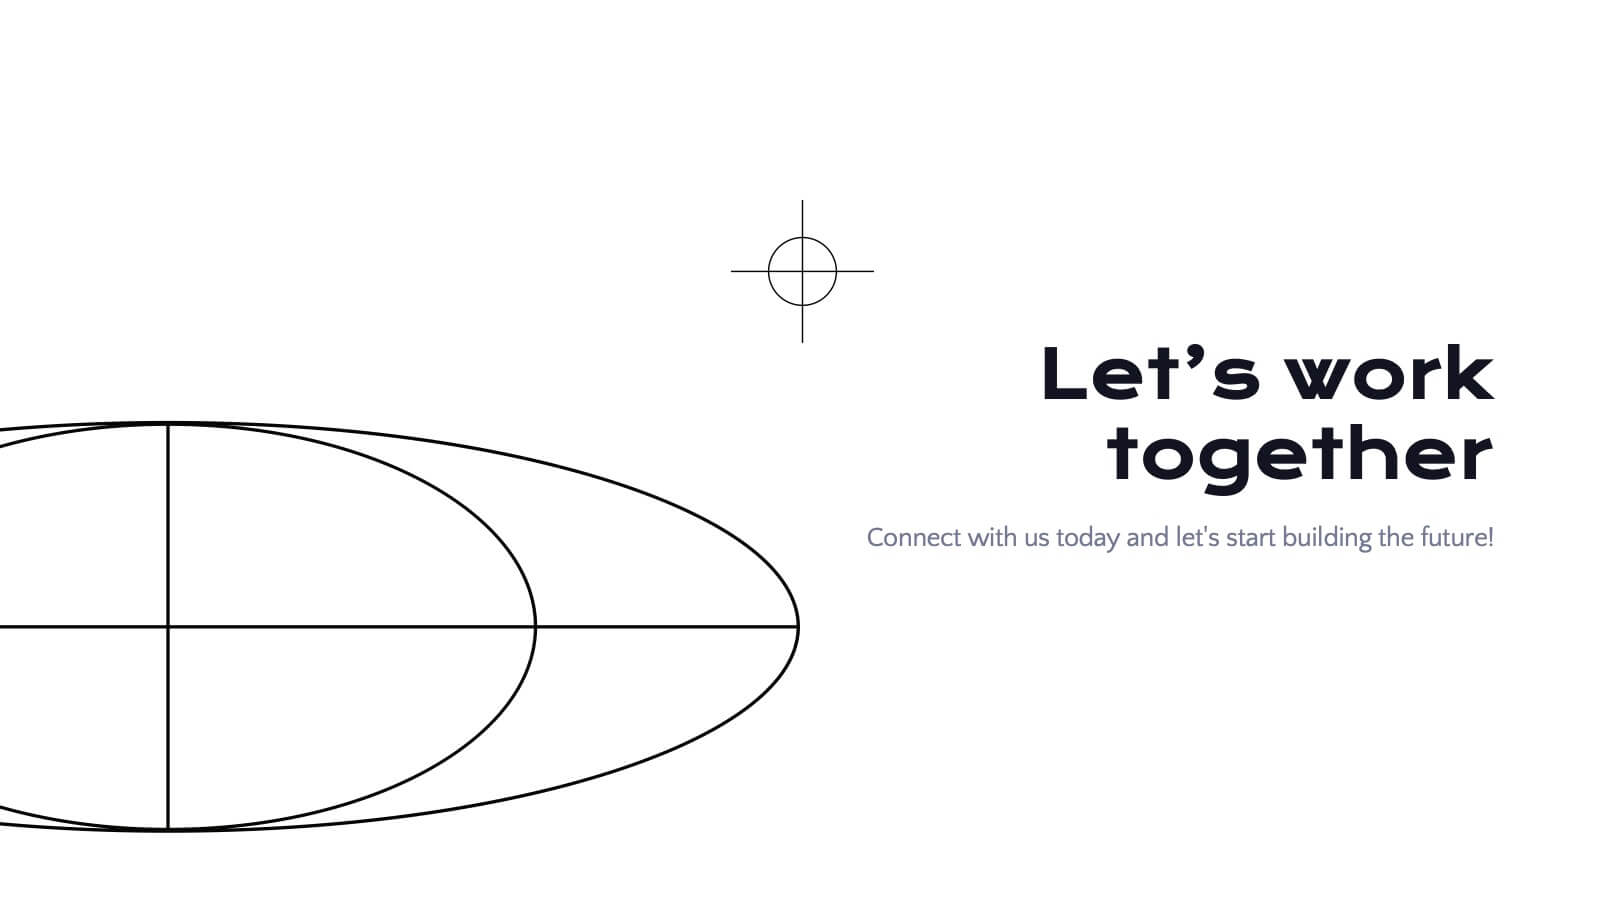
Radiance Detailed Project Execution Plan Presentation
Elevate your project execution presentations with this sleek template, covering everything from objectives to timelines and budget breakdowns. It's perfect for aligning your team and stakeholders. Compatible with PowerPoint, Keynote, and Google Slides, it ensures professionalism and clarity in showcasing your project plans.