


Features
- 24 Unique Slides
- Fully editable and easy to edit in Microsoft Powerpoint, Keynote and Google Slides
- 16:9 widescreen layout
- Clean and professional designs
- Export to JPG, PDF or send by email


Do you have any questions?
Recommend


5 slides
Problem Framing and Opportunity Identification Presentation
Spot challenges and uncover growth potential with this Problem Framing and Opportunity Identification presentation. Ideal for strategy sessions, this layered pyramid layout helps you organize problems from surface-level to root causes while aligning them with strategic opportunities. Fully editable in Canva, PowerPoint, or Google Slides for seamless customization.


24 slides
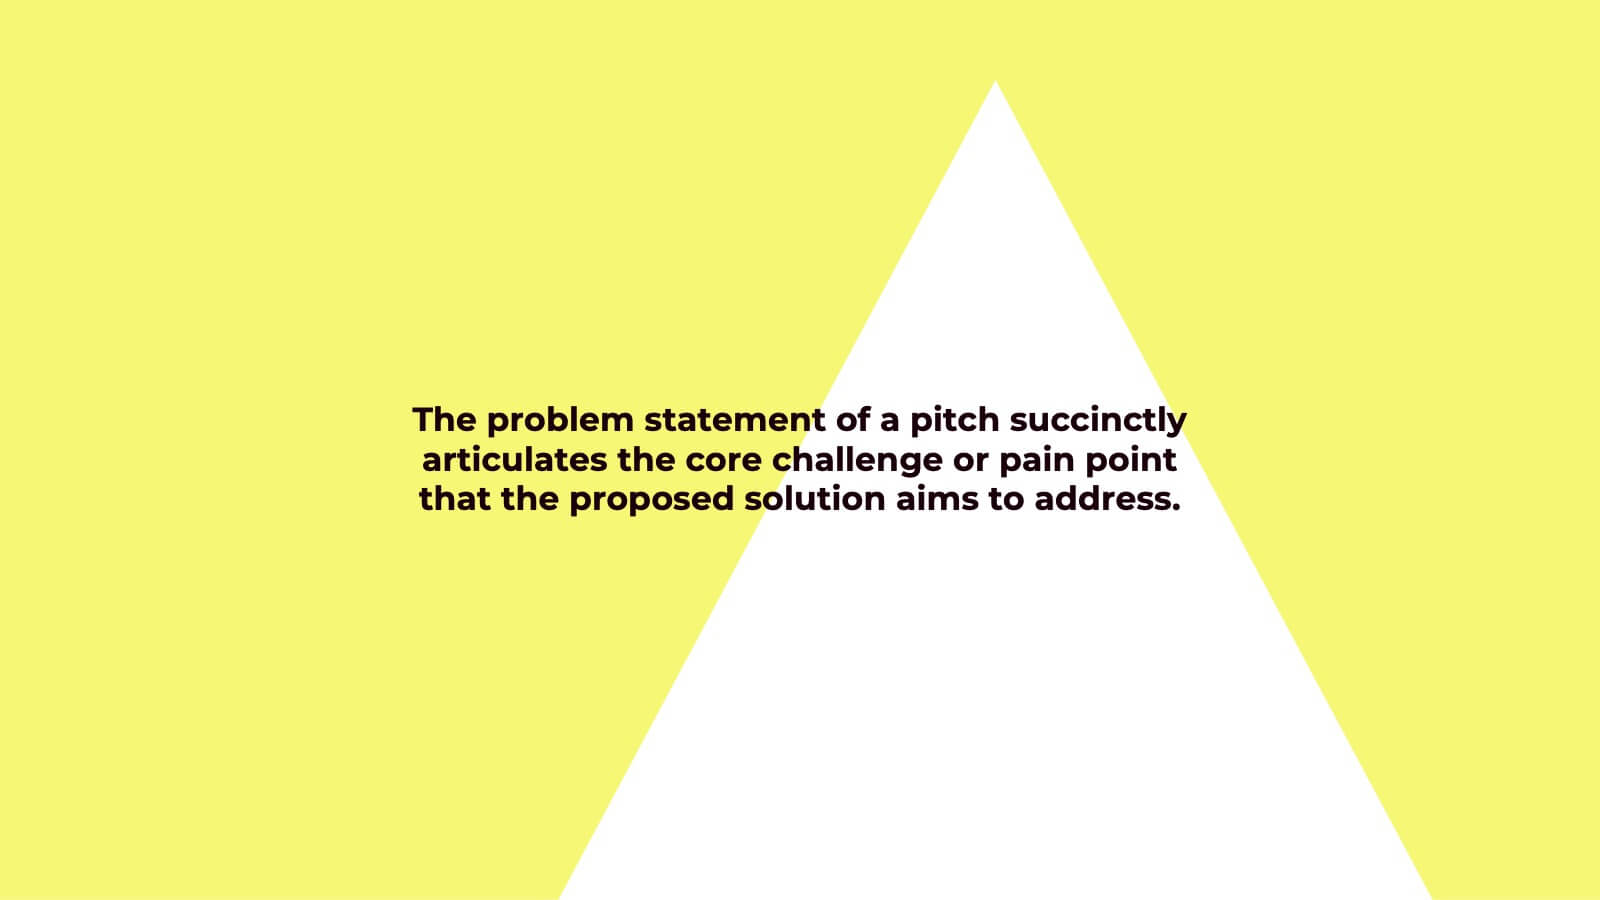
Kepler Investor Pitch Presentation
Impress potential investors with this thoughtfully crafted investor pitch presentation template. Its sleek design is tailored to captivate attention while delivering a clear and concise narrative about your business. Highlight key sections, including your company overview, problem statement, and innovative solutions, all designed to set you apart from the competition. Dive deep into your market opportunities, target audience, and revenue model, using visually engaging layouts and infographics. Showcase growth projections, financial overviews, and funding requirements with clarity and professionalism. Additionally, present your unique selling proposition, milestones, and risk analysis effectively. With dedicated slides for team introductions and a compelling close, this template is perfect for startups and established businesses alike. Fully customizable and compatible with PowerPoint, Google Slides, and Keynote, it ensures seamless branding and adaptability for any presentation. Engage your audience and secure the investment you need!


6 slides
Business Tree Diagram Layout Presentation
Bring your ideas to life with a dynamic visual flow that connects every stage of your business strategy. Perfect for mapping growth, processes, or team structures, this clean and modern layout keeps your data clear and engaging. Fully compatible with PowerPoint, Keynote, and Google Slides for effortless customization.


4 slides
Corporate Strategy Business Case Presentation
Develop a winning corporate strategy with this structured business case template! Perfect for analyzing finances, operations, market trends, and client insights, this clean and organized layout helps businesses communicate key strategies effectively. Fully customizable and compatible with PowerPoint, Keynote, and Google Slides for seamless, professional presentations.


5 slides
Project Scope Management Structure Presentation
Zoom in on every critical stage with the Project Scope Management Structure Presentation. This visual template uses magnifying glass graphics to represent five key project phases, helping you highlight detailed scope elements clearly. Fully editable in PowerPoint, Keynote, and Google Slides, it's perfect for structured planning and reporting presentations.


4 slides
Business Partnership Development Presentation
Showcase key elements of collaboration with the Business Partnership Development Presentation. This quadrant-style layout is perfect for outlining strategies, stakeholders, or phases of a partnership. Ideal for business proposals, joint ventures, and strategic planning decks. Fully editable in PowerPoint, Keynote, and Google Slides.


21 slides
Fablelight Digital Agency Strategy Plan Presentation
This sleek and modern presentation template is designed to effectively communicate a strategic plan for any professional agency. It includes sections for mission and vision, team structure, services offered, and a detailed creative process. Dive into market analysis, industry trends, and case studies to showcase expertise and success stories. Strategy development, campaign execution, and measurement analytics are highlighted to demonstrate goal-oriented planning. Client testimonials, partnerships, social impact initiatives, and awards provide credibility and enhance trust. Fully customizable and compatible with PowerPoint, Keynote, and Google Slides.


5 slides
Customer Retention and Loyalty Marketing Presentation
Showcase your loyalty strategies in a visually compelling way with this modern shopping cart-themed slide. Ideal for outlining customer retention initiatives, this template highlights five key tactics or rewards using numbered icons and clean layout sections. Great for marketers, retail teams, and business consultants. Fully editable in PowerPoint, Keynote, and Google Slides.


4 slides
Options Comparison Chart Presentation
Make every decision crystal clear with a dynamic, easy-to-follow layout designed to compare options side by side. Perfect for presenting business strategies, pricing plans, or feature breakdowns, this presentation helps your audience see the value instantly. Fully compatible with PowerPoint, Keynote, and Google Slides for effortless editing.


5 slides
Professional Business People Collaboration Presentation
Showcase effective teamwork and synergy with this Professional Business People Collaboration slide. The puzzle-piece visual metaphor highlights how diverse roles fit together to build cohesive strategies. With five clearly labeled sections, it’s perfect for project collaboration plans, department overviews, or joint venture strategies. Fully editable and compatible with PowerPoint, Keynote, and Google Slides.


5 slides
Innovative Business Solutions Presentation
Elevate your strategy discussions with the Innovative Business Solutions template, providing a visually engaging framework designed to present complex business solutions clearly and effectively. It features a unique puzzle design that integrates up to five key business insights, ensuring each piece contributes to a holistic understanding of strategies or solutions. It is compatible with PowerPoint, Keynote and Google Slides, providing flexibility and ease of use across different platforms.


10 slides
Business Data Charts Presentation
Visualize insights with precision using this Business Data Charts Presentation Template. Featuring clean, colorful doughnut charts and clearly labeled segments, it’s ideal for showcasing survey results, KPI breakdowns, or performance metrics. Designed for professionals who want sleek data visuals, and fully customizable in PowerPoint, Keynote, and Google Slides.


4 slides
Revenue and Expense Forecasting Overview Presentation
Easily illustrate financial trade-offs with the Revenue and Expense Forecasting Overview Presentation. This clean, visual slide design features a seesaw-style balance graphic to help communicate proportional budgeting between revenue, balance, and expenses. Ideal for finance updates, annual reports, and planning meetings. Fully editable in PowerPoint, Google Slides, Keynote, and Canva.


26 slides
Digital Agency Pink Themed Company Profile
A fashion digital agency is a specialized agency that provides a range of digital marketing, advertising, and branding services tailored to the fashion industry. This template focuses on helping you leverage your digital platforms and technologies to enhance brand visibility, engage target audiences, drive sales, and create a strong online presence for your fashion brand. Fully customizable and compatible with Powerpoint, Keynote, and Google Slides. The elegant shades of pink reflect the fashion-forward and creative nature of your agency. Use this presentation template to showcase your best work, fashion trends, and styles.


4 slides
Lean Startup Business Model Presentation
Optimize your startup strategy with the Lean Startup Business Model Presentation. This fully customizable template simplifies key business components, including funding sources, revenue models, growth strategies, and value propositions. Designed for entrepreneurs, investors, and business analysts, this layout is available for PowerPoint, Keynote, and Google Slides, ensuring a professional, structured, and impactful presentation.


22 slides
Inspirae Project Status Report Presentation
This sleek and modern project status report presentation template is designed to help you effectively communicate progress, challenges, and key insights. It covers essential sections such as performance metrics, sales performance, risk assessments, and strategic initiatives, ensuring a comprehensive overview. Compatible with PowerPoint, Keynote, and Google Slides for seamless customization.


5 slides
RACI Matrix Responsibility Breakdown Presentation
Visualize roles and responsibilities with this RACI Matrix slide. Clearly assign who is Responsible, Accountable, Consulted, or Informed across key tasks. Ideal for project planning and team alignment, this editable layout helps avoid confusion and ensures accountability. Perfect for PowerPoint, Keynote, or Google Slides in any business context.