


Features
- 12 Unique slides
- Fully editable and easy to edit in Microsoft Powerpoint, Keynote and Google Slides
- 16:9 widescreen layout
- Clean and professional designs
- Export to JPG, PDF or send by email


Do you have any questions?
Recommend


5 slides
4-Stage Gap Identification Presentation
A clear, engaging way to map progression, this presentation helps you illustrate each stage of identifying business gaps with structure and clarity. It guides audiences through challenges, priorities, and opportunities in a simple step-by-step flow that’s easy to follow and present. Fully compatible with PowerPoint, Keynote, and Google Slides.


4 slides
Emerging AI Applications in Business
Showcase innovation with clarity using the Emerging AI Applications in Business Presentation. This sleek 4-step layout features modern icons and a profile-style AI illustration, perfect for outlining use cases such as automation, data insights, machine learning, or cloud-based AI solutions. Ideal for tech-driven strategy decks, startup pitches, or digital transformation briefings. Fully editable in PowerPoint, Keynote, and Google Slides.


5 slides
Numerical Highlights in Strategy Presentation
Present key strategic milestones using this visually engaging curved-number layout. Designed to emphasize four sequential points, it's perfect for showcasing steps, achievements, or data-driven highlights. The bold numbering and layered hills guide the viewer naturally. Fully editable in Canva—ideal for business plans, growth summaries, or performance strategy visuals.


23 slides
Nightspire Strategic Planning Report Presentation
Streamline your strategic planning process with this professionally designed presentation template. Covering key areas such as market analysis, SWOT assessment, milestones, and resource allocation, this template is ideal for businesses and project teams. Fully editable and compatible with PowerPoint, Keynote, and Google Slides.
8 slides
Directional Arrow Timeline Flow
Highlight key milestones or project phases with this smooth, flowing arrow timeline layout. Designed for project managers, team leads, and strategists to showcase sequential steps, launch plans, or performance stages. Fully customizable in PowerPoint, Keynote, and Google Slides—change icons, colors, and text to match your brand style.


7 slides
Business Pricing Table Slides Infographic
Streamline your product offerings with our Business Pricing Infographic, designed to clearly present pricing tiers and package options. This infographic is essential for sales teams, marketing professionals, and business owners to communicate value propositions to potential customers. Our Business Pricing Infographic allows for a clean, comparative view of different pricing plans, showcasing features, benefits, and cost-effectiveness at a glance. It includes customizable sections for various packages, making it easy to distinguish between basic, standard, and premium options. With this tool, you can highlight key differences and unique selling points of each package, aiding customers in making informed purchasing decisions. This SEO-friendly infographic is crafted to attract and educate potential buyers, providing them with transparent pricing information. Adopt this infographic in your marketing materials to facilitate a straightforward shopping experience, helping customers choose the right product that fits their needs and budget.


5 slides
SWOT Analysis Infographics
SWOT analysis is a strategic planning tool used to assess the strengths, weaknesses, opportunities, and threats of an individual, organization, or project. These infographics are powerful visual tools that allow you to present comprehensive SWOT analysis in a clear and impactful way. Whether preparing a business presentation, strategic planning session, or educational material, this template provides a visually engaging format to showcase the key aspects of a SWOT analysis. The customizable features of the template allow you to tailor it to your specific industry ensuring that your SWOT analysis is presented in a concise, and impactful manner.


23 slides
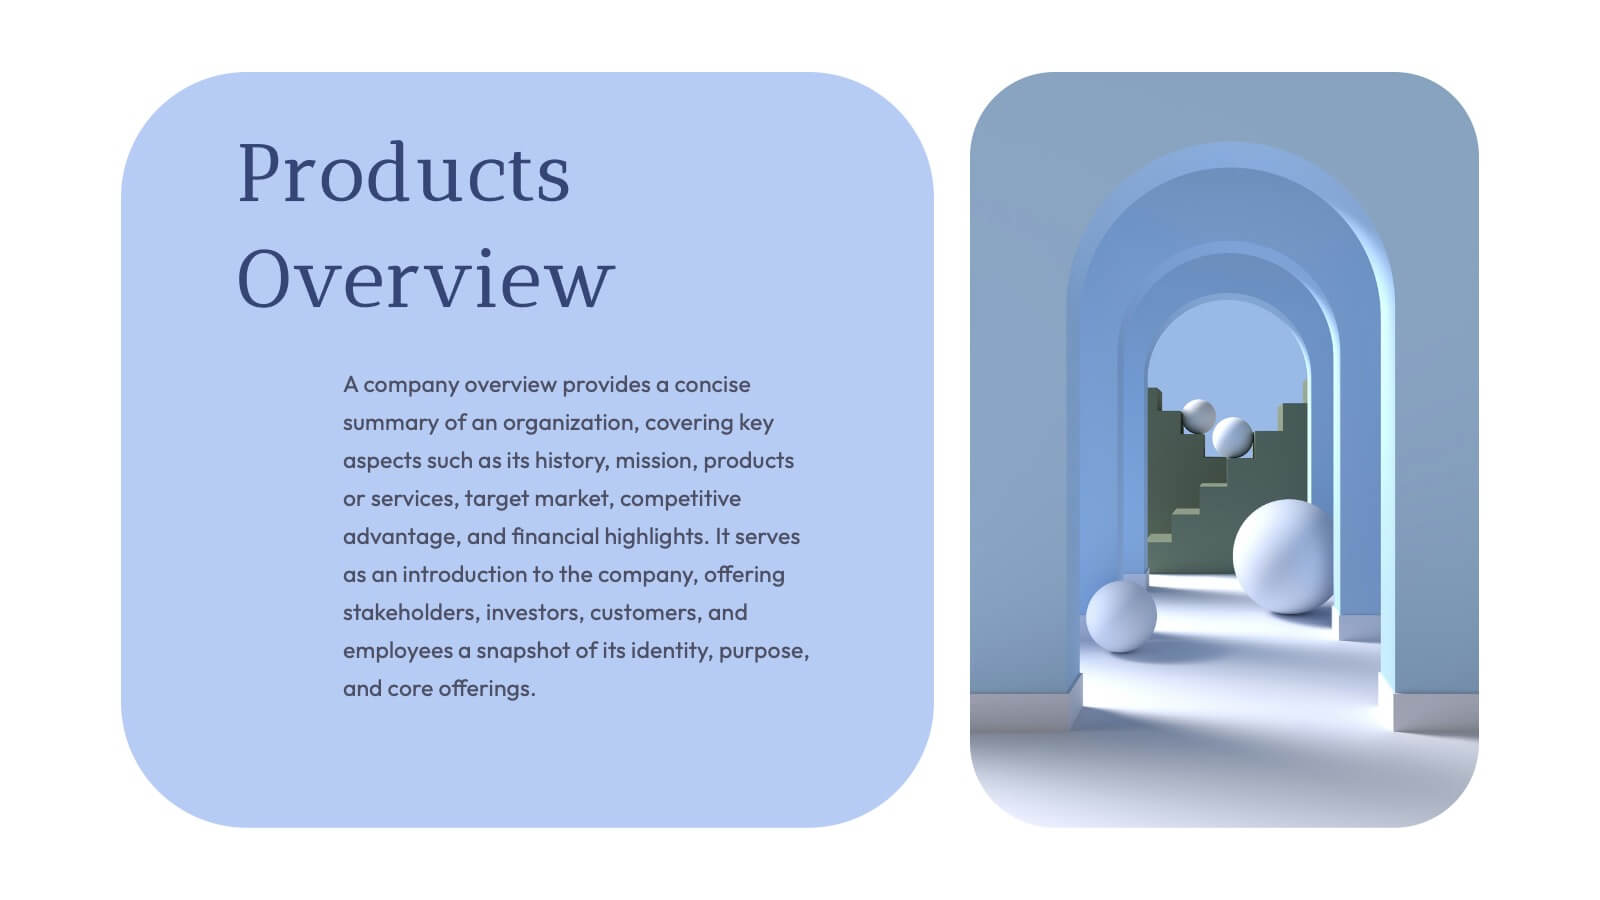
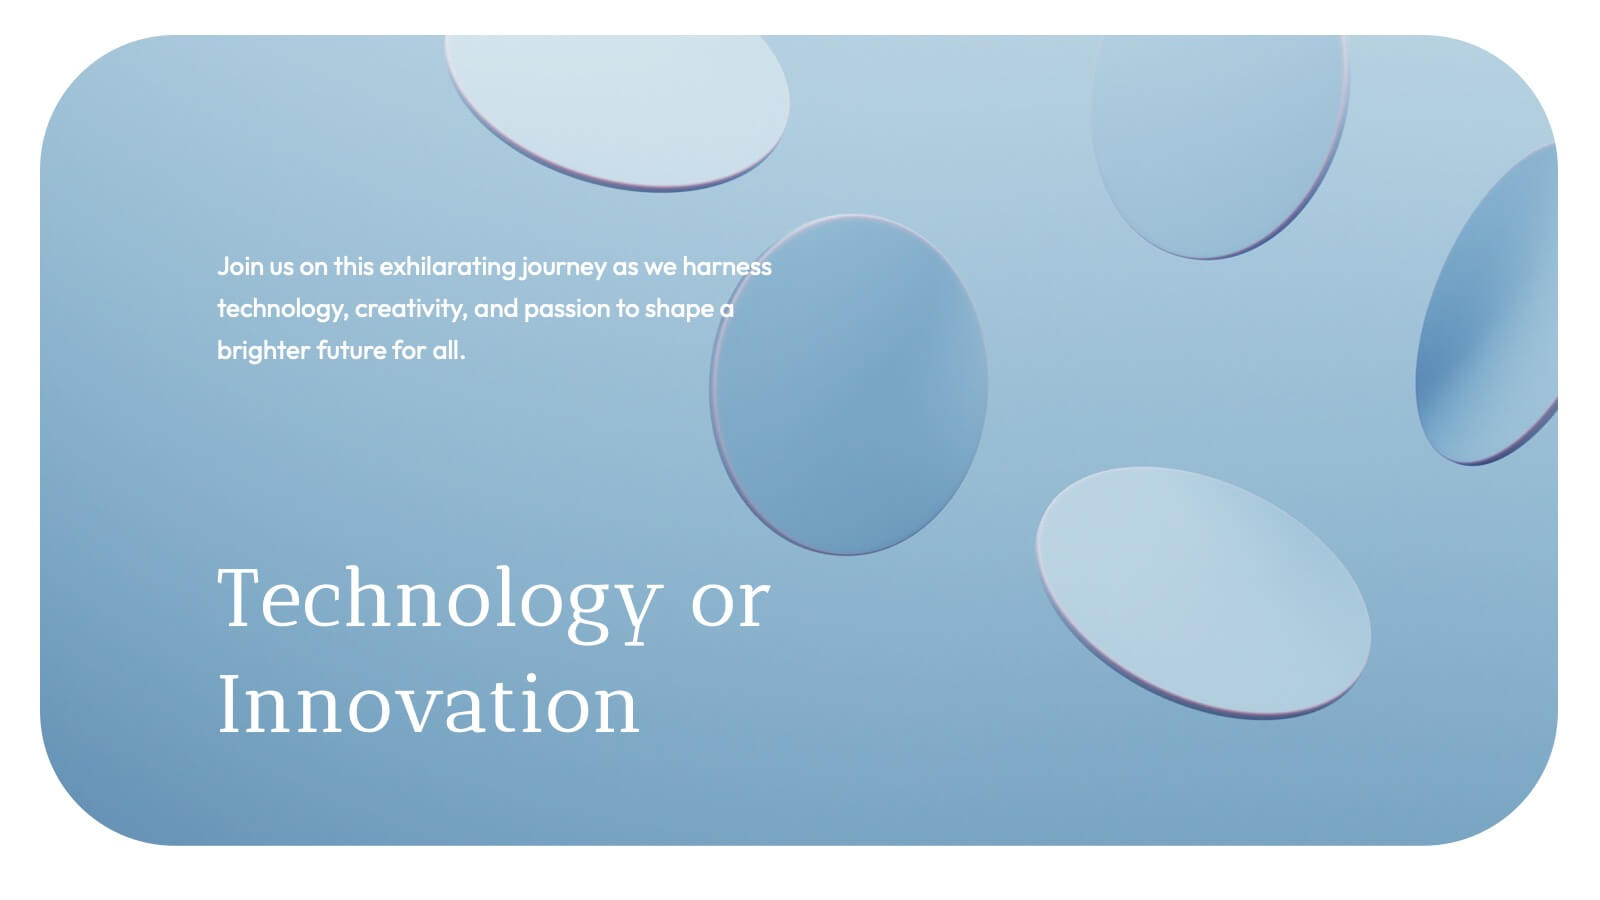
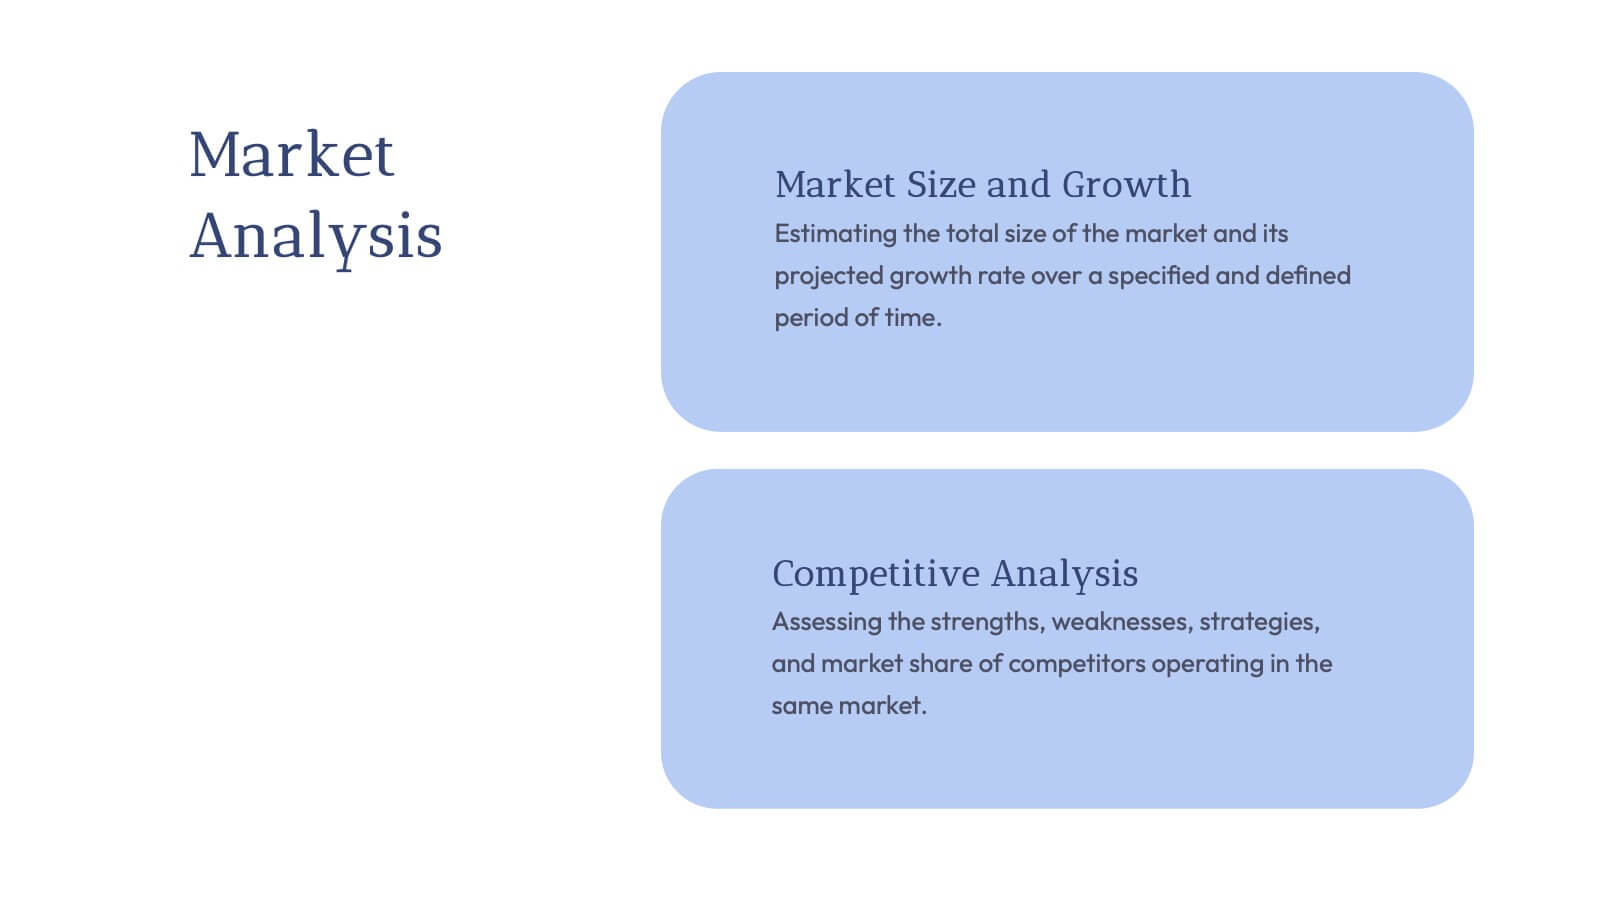
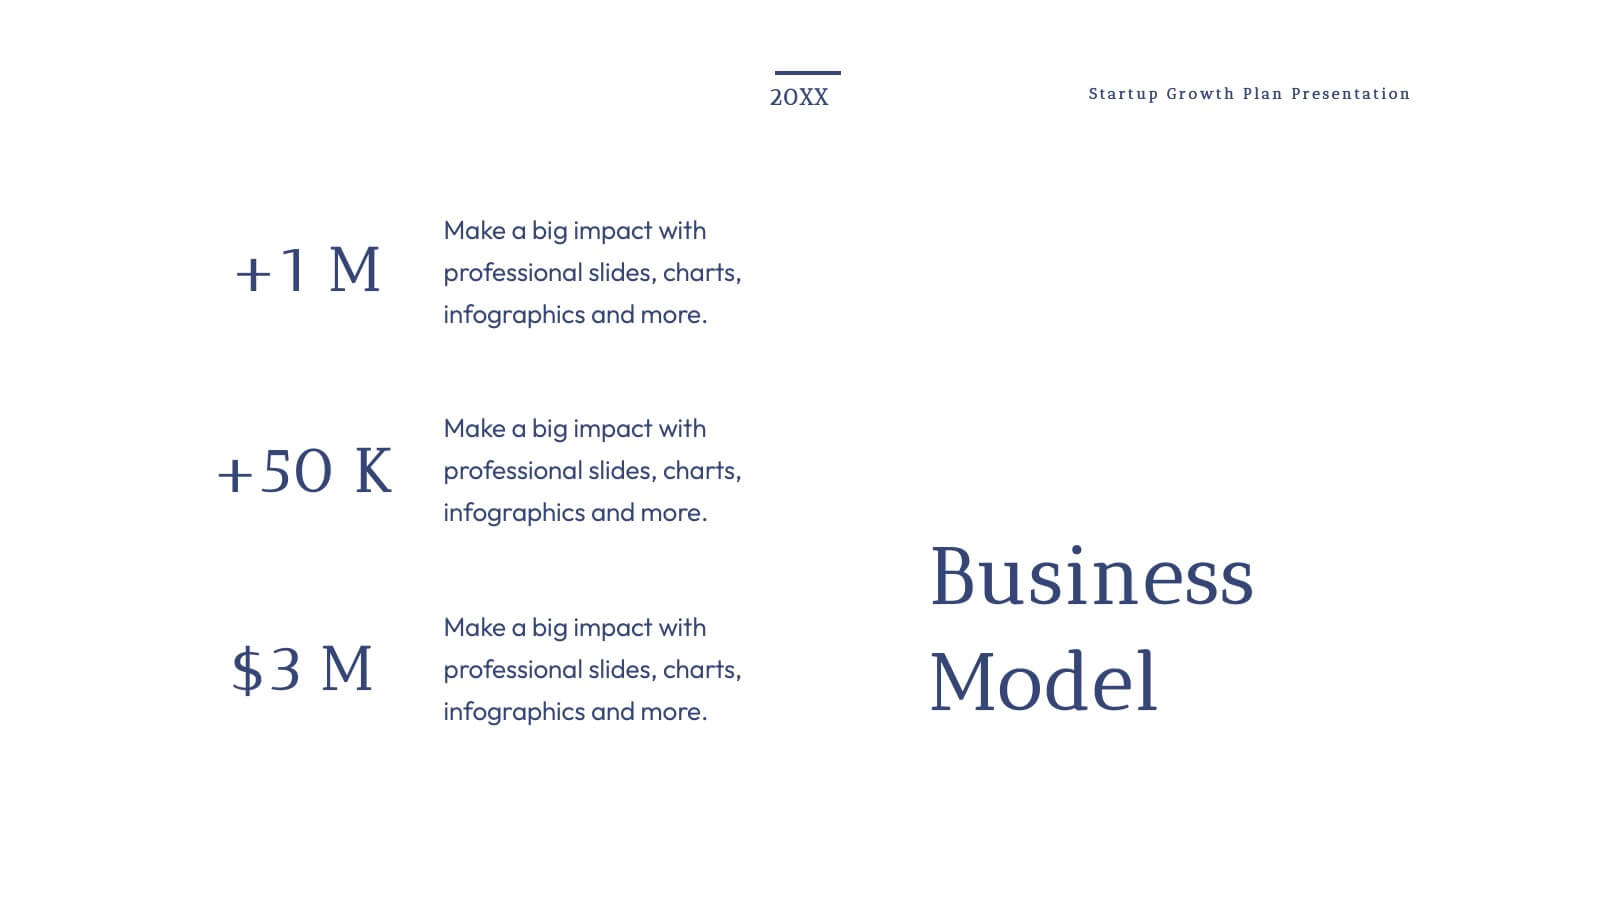
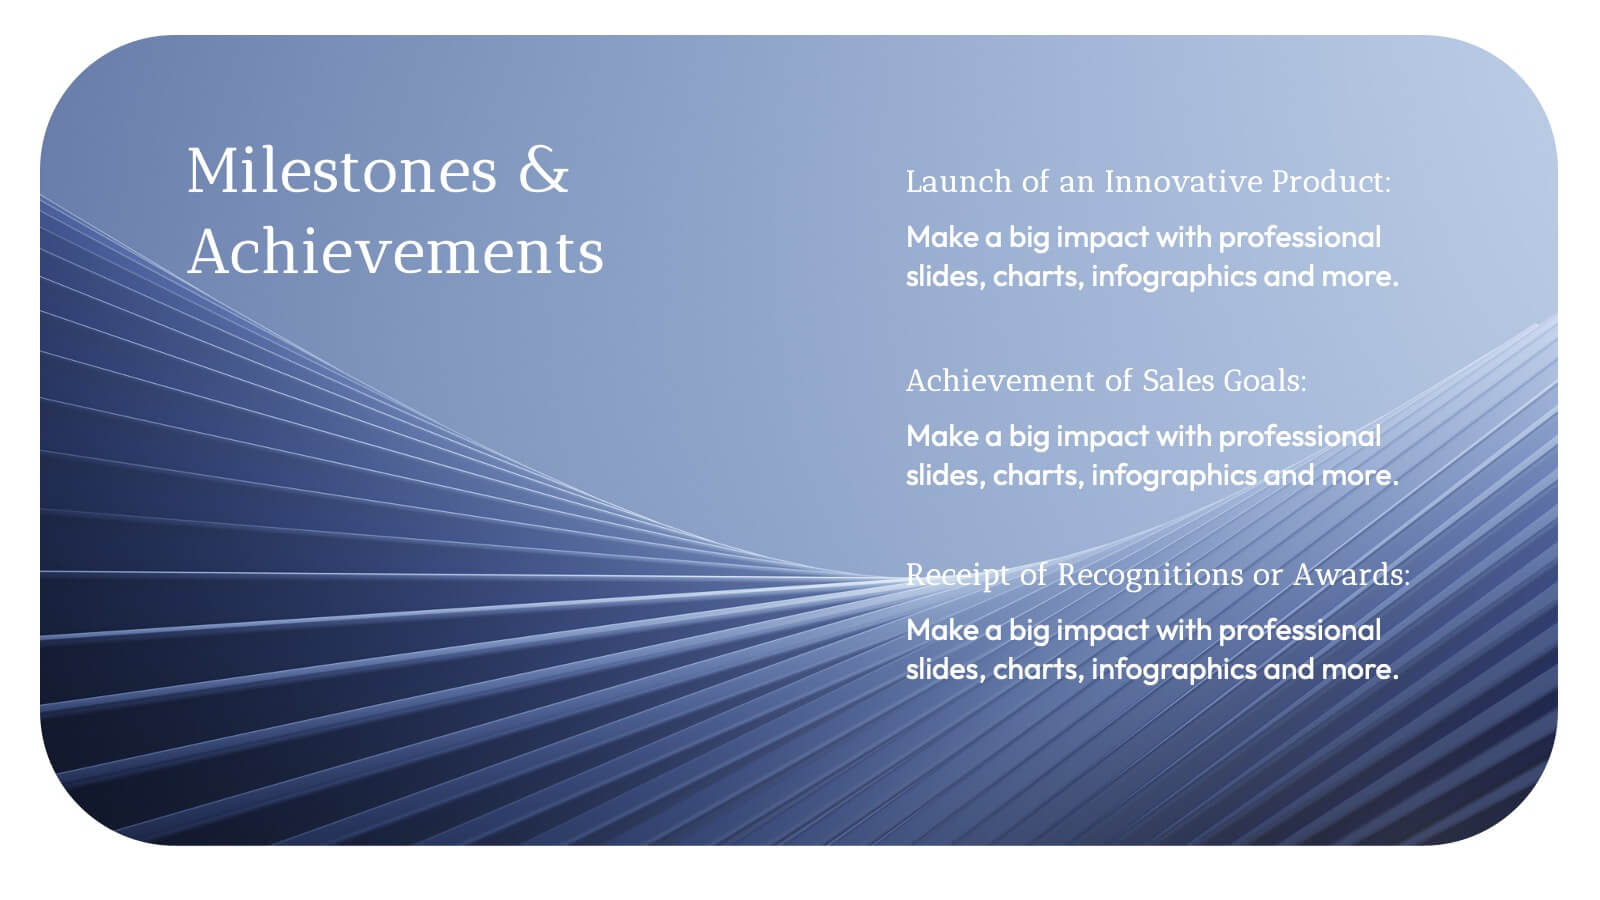
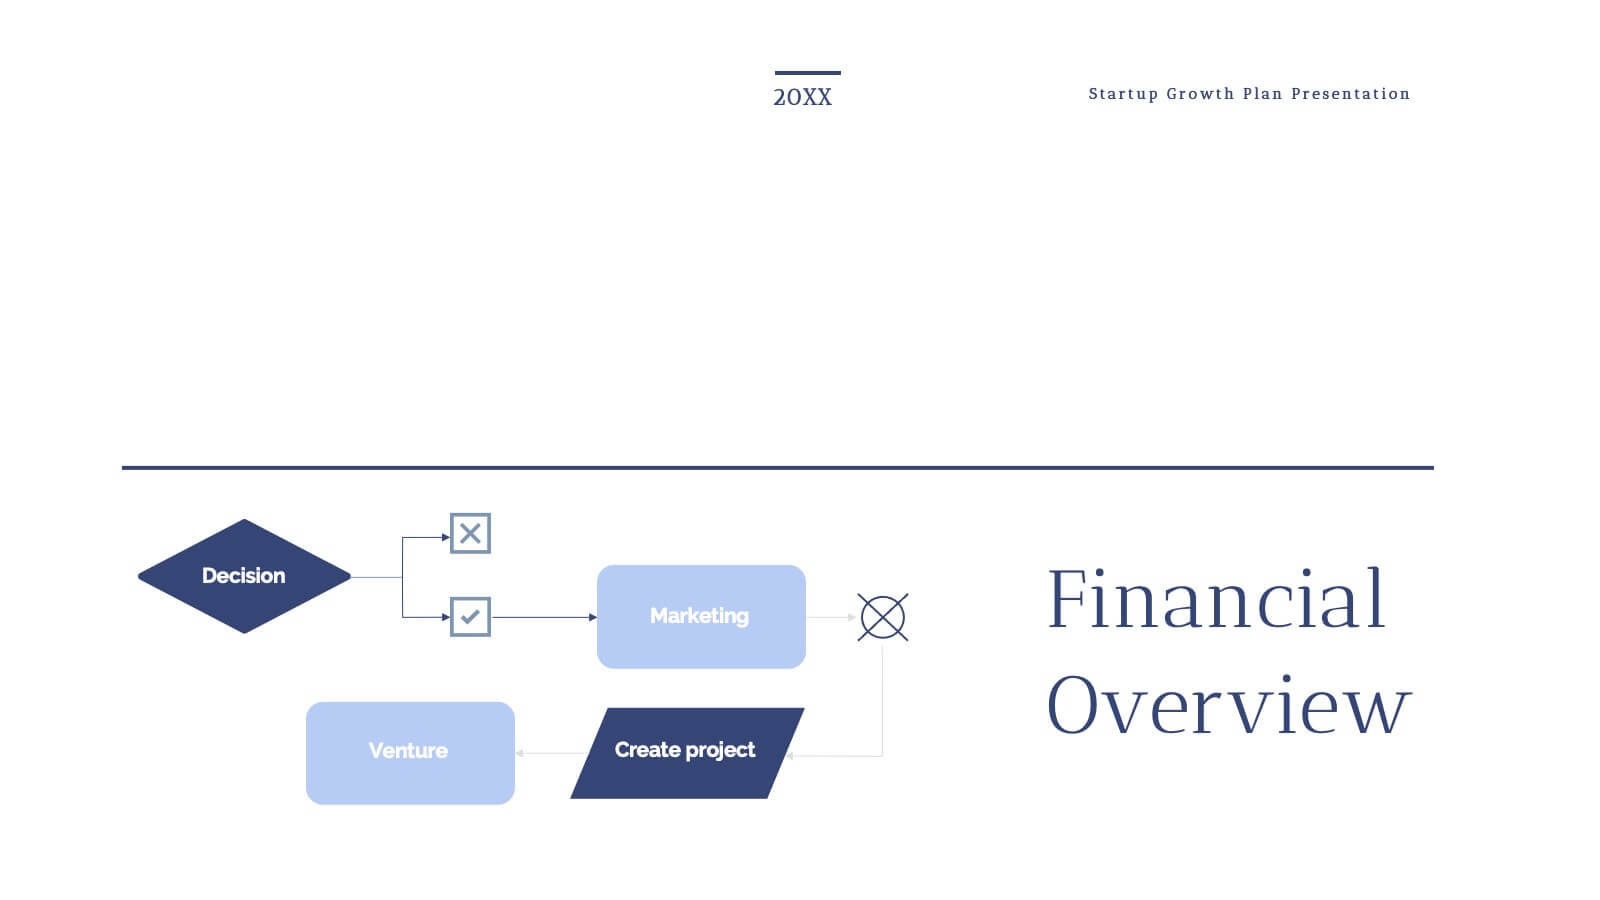
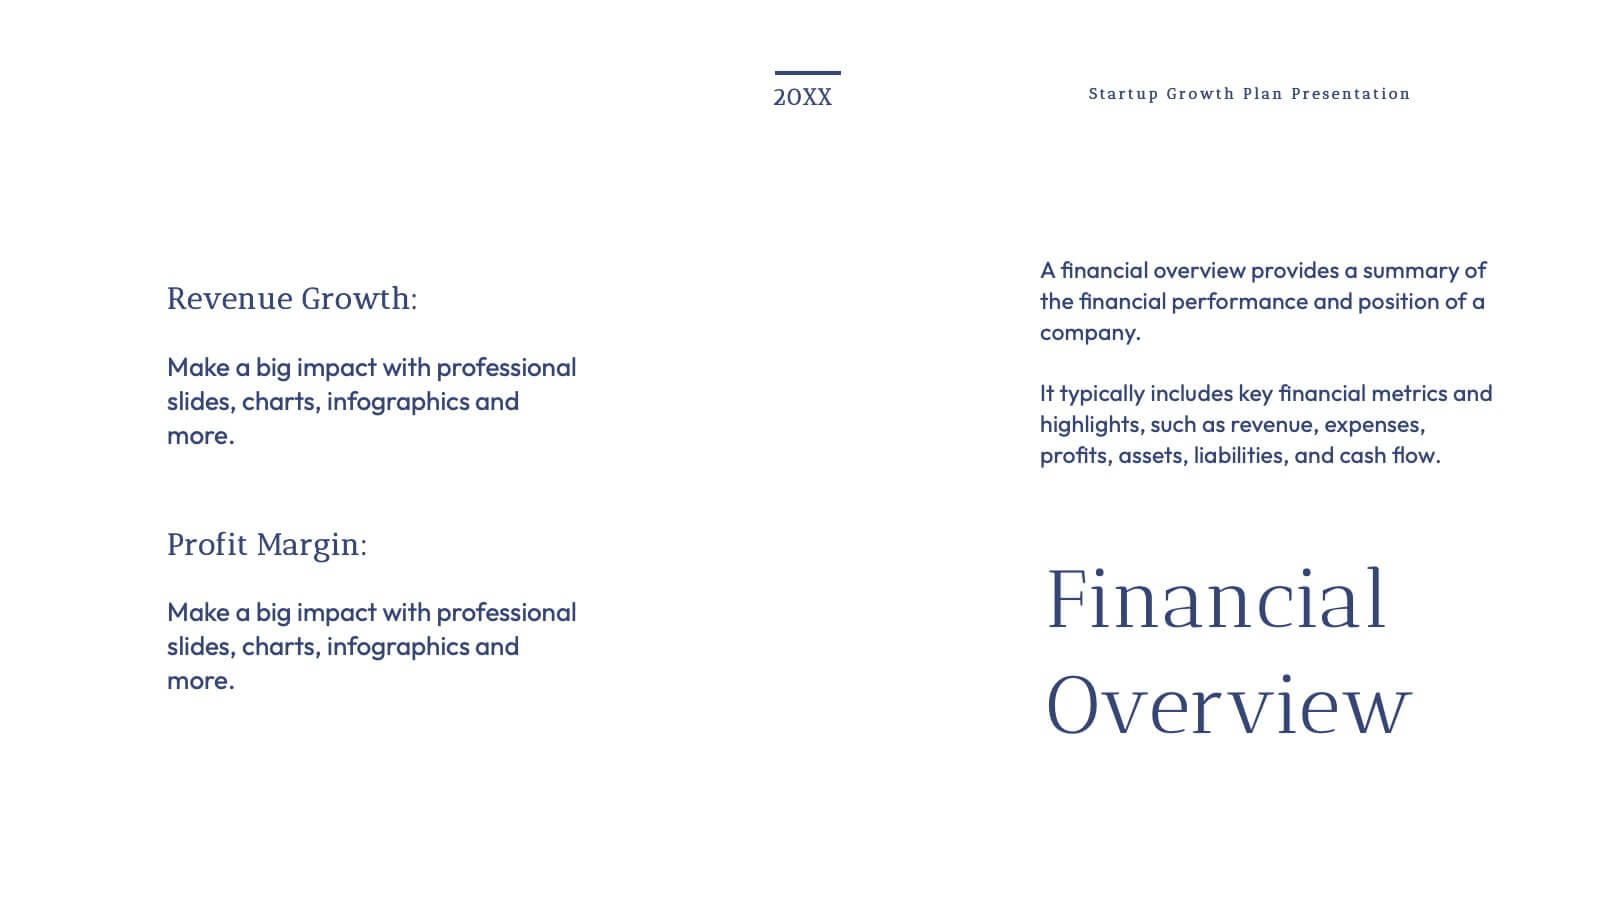
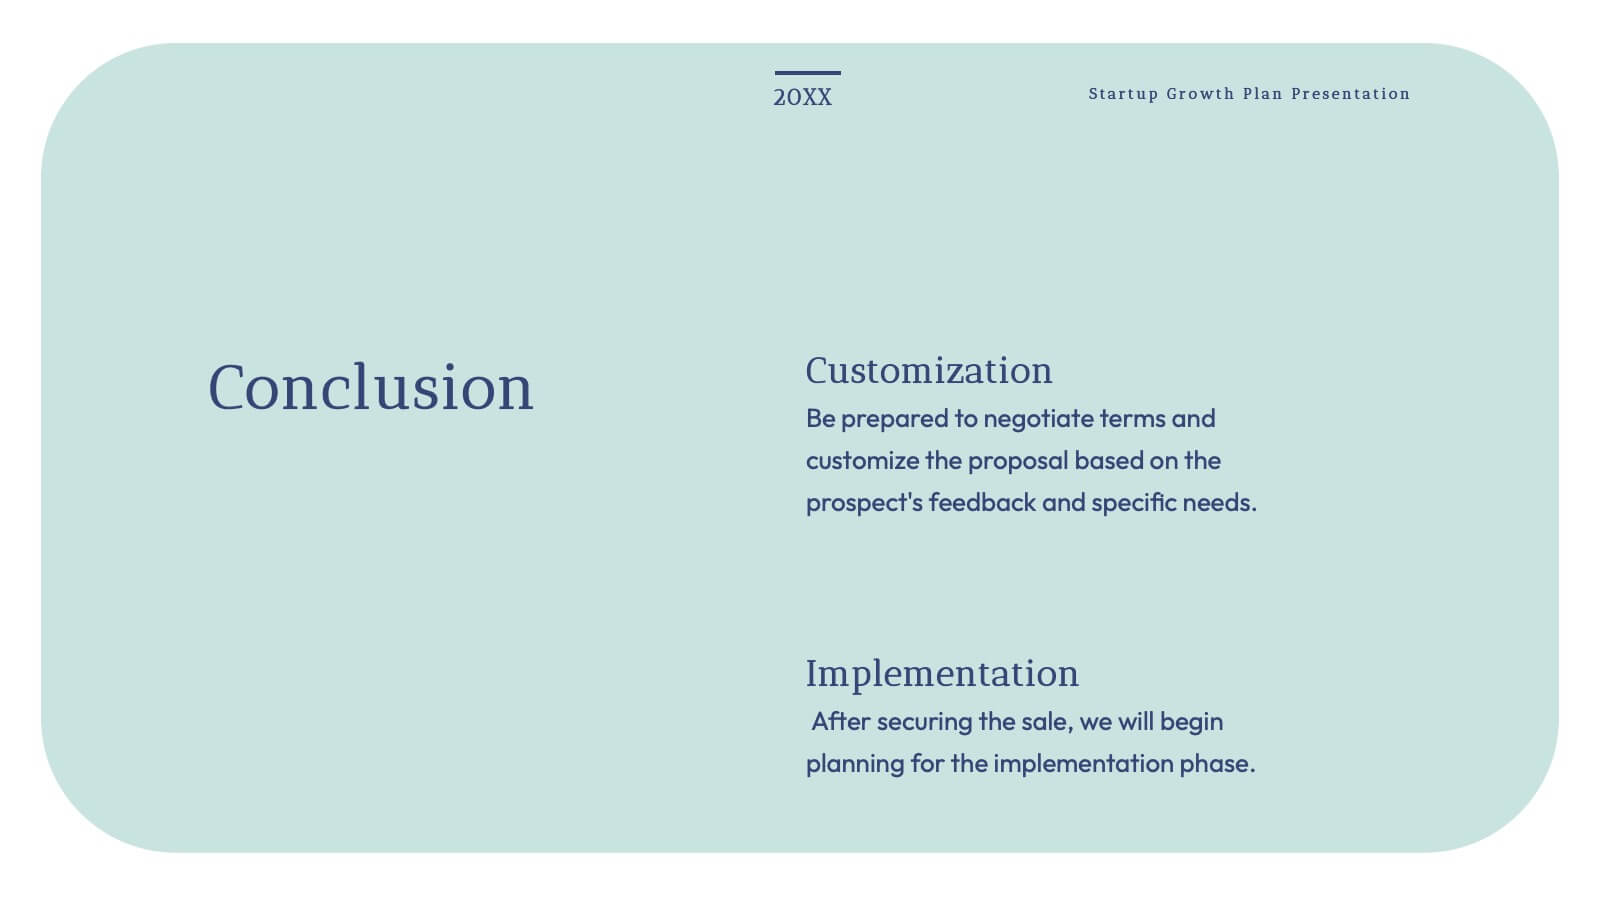
Grecian Startup Growth Plan Presentation
Elevate your pitch with this stunning Grecian-inspired presentation template, perfect for outlining your startup's growth plan! Showcase your business strategy, revenue projections, and scaling opportunities with a clean, elegant design that grabs attention. Impress investors and stakeholders with every slide. Compatible with PowerPoint, Keynote, and Google Slides for seamless customization.


5 slides
Renewable Natural Energy Resources Infographics
Renewable natural energy resources, also known as renewable energy sources, are energy sources that are replenished naturally and sustainably. These vertical infographics serve as educational tools to promote awareness and understanding of renewable energy sources. They can be used in presentations, workshops, educational materials, or sustainability initiatives to inspire individuals, organizations, and communities to embrace and invest in renewable energy for a greener and more sustainable future. They are fully customizable and compatible with Powerpoint, Keynote, and Google Slides.


6 slides
Year-End Review and Financial Report Presentation
Summarize your business year clearly with the Year-End Review and Financial Report Presentation. This clean, modern layout uses quarterly donut charts and monthly timelines to help visualize performance at a glance. Ideal for financial recaps and executive meetings. Fully editable in Canva, PowerPoint, and Google Slides for easy updates and branding.


7 slides
3D Modeling Infographic
3D modeling is the process of creating three-dimensional representations of objects or scenes using specialized computer software. This infographic template is crafted to demystify the world of 3D modeling, providing a comprehensive understanding of the techniques, applications, and the creative process that brings ideas to life in the third dimension. Compatible with Powerpoint, Keynote, and Google Slides. This infographic is an invitation to the captivating universe of 3D artistry and innovation. Use this template to step into the realm where imagination meets the third dimension.


6 slides
Business Plan Next Steps Presentation
Map out your strategy with the Business Plan Next Steps Presentation template. This visually structured layout helps outline key actions, milestones, and priorities for business growth and execution. Ideal for entrepreneurs, executives, and project managers, this slide ensures clarity and alignment on upcoming initiatives. Fully customizable in PowerPoint, Keynote, and Google Slides for easy integration into your planning process.


2 slides
Professional Closing Thank You Presentation
End your presentation on a high note with this professional thank-you slide template! Featuring a clean and modern layout, this design includes space for contact details and a call to action, making it perfect for business meetings, proposals, and networking events. Fully customizable and compatible with PowerPoint, Keynote, and Google Slides.


6 slides
Risk Assessment Spider Chart Presentation
Clearly visualize risk exposure across multiple criteria with the Risk Assessment Spider Chart Presentation. This template is perfect for comparing key risk factors in a visual, easy-to-understand format. Ideal for project managers, risk analysts, and consultants. Fully customizable and works seamlessly with PowerPoint, Keynote, and Google Slides.


26 slides
Transportation and Logistics Company Profile Presentation
Delve into the fast-paced realm of Transportation and Logistics, the backbone of global commerce. Our vibrant template captures this essence with a lively mix of yellow, blue, orange, and purple. Precision-crafted, it comes alive with industry-specific graphics, adaptable icons, and purpose-built image placeholders. Seamless compatibility ensures smooth sailing whether you're on Powerpoint, Keynote, or Google Slides. Tailored for businesses, it's the go-to choice for presenting company profiles within the transportation sector. Don't just inform; captivate and inspire your audience. Elevate your presentation game today!


5 slides
Veterinary Diagnostics and Treatment Presentation
Clearly outline your care process with the Veterinary Diagnostics and Treatment presentation. This slide features a visually appealing medical bag segmented into four quadrants, each marked by colorful paw prints and editable titles. Ideal for showcasing diagnosis steps, treatment plans, or service categories for veterinary clinics. Fully customizable and easy to adapt for use in PowerPoint, Keynote, and Google Slides. Perfect for pet care professionals seeking a professional, pet-friendly visual.


7 slides
Relationship Infographics Presentation Template
Featuring our Relationship Infographic template, this provides the entire process of relationship building in its true form. This infographic will take you through the stages of building a relationship. This design is good for any purpose and can be used as a template for many presentations. Use this template to illustrate your ideas, put forward an argument, or make statistics and facts catchy. In this template, you’ll find everything you need to create a gorgeous relationship infographic. This is the perfect way to share your story and create an emotional connection with your audience.