


Features
- 26 Unique slides
- Fully editable and easy to edit in Microsoft Powerpoint, Keynote and Google Slides
- 16:9 widescreen layout
- Clean and professional designs
- Export to JPG, PDF or send by email


Do you have any questions?
Recommend


5 slides
Spider Chart for Mind Organization Presentation
Clarify complex ideas with the Spider Chart for Mind Organization Presentation. This layout visually maps key topics and subtopics, helping you identify patterns, priorities, or areas of focus. Ideal for planning, decision-making, and brainstorming sessions. Fully customizable in Canva, PowerPoint, Google Slides, and Keynote for seamless use.


4 slides
Team Alignment and Discussion Summary Presentation
Foster collaboration and keep everyone on the same page with the Team Alignment and Discussion Summary presentation. This template highlights discussion points, action items, and key takeaways alongside a professional image layout—perfect for recaps, team syncs, and leadership updates. Fully editable in PowerPoint, Keynote, and Google Slides.


4 slides
Comparative Assessment Using Harvey Ball Chart Presentation
Make your evaluations easier to understand with this Harvey Ball chart template. Designed for performance comparison, efficiency scoring, or feature benchmarking, this layout supports up to 4 items and 3 criteria. Each element is clearly visualized for quick decision-making. Fully editable in PowerPoint, Keynote, or Google Slides—ideal for business strategy, operations, or HR presentations.


6 slides
Effective Leadership Skills Presentation
Build stronger teams with this effective leadership skills template, featuring a colorful building block design to represent key competencies. Ideal for leadership workshops, corporate training, and professional development, it visually organizes six core skills. Fully editable in Canva, PowerPoint, or Google Slides for easy customization to match your organization’s style.


6 slides
Five Key Pillars of Organizational Strength Presentation
Highlight the foundational strengths of your business with the Five Key Pillars of Organizational Strength presentation. This visual framework uses classical column structures to represent five core principles, ideal for showcasing leadership values, corporate strategy, operational focus, or departmental roles. Each pillar is clearly labeled and customizable, making it easy to align with your organization’s unique message. Fully editable in PowerPoint, Keynote, and Google Slides, this template is perfect for board meetings, company culture decks, or executive planning sessions.


4 slides
Corporate Governance Structure and Rules Presentation
Define leadership roles, responsibilities, and oversight with the Corporate Governance Structure and Rules Presentation. This minimalist bar-style layout is perfect for illustrating hierarchical influence, compliance levels, or board member functions. Each section can be fully edited to align with your company’s governance model, helping stakeholders visualize how power and accountability are distributed. Ideal for board meetings, corporate compliance reports, or executive briefings. Fully compatible with PowerPoint, Google Slides, and Keynote.


5 slides
Brainstorming Session Diagram Presentation
Spark creativity and structure your next idea session with the Brainstorming Session Diagram Presentation. Featuring a central brain icon and four labeled input areas, this layout makes it easy to visualize and organize group contributions. Fully editable in PowerPoint, Canva, and Google Slides for seamless collaboration and customization.

22 slides
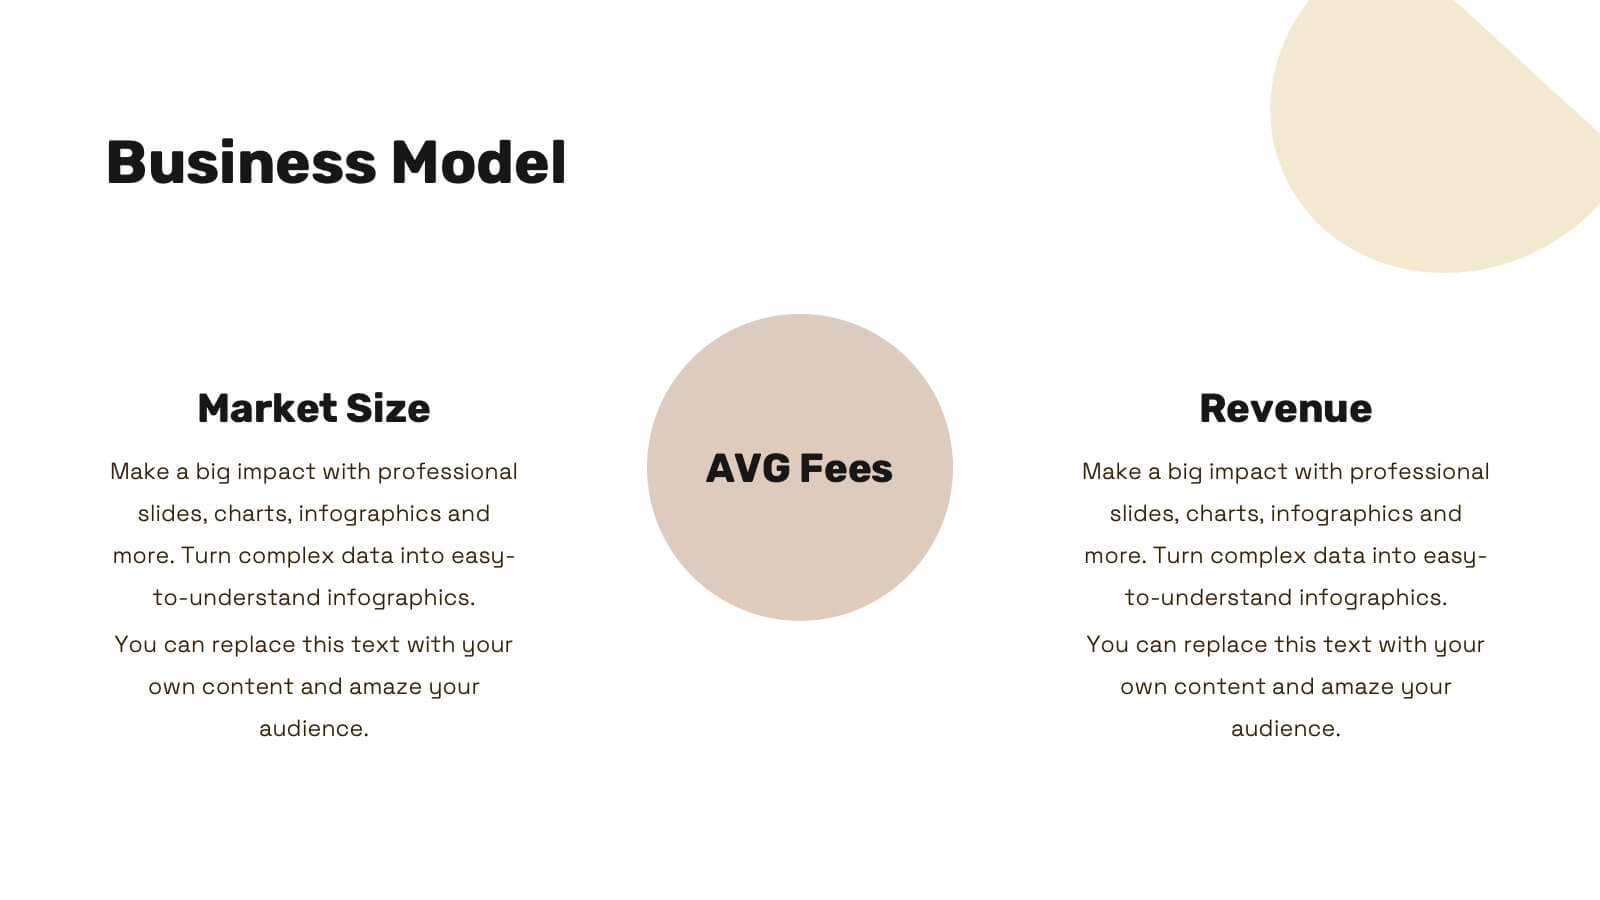
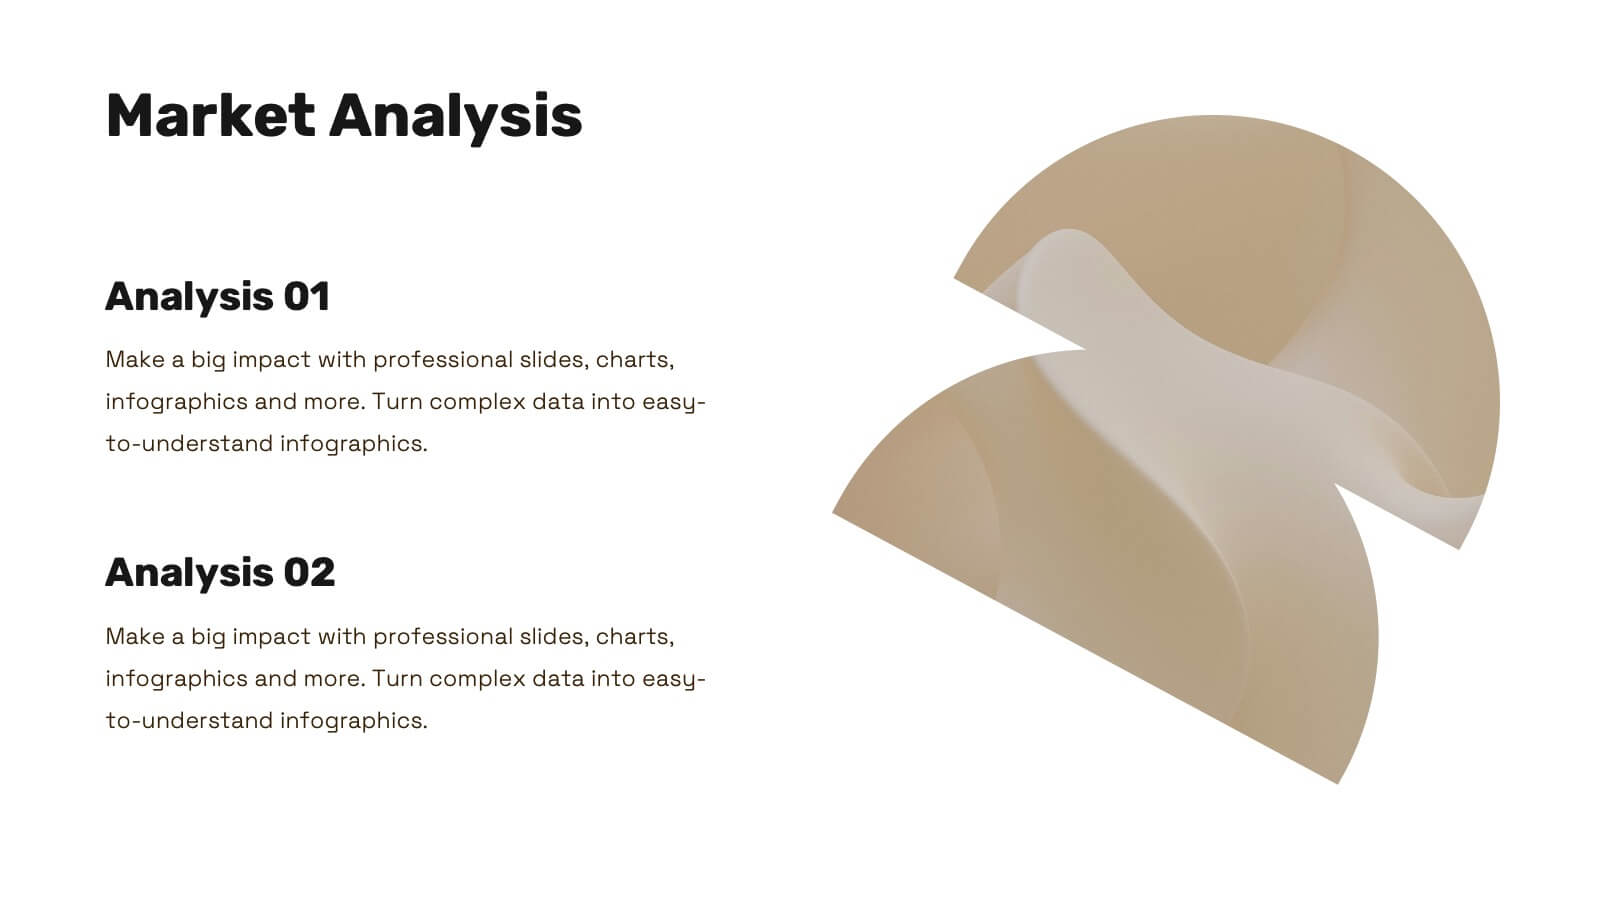
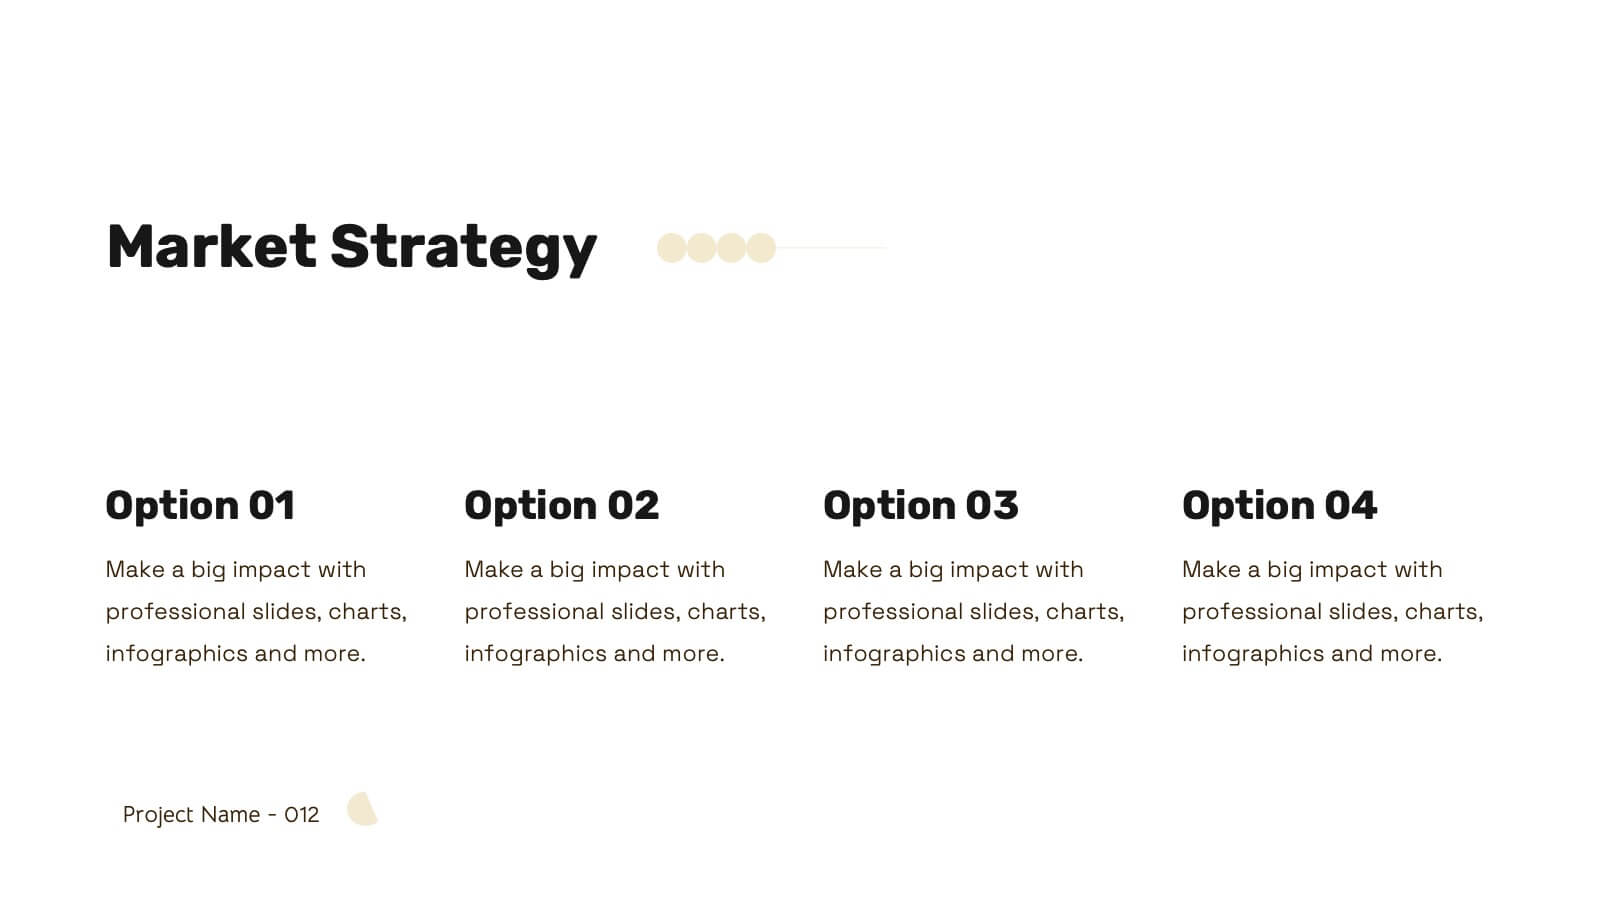
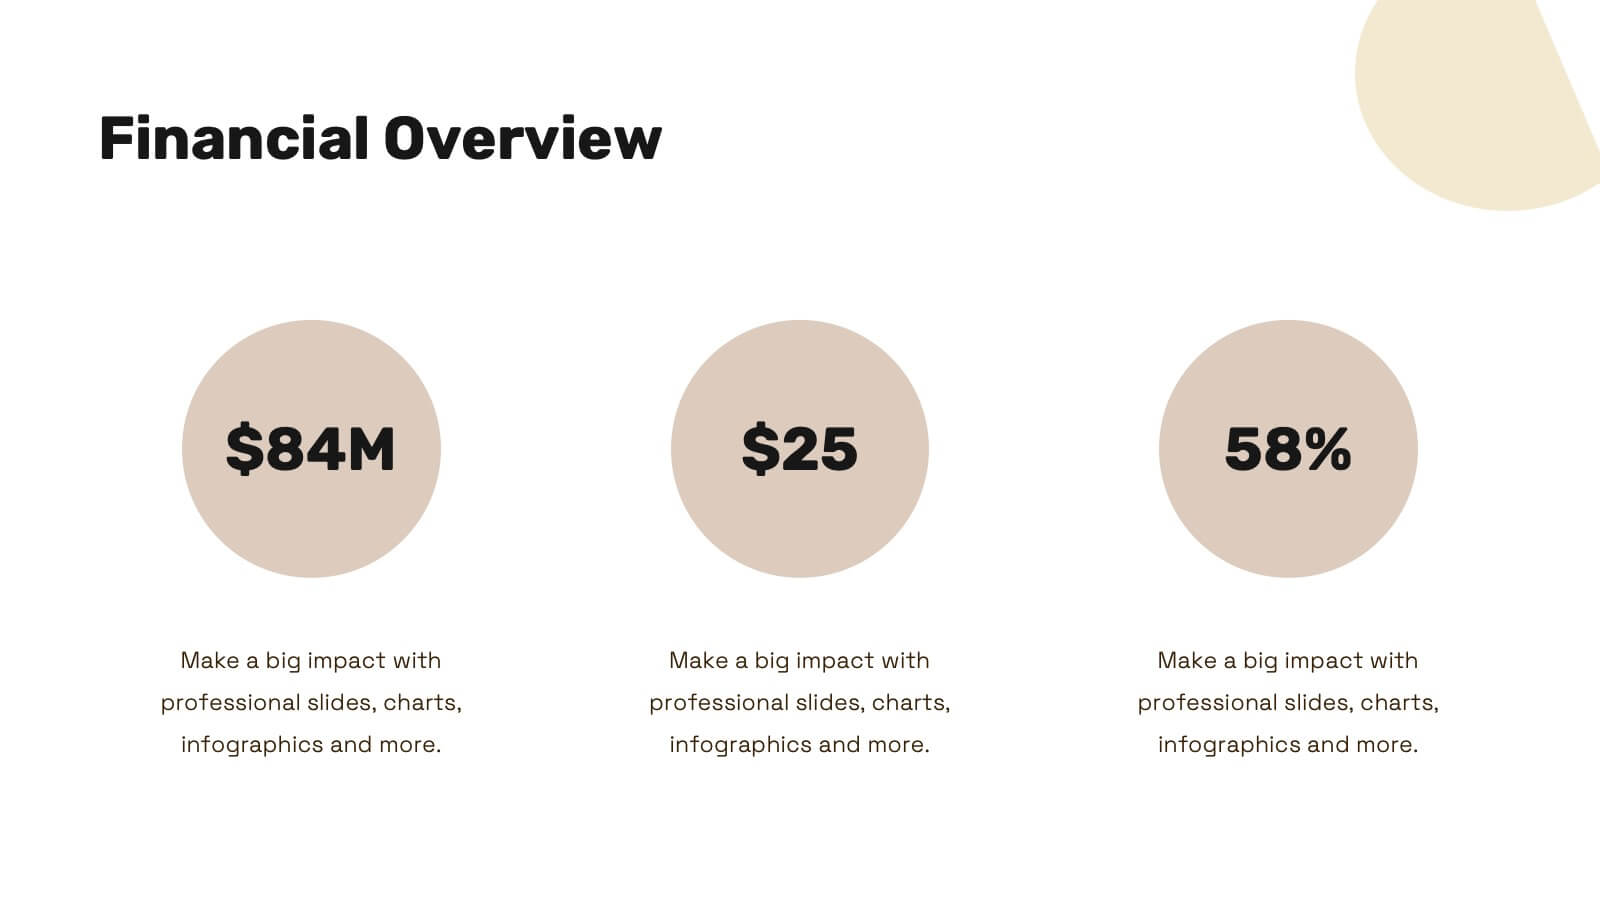
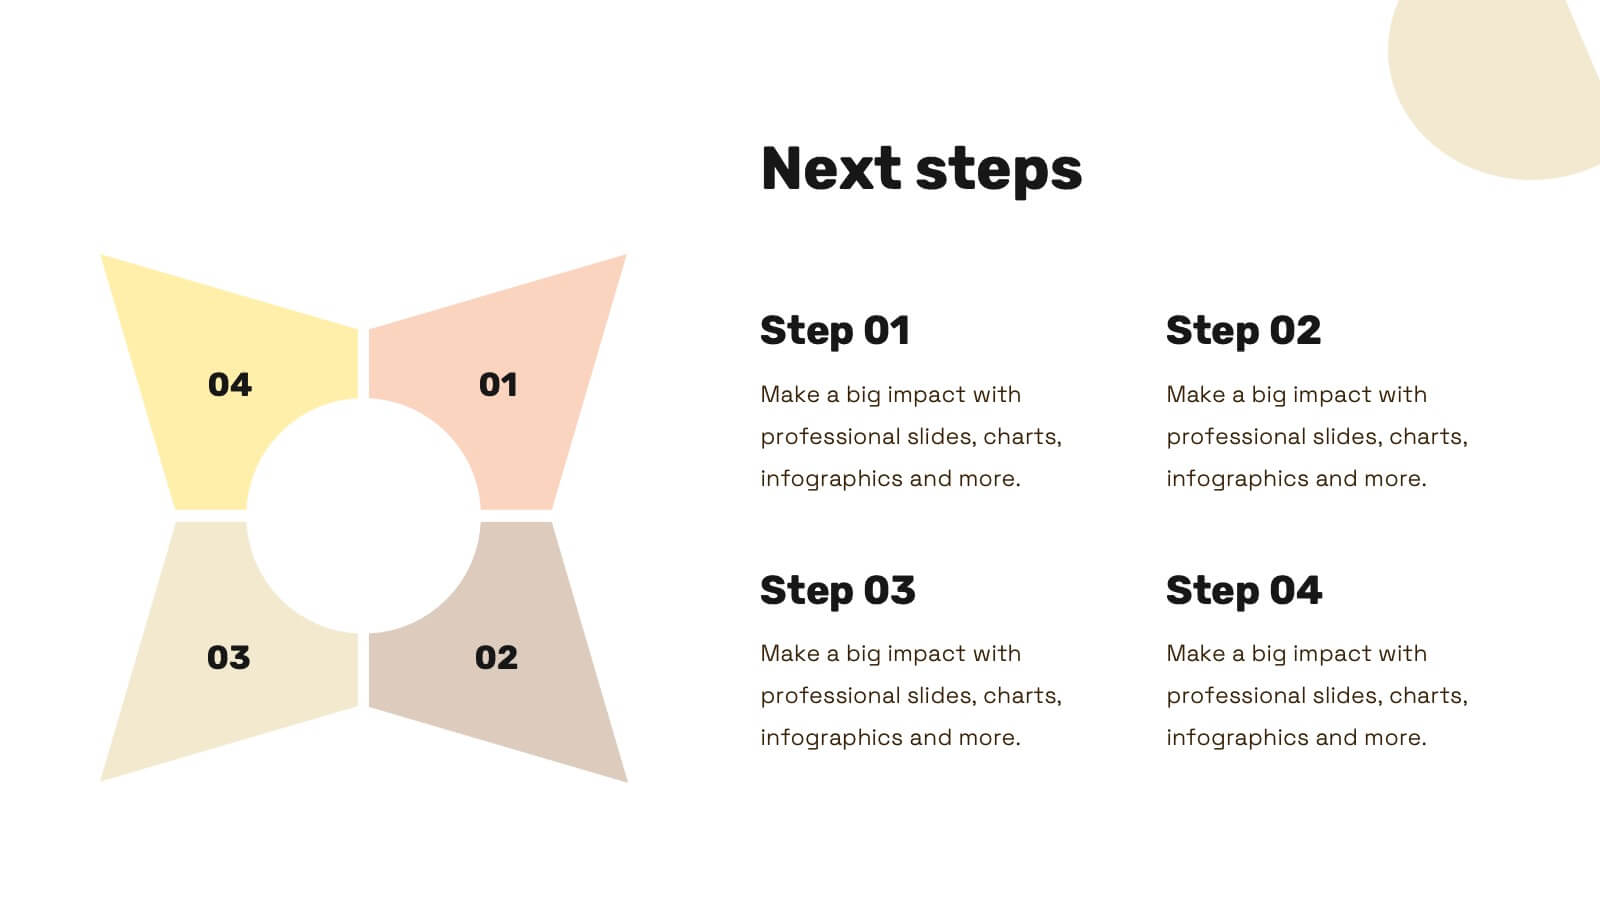
Nova Startup Funding Proposal Presentation
Craft an impressive startup funding proposal with this elegant template. It includes sections for mission, vision, market analysis, business model, and financial overview. Ideal for clear and professional presentations. Fully compatible with PowerPoint, Keynote, and Google Slides for easy customization.


8 slides
Business Workflow Process
Showcase your operations with this 4-step business workflow diagram. Designed for clarity and adaptability, each step features icons and text fields ideal for processes, pipelines, or phase breakdowns. Fully editable in PowerPoint, Keynote, and Google Slides—customize effortlessly to fit your business needs.


4 slides
Visual Relationships in Venn Format Presentation
Highlight similarities and differences between two or more ideas using this clean, two-circle Venn diagram layout. Ideal for comparing concepts, teams, or strategies. Customize icons, text, and color themes effortlessly. Compatible with PowerPoint, Keynote, and Google Slides—perfect for business meetings, educational content, and marketing comparisons.


5 slides
Topic Expansion Using Spider Mapping Presentation
Expand and organize your ideas visually with the Topic Expansion Using Spider Mapping Presentation. Designed to simplify complex information, this layout helps you break down main themes into connected subpoints. Ideal for brainstorming, concept mapping, and strategy sessions. Fully editable in Canva, PowerPoint, Keynote, and Google Slides.


26 slides
Cryptocurrency Technology Presentation
The foundation of cryptocurrency technology is the blockchain, cryptocurrency has the potential to transform the way we think about money and financial transactions, and it continues to evolve. With this template present the latest information on cryptocurrency and the emerging blockchain technologies. This features a variety of high-quality slides in many formats. Whether you want them to be edited on Keynote, PowerPoint, or google sheets this template has everything you need to make the most out of your presentation. Get creative and add your own style with this presentation template!


6 slides
Multiple Business Solutions Options Slide Presentation
Explore diverse strategies with the Multiple Business Solutions Options Slide Presentation. Featuring a vertical stack of labeled briefcases (A–F), this slide is designed to compare and communicate multiple business ideas, solutions, or pathways in a clear, structured layout. Ideal for pitching product variations, workflow choices, or market entry tactics. Each option is paired with customizable text fields for added clarity. Compatible with PowerPoint, Keynote, and Google Slides for easy editing and integration into your existing decks.


6 slides
Bubble Mapping Strategy Presentation
Turn your ideas into a clear visual roadmap that captures every connection and concept in one glance. This professional presentation helps organize strategies, goals, and processes through an easy-to-follow bubble map layout. Fully customizable and compatible with PowerPoint, Keynote, and Google Slides for seamless editing and presentation.


6 slides
Product and Service Options
Clearly compare your offerings with this side-by-side product vs. service infographic. Perfect for illustrating feature breakdowns, pros and cons, or key differentiators between two business models. With six customizable points and modern icons, this layout is ideal for sales decks, marketing pitches, or strategy presentations. Fully editable in PowerPoint, Keynote, and Google Slides.


6 slides
Stakeholder Analysis and Engagement
Effectively map out internal and external stakeholders with this structured hexagon-based layout. This presentation highlights six key groups—Employee, Manager, Shareholder, Society, Media, and Customer—centered around your company. Ideal for corporate strategy, stakeholder engagement, or CSR planning. Fully customizable in PowerPoint, Keynote, and Google Slides.


10 slides
Hierarchy Tree Structure Slide Presentation
Bring your ideas to life with a dynamic visual flow that connects every stage of your business strategy. Perfect for mapping growth, processes, or team structures, this clean and modern layout keeps your data clear and engaging. Fully compatible with PowerPoint, Keynote, and Google Slides for effortless customization.