


Features
- 6 Unique slides
- Fully editable and easy to edit in Microsoft Powerpoint, Keynote and Google Slides
- 16:9 widescreen layout
- Clean and professional designs
- Export to JPG, PDF or send by email


Do you have any questions?
Recommend


7 slides
Company Insurance Infographic Presentation
An Insurance Infographic is a visual representation of data related to the insurance industry. You can educate consumers on insurance policies, coverage options, and industry trends. This template includes a combination of data, statistics, and graphics that help explain key concepts related to insurance. You can use this infographic to include information on different types of insurance policies, claims, premiums, and industry-specific trends. Designed in Powerpoint, Keynote, and Google Slides this is a powerful tool for communicating complex insurance concepts in a simple and engaging way.


8 slides
Business KPI Dashboard Presentation
Track performance at a glance with the Business KPI Dashboard Presentation. This clean, professional layout includes a speedometer-style gauge and monthly bar chart to showcase progress, goals, or metrics clearly. Ideal for reporting, analysis, or executive summaries. Fully editable and compatible with PowerPoint, Keynote, and Google Slides.
5 slides
PM Milestone Planning and Tracking Layout Presentation
Track your project progress with clarity using the PM Milestone Planning and Tracking Layout Presentation. This curved arrow timeline visually guides stakeholders through five key stages of your project plan, highlighting each milestone with clear labels. Fully editable in Canva, PowerPoint, Keynote, and Google Slides for flexible use.


6 slides
Veterinary Services Infographic
Veterinary services refer to medical and healthcare services provided to animals by trained and licensed professionals called veterinarians. This infographic template aims to educate pet owners and the general public about the importance of veterinary care for animals' health and well-being. This template serves as a valuable resource for pet owners, animal lovers, and anyone interested in understanding the significance of veterinary care in maintaining the well-being of our beloved animal companions. This infographic aims to promote responsible pet ownership and raise awareness about the importance of regular veterinary visits for pets' health and happiness.


6 slides
Risk Management Jobs Infographics
Our Risk Management Jobs infographic is meticulously crafted for Powerpoint, Keynote, and Google Slides, providing a valuable resource for HR professionals, risk consultants, and corporate trainers. This infographic is designed to delineate various job roles within the risk management field, detailing responsibilities, qualifications, and career paths. The infographic outlines the hierarchy and scope of positions, ranging from entry-level risk analysts to chief risk officers, and includes essential information on the skill sets and expertise required for each role. By presenting this data in a visually engaging format, the infographic simplifies the complexity of risk management career structures. Incorporating this infographic into career development workshops, job fairs, or internal training sessions will enhance understanding of the professional opportunities within risk management. It can also serve as a guide for those looking to advance in the field, providing clarity on the progression and specializations available. Use this infographic to effectively communicate the diverse range of roles and career trajectories in risk management.


10 slides
Corporate Skills Training Program
Empower your team with a well-rounded visual guide to skill development using this sleek circular training program slide. Each segment highlights core corporate training areas—compliance, leadership, product knowledge, and employee growth—making it easy to communicate learning pathways. Fully editable and compatible with PowerPoint, Keynote, and Google Slides for seamless use.


8 slides
Geographic South America Template Presentation
Explore your data through a clean, professional map that highlights key insights and regional details across South America. Ideal for presenting demographics, business distribution, or performance metrics, this design combines clarity with impact. Fully compatible with PowerPoint, Keynote, and Google Slides for easy editing and seamless presentation.


5 slides
Experience-Based Smile Scorecard Presentation
Measure sentiment with ease using this Experience-Based Smile Scorecard slide. Designed with a vertical battery-style layout, each tier represents a distinct emotional level—from dissatisfied to happy. Ideal for visualizing user experiences, customer feedback, or service quality. Fully editable and compatible with PowerPoint, Canva, and Google Slides.


7 slides
Professional Goals Infographic
Unfold the pathway to success with our professional goals infographic. Designed to help individuals and organizations visualize and track their aspirations, this infographic offers a comprehensive look at professional milestones and strategies to achieve them. The primary palette revolves around a pristine white backdrop, enhanced by accents of vibrant orange and a mix of complementary colors to distinguish different areas. Its design ensures seamless integration into PowerPoint, Keynote, or Google Slides presentations, transforming your professional goals discourse into a visually engaging experience.


7 slides
Operational Risk Management Infographic
Dive into the methodical domain of risk management with our sleek risk management infographic. Cloaked in varying blue tones, our template embodies the serenity and stability that effective risk management brings to operations. Enhanced with precise infographics, clear icons, and relevant image placeholders, it transforms complex risk analysis into easily comprehensible visual insights. Flawlessly crafted for Powerpoint, Keynote, or Google Slides. A pivotal tool for business strategists, operations managers, financial analysts, or any organization aiming to fortify its operational resilience. Strategize with clarity; let every slide be a shield against potential pitfalls.


2 slides
Detailed Buyer Profile Analysis Layout Presentation
Showcase a clear snapshot of your customer insights with this Detailed Buyer Profile Analysis Layout. This modern slide helps you outline bios, goals, and key traits using labeled icons, progress bars, and a visual profile section. Ideal for marketing teams, persona development, and product targeting. Fully editable in PowerPoint, Keynote, and Google Slides.


5 slides
Next-Gen Networks and 5G Infrastructure Presentation
Build the future, one signal at a time. This engaging infographic presentation visually tracks the evolution of mobile network infrastructure, using a clean timeline layout with colorful tower icons and milestone markers. Perfect for tech educators, analysts, or engineers. Fully compatible with PowerPoint, Keynote, and Google Slides for seamless editing.


4 slides
Strategic Business Objectives Framework
Showcase your company's top strategic goals with this clean and professional slide. Each briefcase icon represents a key business objective, perfect for planning, reporting, or investor updates. Fully customizable in PowerPoint, Keynote, and Google Slides.


4 slides
EU Business Coverage Map Presentation
Highlight your European business presence with the EU Business Coverage Map Presentation. This slide layout uses pinpoint markers and color-coded regions to showcase operations, regional offices, or market coverage across Europe. Ideal for quarterly reports, sales updates, or investor briefings. Fully editable in PowerPoint, Keynote, Google Slides, and Canva.


21 slides
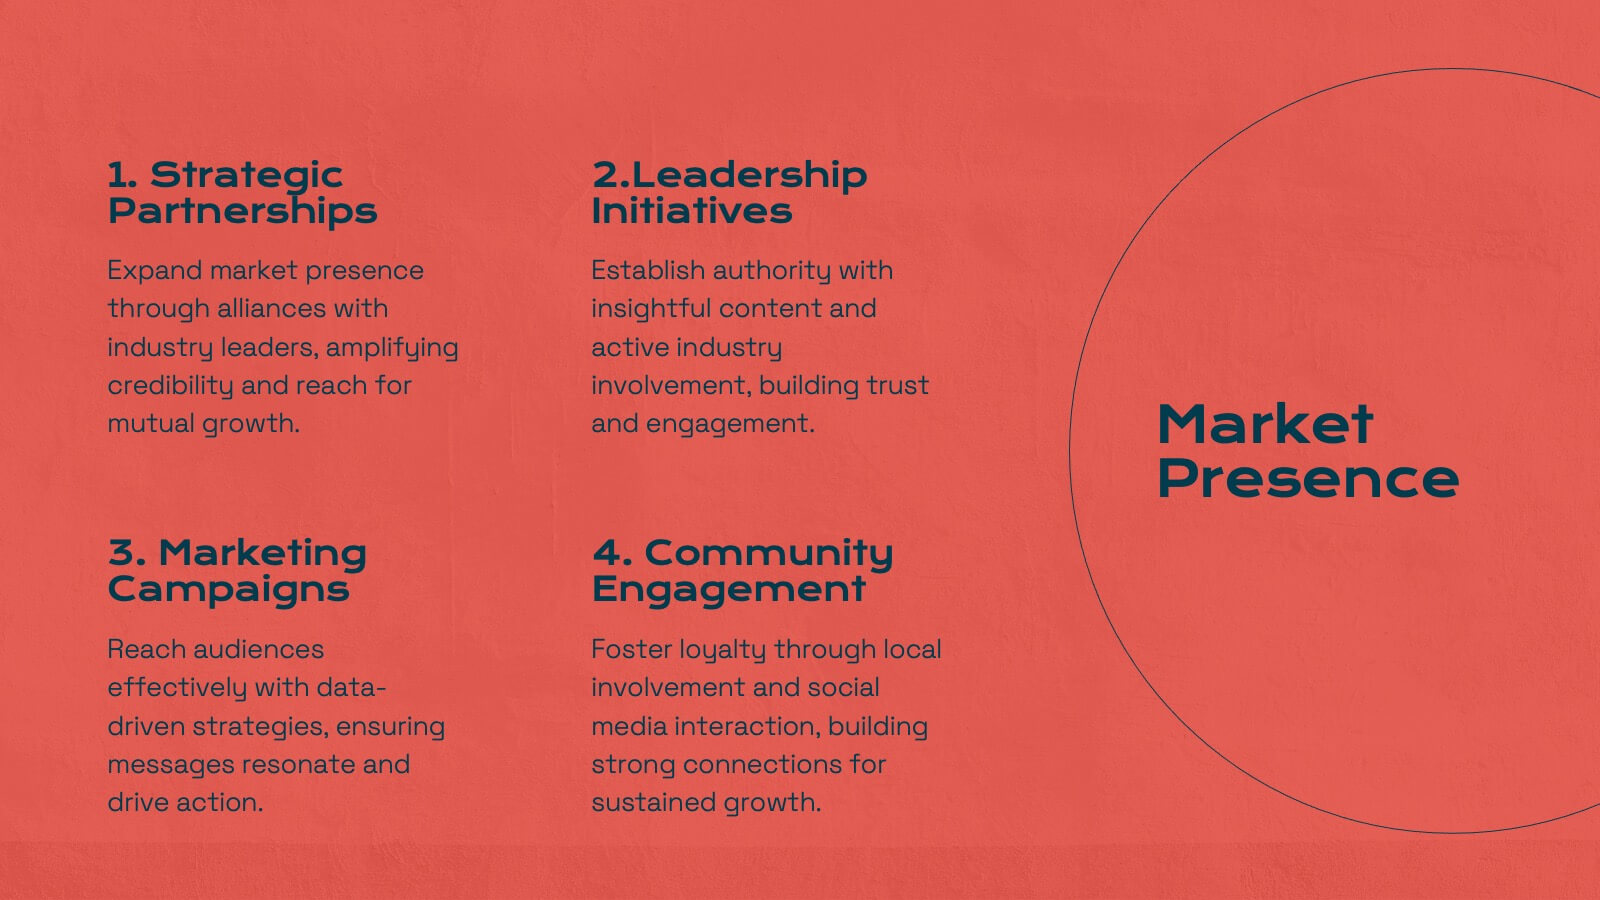
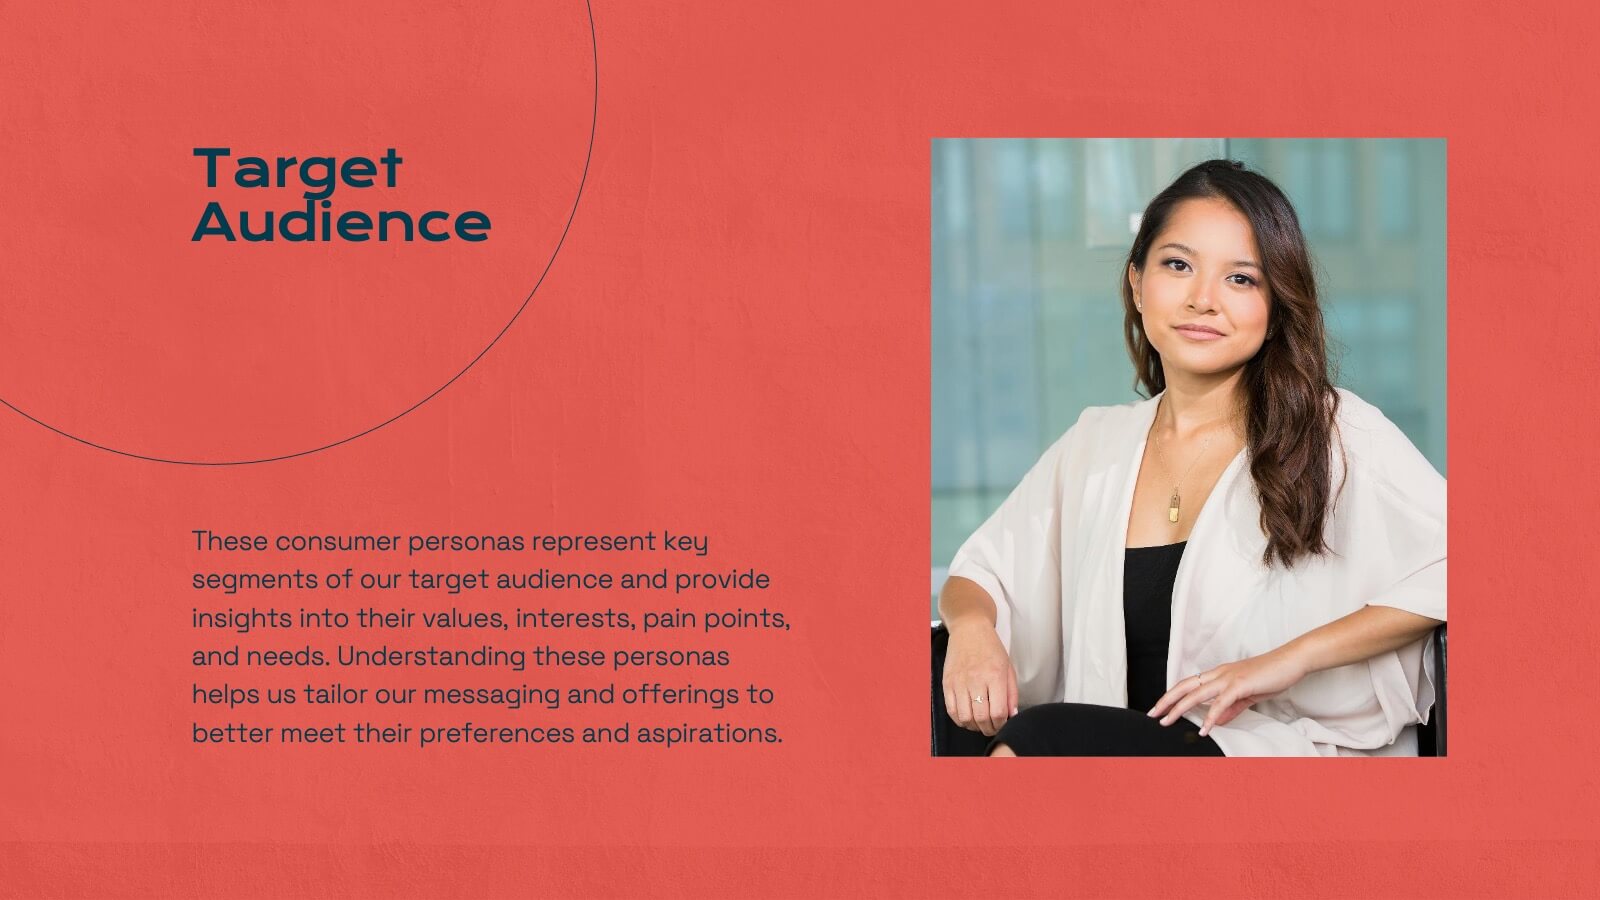
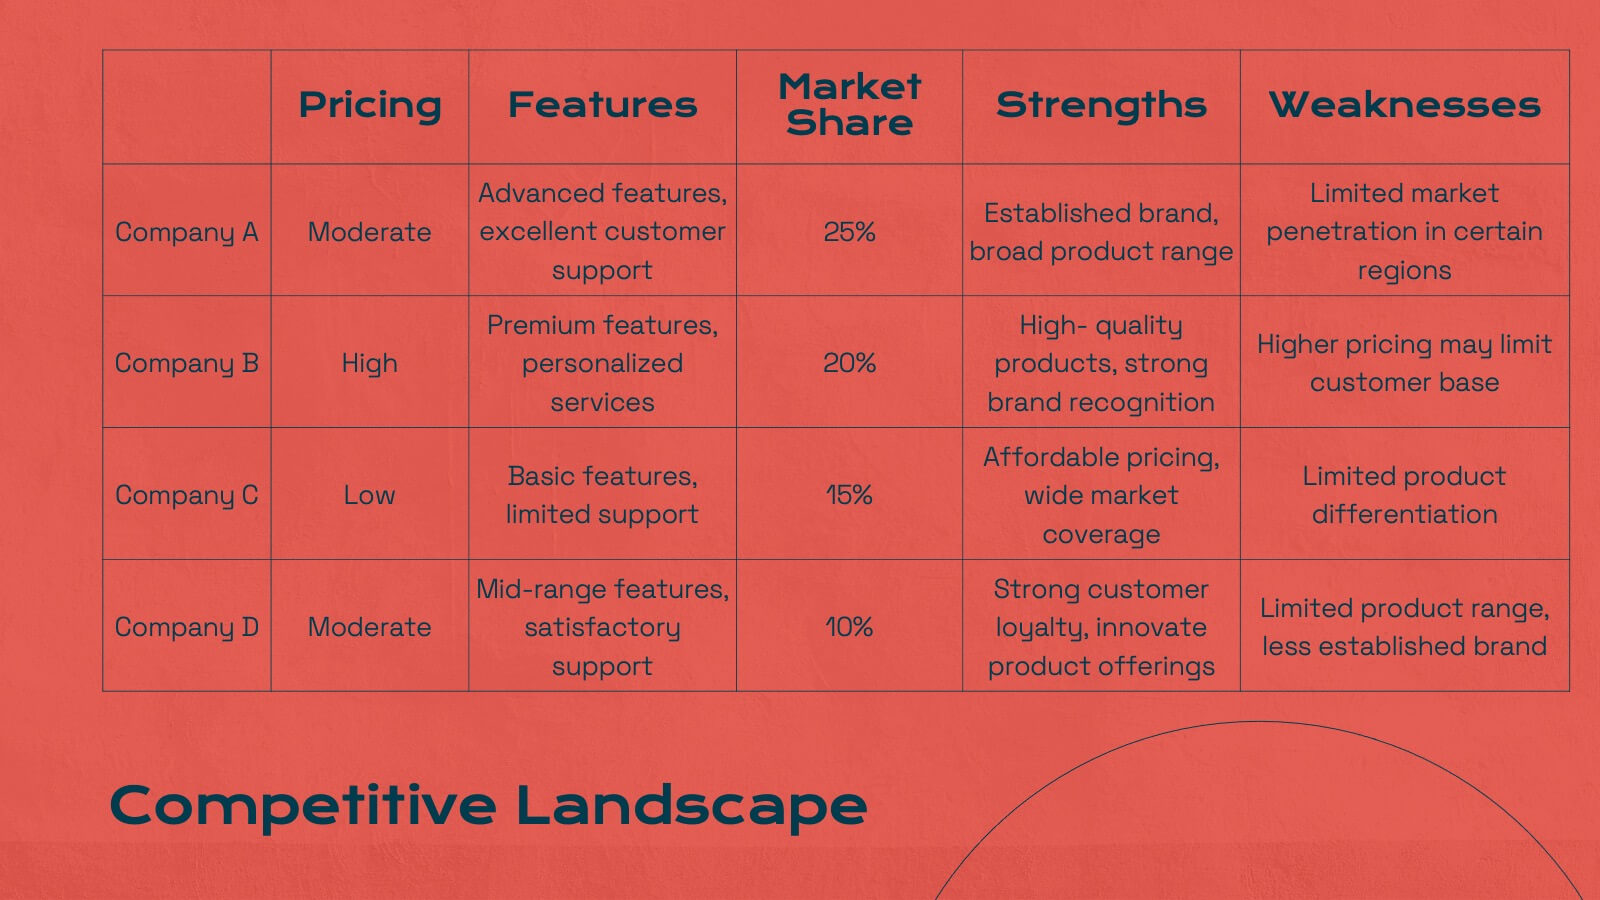
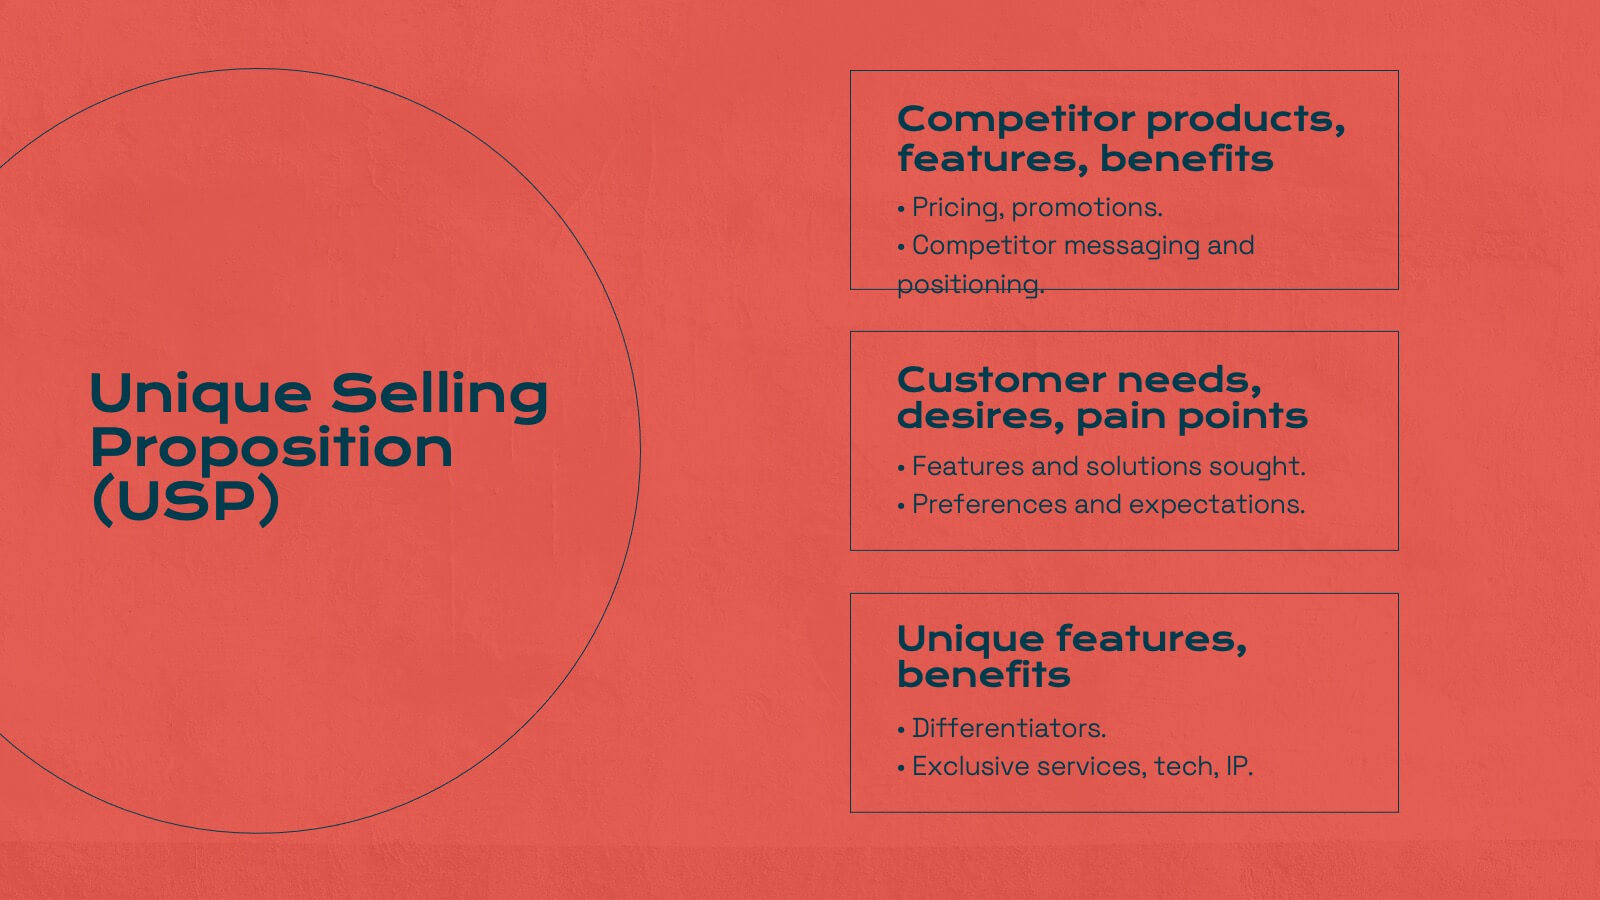
Titan Marketing Research Report Presentation
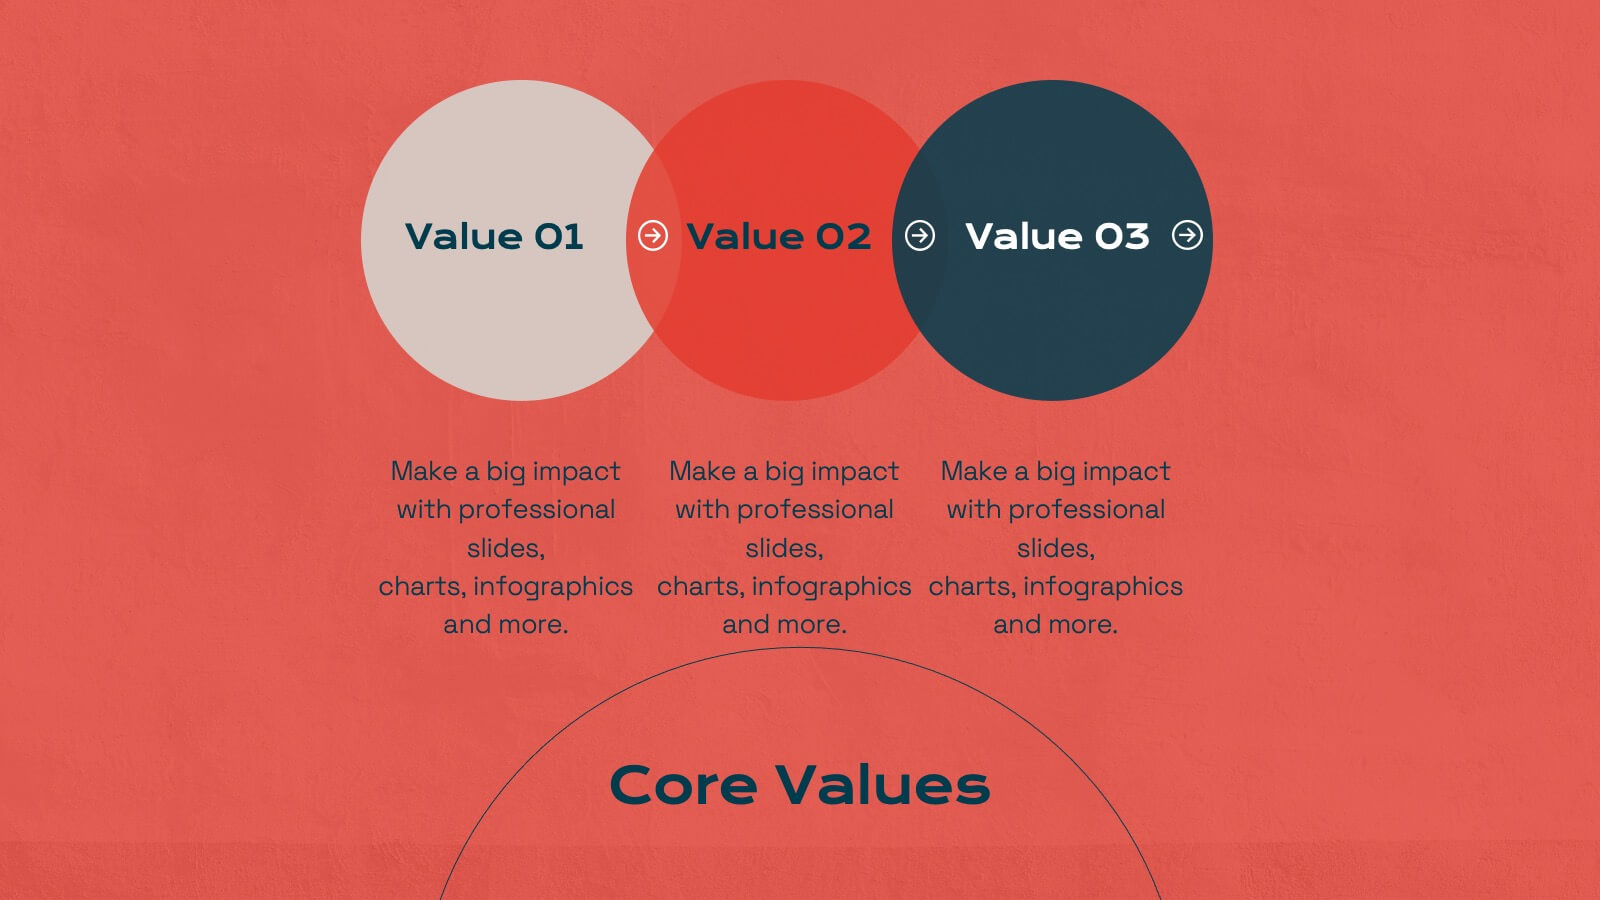
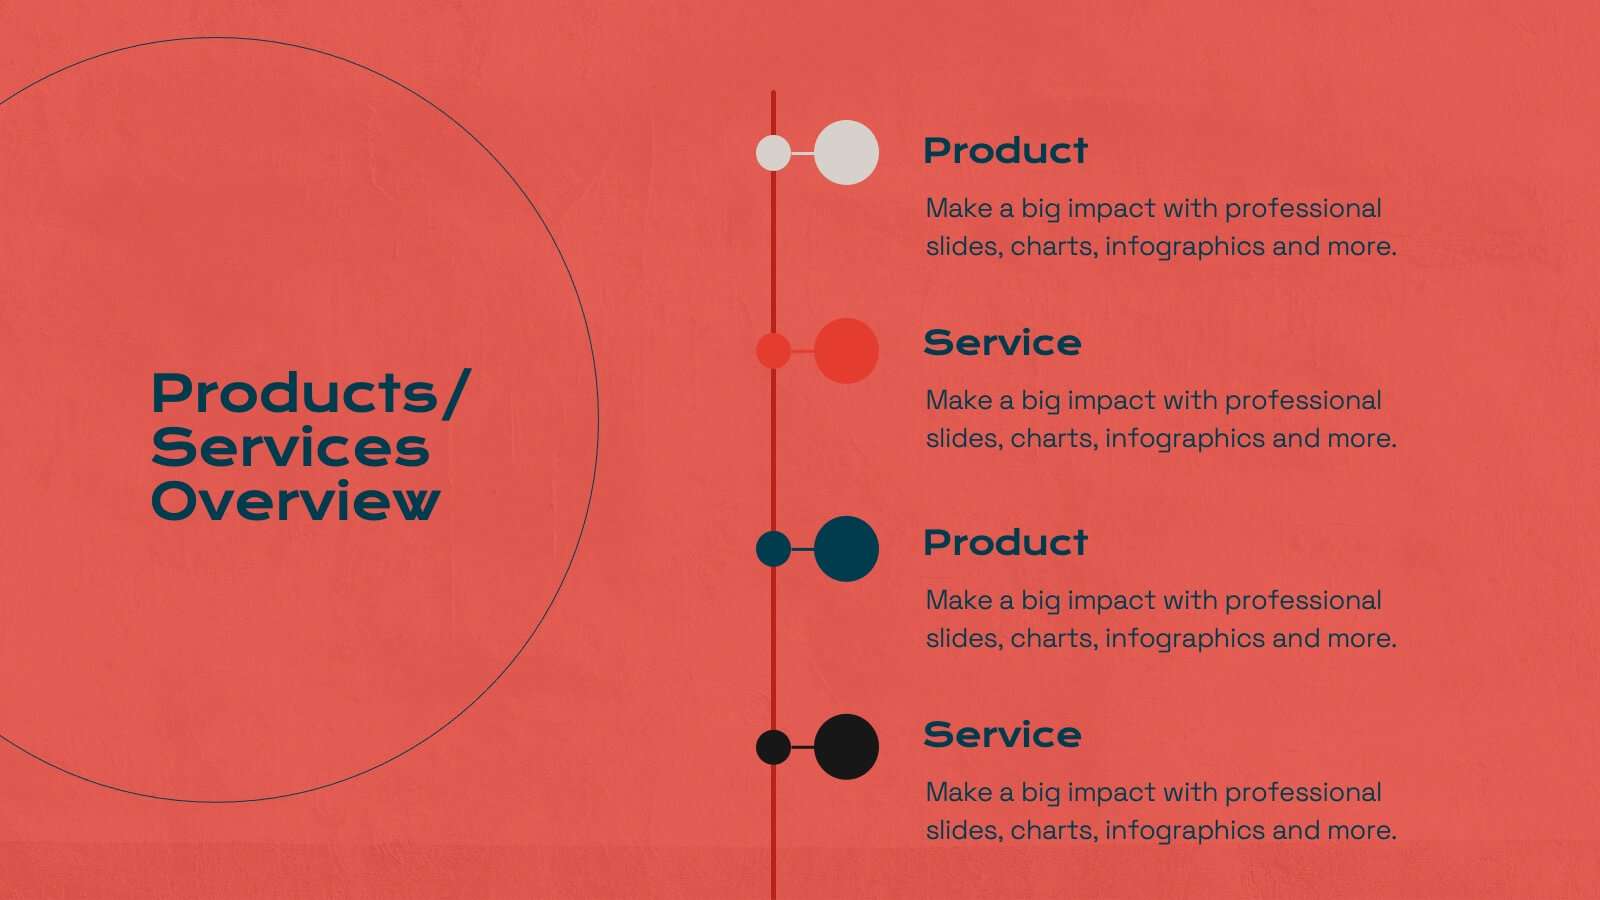
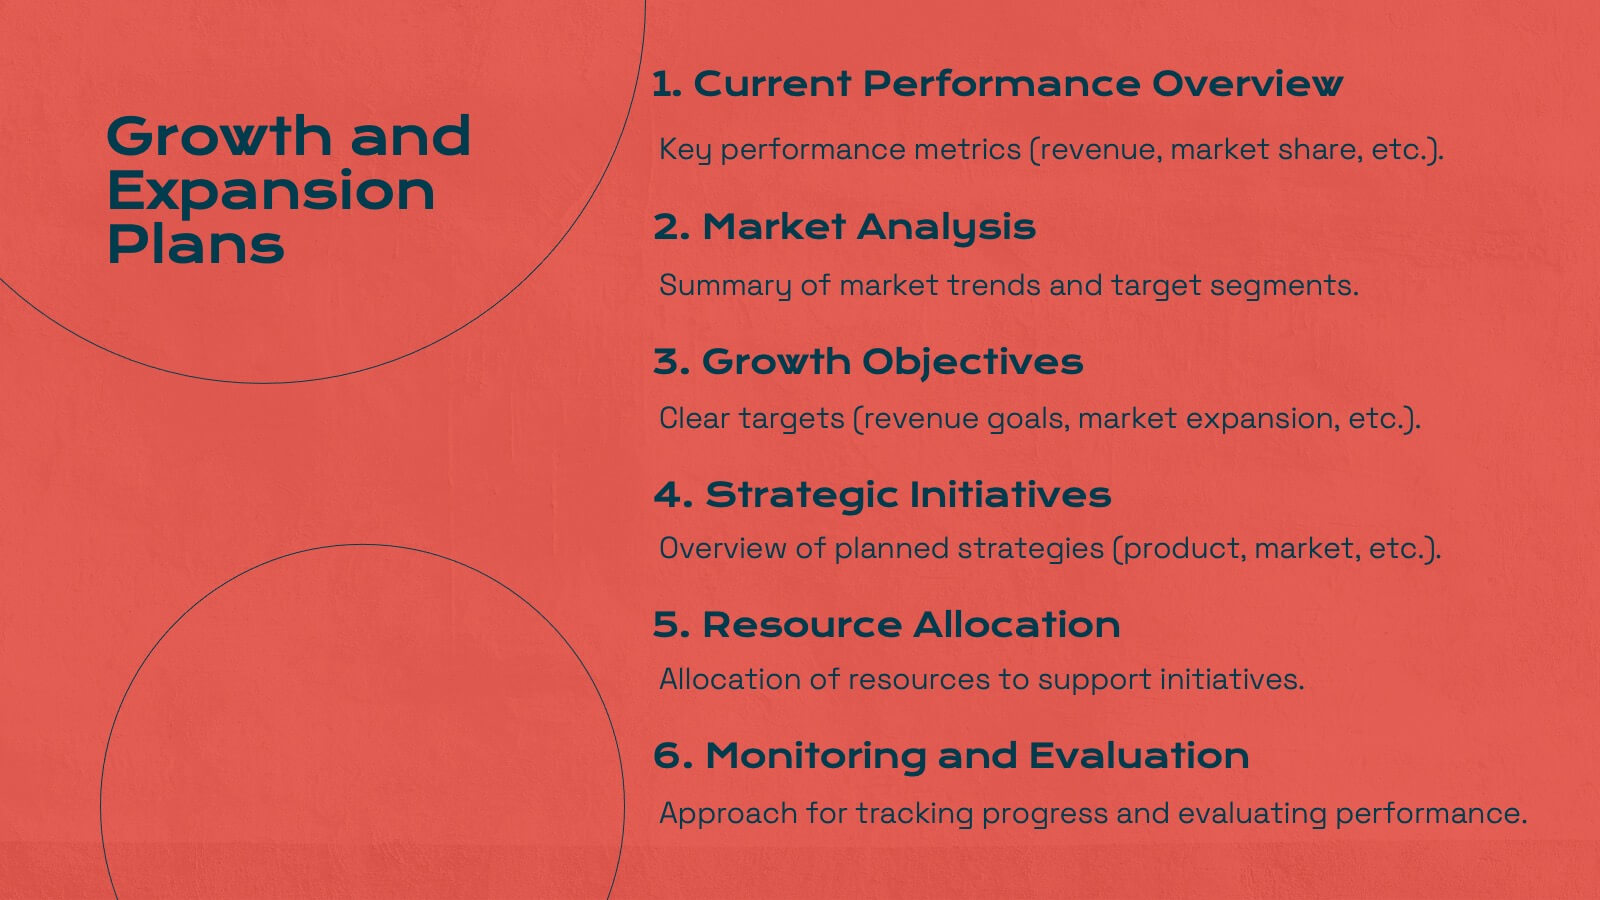
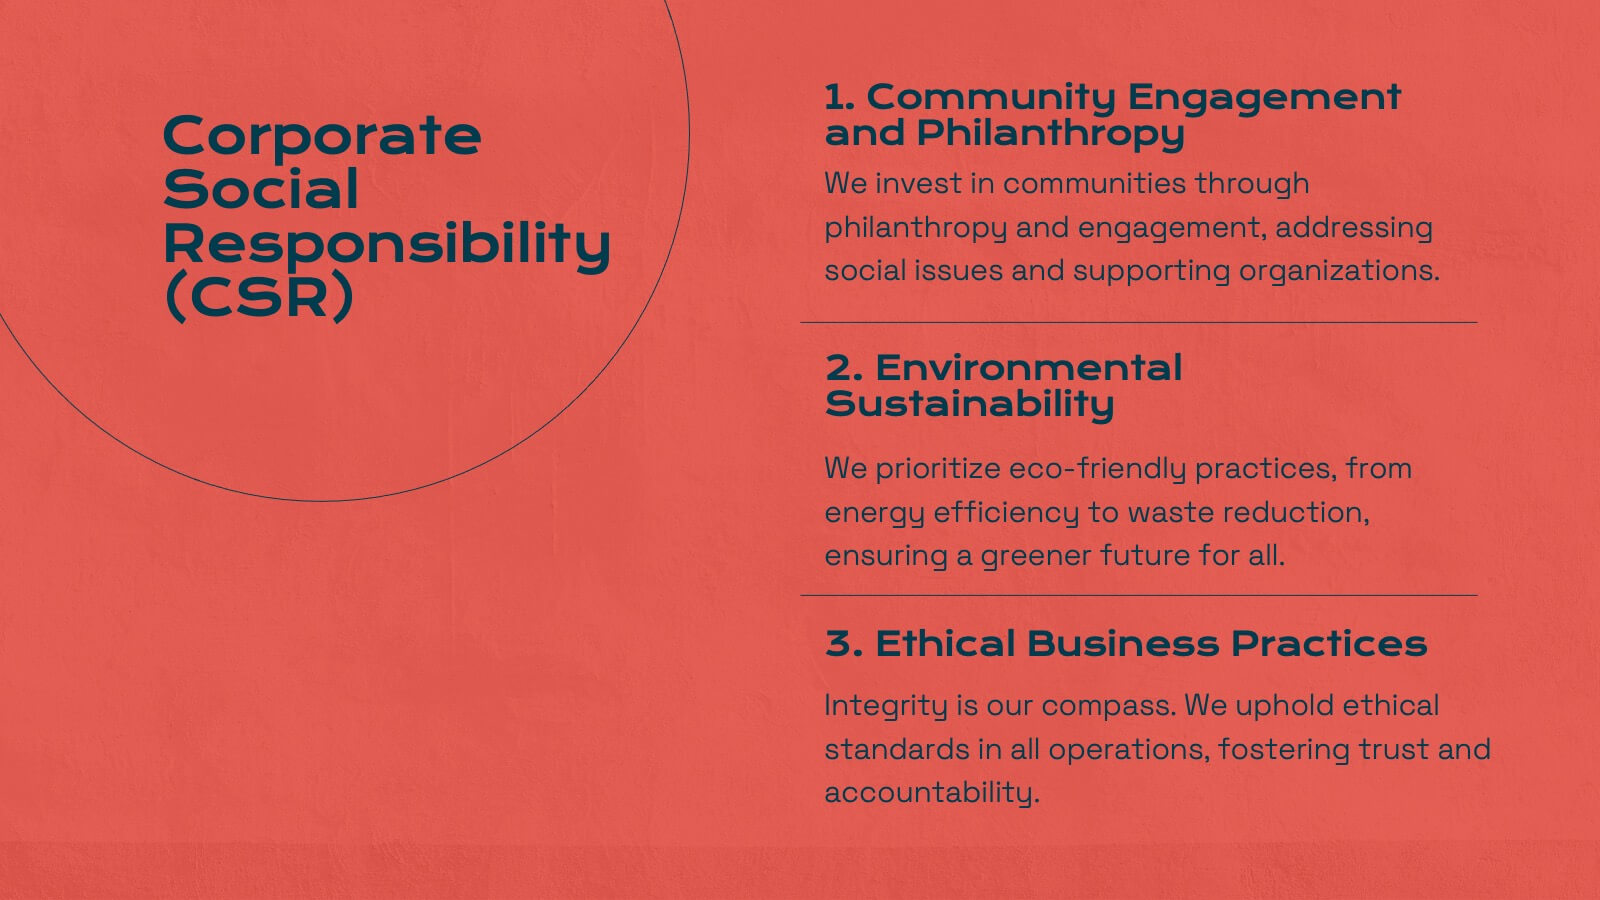
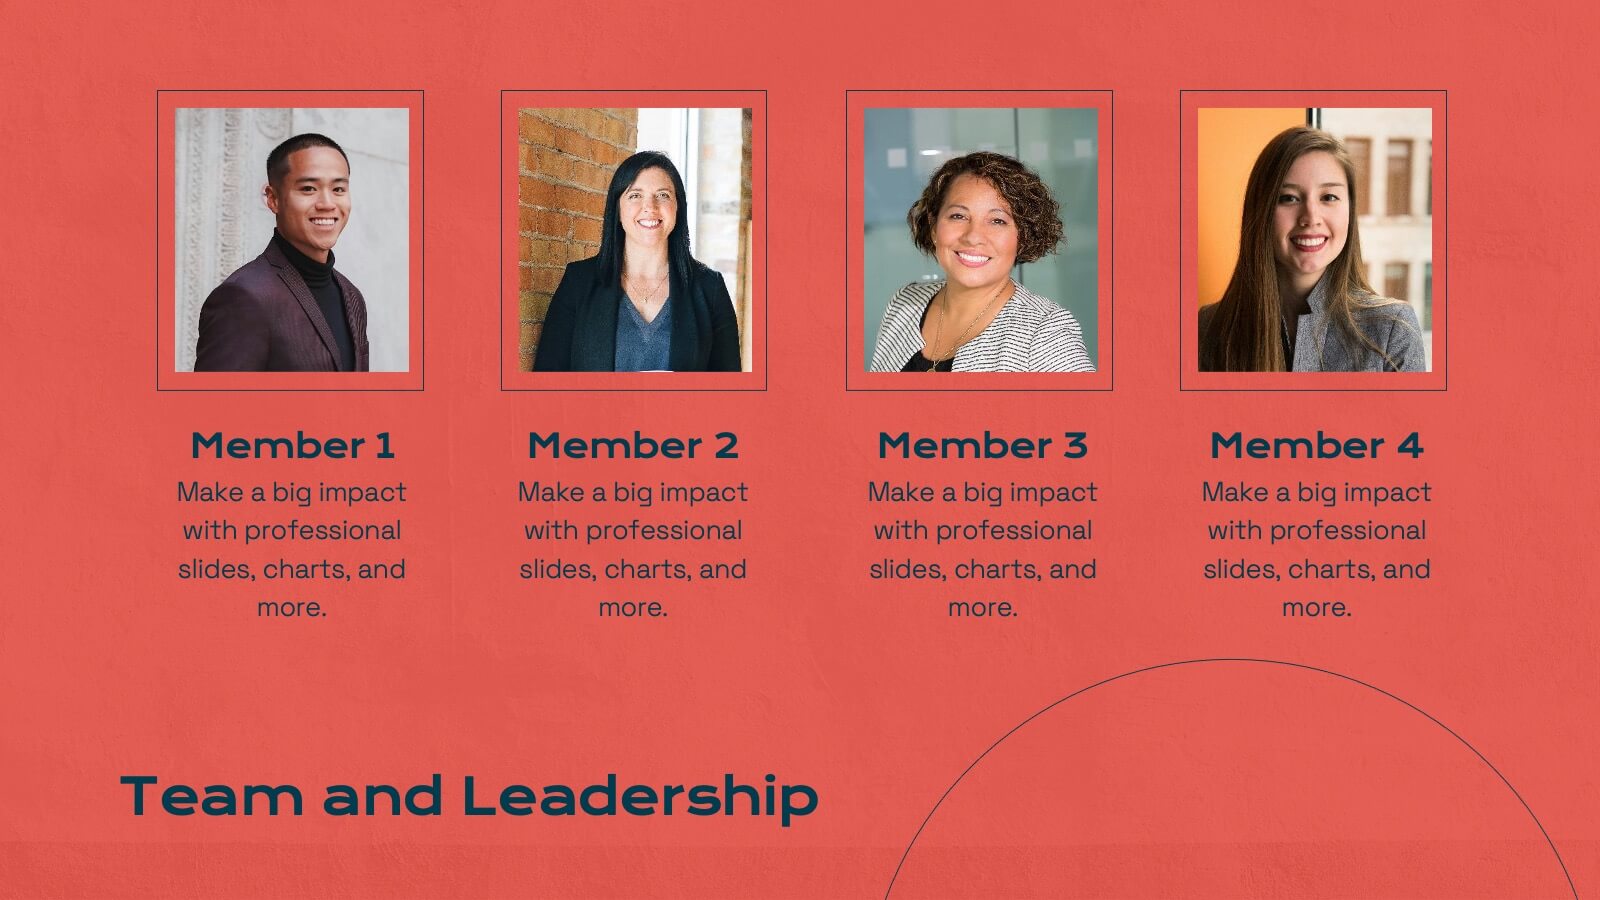
Energize your marketing research presentations with this bold, vibrant template. Perfect for detailing company history, market presence, and competitive landscapes, it features a striking red design that captures attention. Highlight key insights like target audience, financial highlights, and growth plans to engage your audience. Compatible with PowerPoint, Keynote, and Google Slides, it ensures seamless presentations on any platform.


21 slides
Luminary Annual Report Presentation
Create stunning annual reports with this sleek template! Highlight key achievements, financial summaries, and performance metrics. Perfect for showcasing operational updates, strategic initiatives, and market trends. Designed for business professionals and analysts. Compatible with PowerPoint, Keynote, and Google Slides.


7 slides
Time Management Importance Infographic
Time management is a crucial skill that involves organizing and prioritizing tasks, activities, and responsibilities to make the most effective use of your time. Creating an infographic about the importance of time management is a valuable tool for conveying this critical skill visually and succinctly, let our template guide you. Customize the content, design, and visuals to create an engaging and informative infographic that effectively communicates the importance of time management. This presentation will inspire your audience to seize the day and make the most of their time!