


Features
- 4 Unique slides
- Fully editable and easy to edit in Microsoft Powerpoint, Keynote and Google Slides
- 16:9 widescreen layout
- Clean and professional designs
- Export to JPG, PDF or send by email


Do you have any questions?
Recommend


5 slides
Hierarchical Pyramid Diagram Presentation
The "Hierarchical Pyramid Diagram Presentation" template is designed to effectively represent organizational structures, data hierarchies, or step-by-step processes. This versatile template features a layered pyramid structure, enabling clear visualization of relationships and dependencies between different levels or components within a system. Ideal for business presentations, strategy discussions, and educational materials, this template aids in conveying complex information in a straightforward and visually appealing manner. The use of distinct colors for each level enhances readability, making it easier to identify and discuss each segment in detail during presentations.


4 slides
Logistics Chain and Delivery Map Presentation
Navigate global supply chains with ease using this dynamic shipping and delivery slide. Designed around a cargo ship visual, this infographic helps teams outline each stage of their logistics journey—from origin to destination. Ideal for supply chain updates, shipping plans, or logistics strategy meetings. Fully compatible with PowerPoint, Keynote, and Google Slides.


6 slides
Sports Equipment Infographics
The "Sports Equipment" infographic template is a dynamic and engaging tool, perfectly crafted for PowerPoint, Keynote, and Google Slides. This template is an excellent choice for sports retailers, equipment manufacturers, and fitness enthusiasts who wish to showcase a range of sports gear and its features. The template vividly displays various types of sports equipment, detailing their use, benefits, and technical specifications. It's designed to highlight product features, usage tips, and maintenance advice, making it highly useful for product demonstrations, sales presentations, and customer education. With a vibrant and energetic design, the color scheme of the template is tailored to capture the spirit of sports and fitness. This not only makes the presentation visually striking but also aligns with the themes of activity, energy, and health. Whether used in a retail setting, a trade show, or a fitness workshop, this template ensures that the diverse range of sports equipment is presented in a visually appealing, organized, and informative manner.


26 slides
Creative Cryptocurrency Investment Presentation
The growth of Cryptocurrency has been significant over the past few years. It is very important to do your own research, understand the risks involved, and only invest what you can afford to lose. This template is designed with a focus on cryptocurrencies and includes customizable photo layouts, charts, a gold coin pattern and unique cryptocurrency-themed icons and illustrations. You can use this template for any topic related to Cryptocurrency or Blockchain. Create your own presentation within minutes using Powerpoint, Keynote, or Google slides, it is fully editable to suit your needs.


6 slides
Go-to-Market Launch Plan Presentation
Launch with confidence using this Go-to-Market Launch Plan Presentation. This clean, step-by-step visual framework highlights each phase of your GTM strategy—from market research to execution metrics. Ideal for startups, product managers, and marketing teams. Fully customizable in PowerPoint, Keynote, and Google Slides.


5 slides
Tips for Recycling Infographics
Recycling is an important practice that helps reduce waste, conserve resources, and protect the environment. These vertical infographics are designed to educate and encourage individuals on effective recycling practices. These provides a comprehensive overview of recycling and offers practical tips to help people incorporate recycling into their daily lives. This aims to educate and inspire individuals to take an active role in recycling and waste reduction. These are the perfect tools to raise awareness about waste management, and encourage sustainable behaviors. Compatible with Powerpoint, Keynote, and Google Slides.


20 slides
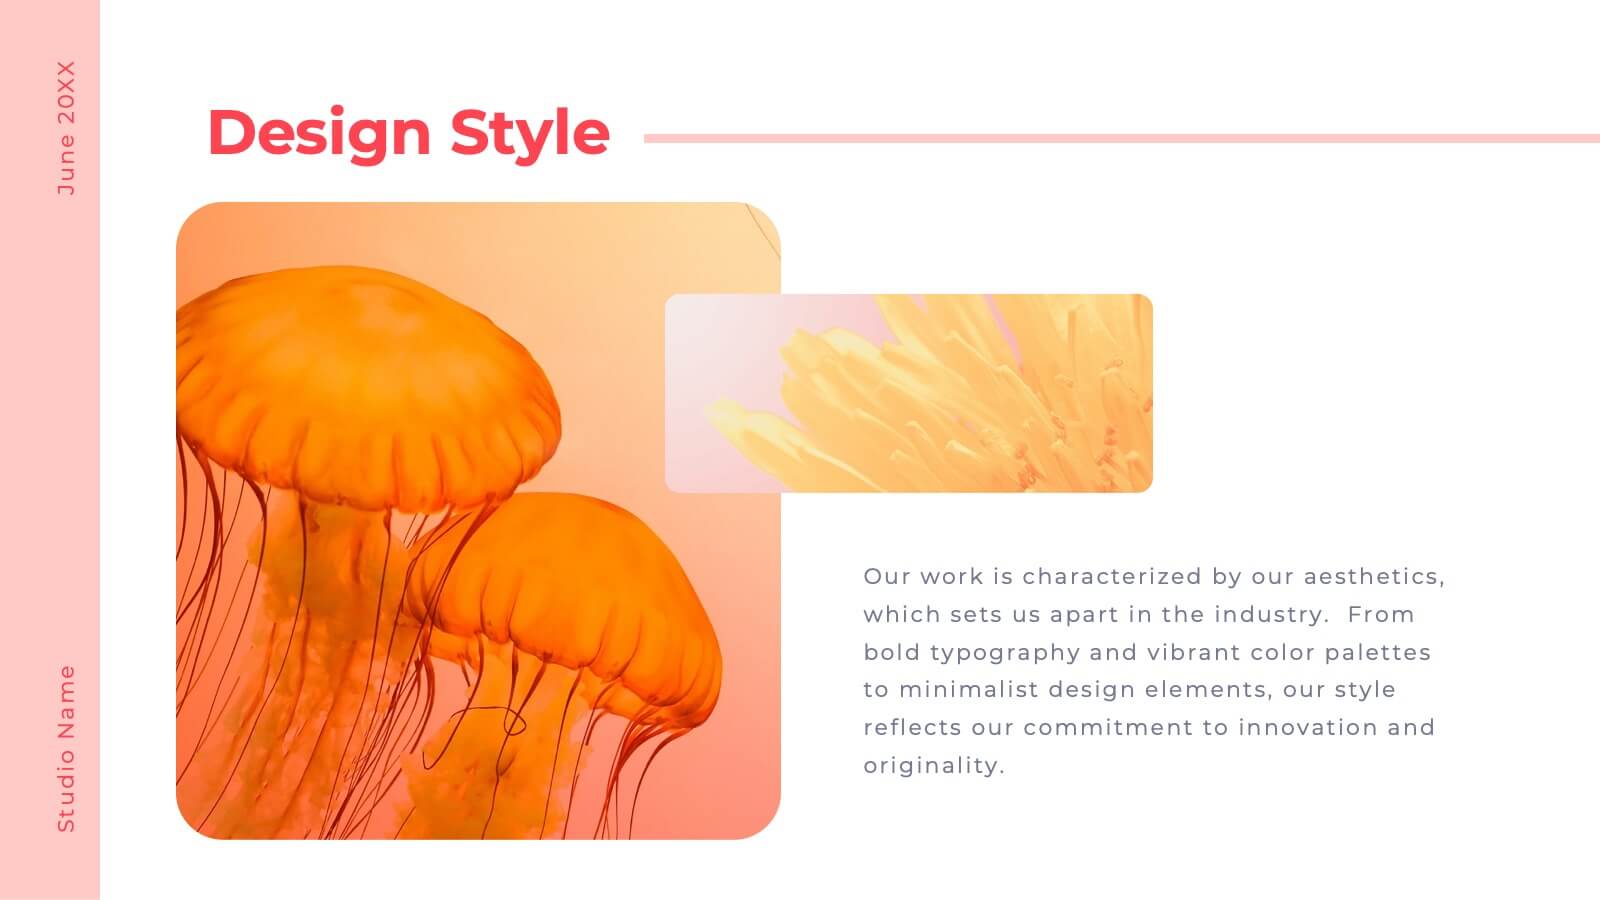
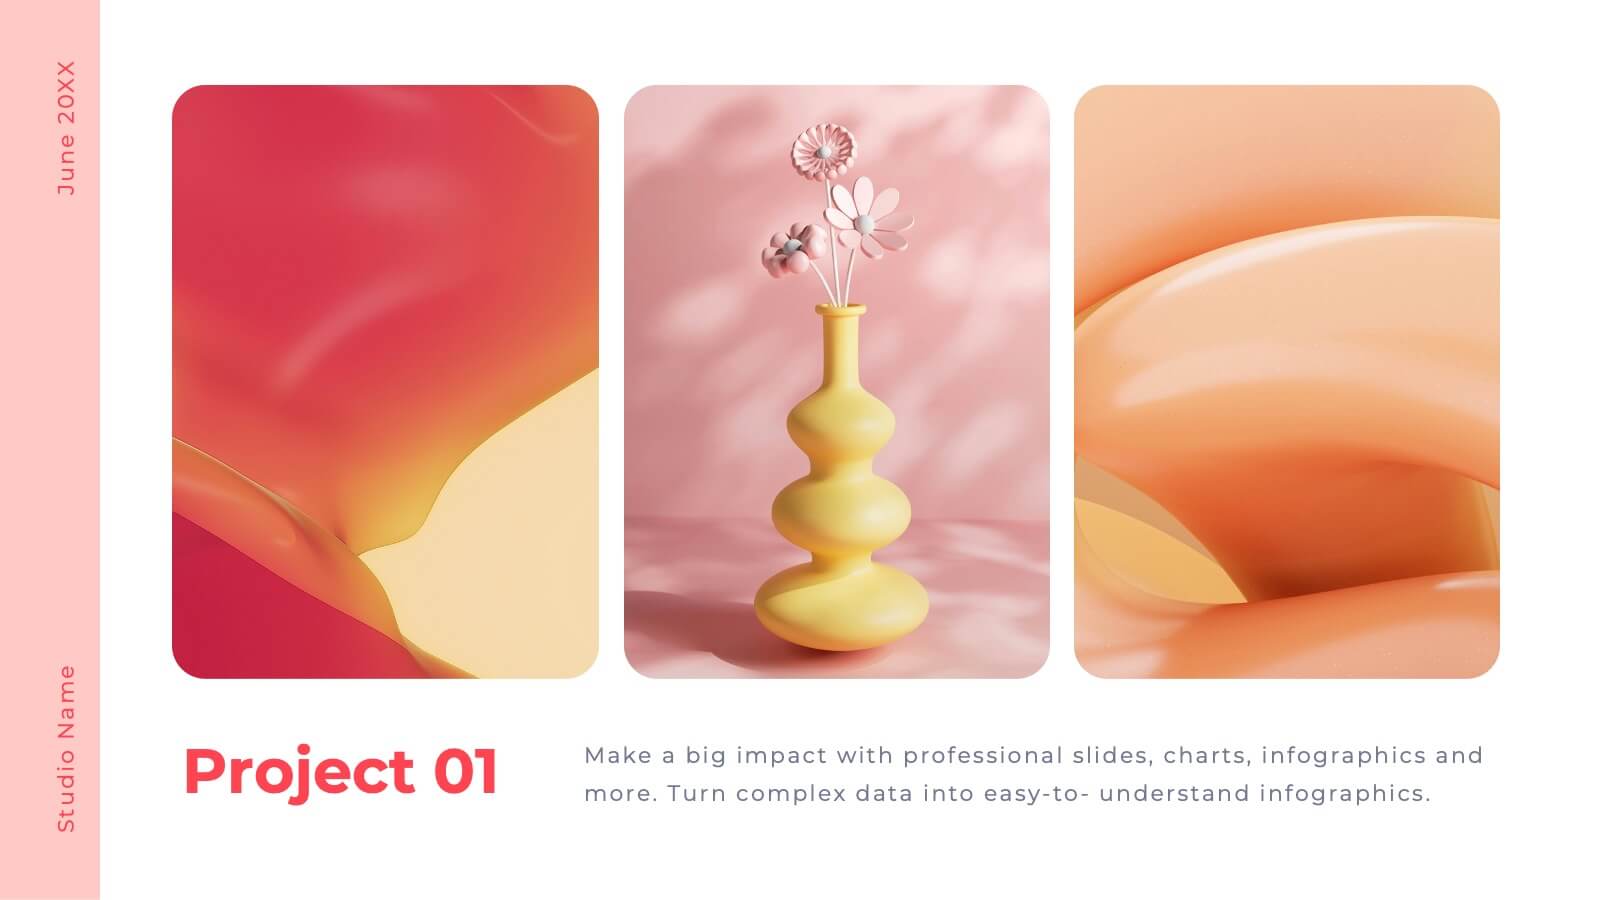
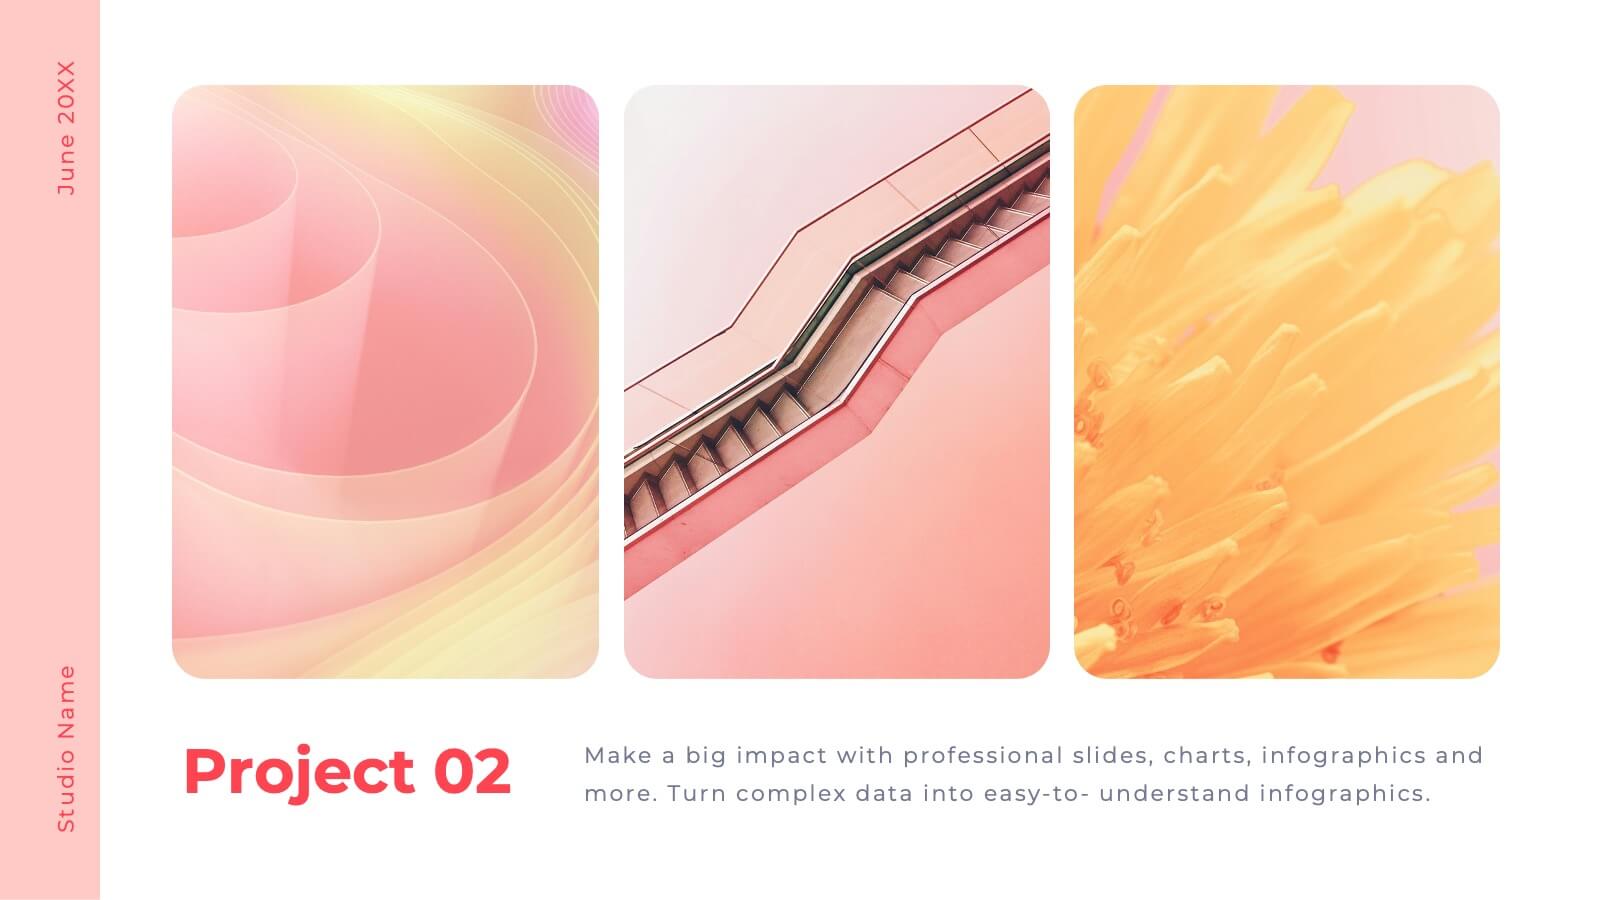
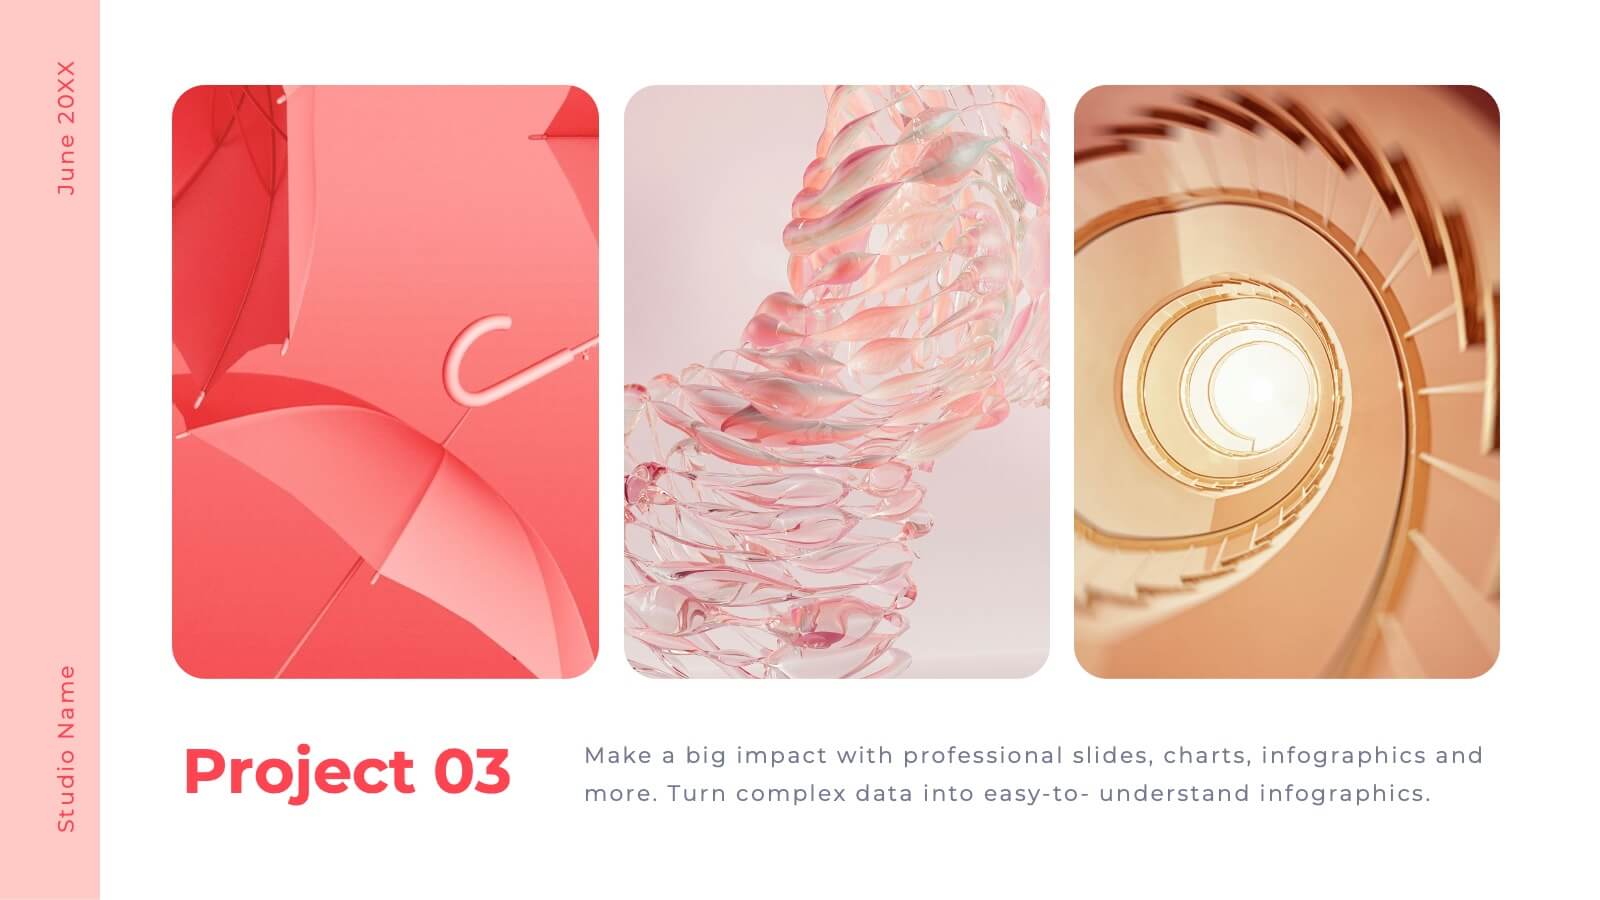
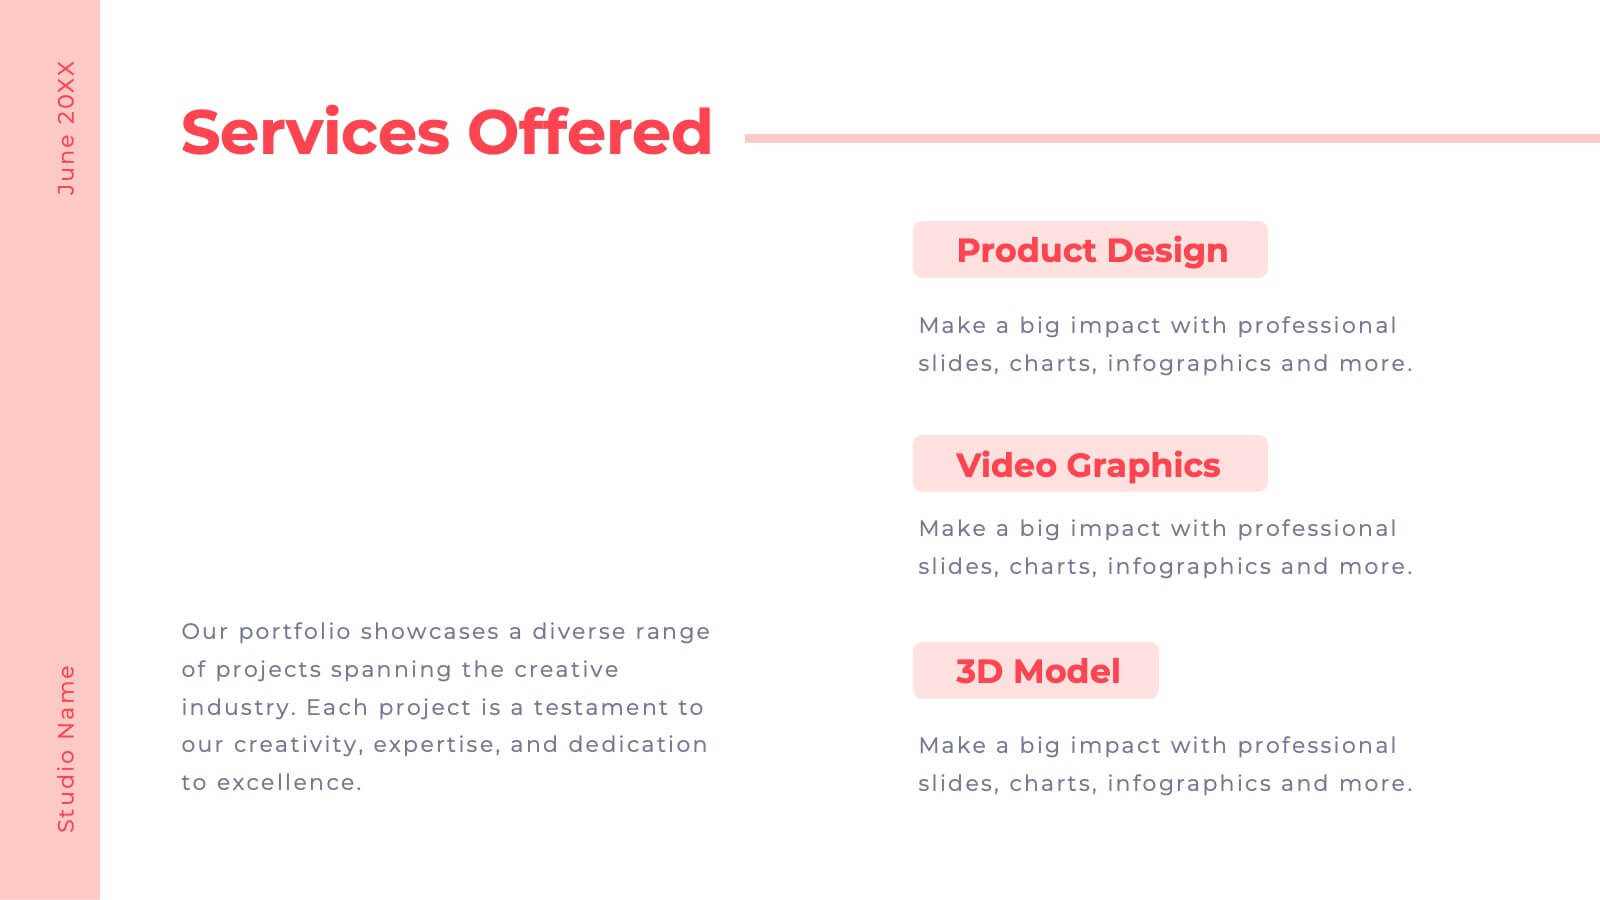
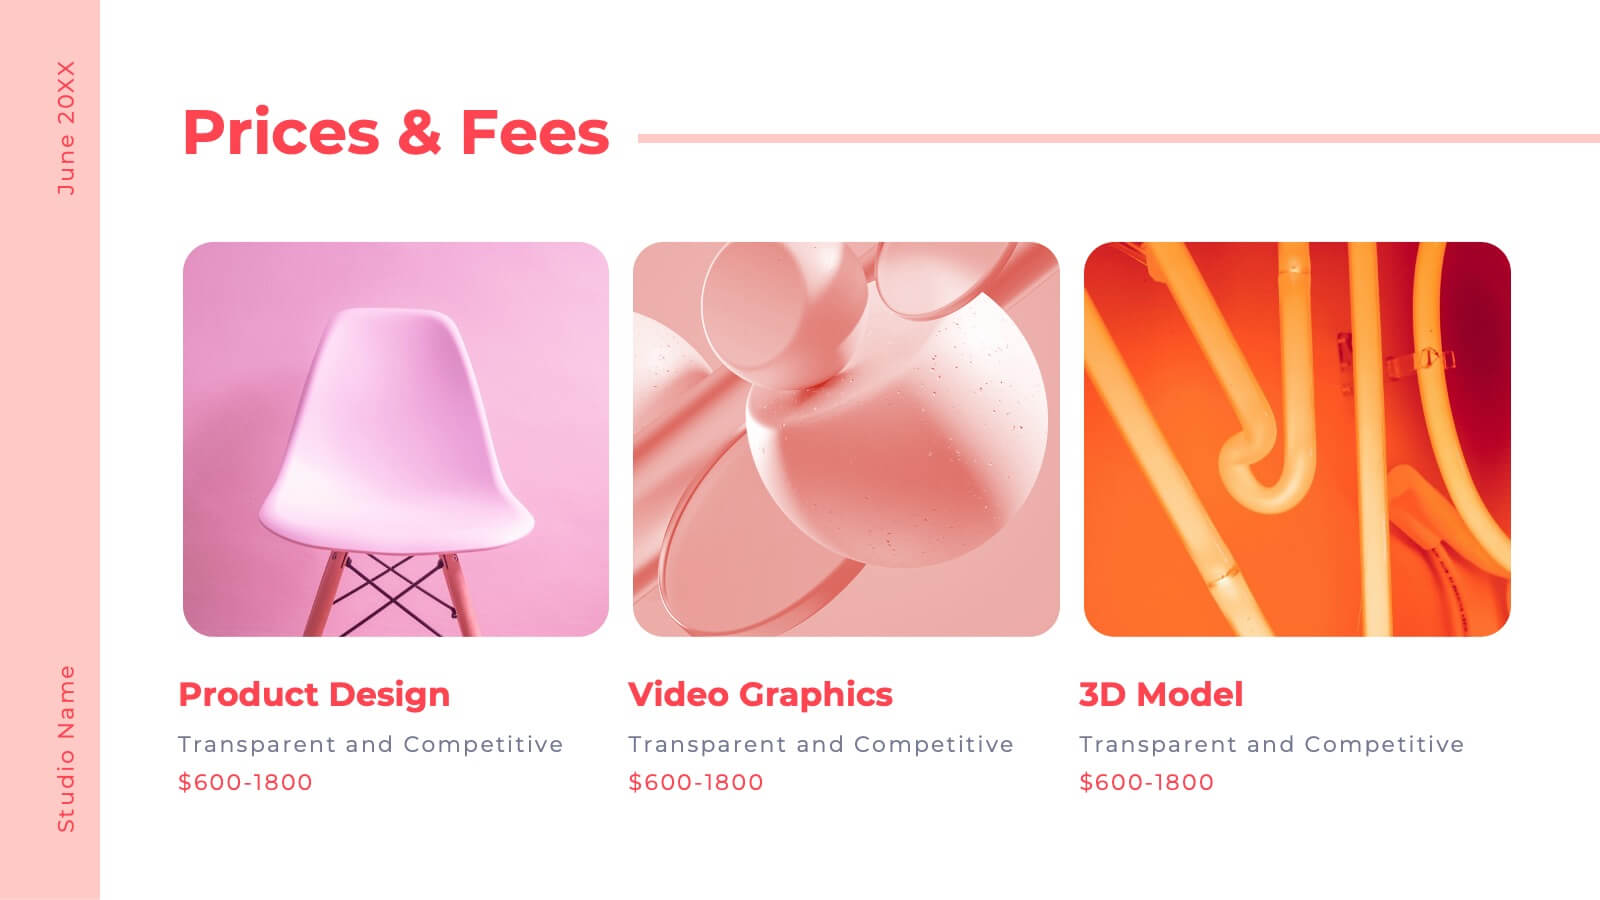
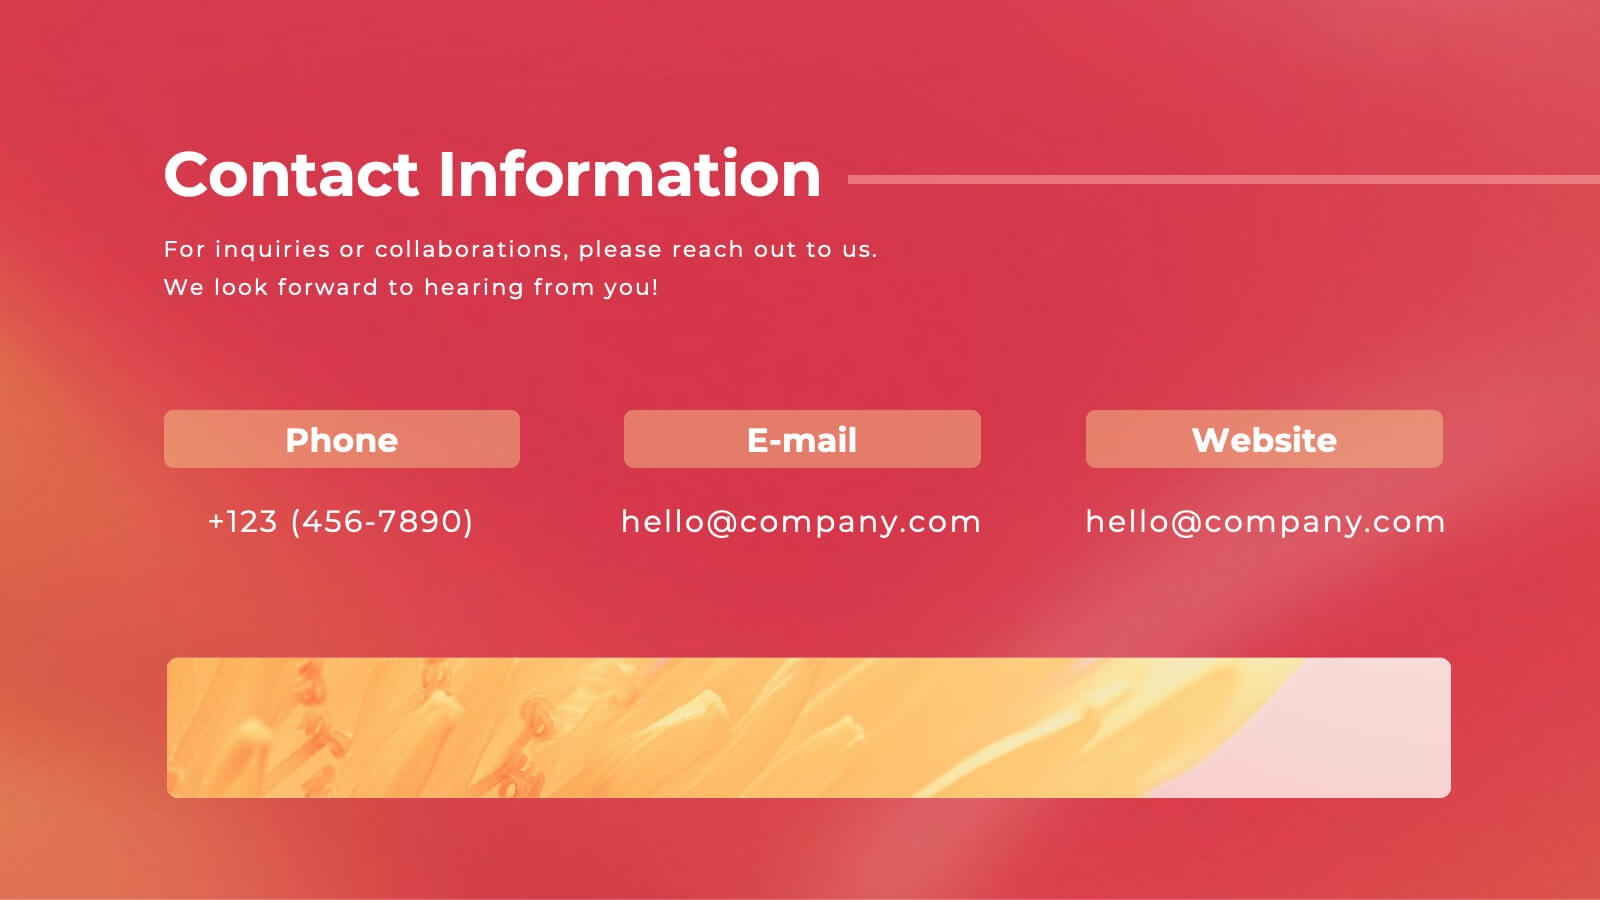
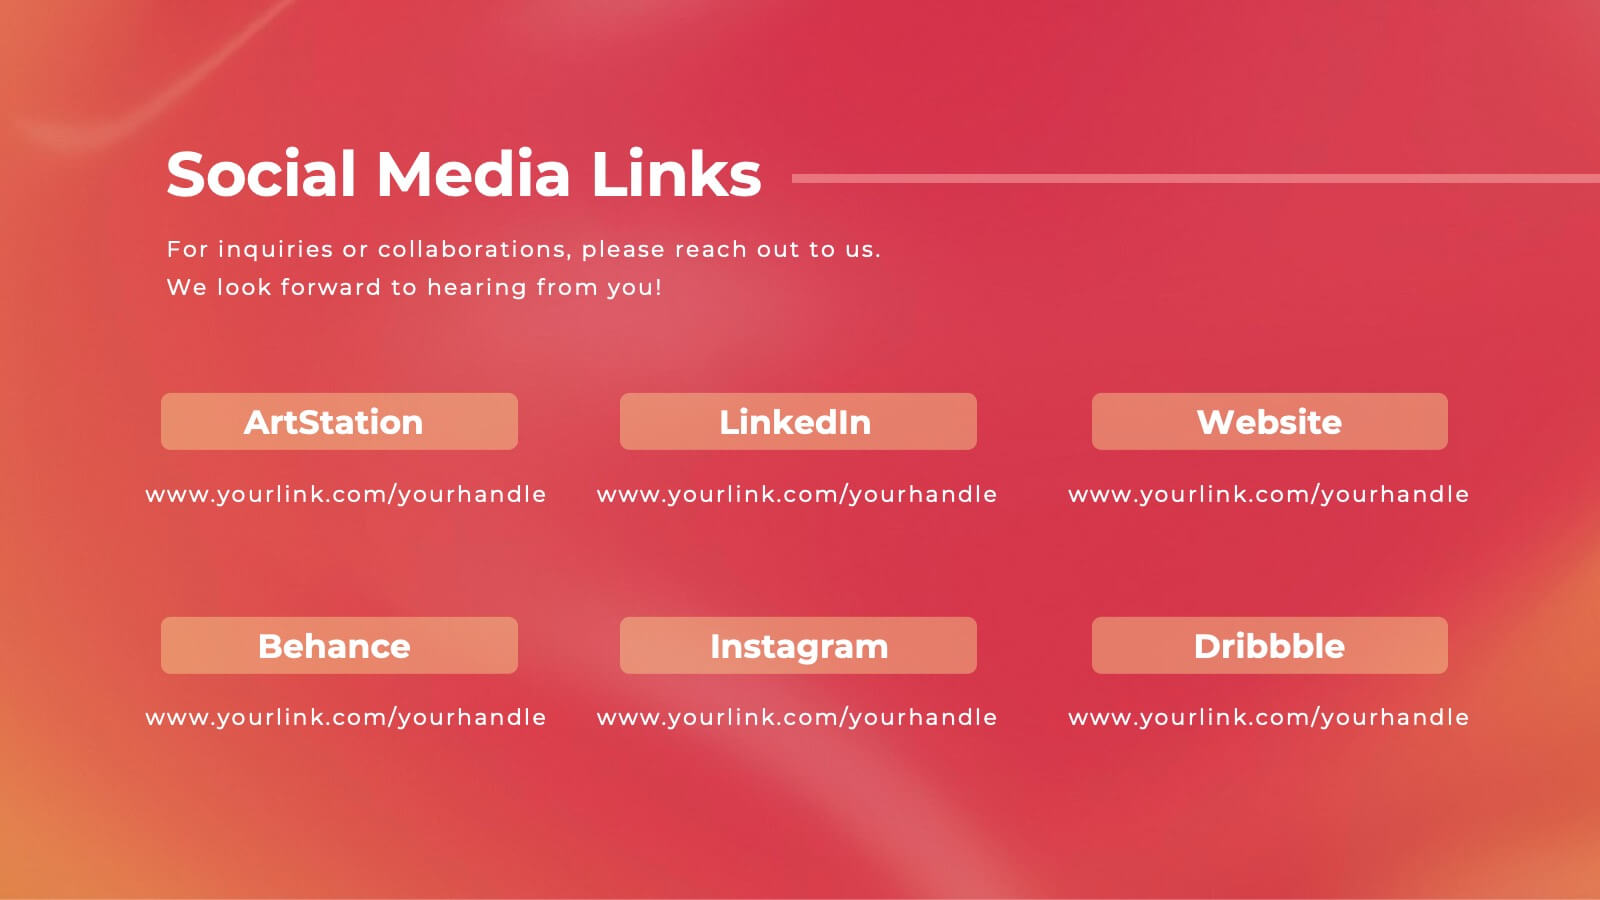
Axisflare Artist Portfolio Presentation
Showcase your creative journey with this vibrant artist portfolio template, featuring sections for project highlights, philosophy, style, and client testimonials. Ideal for presenting your work and artistic approach, this template is compatible with PowerPoint, Keynote, and Google Slides for seamless presentation across various platforms.


4 slides
3-Level Pyramid Diagram Presentation
Visualize priorities, strategies, or business structures with the 3-Level Pyramid Diagram Presentation. This slide design features a clear tiered layout—ideal for showcasing step-by-step processes, hierarchy levels, or goal-setting frameworks. Each level is color-coded for easy understanding, and the accompanying text areas keep messaging concise. Fully editable and compatible with PowerPoint, Keynote, and Google Slides.


5 slides
Milestones Timeline Presentation
The "Milestones Timeline Presentation" template is designed to illustrate the chronological development of a project or event. It's an effective visual tool that aligns milestones along a straightforward horizontal pathway, enhancing clarity and focus on important dates and goals. Each milestone is marked with distinct icons and titles, making it easy to convey progress and upcoming objectives. This template is particularly useful for project managers, team leaders, and educators who need to communicate key phases and achievements in a temporal context. It serves as an invaluable asset for meetings, reports, or educational materials, ensuring that each milestone is clearly highlighted and easily understood.


7 slides
Science Program Infographic Presentation
Science play's a crucial role in shaping our understanding of the world around us and has numerous applications in fields such as medicine and environmental science. This template can be used to present your science project in a professional fashion. The infographic contains all the graphs, figures and data you need, so that all you need to include is your own text. This is a creative template perfect for your next scientific research projects. It can be used to present the results of a study or an experiment. This template is compatible with powerpoint, keynote and google slides.


6 slides
Organized Table of Content Layout Presentation
Introduce your presentation with structure and flow using this Organized Table of Content Layout. With six clearly numbered sections, connected through a dynamic flowchart design, this slide helps guide your audience through your key topics. Each section includes a title and space for a short description. This layout is ideal for reports, proposals, workshops, or strategy decks. Fully editable in PowerPoint, Keynote, and Google Slides.


7 slides
Company Structure Infographic
Company structure, often referred to as organizational structure, outlines how a company is organized in terms of hierarchy, roles, responsibilities, and the flow of information. Discover the inner workings of your organization with our Company Structure Infographic. This visually captivating and informative infographic serves as a guide to understanding the hierarchical layout, roles, and relationships within your company. Compatible with Powerpoint, Keynote, and Google Slides. Illustrate the structure levels within the company, showcasing the roles and responsibilities at each level and how they contribute to the company's success.


10 slides
Environmental Sustainability Strategy
Bring your green initiatives to life with this vibrant, four-step sustainability roadmap. Ideal for visualizing eco-friendly practices, CSR programs, or environmental policy rollouts. The organic flow, icons, and plant-themed accents enhance clarity and engagement. Fully customizable in PowerPoint, Keynote, and Google Slides.


5 slides
Vaccine Myths Infographic
Vaccine Myths are false or misleading claims about vaccines that can contribute to vaccine hesitancy and misinformation. These infographic templates are designed to debunk common misconceptions and myths surrounding vaccines. These visually appealing and informative templates are ideal for healthcare professionals, educators, and organizations aiming to promote accurate information about vaccines and combat vaccine hesitancy. These infographics aim to educate and empower individuals to make informed decisions about vaccination and contribute to public health efforts. Compatible with Powerpoint, Keynote, and Google Slides.


7 slides
Sports Bases Infographic
Step up your game with our sports bases infographic! Designed to captivate sports enthusiasts, coaches, trainers, and educators, this vibrant infographic illuminates the aspects of various sports disciplines. With a crisp blue backdrop coupled with dynamic shades of blue and an array of sporty colors, it provides a visual sprint through the key bases of multiple sports. Ideal for coaches aiming to provide a overview to their teams, or educators introducing students to the fundamentals of sports. Compatible with PowerPoint, Keynote, and Google Slides, you can seamlessly integrate it into your presentations and captivate your audience with a sporty edge.


5 slides
Steps Process Infographics
A steps process refers to a series of sequential actions or stages that need to be followed to accomplish a specific task or achieve a desired outcome. These informative vertical infographics are designed to showcase step-by-step processes, procedures, or workflows. Whether you need to explain a business process, a project timeline, or a complex procedure, this provides a clear and concise way to present information in a visually engaging manner. The infographic offers a variety of layouts specifically designed to display step-by-step processes. The template allows you to customize the infographics according to your specific needs.

20 slides
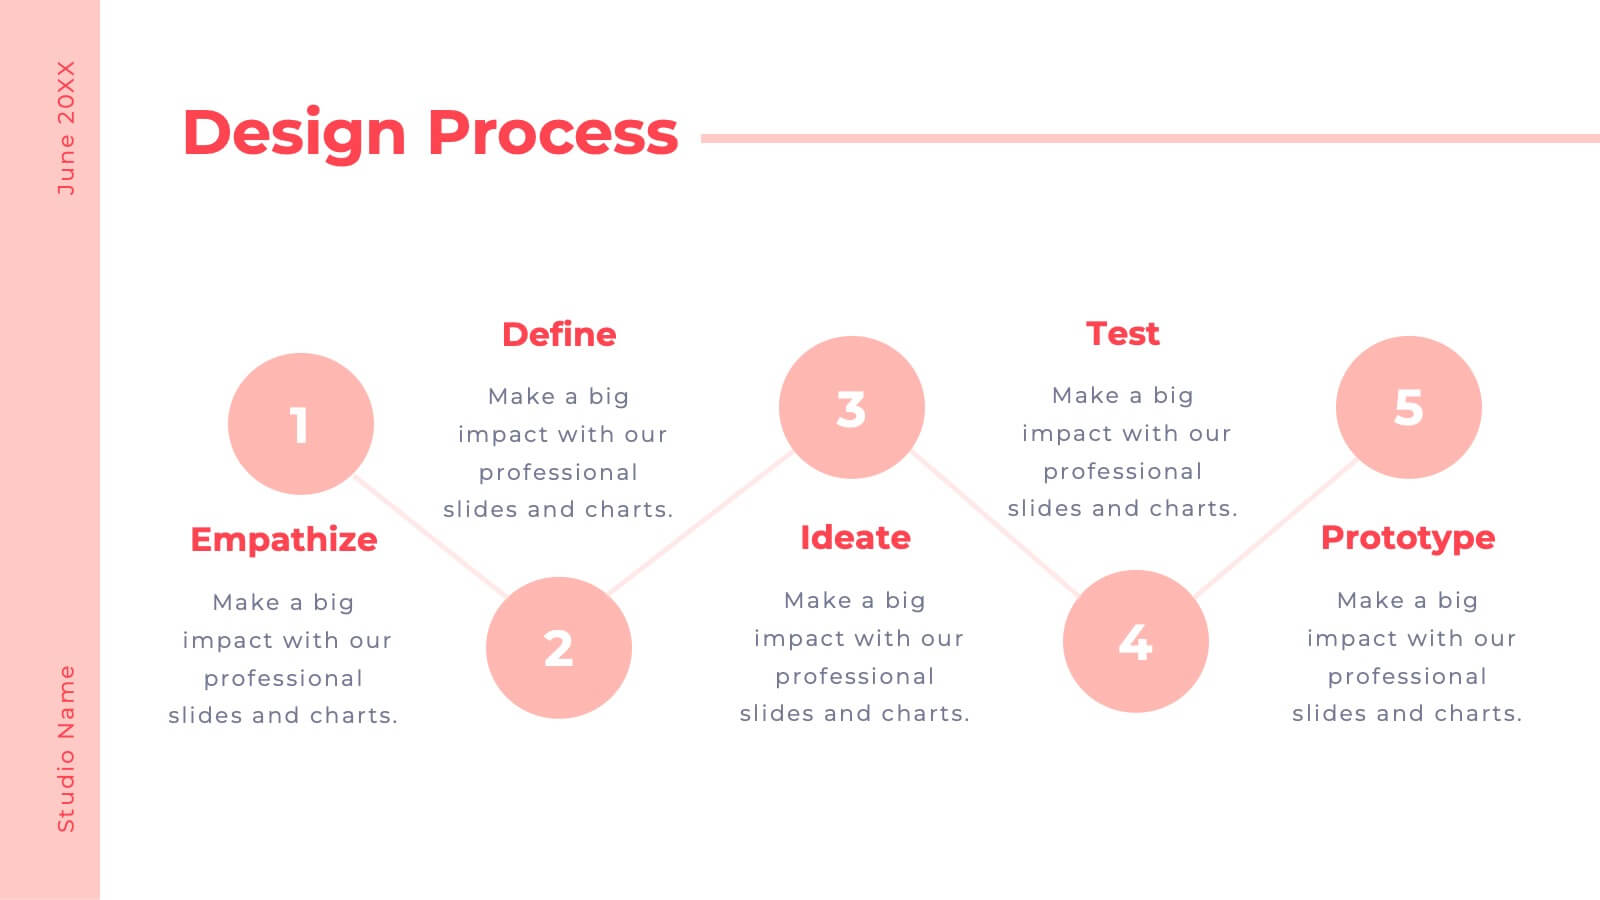
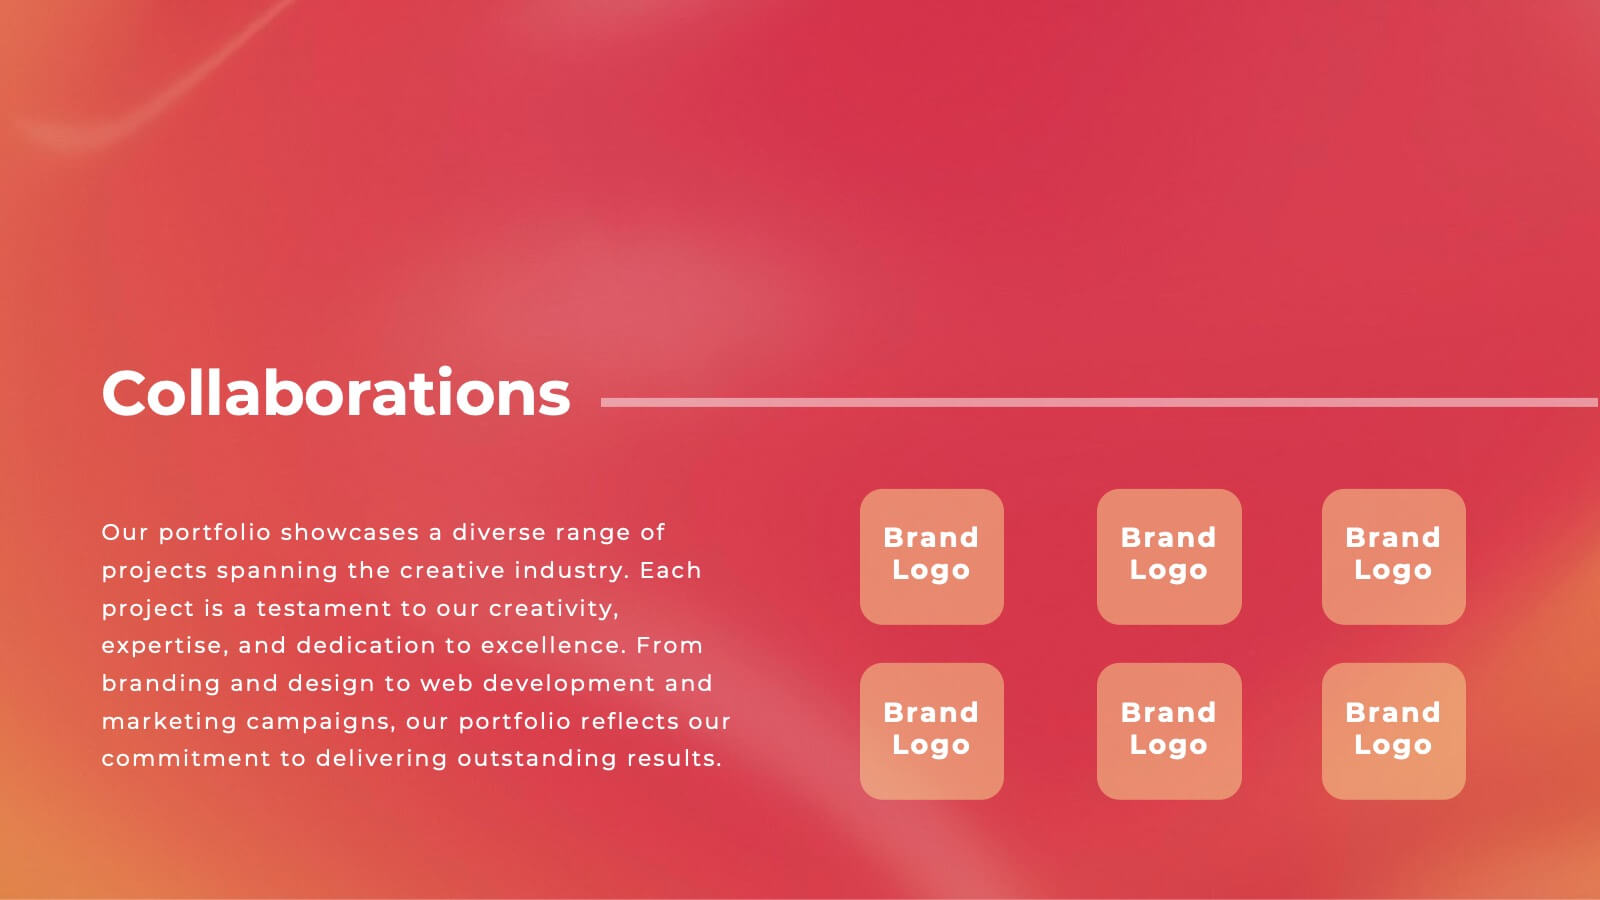
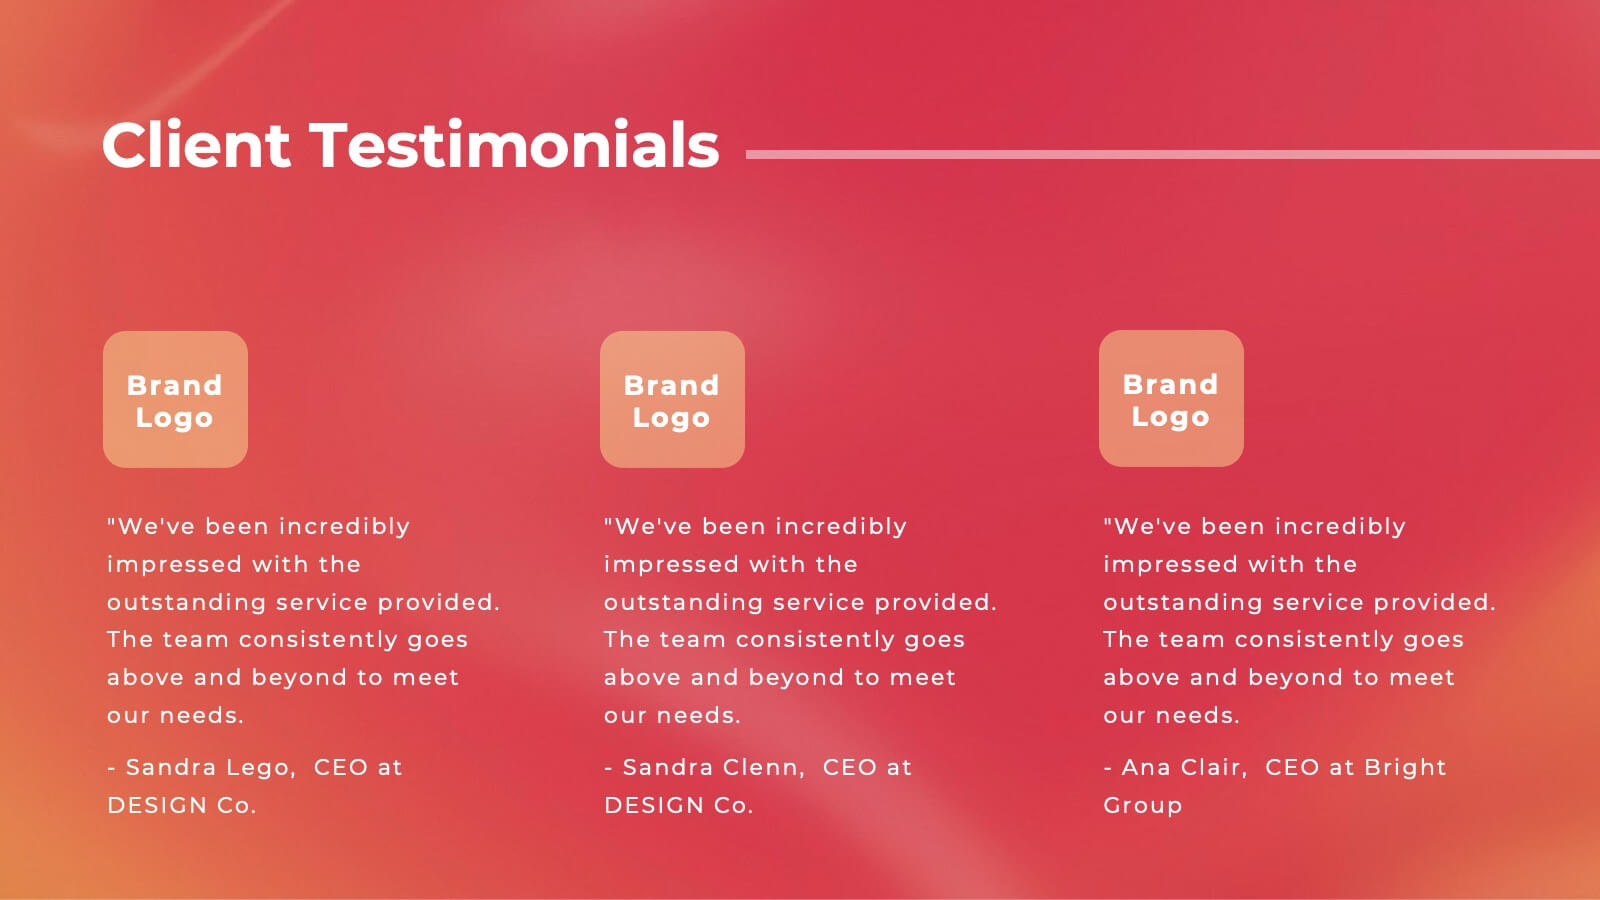
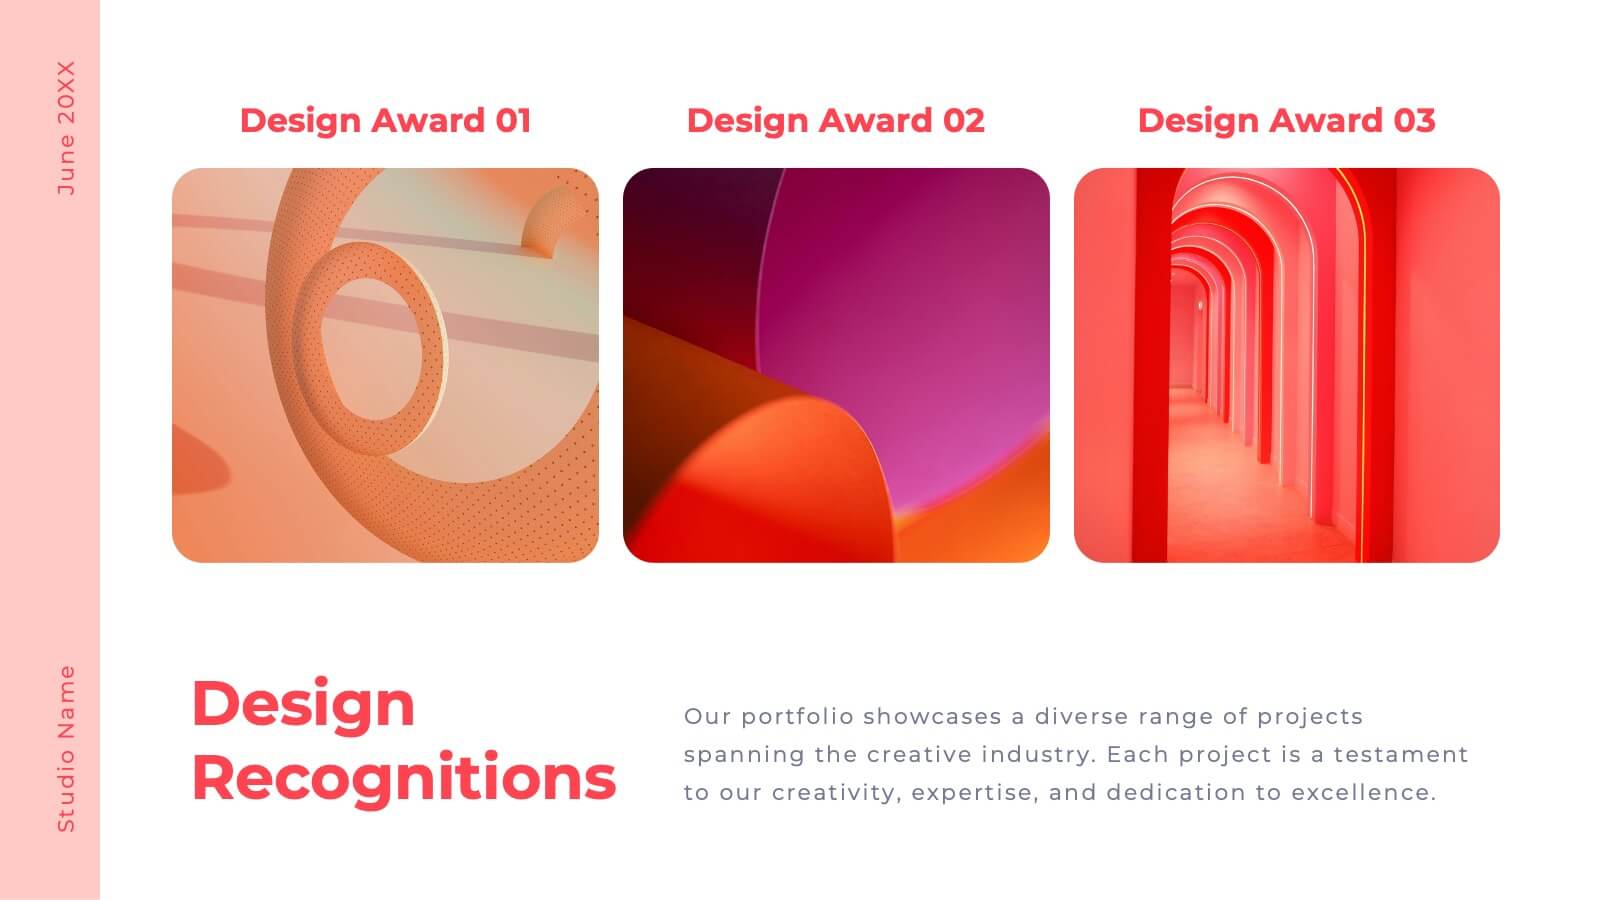
Valor Creative Portfolio Presentation
Step into creativity with this stunning portfolio template! Showcase your projects, design philosophy, and client testimonials with style and flair. Ideal for designers, artists, and creatives wanting to impress. Compatible with PowerPoint, Keynote, and Google Slides, this template elevates every portfolio to new heights. Perfect for making a lasting impact.