


Features
- 2 Unique slides
- Fully editable and easy to edit in Microsoft Powerpoint, Keynote and Google Slides
- 16:9 widescreen layout
- Clean and professional designs
- Export to JPG, PDF or send by email


Do you have any questions?
Recommend


26 slides
Maki Presentation Template
Japanese cuisine is known all around the world, there is so much to try including all the different types of sushi. Maki is a 26 slide template made to help you market your services and products. The clean, simplistic design makes it easy for you to display your content in any modernized way. Maki is designed to showcase your packages, pricing and more. Help your customers feel comfortable purchasing your service or product using this template. Present your message clearly and effectively with this presentation. You can customize the design, photos, background and fonts to make it your own.


6 slides
Behavioral Psychology Insights
Discover what drives decision-making with the Behavioral Psychology Insights Presentation. This template is perfect for exploring user behavior, mindset patterns, or psychological triggers in business, marketing, or HR. Professionally designed for PowerPoint, Keynote, and Google Slides—fully editable and easy to adapt.


3 slides
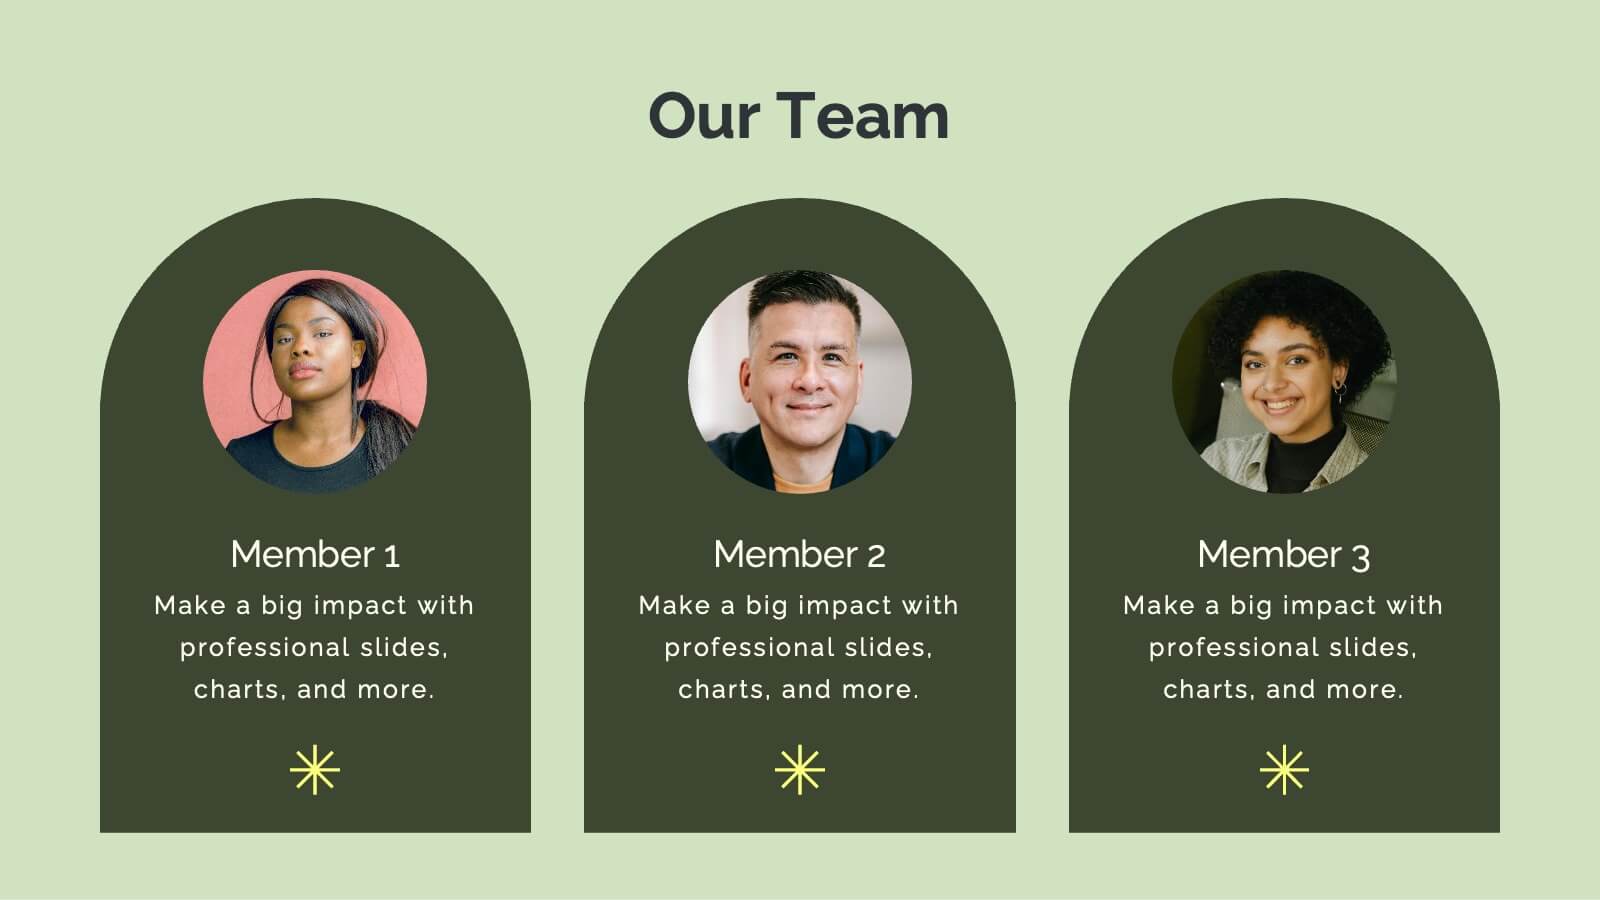
Professional Introduction Slide
Introduce team members with clarity and style using this profile-focused slide. Designed to highlight key stats, roles, and responsibilities, it’s perfect for internal presentations, onboarding, or proposals. Easily customizable in PowerPoint, Keynote, and Google Slides.


7 slides
App Mockup Infographic
Elevate your app demonstrations with this vibrant collection of app mockup templates, specifically designed to showcase the functionality and design of mobile applications across various devices. Each template emphasizes the user experience, presenting your app in a clear and engaging manner that highlights its most compelling features. The templates are crafted with a clean, modern aesthetic, incorporating bright colors and clear typography to draw attention to key functionalities and user interfaces. Perfect for developers and designers looking to present their apps to clients, stakeholders, or potential users, these mockups provide a professional framework for displaying apps in context. Customizable to fit your specific needs, this collection allows you to seamlessly integrate your own app designs and screenshots, making it easier than ever to convey the look and feel of your app in a realistic setting. Whether for pitches, presentations, or promotional materials, these mockups are an invaluable tool for communicating the value and operation of your application.
21 slides
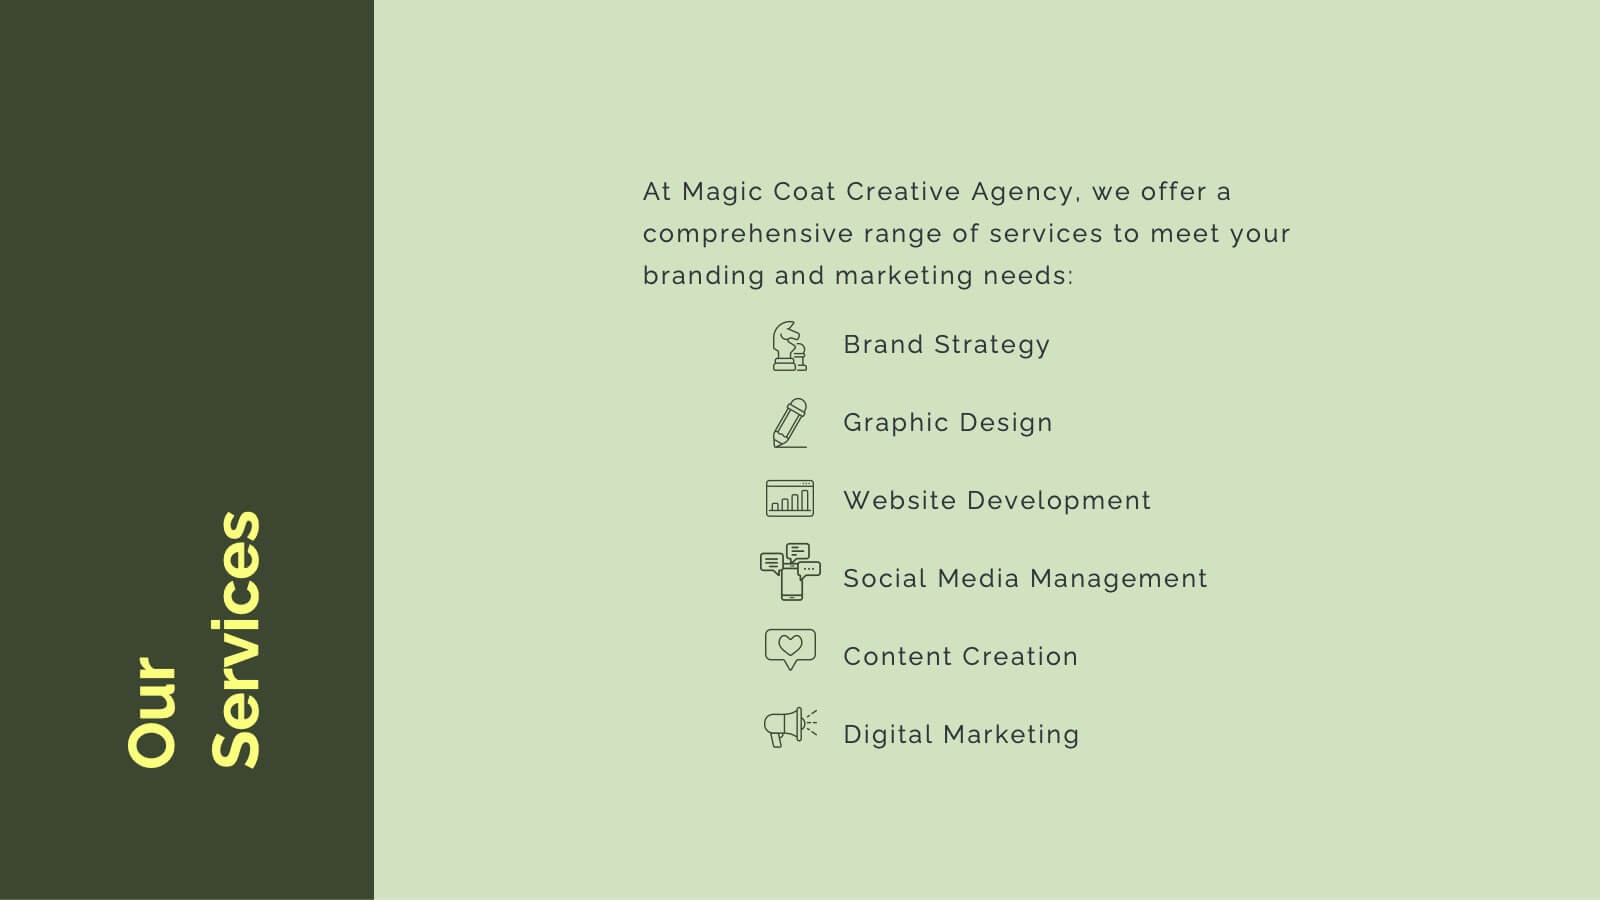
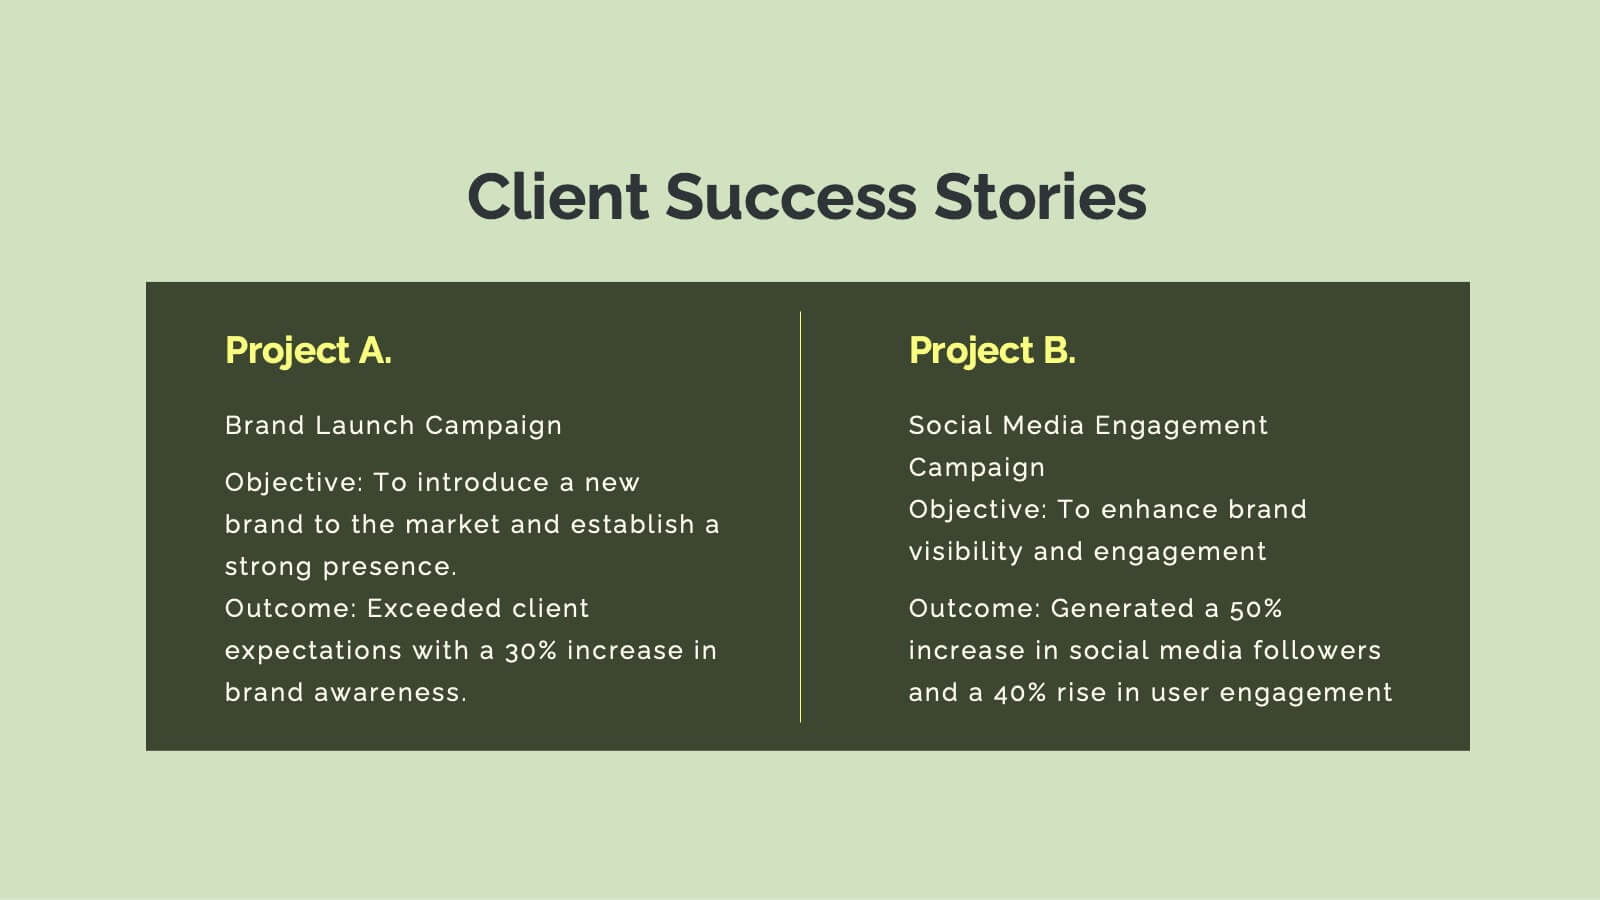
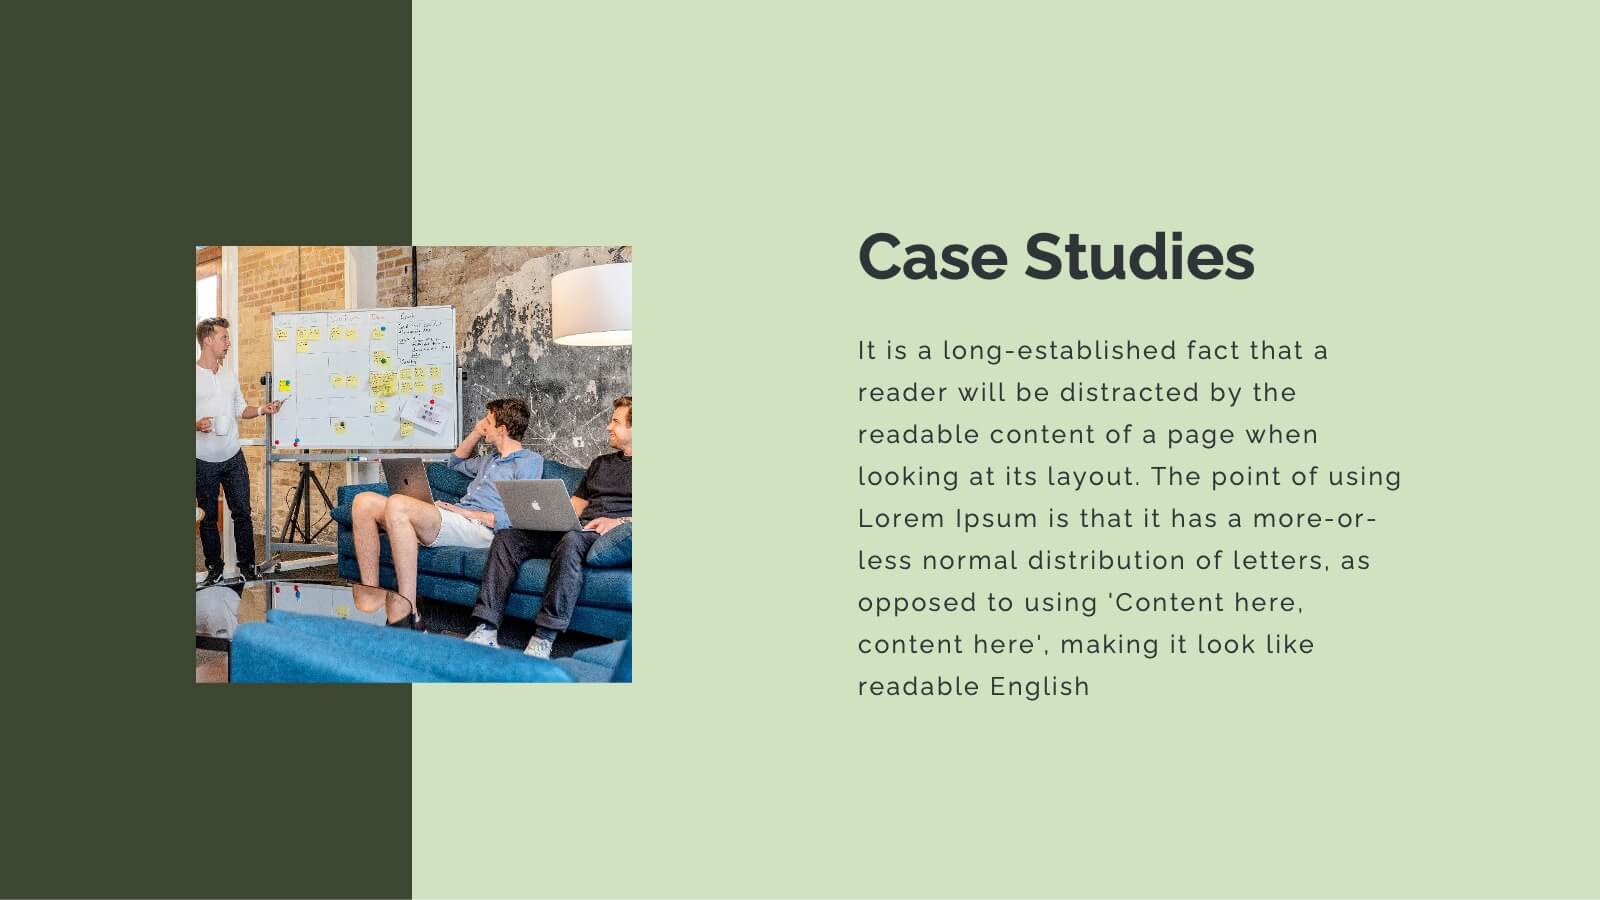
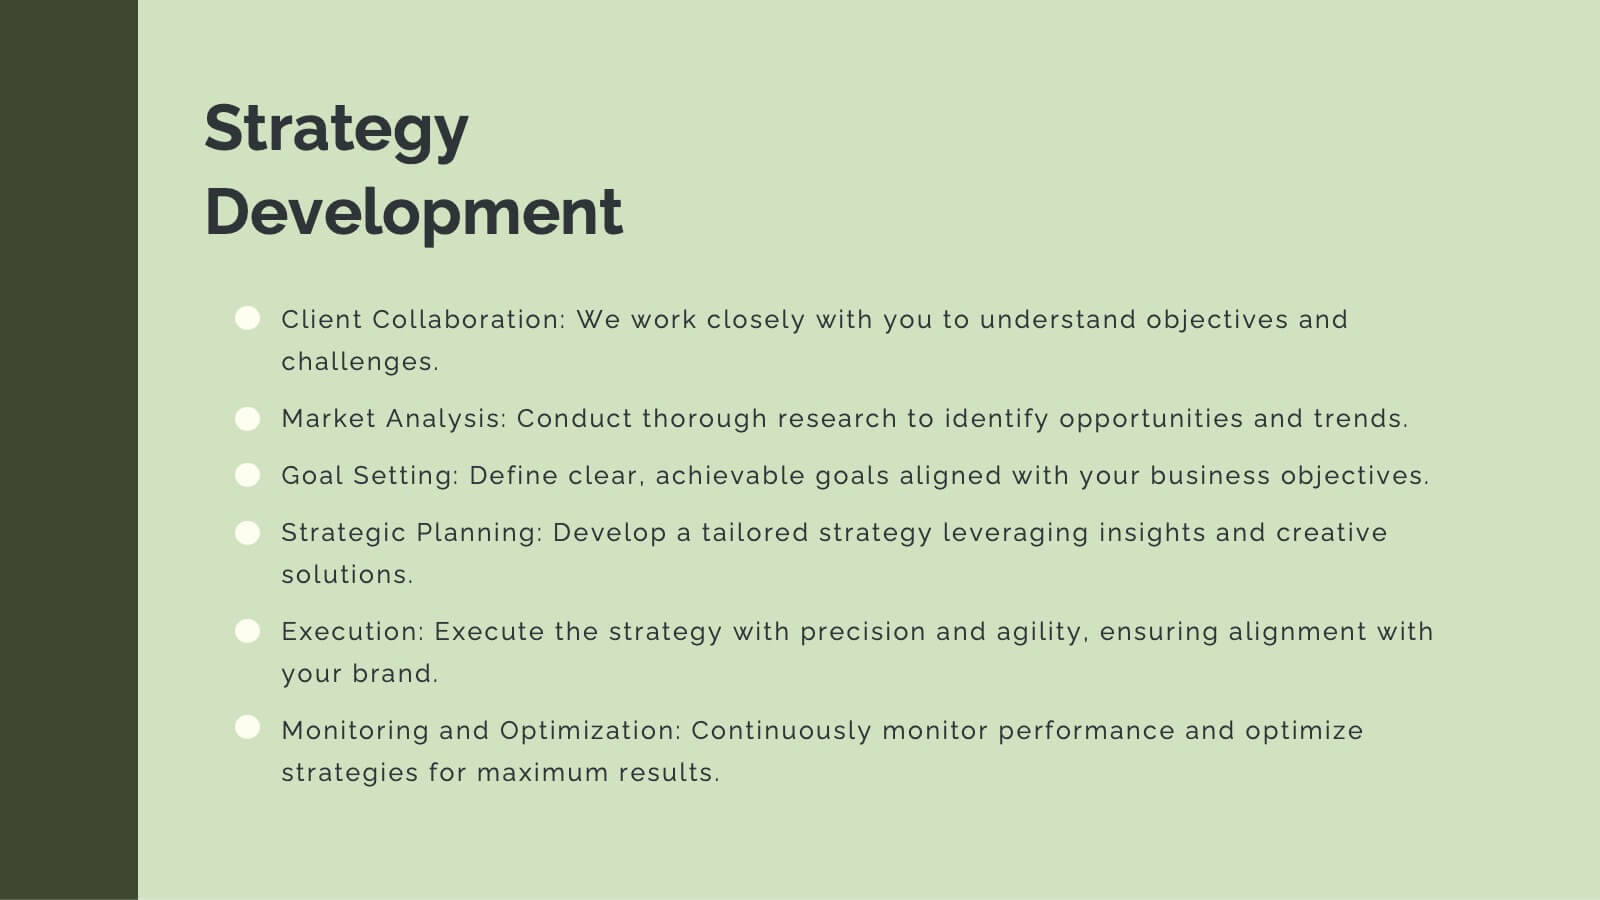
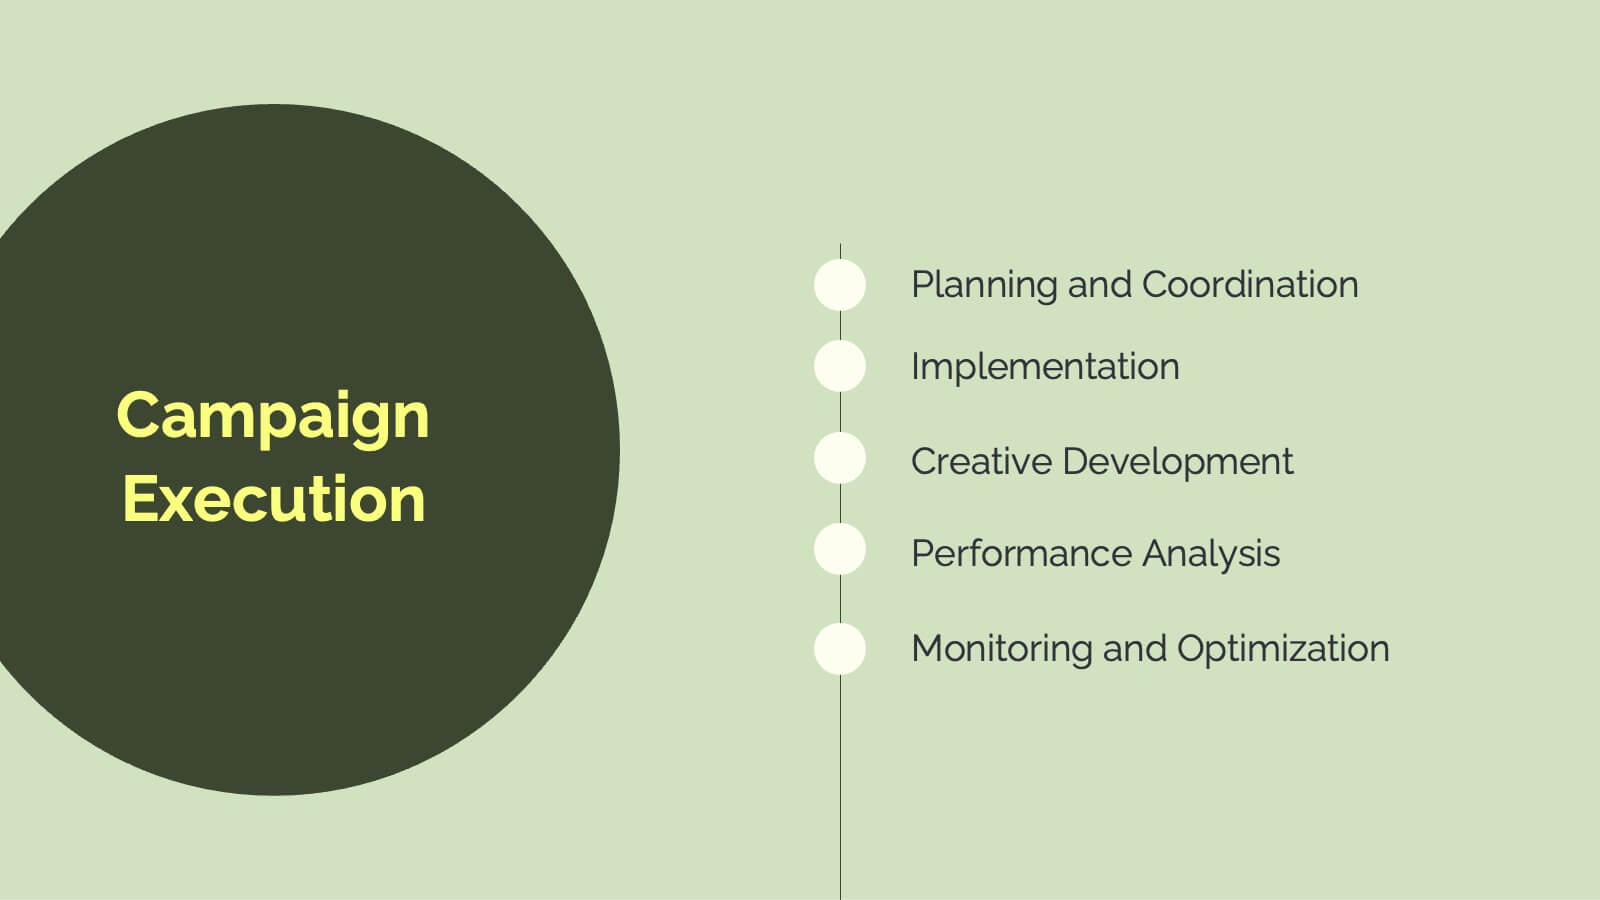
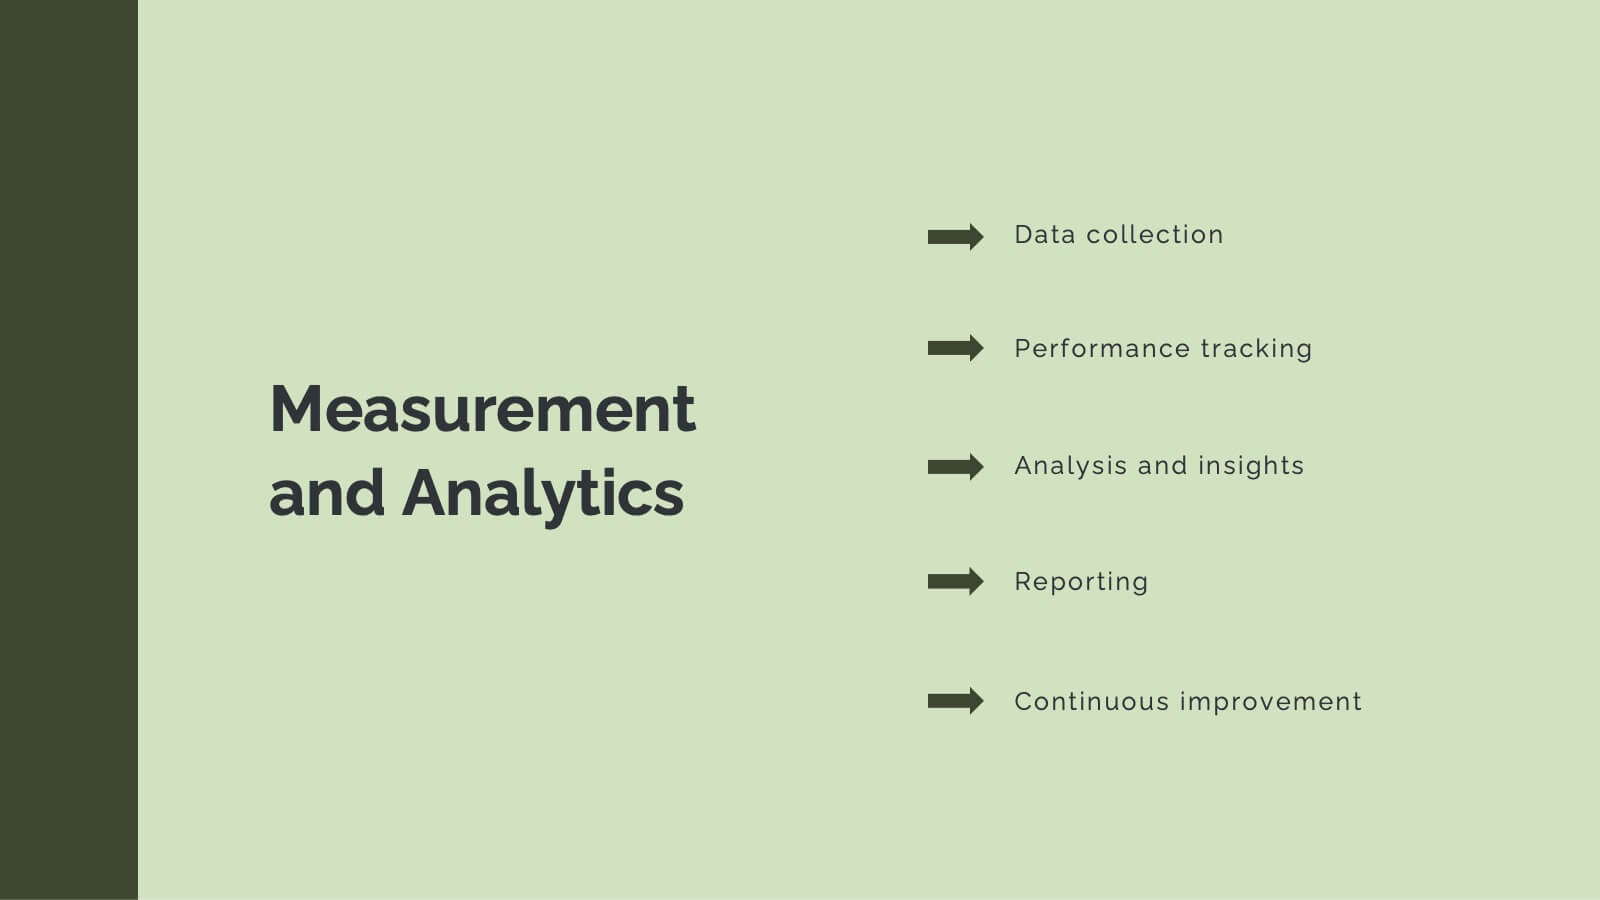
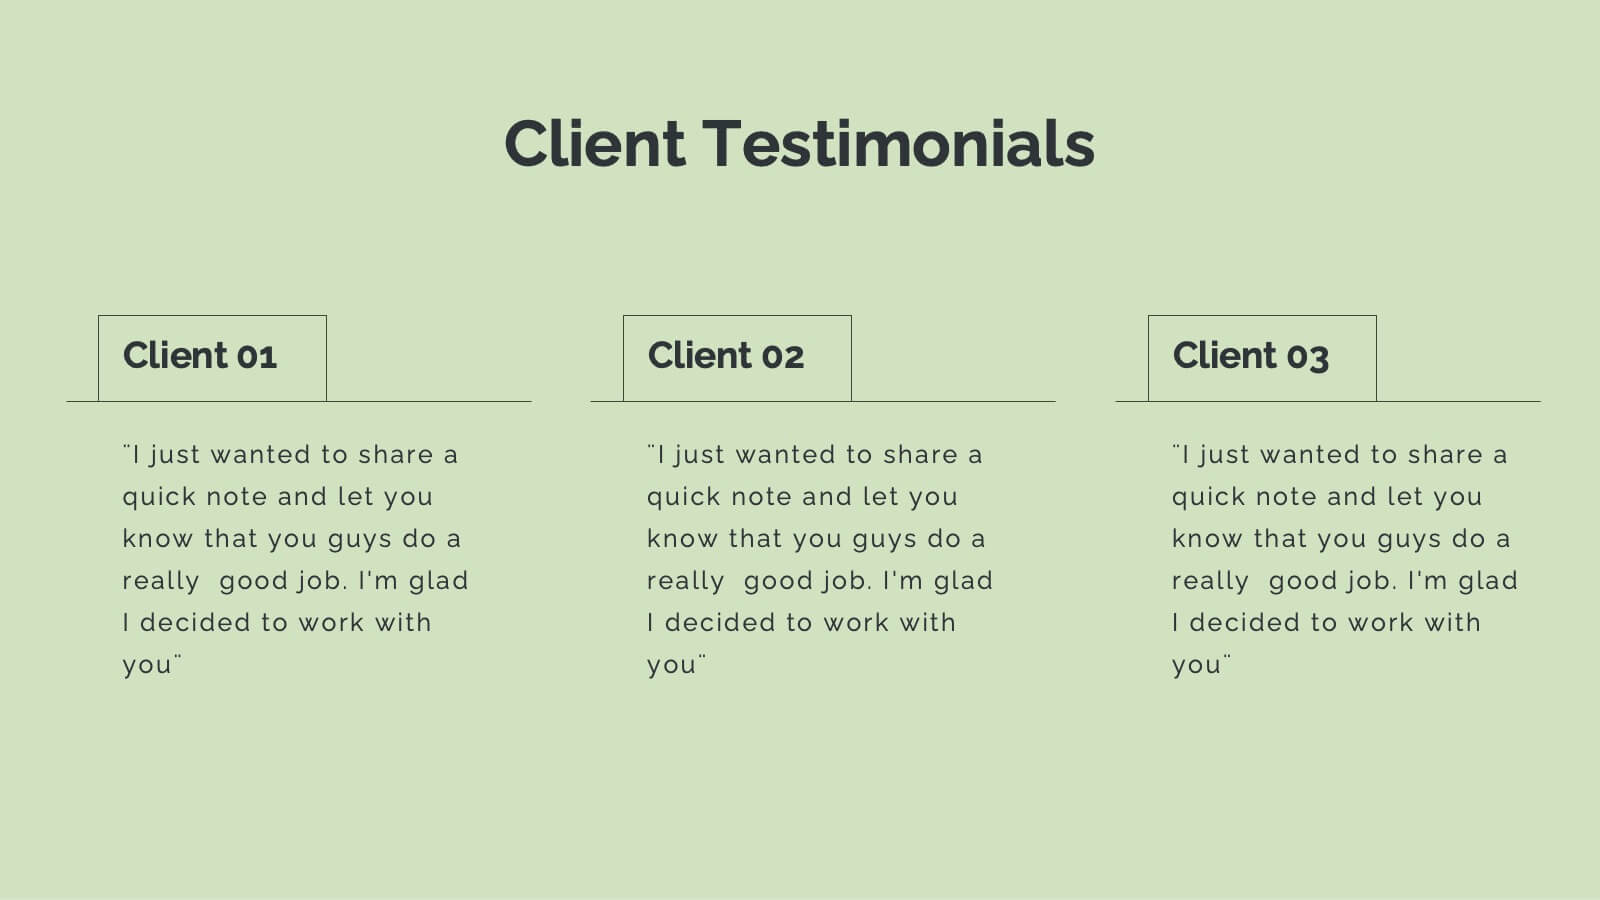
Horizon Advertising Agency Proposal Presentation
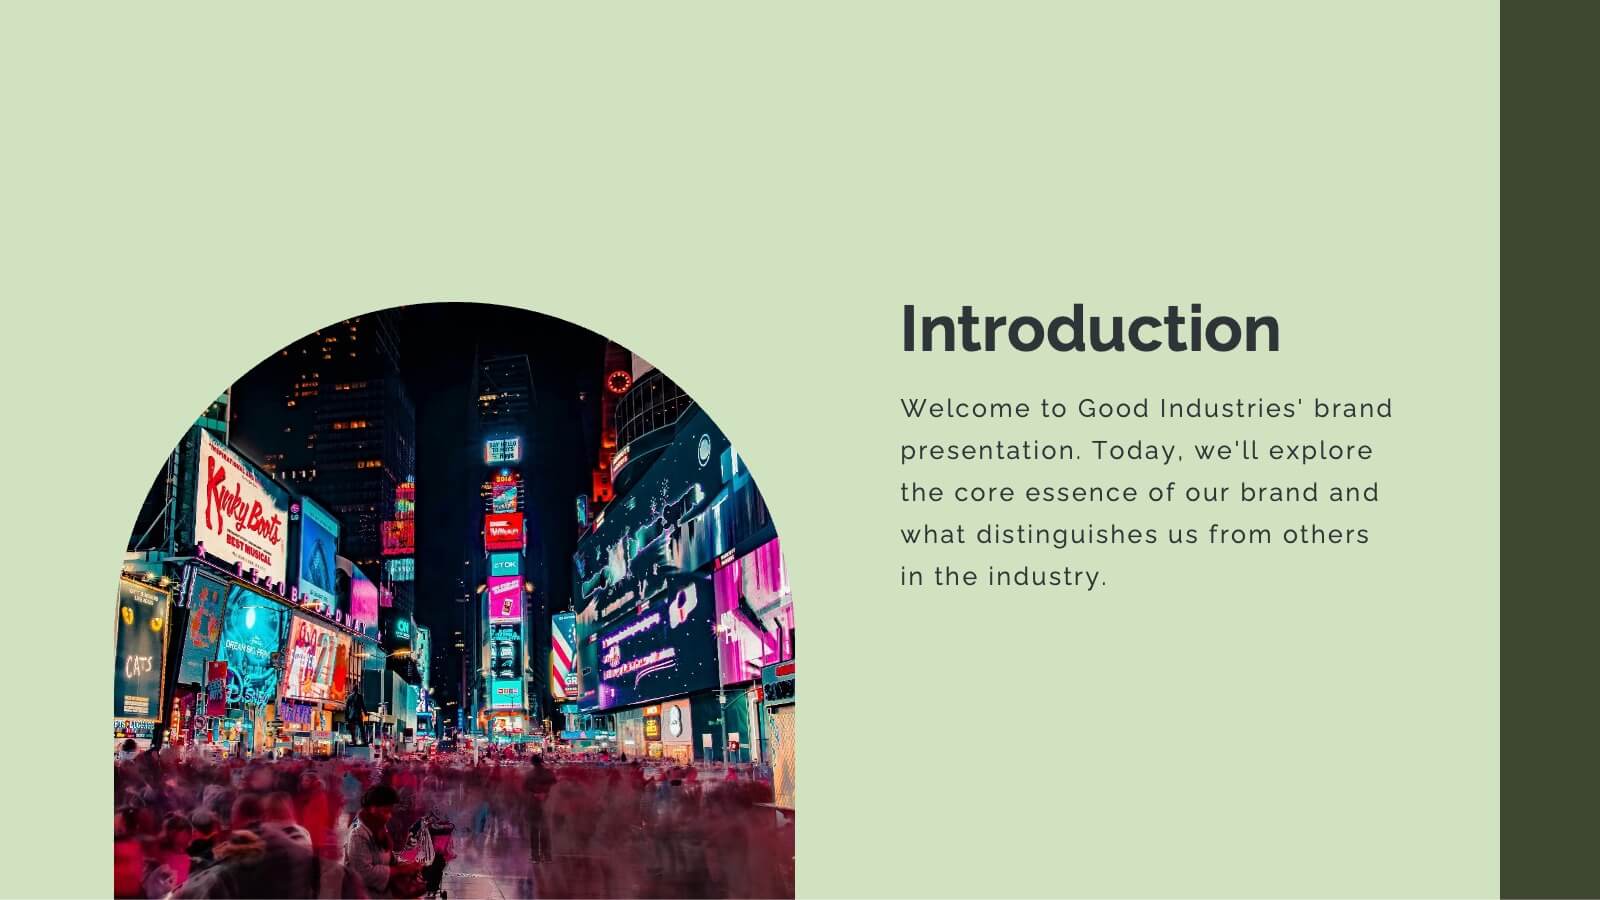
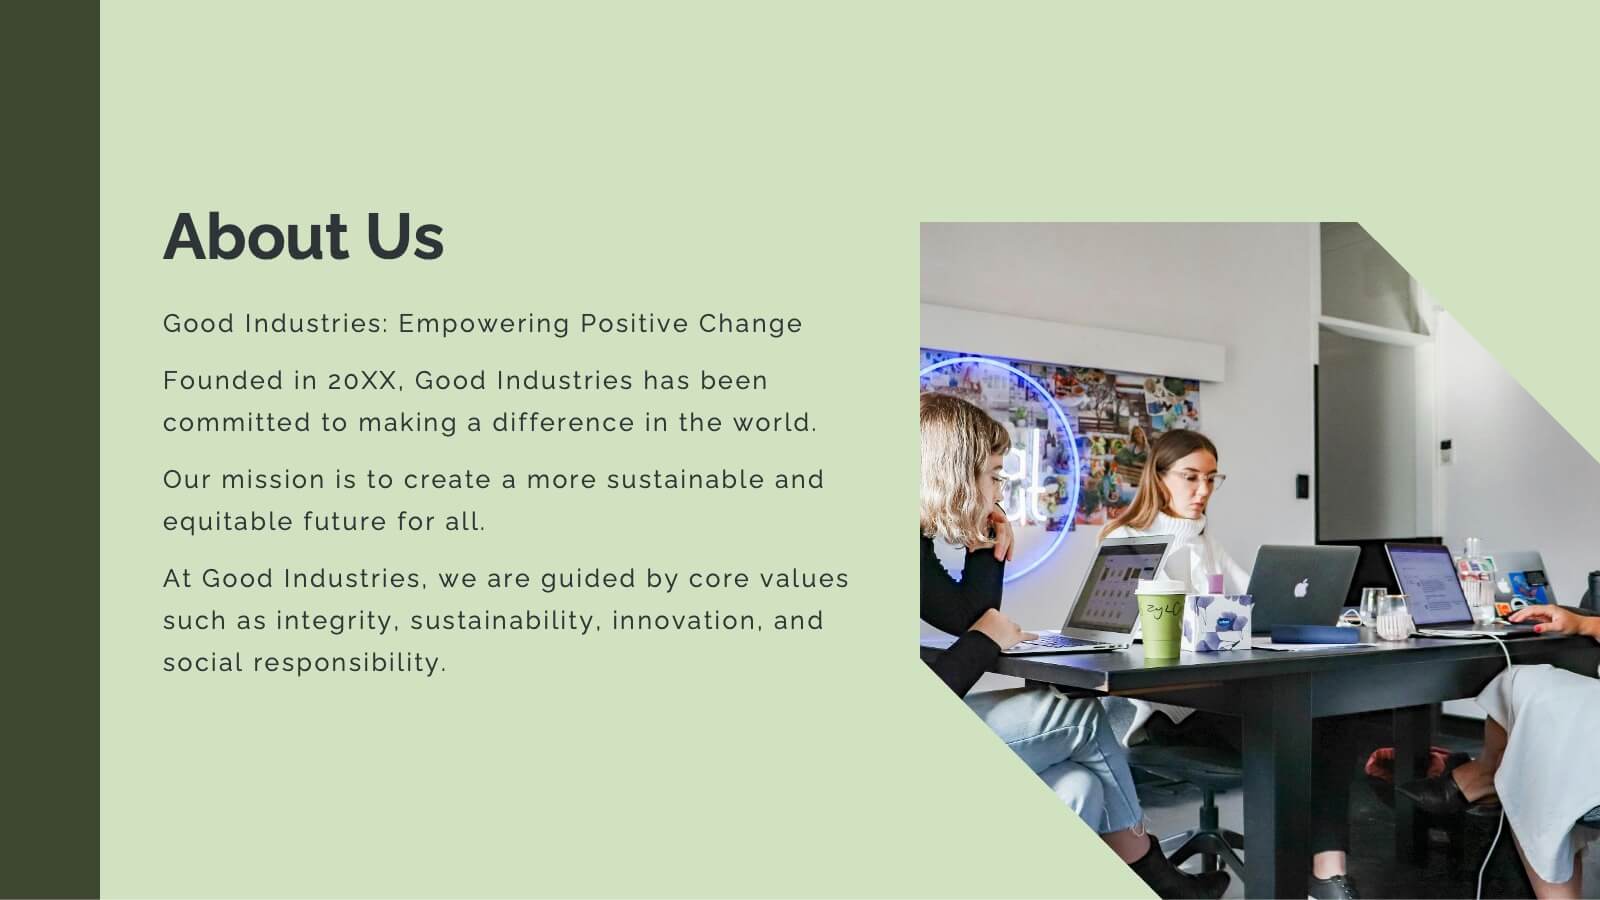
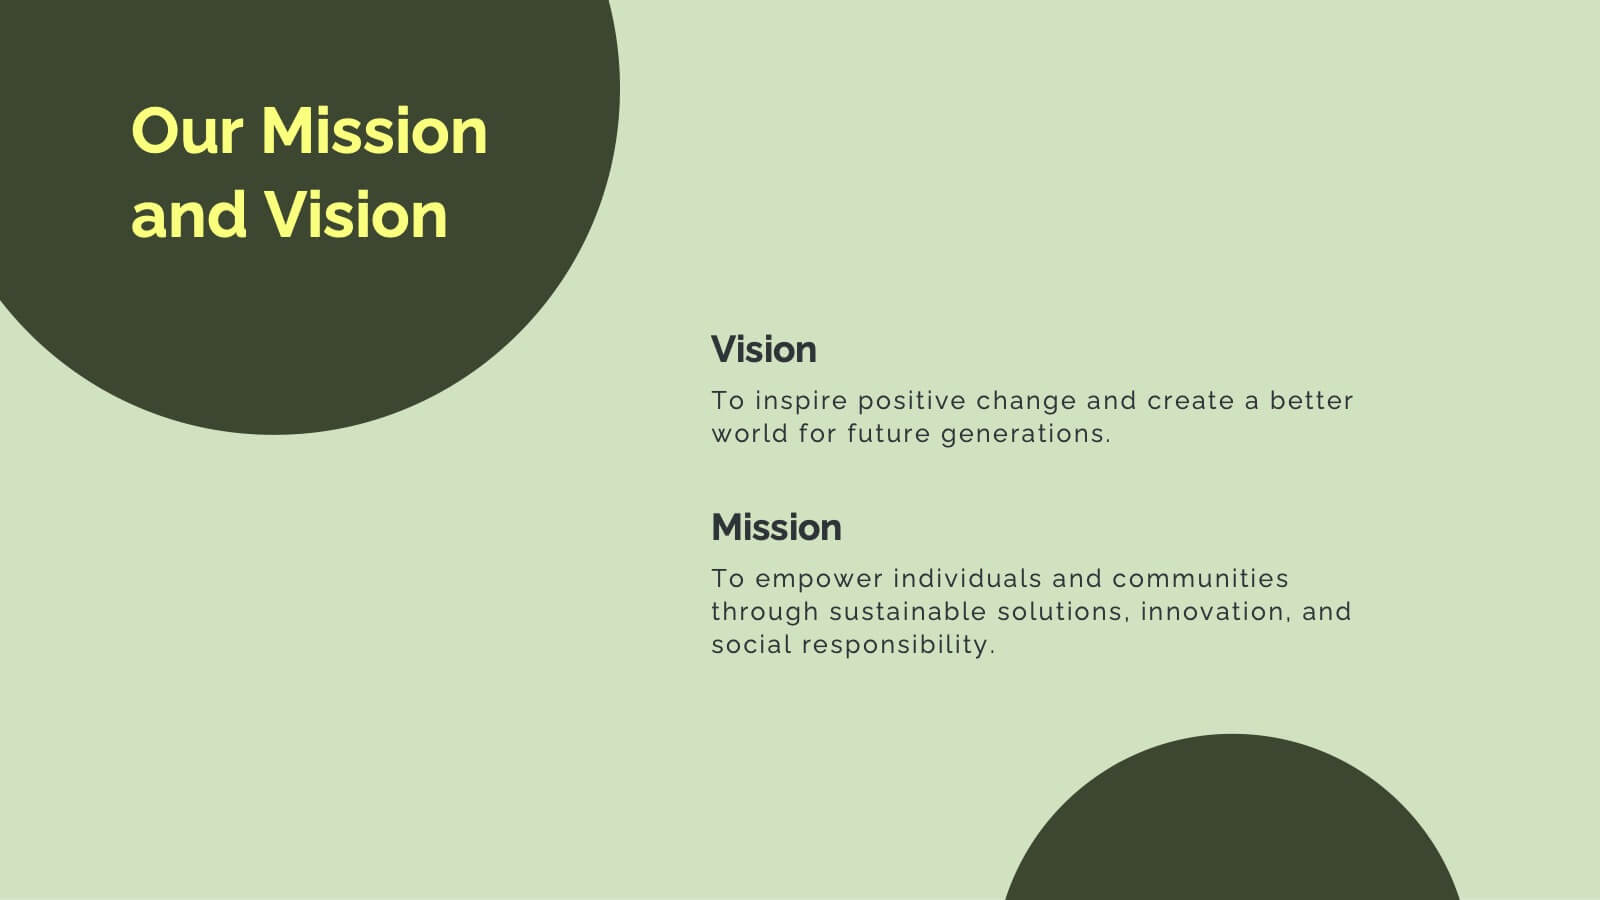
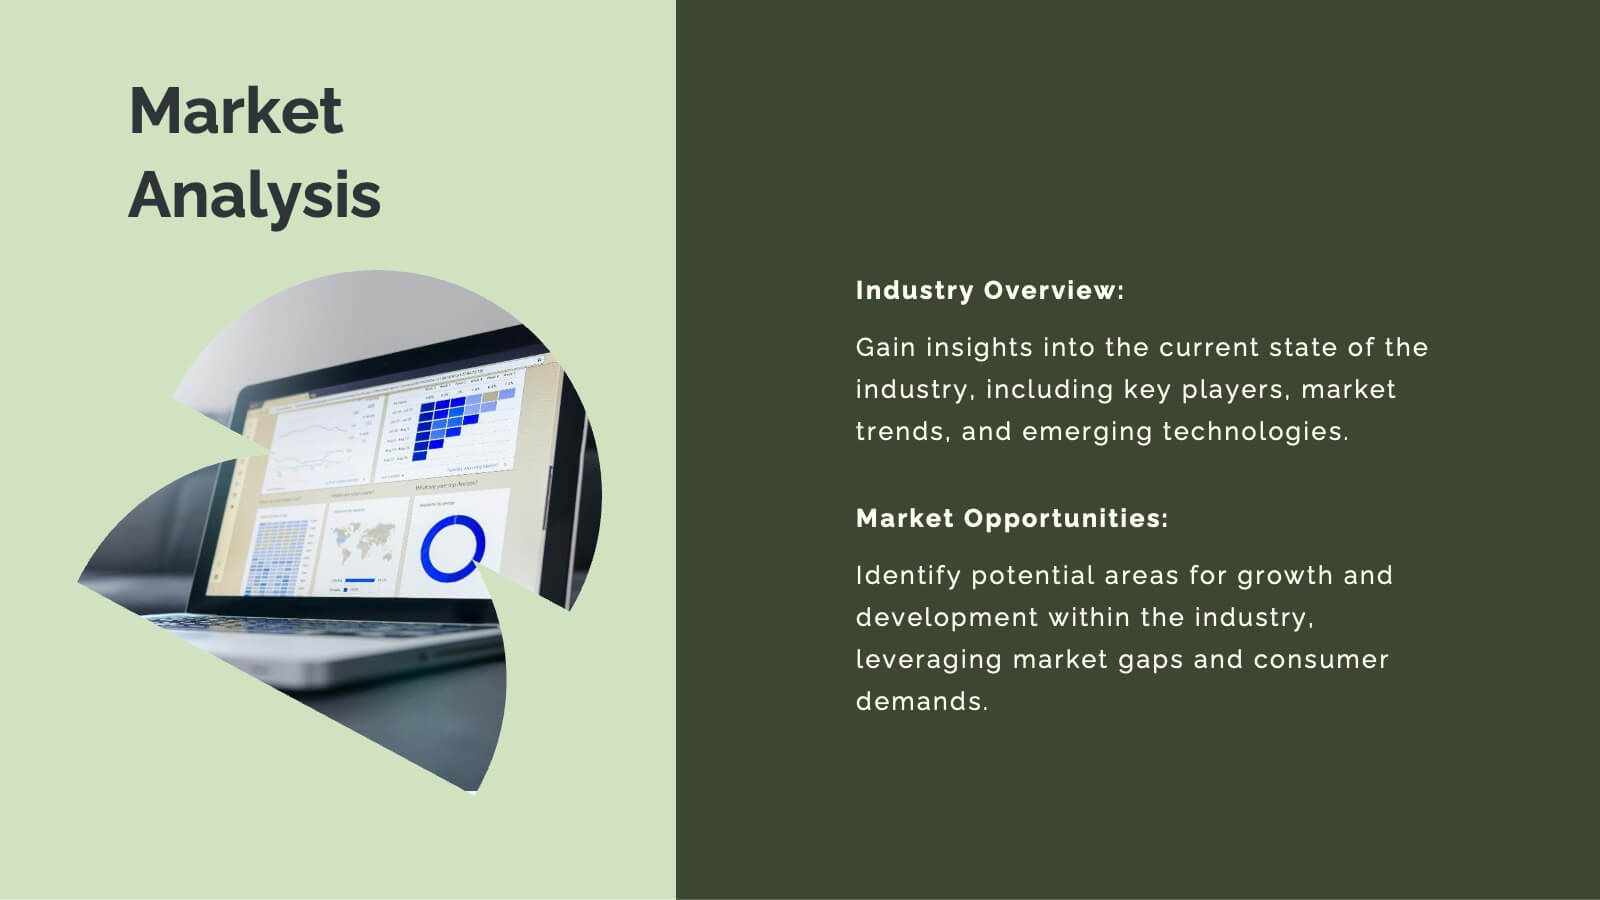
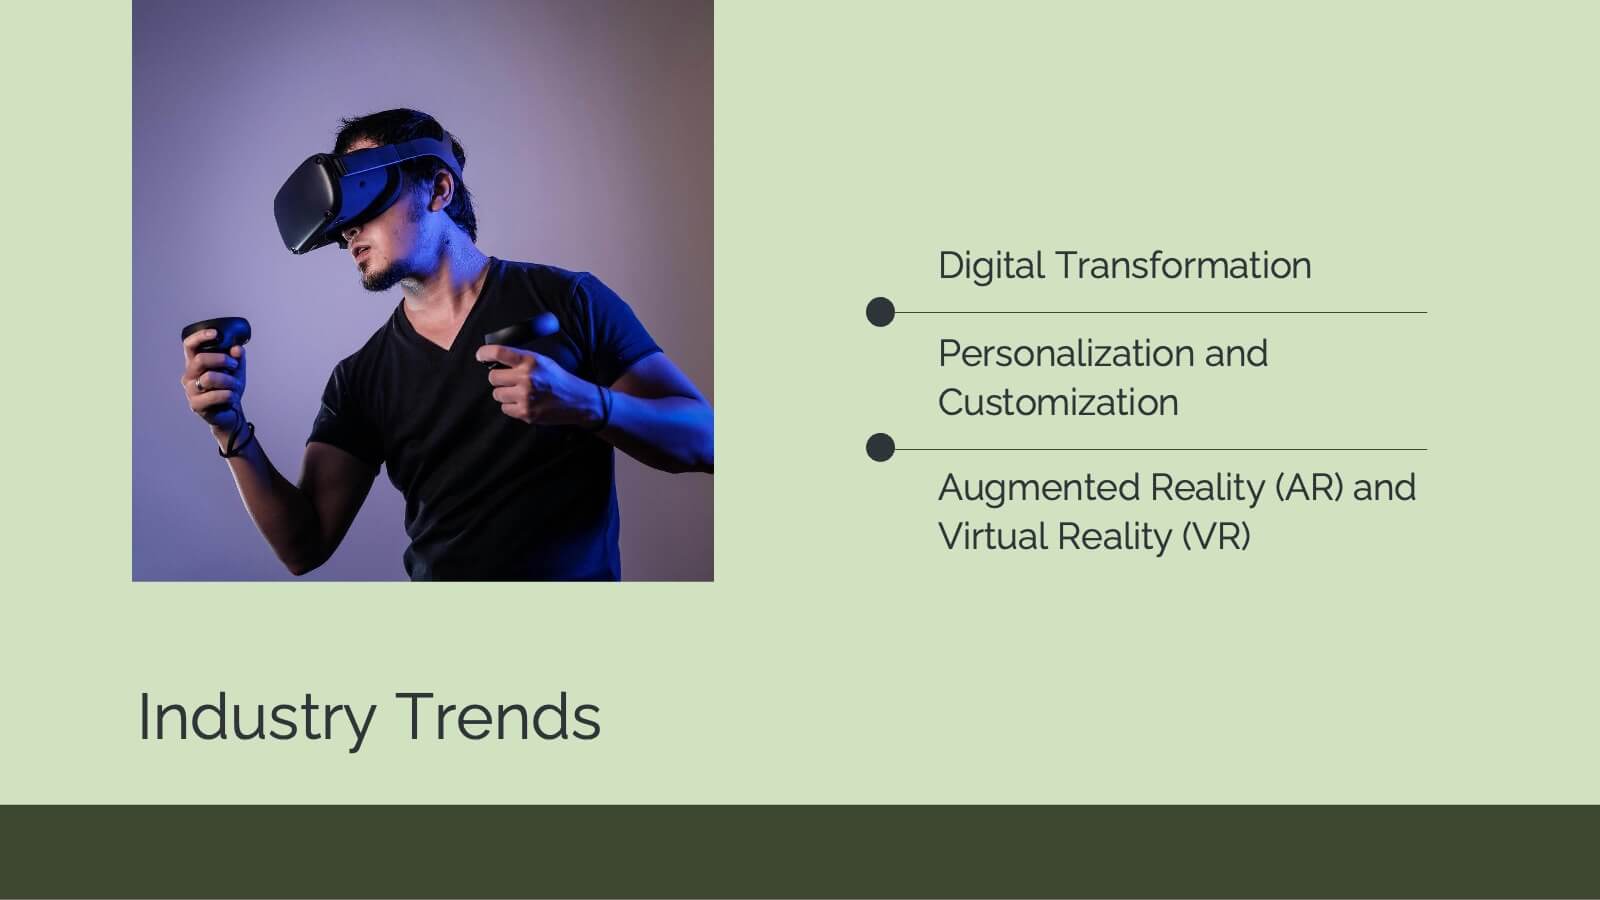
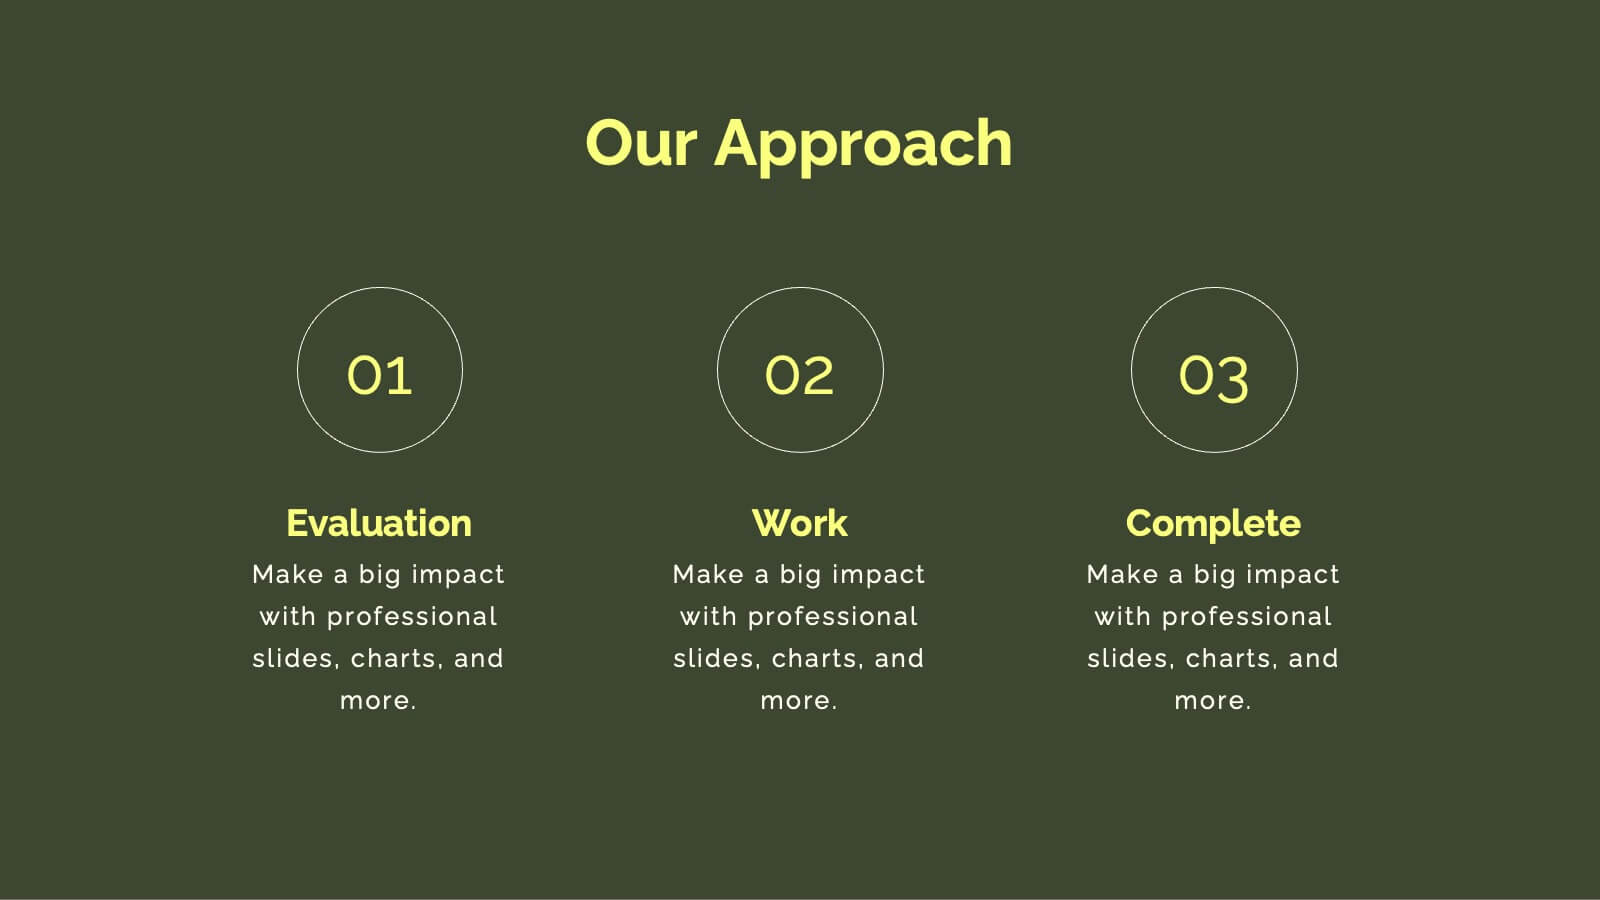
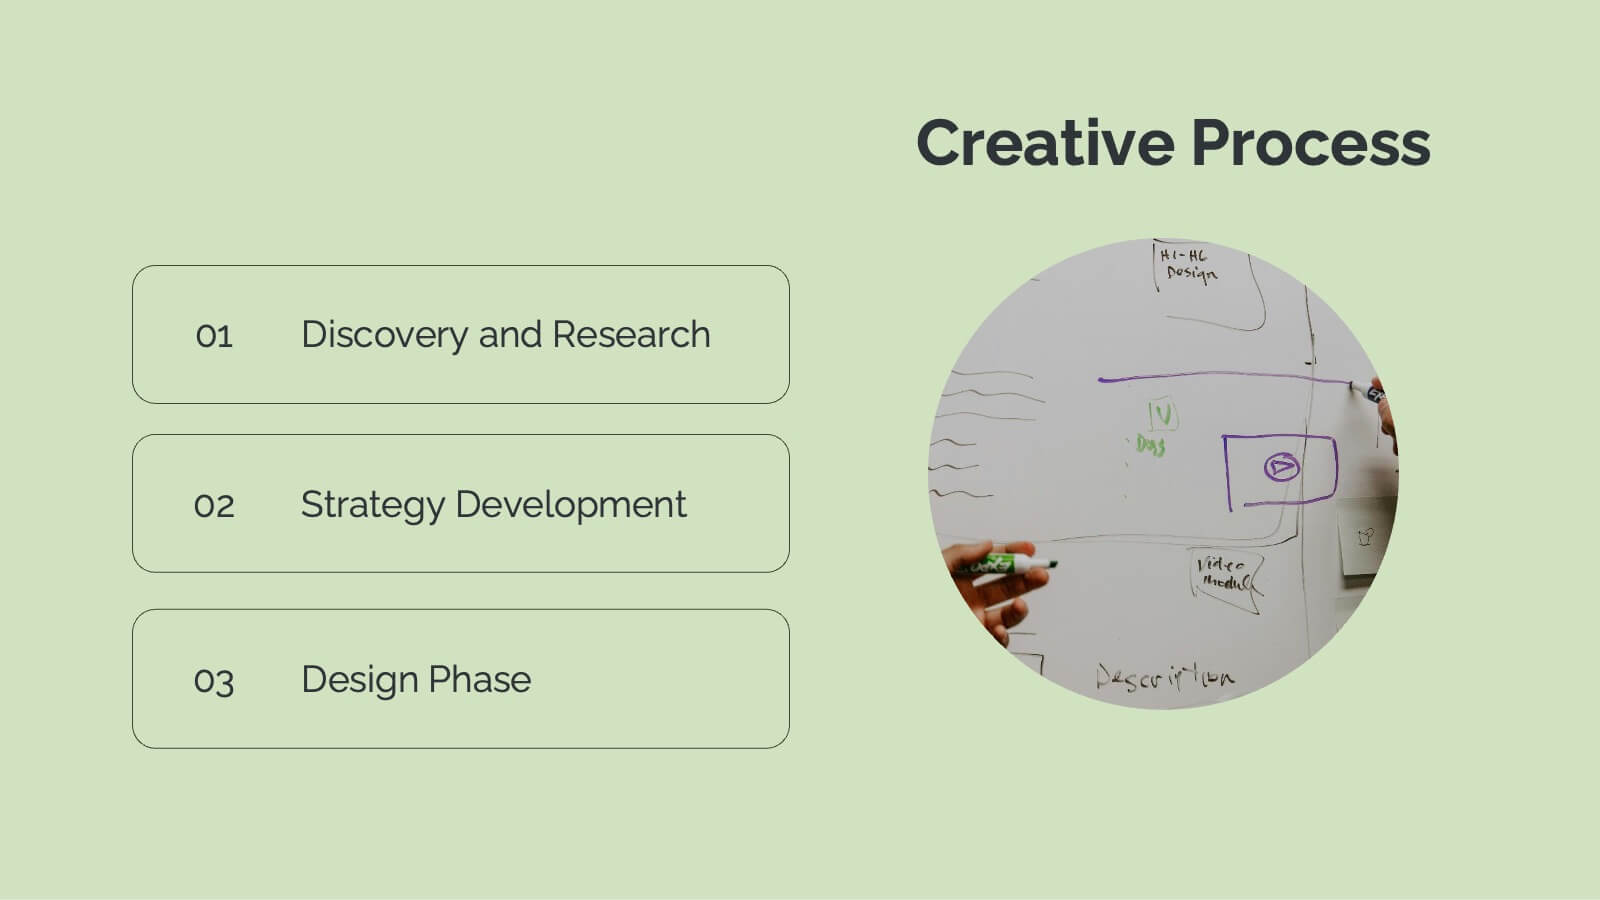
Elevate your advertising impact with this comprehensive agency proposal template. It’s meticulously designed to showcase your agency’s capabilities from strategic planning to creative execution, ensuring a persuasive presentation of services like market analysis, campaign strategies, and client success stories. Each slide is formatted to facilitate understanding and engagement, making it perfect for highlighting your team's expertise and unique approach. Compatible with major presentation platforms like PowerPoint, Google Slides, and Keynote, this template supports your efforts to secure new clients and projects seamlessly across various devices.


7 slides
Relationship Infographics Presentation Template
Featuring our Relationship Infographic template, this provides the entire process of relationship building in its true form. This infographic will take you through the stages of building a relationship. This design is good for any purpose and can be used as a template for many presentations. Use this template to illustrate your ideas, put forward an argument, or make statistics and facts catchy. In this template, you’ll find everything you need to create a gorgeous relationship infographic. This is the perfect way to share your story and create an emotional connection with your audience.


21 slides
Naga Project Proposal Presentation
Present your project with confidence using this comprehensive proposal presentation! It covers crucial sections such as objectives, methodology, timeline, budget breakdown, and risk mitigation strategies, ensuring every detail is addressed clearly. Ideal for client proposals or internal planning, this template works seamlessly with PowerPoint, Keynote, and Google Slides.


5 slides
Market Segmentation by Demographics Presentation
The "Market Segmentation by Demographics" presentation template showcases a circular infographic that effectively visualizes market segments as distinct demographic groups. Each colored section of the circle corresponds to a different demographic characteristic, such as age, income, or location, and is accompanied by key insights or data points in adjacent text placeholders. This format allows for an intuitive comparison of how each segment contributes to the market, facilitating a clear understanding of the audience composition. This visual arrangement is especially useful for presentations that need to highlight demographic data succinctly to support market analysis or strategic marketing decisions.


6 slides
Butterfly Chart Data Visualization
Present complex comparisons with visual elegance using the Butterfly Chart Data Visualization Presentation. This eye-catching format displays six key data points split symmetrically across two wings—perfect for showcasing contrasts like pros vs. cons, before vs. after, or product comparisons. Each section is color-coded and paired with editable text areas for clarity. Ideal for reports, strategy meetings, and decision-making decks. Fully compatible with PowerPoint, Keynote, and Google Slides for effortless customization.


6 slides
STEM Education and Discovery Presentation
Showcase your STEM insights with this vibrant puzzle-piece infographic. Each piece highlights a key point in science, technology, engineering, or math—perfect for lesson plans, research summaries, or discovery processes. Fully customizable in PowerPoint, Keynote, and Google Slides, making it ideal for educators, researchers, or curriculum developers.


7 slides
E-Learning Tools Infographic Presentation
E-learning refers to any type of learning that occurs through electronic devices, and offers numerous benefits, including flexibility, cost-effectiveness, continuous learning, and environmental friendliness. This E-Learning Template is designed to make your online training and educational material more engaging and effective. The template is fully customizable and compatible with presentation software such as Powerpoint, Keynote, and Google Slides. This template is a powerful tool for anyone who wants to create engaging and effective online training and educational material!


7 slides
Iceberg Infographic Presentation Template
An Iceberg infographic is a powerful and eye-catching way to display information, it is a method for presenting complex information. This template is designed to be fully customizable and include all the elements you need to make an impact on your audience. The Iceberg can be used to visualize any concept that has a direct impact on your performance, from sales to customer retention, from how organizations are staffed to identifying the key players within teams. Use this template to create a detailed iceberg diagram of your business, its customers, and the things that impact them.


4 slides
Task Workflow and Process Automation Presentation
Streamline complex systems with the Task Workflow and Process Automation Presentation. This flowchart-based layout is perfect for visualizing step-by-step procedures, automation pipelines, or operational structures. Each phase is clearly separated, making it easy to track tasks, decisions, and outcomes. Ideal for IT, operations, or management teams. Fully editable in PowerPoint, Keynote, and Google Slides.


6 slides
Skills Gap Assessment Infographic
The Skills Gap refers to the mismatch between the skills and qualifications that employers seek in their workforce and the skills possessed by job seekers or employees. This infographic template is a visual representation of the evaluation and analysis of the skills gap within a specific organization, industry, or job sector. The infographic is designed to help businesses and stakeholders understand the disparity between the skills required for certain roles and the skills possessed by the current workforce. By identifying the skills gap, organizations can develop targeted training and development programs to bridge the gap and enhance their employees' skills.


7 slides
Feedback Control Infographic
Feedback is information, reactions, or comments given to individuals or entities regarding their performance, actions, products, services, or behaviors. This infographic template is an educational odyssey through the world of precision and control, guiding you through the principles and applications of feedback mechanisms. Compatible with Powerpoint, Keynote, and Google Slides. This template displays a target icon with decreasing error rings, illustrating the goal of minimizing errors through feedback control for optimal performance. Display icons representing sensors and actuators, emphasizing their pivotal roles in feedback control systems.


4 slides
Annual Calendar Layout for Projects
Plan your year like a pro with this clean and colorful visual layout—it’s designed to help you stay focused, organized, and on track month by month. Whether you're mapping out team projects, campaign milestones, or business goals, this annual calendar format makes it easy to see everything at a glance. Fully compatible with PowerPoint, Keynote, and Google Slides.


6 slides
Goal Setting and Strategic Planning Presentation
Present objectives and action plans with the Goal Setting and Strategic Planning template. Featuring a modern segmented design, this layout is perfect for outlining priorities, initiatives, and milestones. Fully editable in Canva, PowerPoint, and Google Slides, allowing you to adapt colors, icons, and text to match your business vision.