
Features
- 5 Unique slides
- Fully editable and easy to edit in Microsoft Powerpoint, Keynote and Google Slides
- 16:9 widescreen layout
- Clean and professional designs
- Export to JPG, PDF or send by email


Do you have any questions?
Recommend


6 slides
Weekly Task Schedule Presentation
Stay on top of your week with this clean and efficient layout designed to organize daily priorities and action plans. Perfect for tracking goals, meetings, or team deliverables, it keeps productivity front and center. Fully customizable and compatible with PowerPoint, Keynote, and Google Slides for easy professional presentation use.


4 slides
Onboarding 30-60-90 Roadmap Presentation
Simplify your onboarding strategy with the Onboarding 30–60–90 Roadmap Presentation. This clean, visual layout breaks down employee integration into three distinct timeframes—30, 60, and 90 days—each with space for goals, tasks, or milestones. Perfect for HR teams, managers, and trainers. Fully editable in Canva, PowerPoint, Keynote, and Google Slides.


5 slides
IT Infrastructure and Support Presentation
Optimize your IT presentations with the IT Infrastructure and Support Presentation template. Featuring a structured, step-by-step layout, this slide design visually conveys IT infrastructure processes, system support workflows, and key technology elements. Ideal for IT teams, tech consultants, and business professionals looking to illustrate complex IT strategies effectively. Fully editable in PowerPoint, Keynote, and Google Slides for seamless customization.


8 slides
Data-Driven KPI Slide Presentation
Bring your data to life with a sharp, modern layout that turns complex metrics into clear, compelling visuals. This presentation helps you showcase performance insights, compare trends, and highlight key takeaways with ease. Fully customizable and compatible with PowerPoint, Keynote, and Google Slides.


6 slides
Business Organizational Structure
Present your company's hierarchy with clarity using this modern organizational chart slide. Ideal for outlining team leadership, department roles, or executive structure. Fully editable in PowerPoint, Keynote, and Google Slides for easy customization.


20 slides
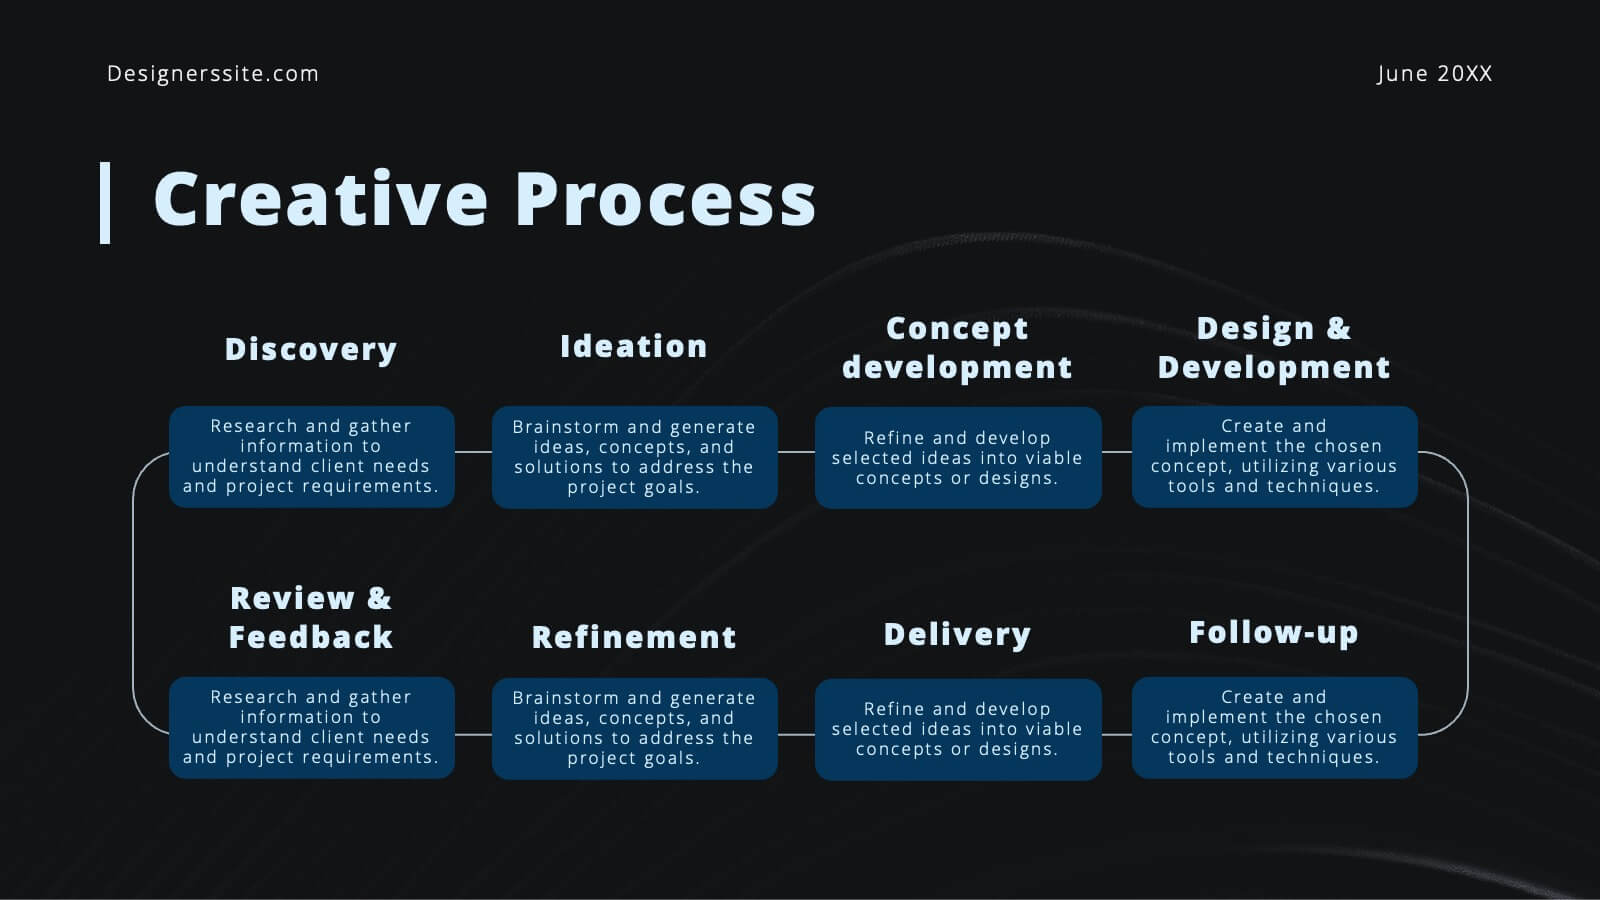
Bravo Creative Portfolio Presentation
Showcase your creative prowess with this sleek, modern portfolio presentation template. Perfect for highlighting featured projects, client testimonials, and your creative process, this template ensures your work shines. Its stylish design and professional layout make it ideal for impressing potential clients and collaborators. Compatible with PowerPoint, Keynote, and Google Slides, it's versatile for any platform.


6 slides
Buyer Behavior Trends Infographic
Unlock the secrets of consumer psychology with our Buyer Behavior Trends Infographic Template. This template offers a compelling visual exploration of modern consumer trends, designed to capture and convey the nuances of buyer behavior in today’s fast-paced market. Featuring a sleek, modern design, each slide is tailored to present data effectively, from spending habits and brand loyalty to digital consumption and decision-making processes. Use this template to illustrate the underlying factors that influence consumer choices and how these trends shape the future of marketing. Perfect for marketers, researchers, and business strategists, this template allows you to customize layouts, colors, and fonts to align with your brand or study focus. It's an invaluable tool for presentations, reports, and digital content, helping you to communicate complex data in an accessible and engaging way.


5 slides
Cloud Security and Data Storage Presentation
Visually explain your cloud architecture and data protection strategy with this sleek horizontal diagram. Each layered icon represents different aspects of storage, access, and security control—perfect for IT audits, cloud infrastructure briefs, and risk management reports. Fully editable in PowerPoint, Keynote, and Google Slides.


5 slides
Real Estate Investing Infographics
Real estate investing refers to the purchase, ownership, management, rental, or sale of real estate properties with the objective of generating income and/or capital appreciation. These infographic templates can be used to provide key information and insights about real estate investing. These are designed to educate individuals about the basics of real estate investing, its benefits, and important considerations to help them make informed investment decisions. These infographics are great for anyone seeking to understand the basics of real estate. Compatible with Powerpoint, Keynote, and Google Slides.


5 slides
Solution Building with Puzzle Framework Presentation
Present integrated strategies with the Solution Building with Puzzle Framework Presentation. This visually compelling layout uses a four-piece puzzle cross to represent interconnected ideas or components—perfect for mapping out project phases, strategic solutions, or department contributions. Fully customizable in Canva, PowerPoint, or Google Slides for easy content editing.


6 slides
Brain Development Infographic
Brain Development refers to the growth, maturation, and organization of the brain throughout an individual's life, starting from early prenatal stages and continuing into adulthood. This infographic template serves as a valuable educational resource for educators, parents, healthcare professionals, and anyone interested in understanding the fascinating process of brain development. This infographic highlights the stages and factors that shape brain growth, to help promote awareness and emphasize the importance of creating supportive environments for brain development. Compatible with Powerpoint, Keynote, and Google Slides.


7 slides
Health Infographic Presentation Template
A health infographic is a visual representation of information and data related to health. This template can be used to convey complex information about a variety of health topics, such as disease symptoms, risk factors, and preventive measures, in a simple and easily understandable manner. This Health infographic displays graphics, images, and charts to help illustrate the information and make it more engaging and accessible to your audience. This template can be used for various purposes, such as educating the public, promoting healthy habits, and informing healthcare professionals.


5 slides
Long-Term Strategy Slide Presentation
Ignite big ideas with a bold, forward-moving layout that makes long-range goals feel inspiring and achievable. This presentation helps you outline future plans, key milestones, and strategic priorities with clarity and visual impact. Easy to edit and fully compatible with PowerPoint, Keynote, and Google Slides.


6 slides
Branching Structure Tree Chart Presentation
Visualize ideas, processes, or team structures with the Branching Structure Tree Chart Presentation. This elegant tree diagram layout allows you to display six key points or stages branching out naturally from a central concept. Ideal for organizational charts, decision flows, or brainstorming visuals. Fully editable in PowerPoint, Keynote, and Google Slides.


5 slides
Operational Structure Layout Presentation
Visualize team hierarchies and departmental flow with this operational structure layout. Ideal for displaying reporting lines, management roles, or project leads. Clean, minimal, and easy to edit in Canva, PowerPoint, or Google Slides—perfect for internal presentations, HR planning, or business development overviews. Keep your structure clear and professional.


23 slides
Mystic Small Business Pitch Deck Presentation
Elevate your small business presentations with this sleek, professional pitch deck template! It’s designed to highlight your company's background, market opportunities, and key objectives in a visually appealing format. Perfect for showcasing your products, services, value proposition, and financial performance, this template makes your pitch stand out. Customize it for PowerPoint, Keynote, or Google Slides to suit your needs.


3 slides
Business Self-Introduction
Make a memorable first impression with this clean, skill-focused introduction slide. Ideal for presenting professional backgrounds, role highlights, and expertise levels. Great for resumes, team intros, or portfolio decks. Fully editable in PowerPoint, Keynote, and Google Slides.