


Features
- 4 Unique slides
- Fully editable and easy to edit in Microsoft Powerpoint, Keynote and Google Slides
- 16:9 widescreen layout
- Clean and professional designs
- Export to JPG, PDF or send by email


Do you have any questions?
Recommend


8 slides
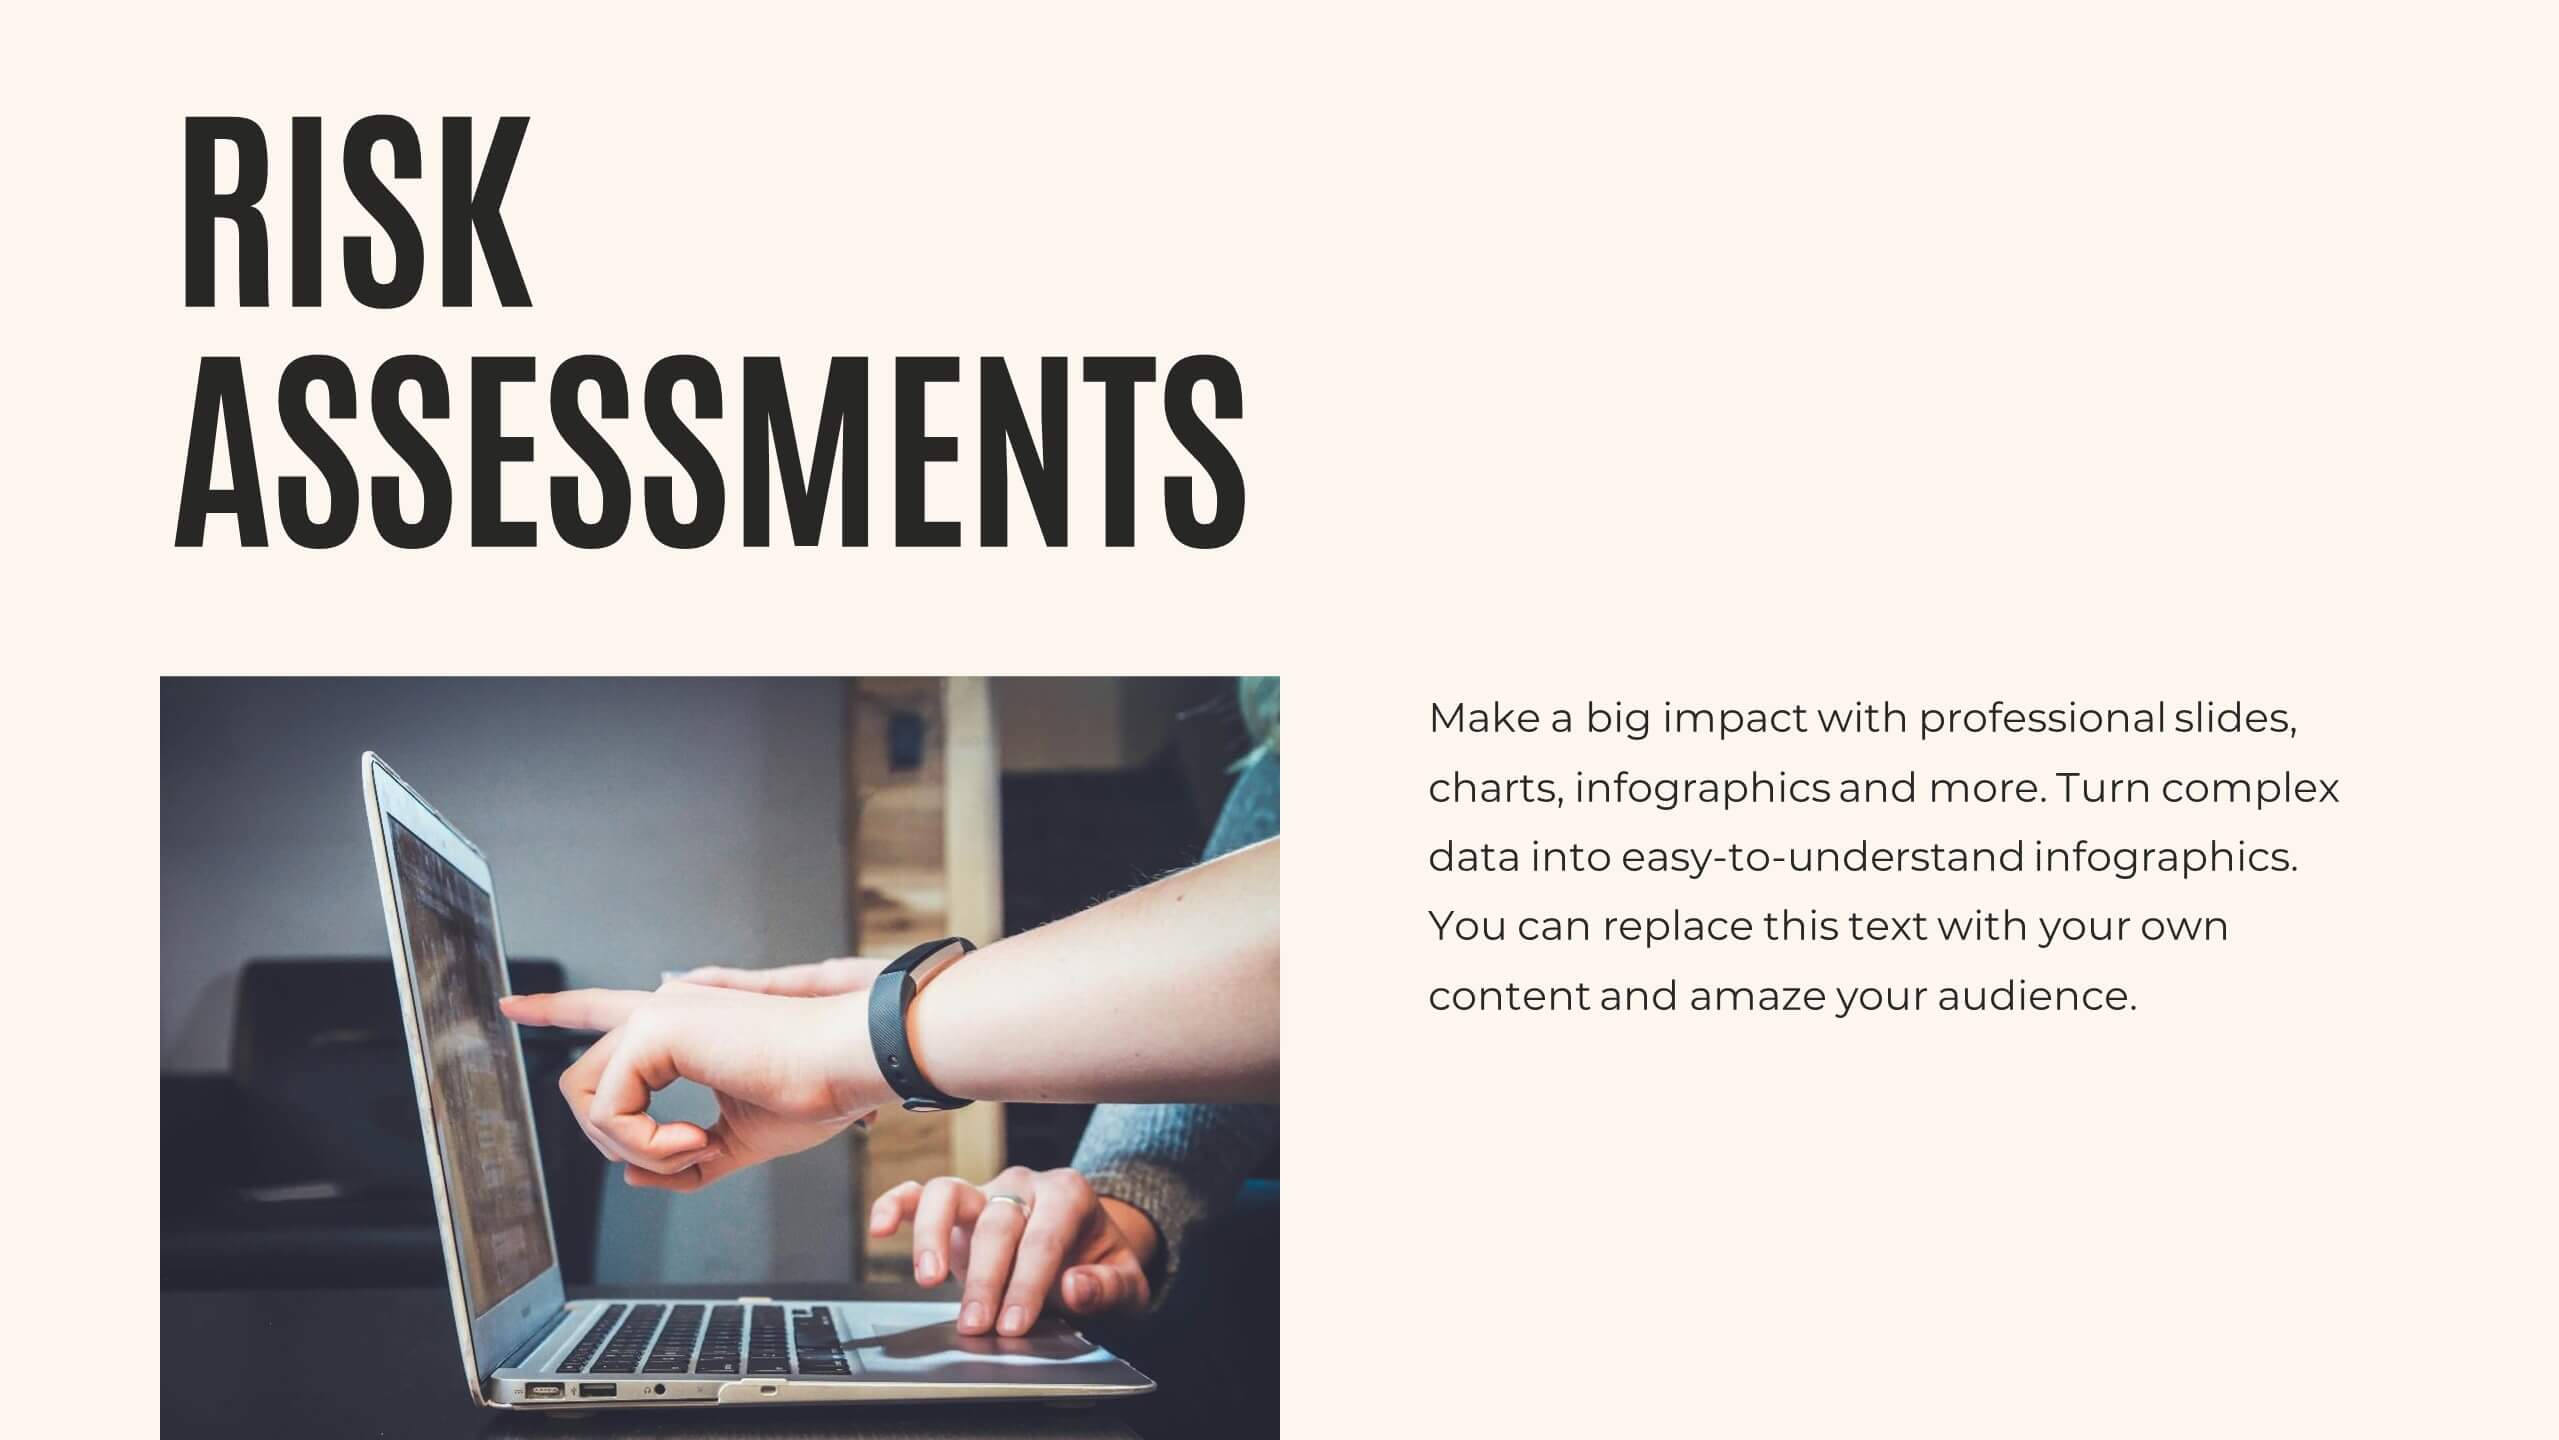
Business Risk Identification and Management
Simplify complex risk factors with this visually engaging diagram. This template uses overlapping circular segments to categorize and assess risk impact across four business areas—ideal for project managers, analysts, and consultants. Customizable progress bars help communicate risk levels with clarity. Compatible with PowerPoint, Keynote, and Google Slides.


4 slides
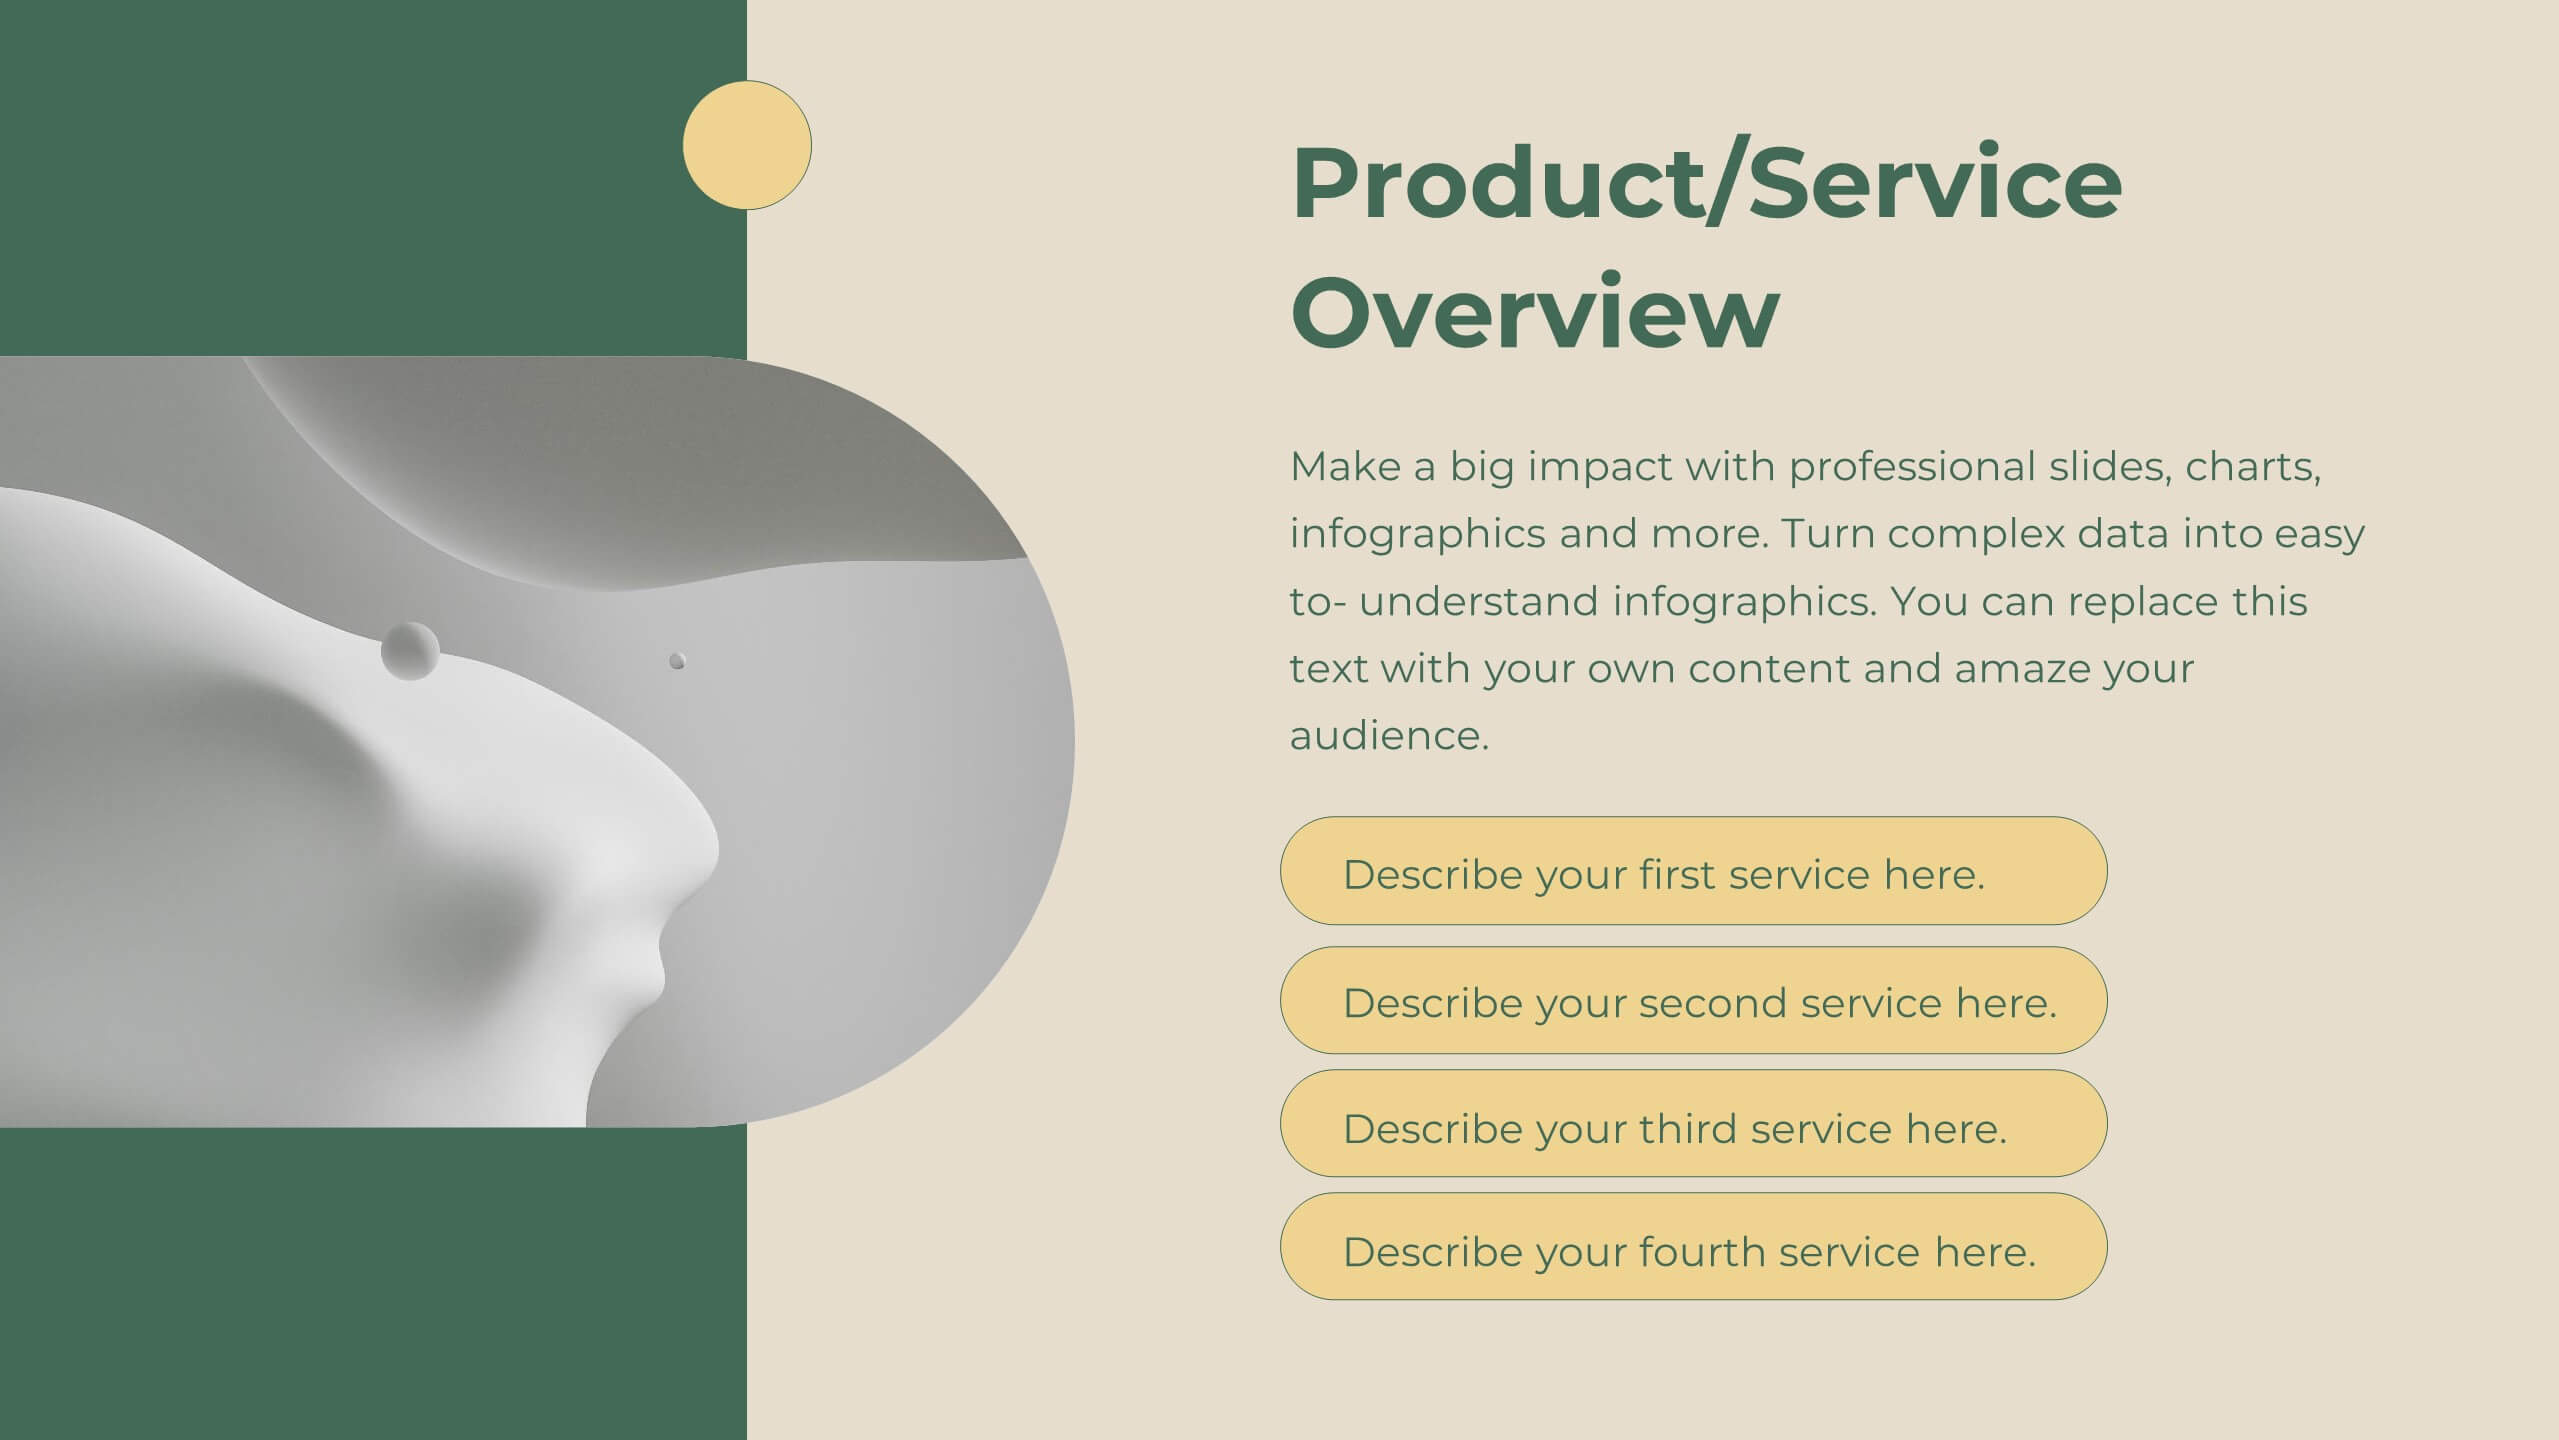
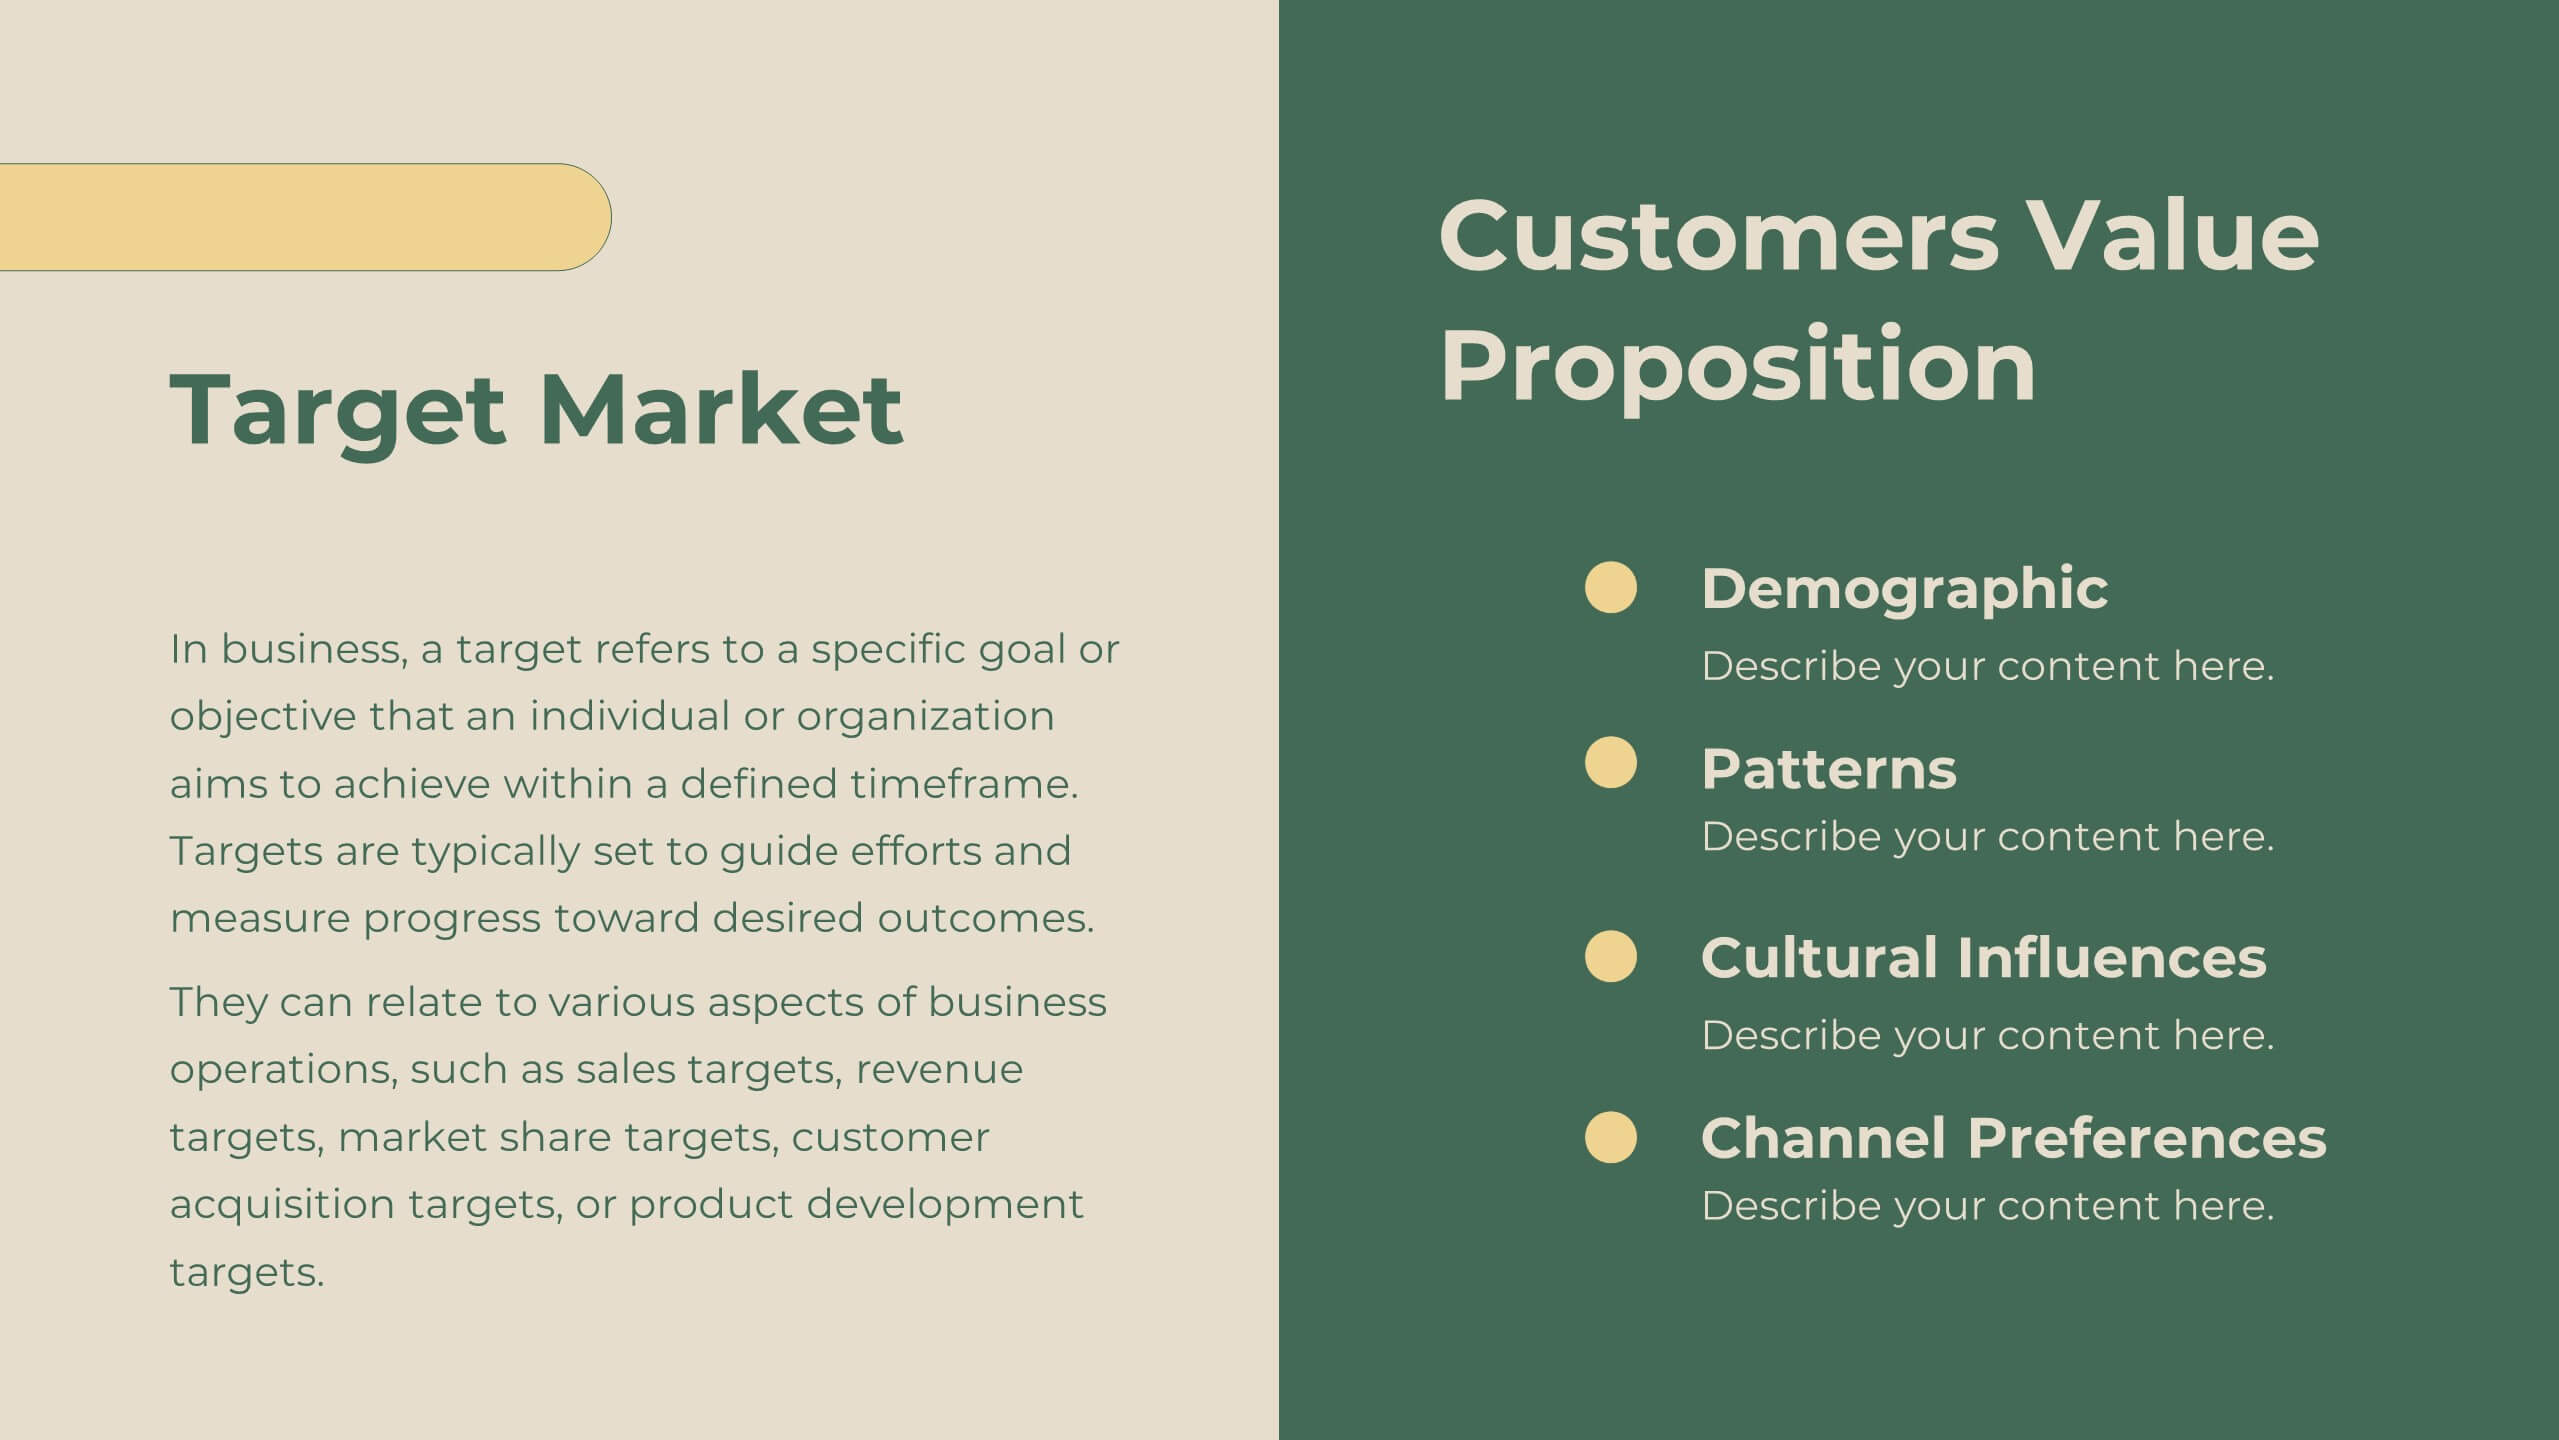
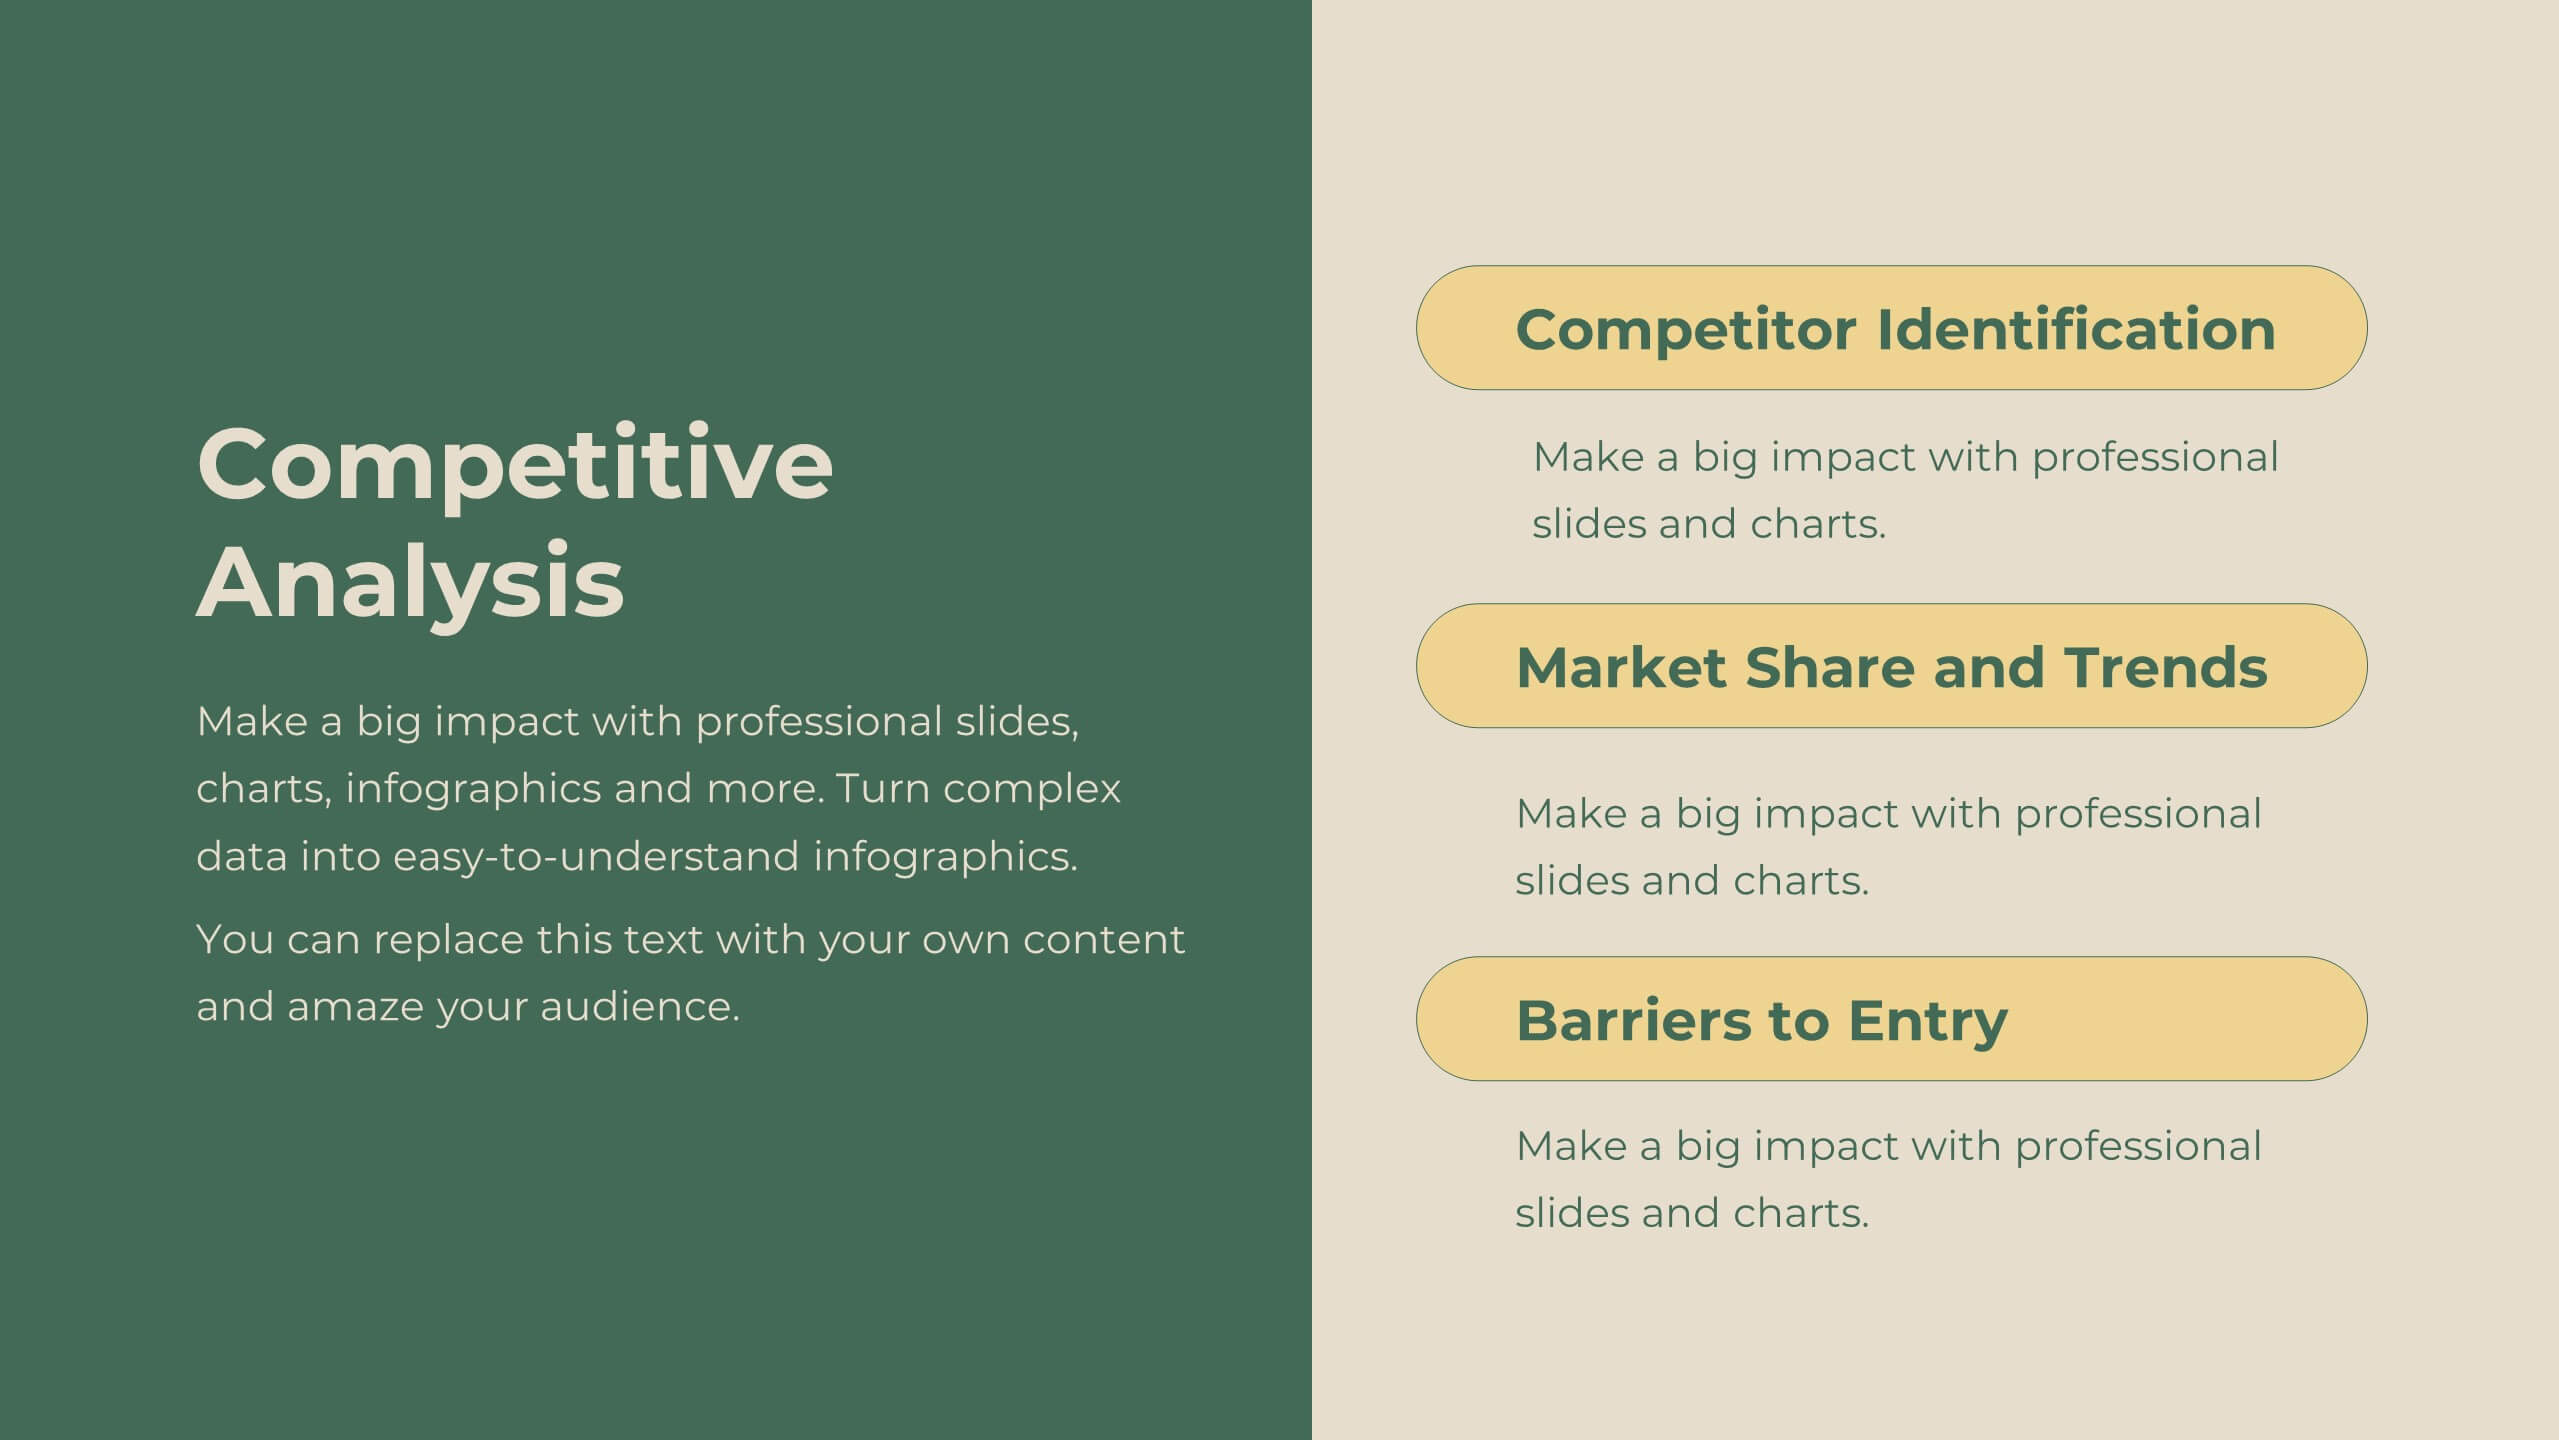
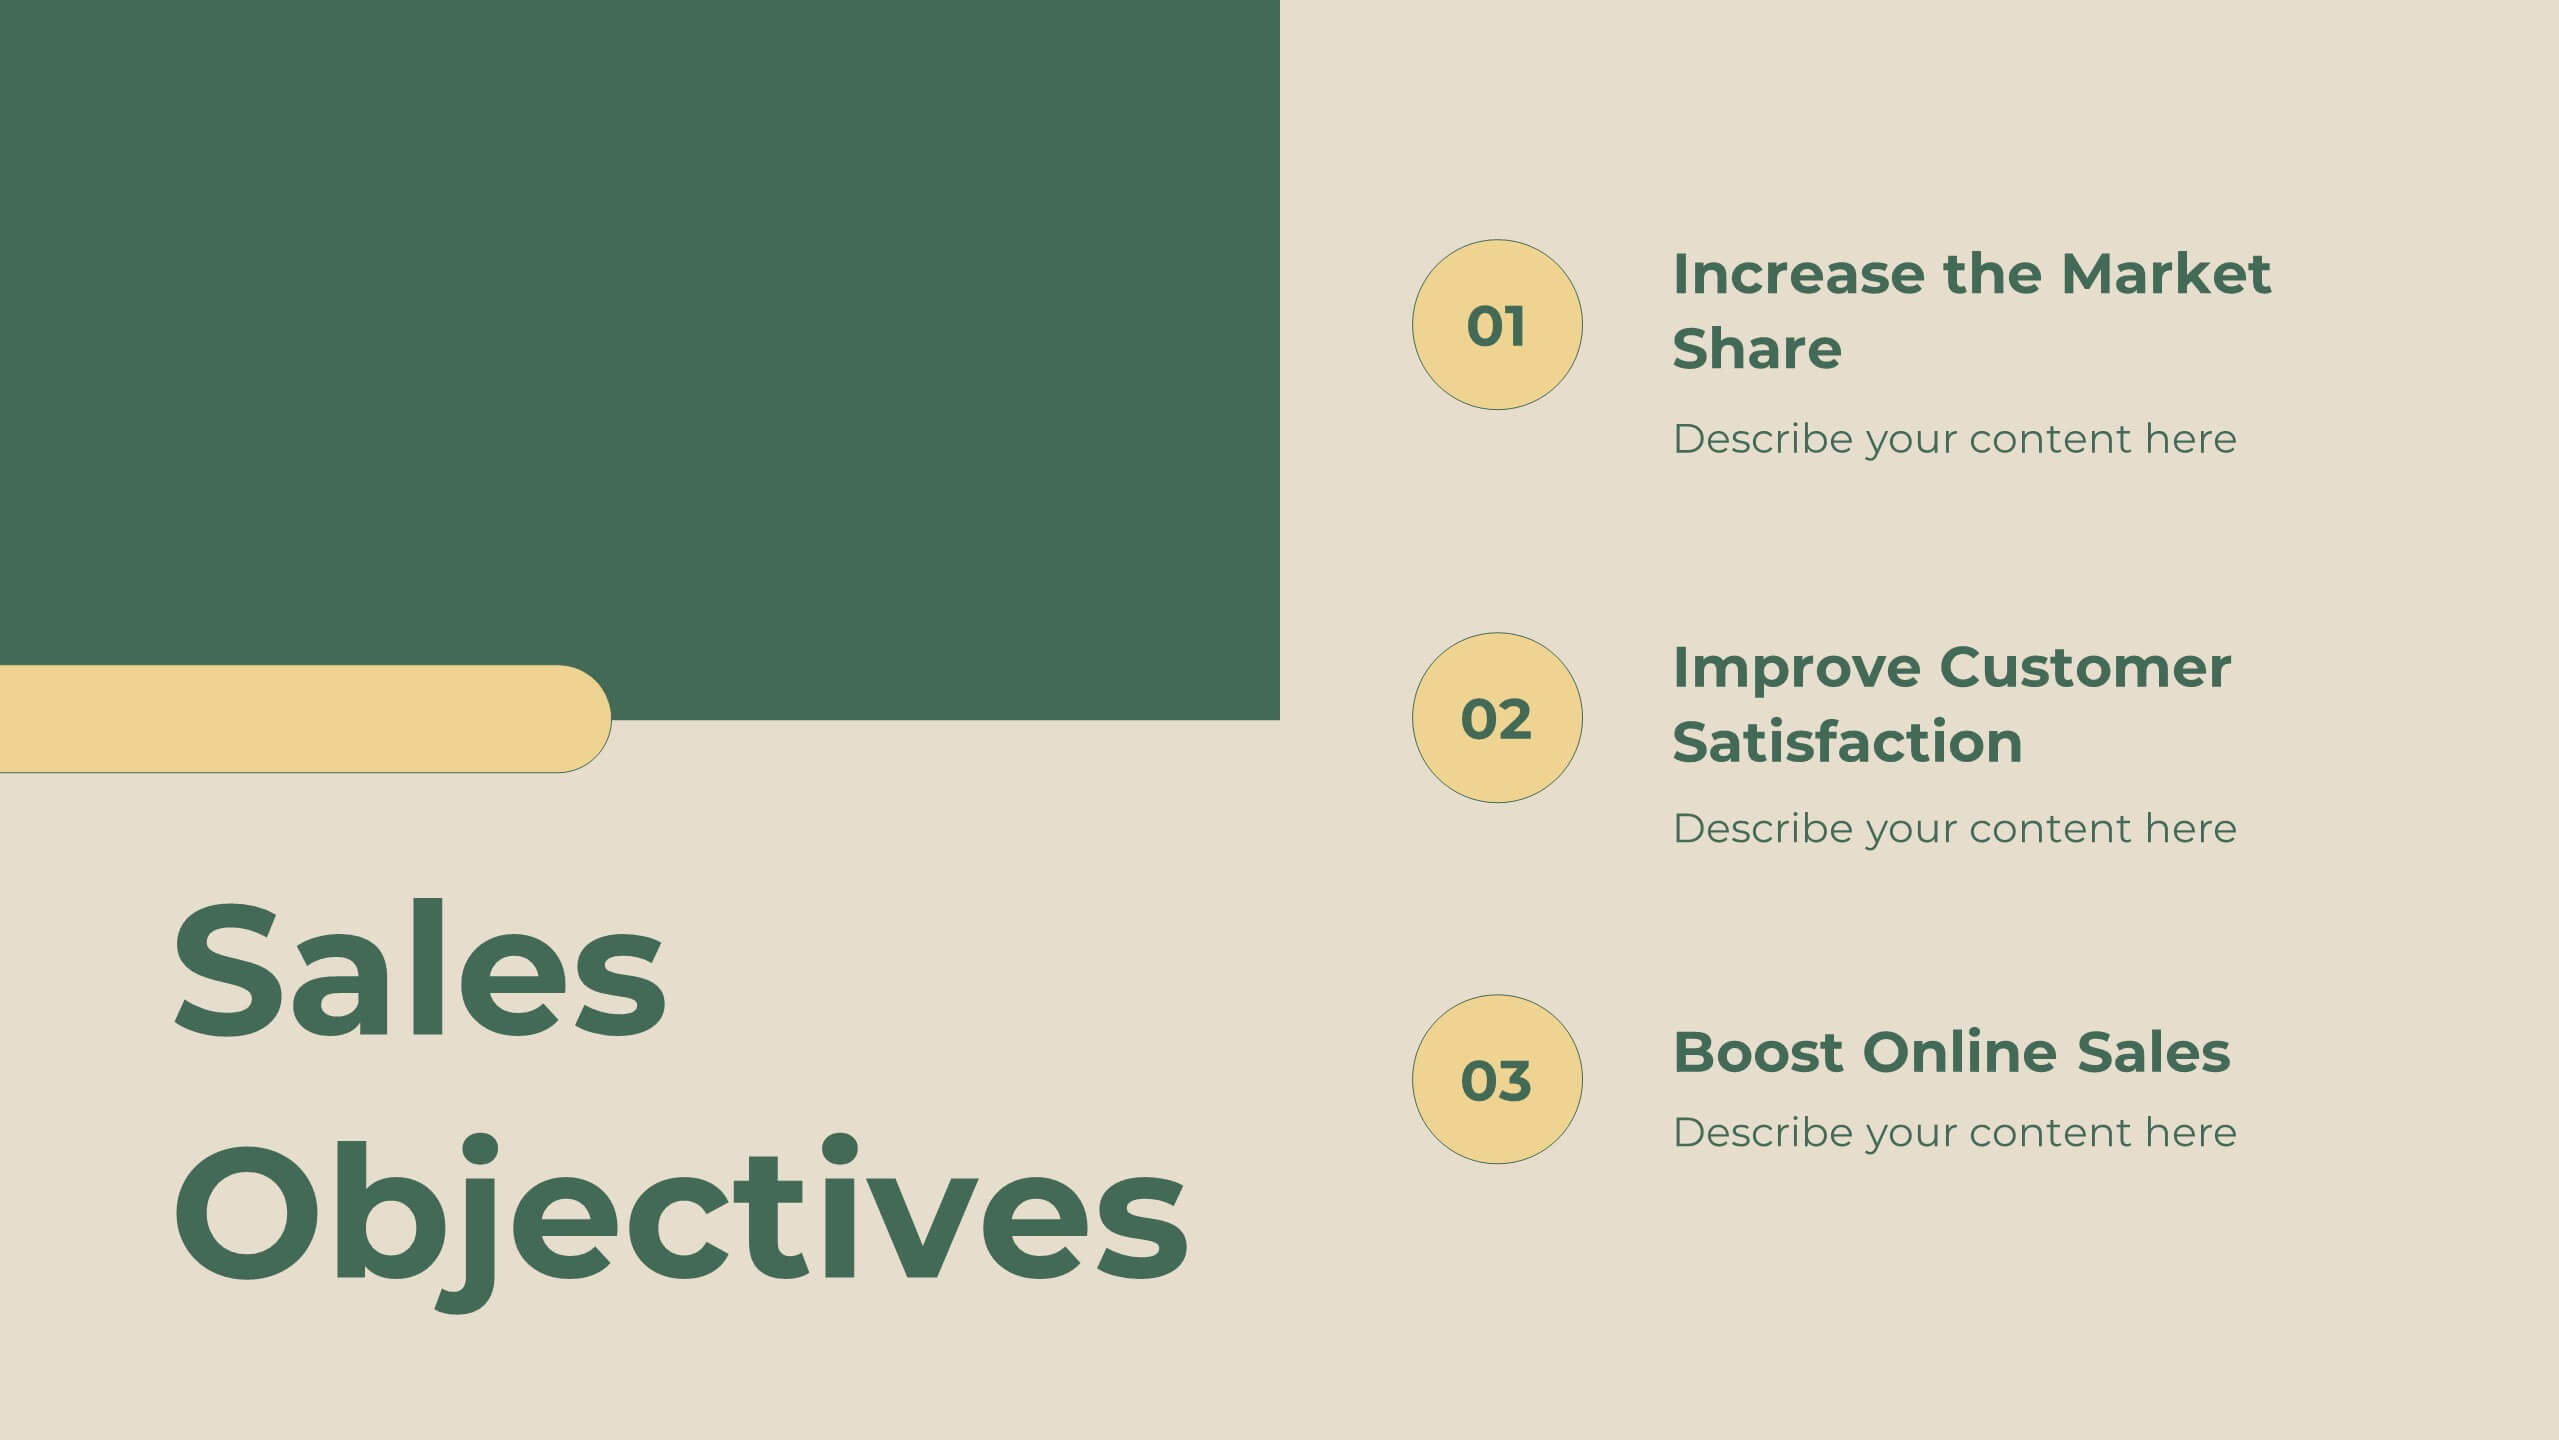
Comprehensive Business Project Pitch Presentation
Present a polished and structured message with the Comprehensive Business Project Pitch Presentation. Featuring a clean checklist format paired with bold icons and color-coded segments, this layout is perfect for showcasing core strategies, deliverables, or proposal points. Easily customizable for PowerPoint, Keynote, or Google Slides.


6 slides
Six Sigma DMAIC Cycle Overview Presentation
Present each phase of the DMAIC methodology with the Six Sigma DMAIC Cycle Overview Presentation. This clean and professional layout walks through Define, Measure, Analyze, Improve, and Control in a clear, easy-to-follow structure. Perfect for Six Sigma professionals, quality managers, and operational teams. Fully editable in Canva, PowerPoint, Keynote, and Google Slides.


10 slides
Lean Business Model Planning Presentation
Streamline your startup strategy with this Lean Canvas presentation template. Designed for entrepreneurs and agile teams, it breaks down your business plan into 9 essential blocks—from Problem and Solution to Revenue Streams and Cost Structure. Easy to edit in PowerPoint, Keynote, or Google Slides for fast, effective planning and pitch presentations.


6 slides
Aviation Safety and Efficiency Presentation
Take your audience to new heights with this modern aviation-themed infographic layout. Perfect for illustrating flight performance, safety systems, and operational improvements, it combines clarity with sleek visual flow to enhance understanding. Fully customizable and compatible with PowerPoint, Keynote, and Google Slides for effortless professional presentations.


21 slides
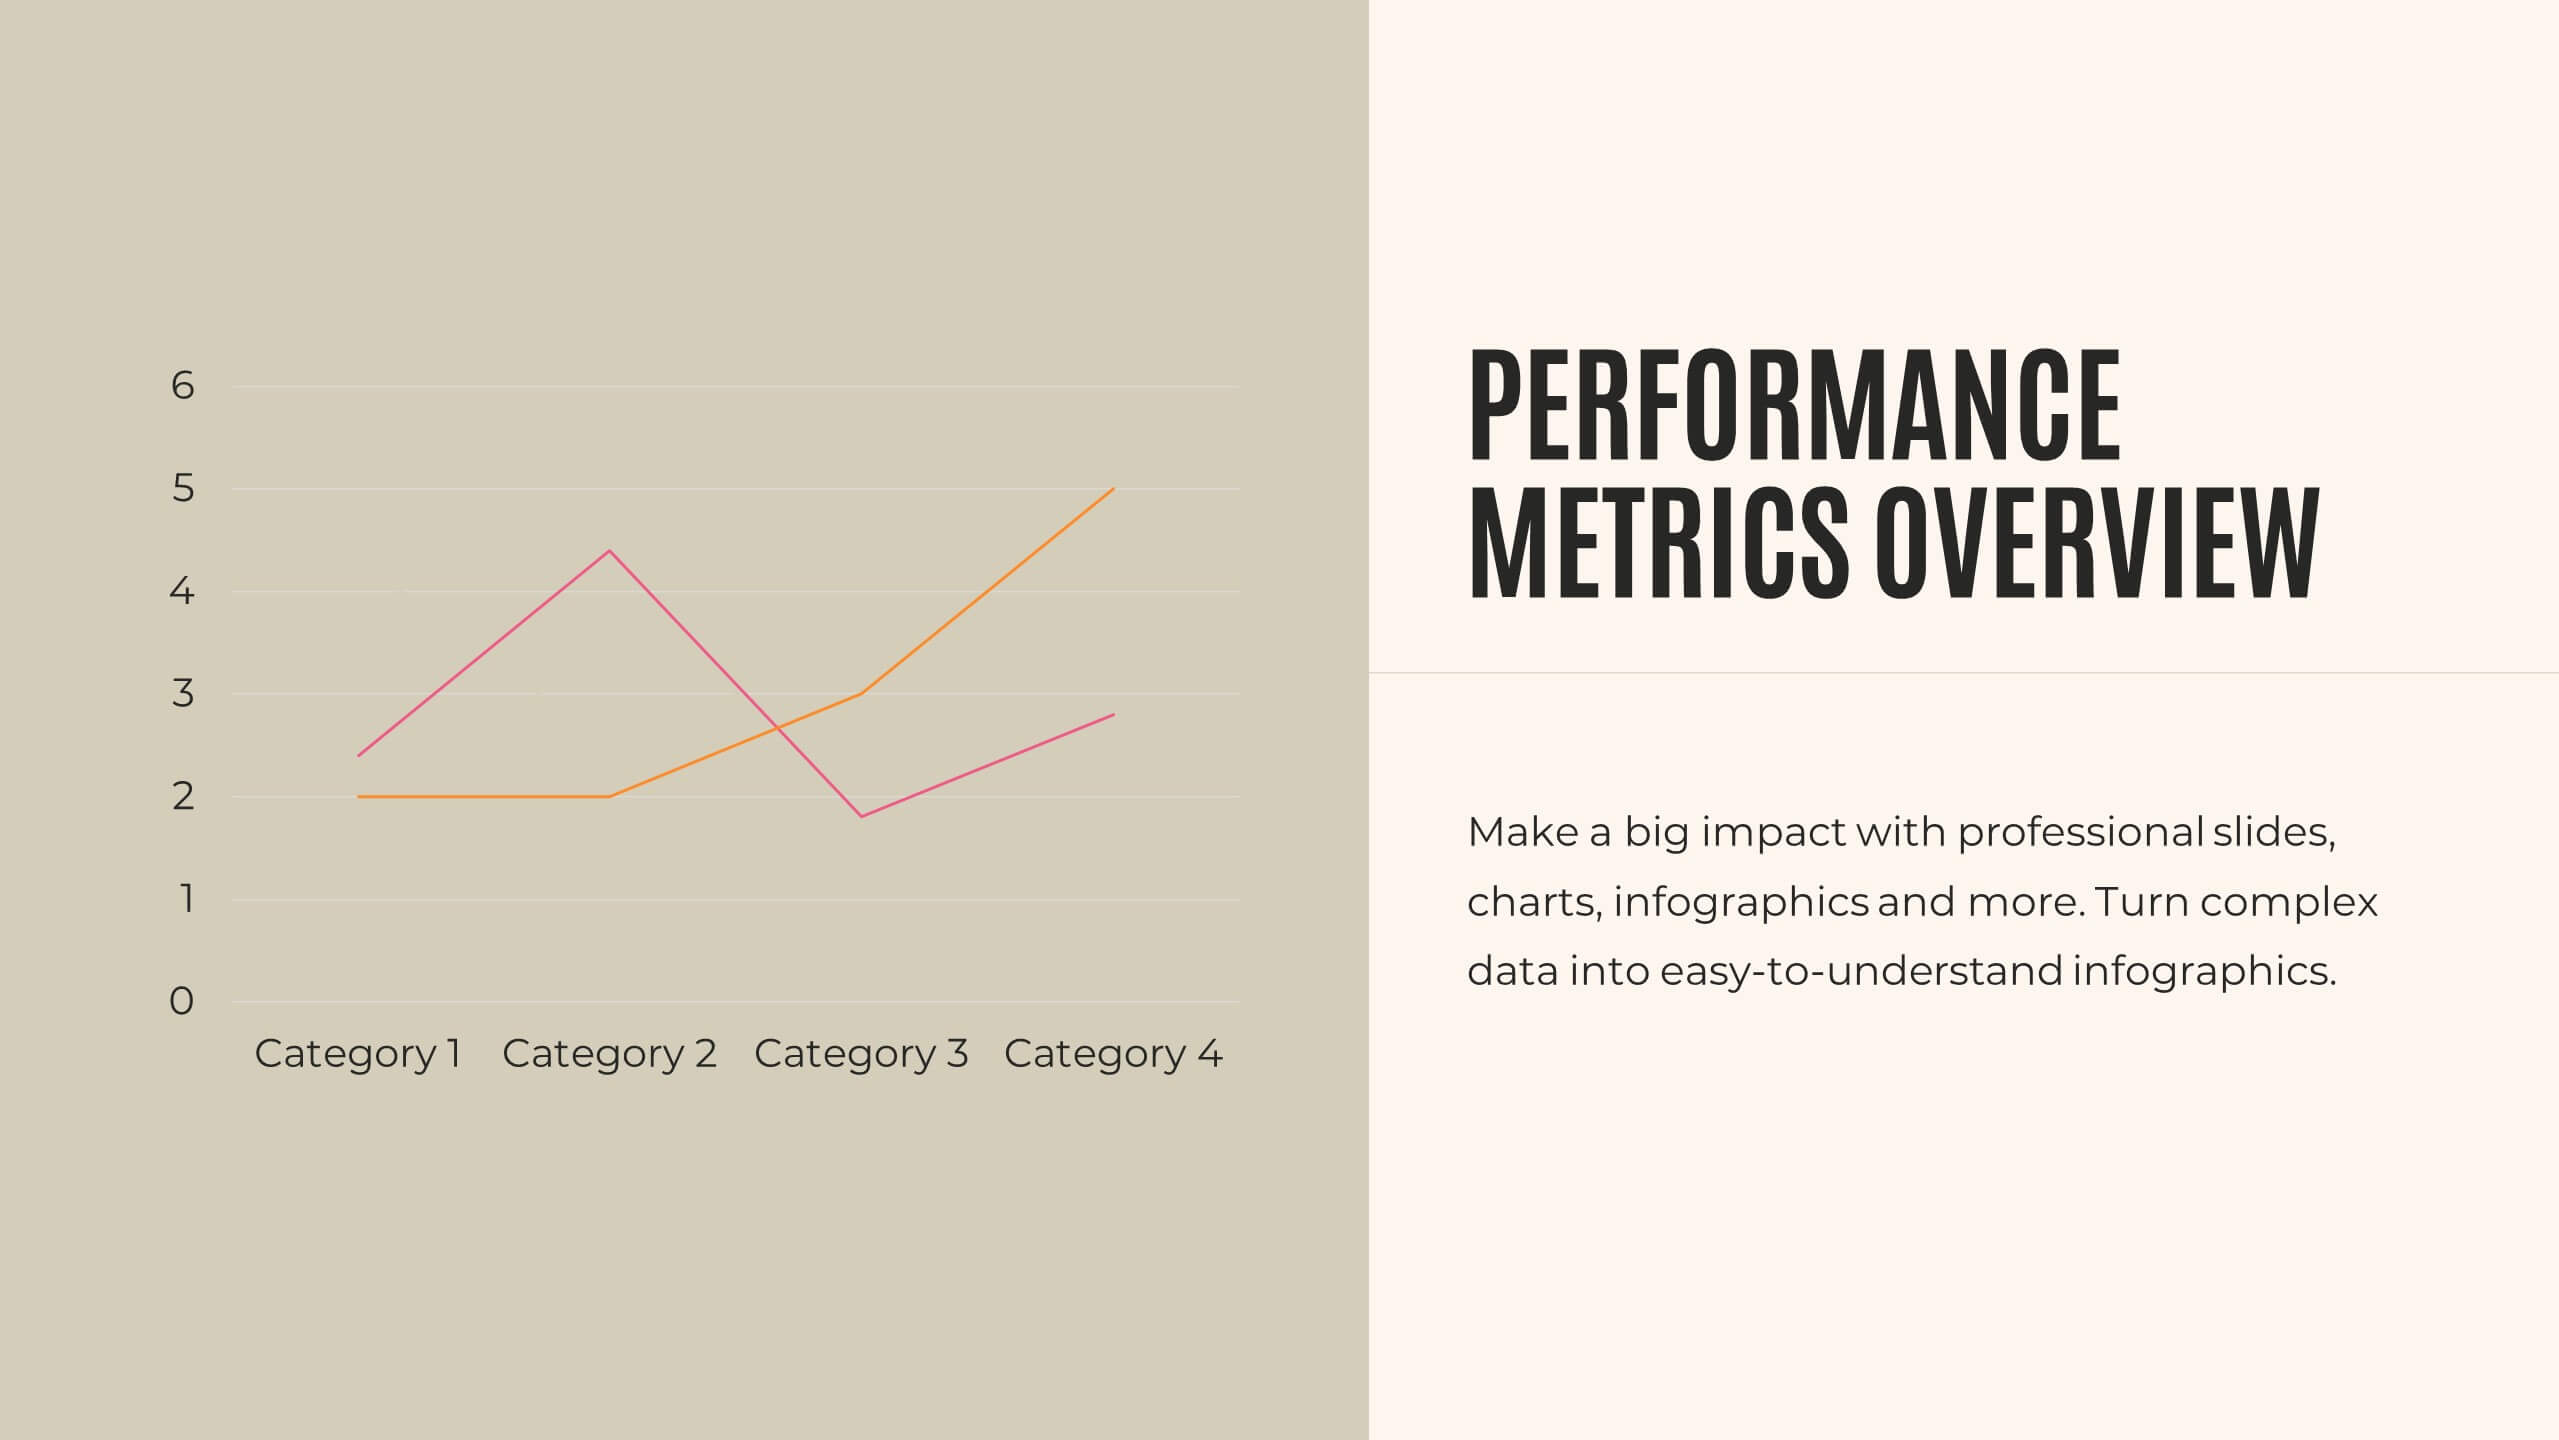
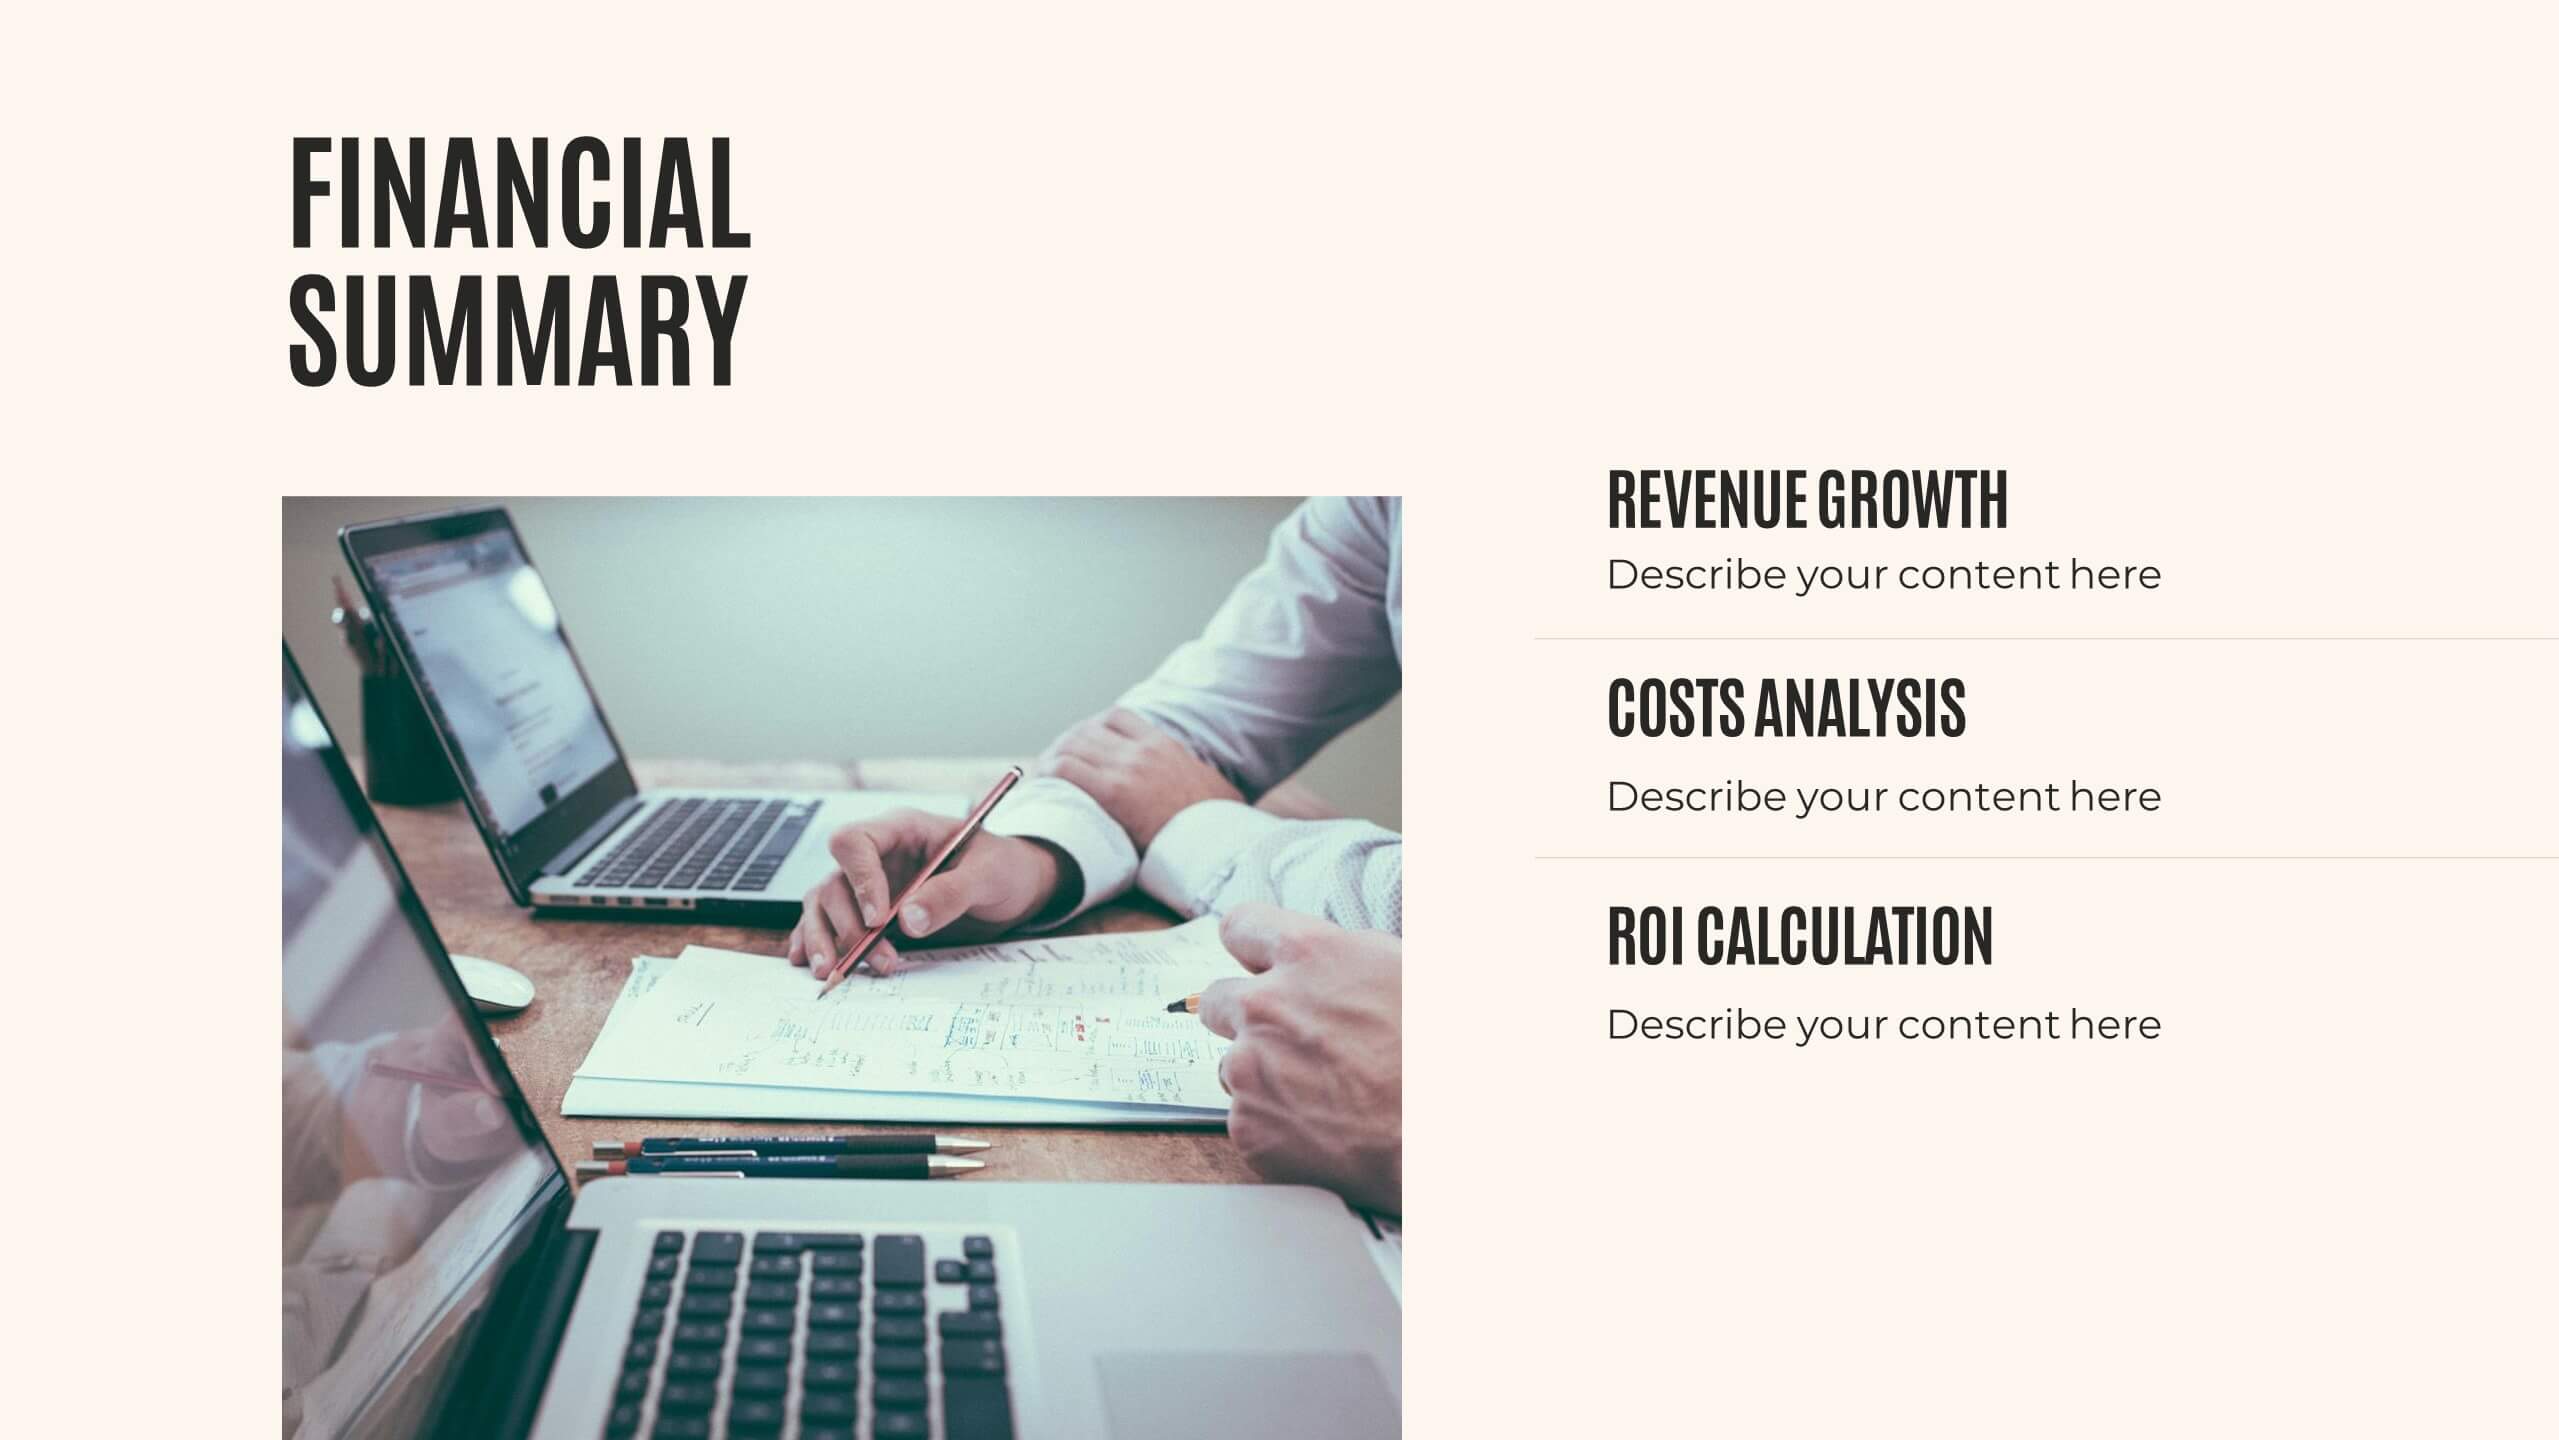
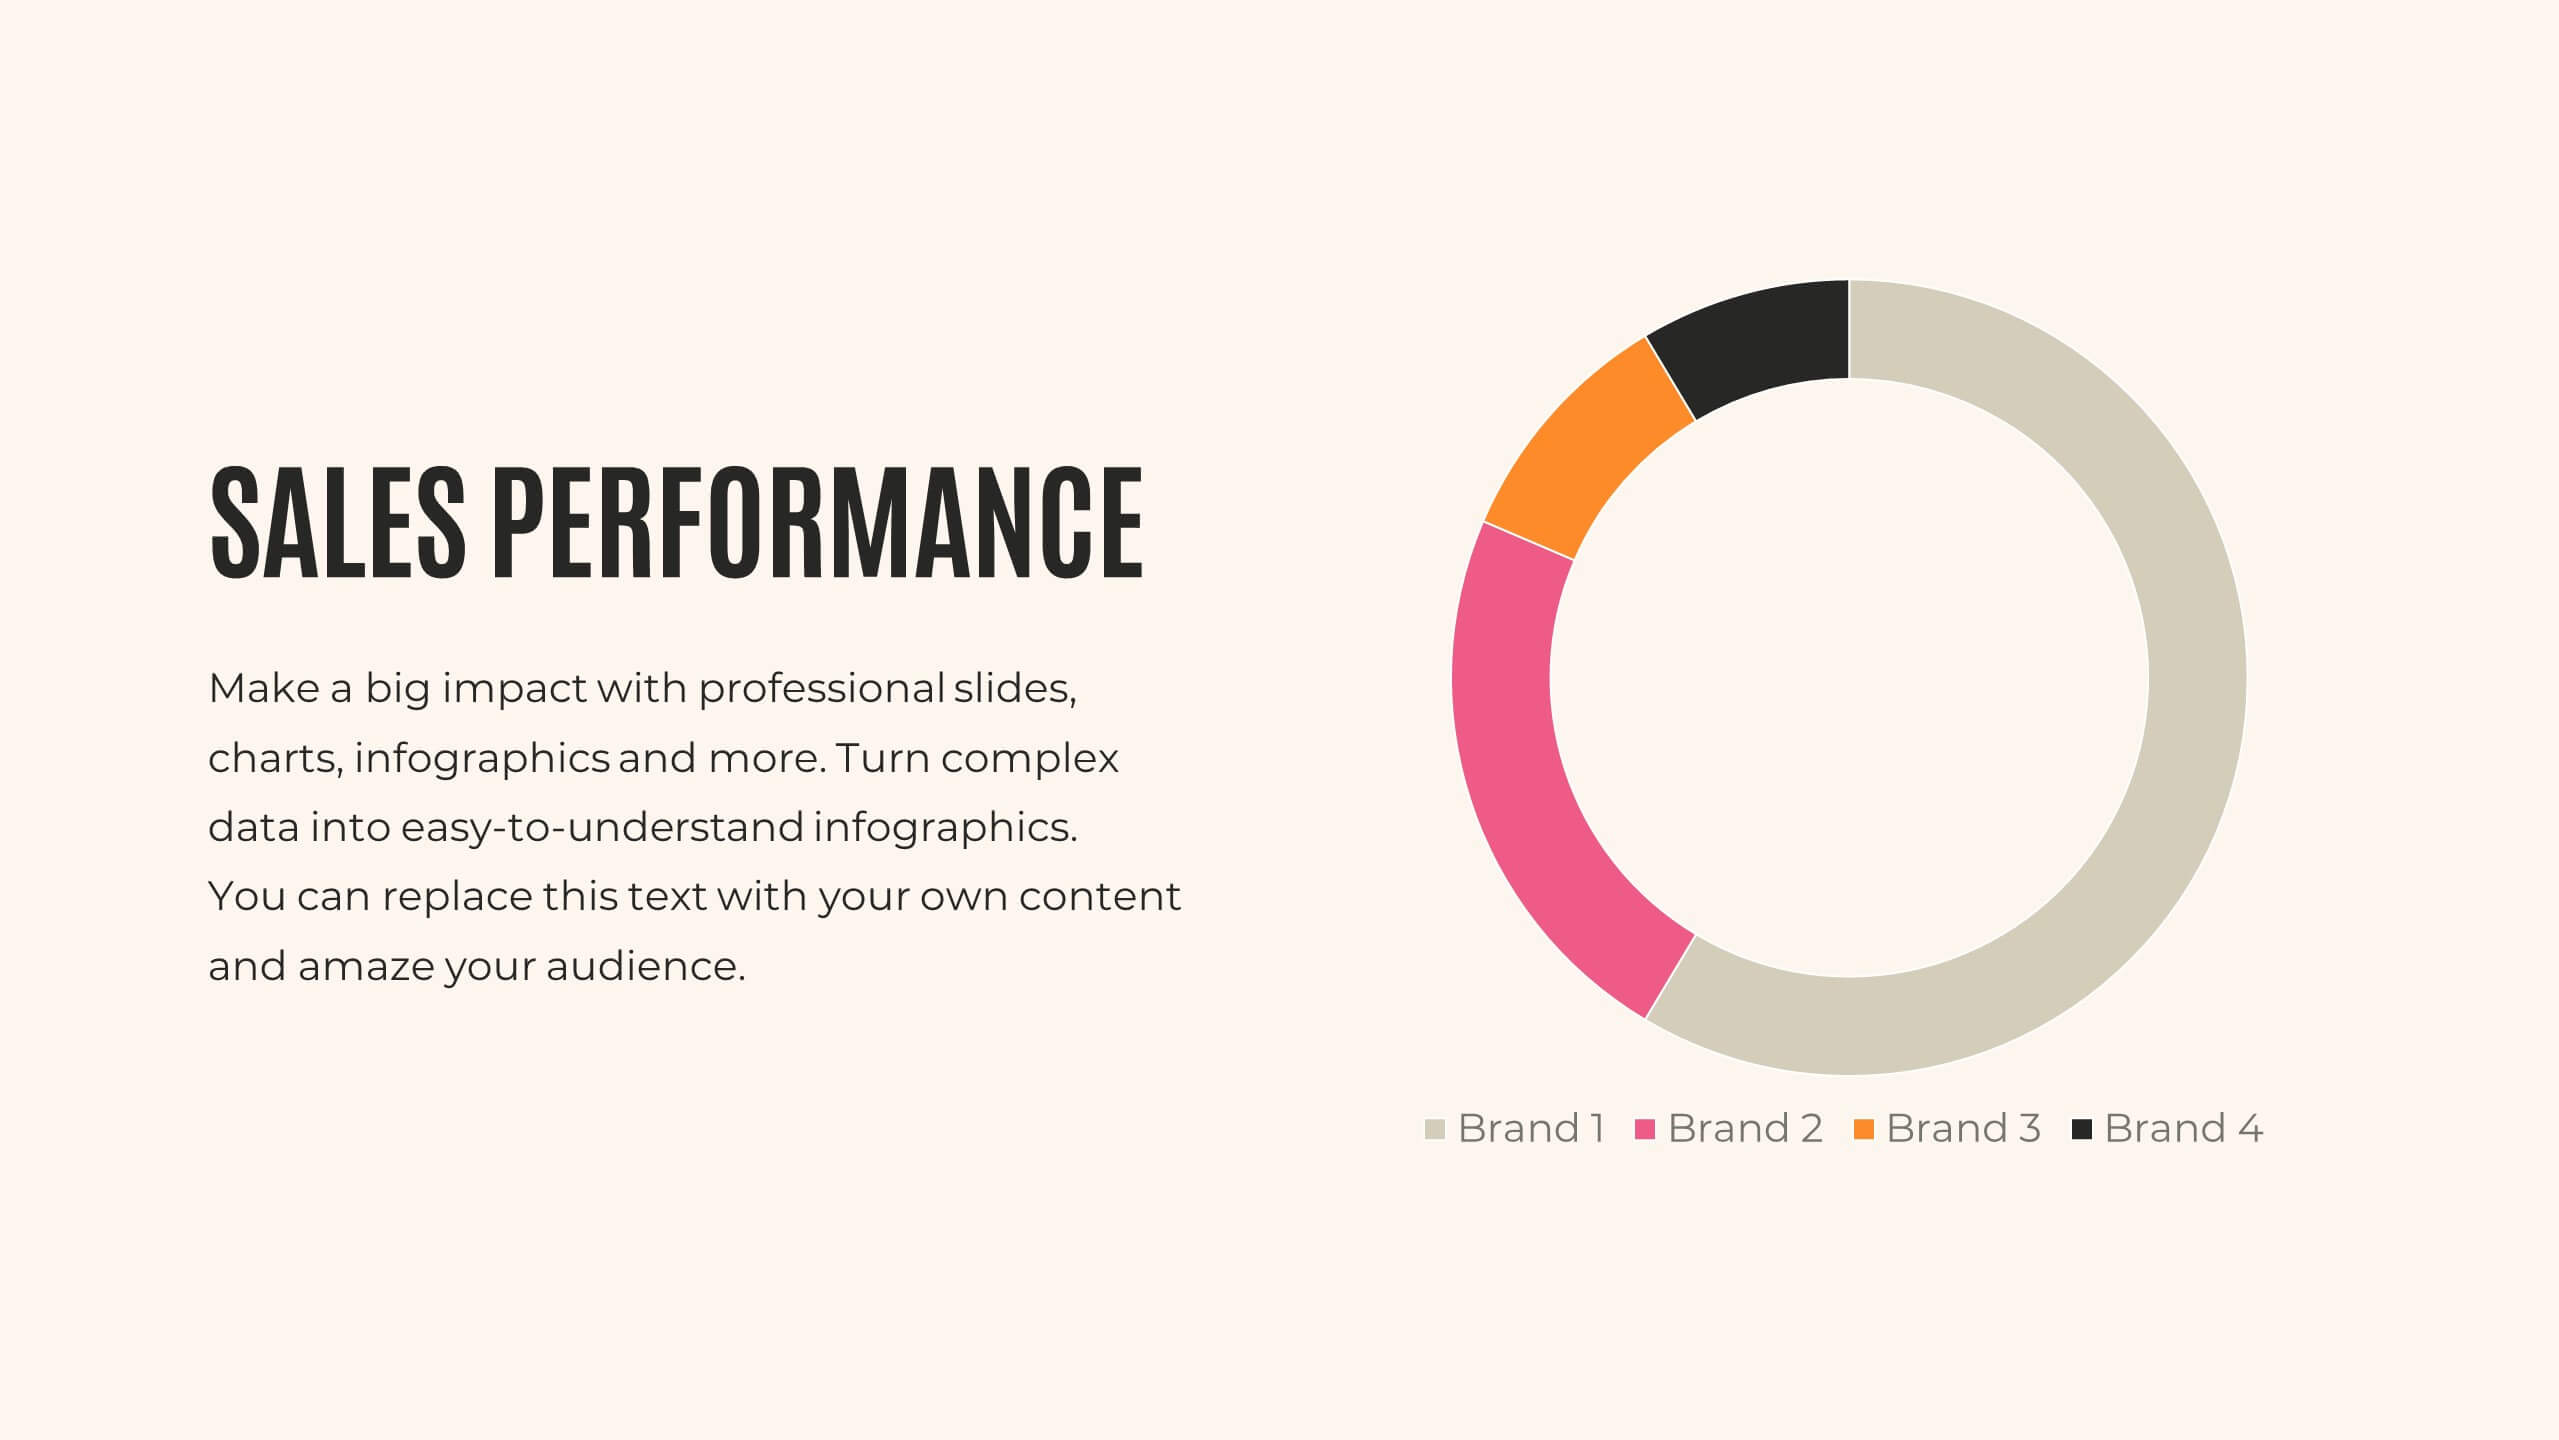
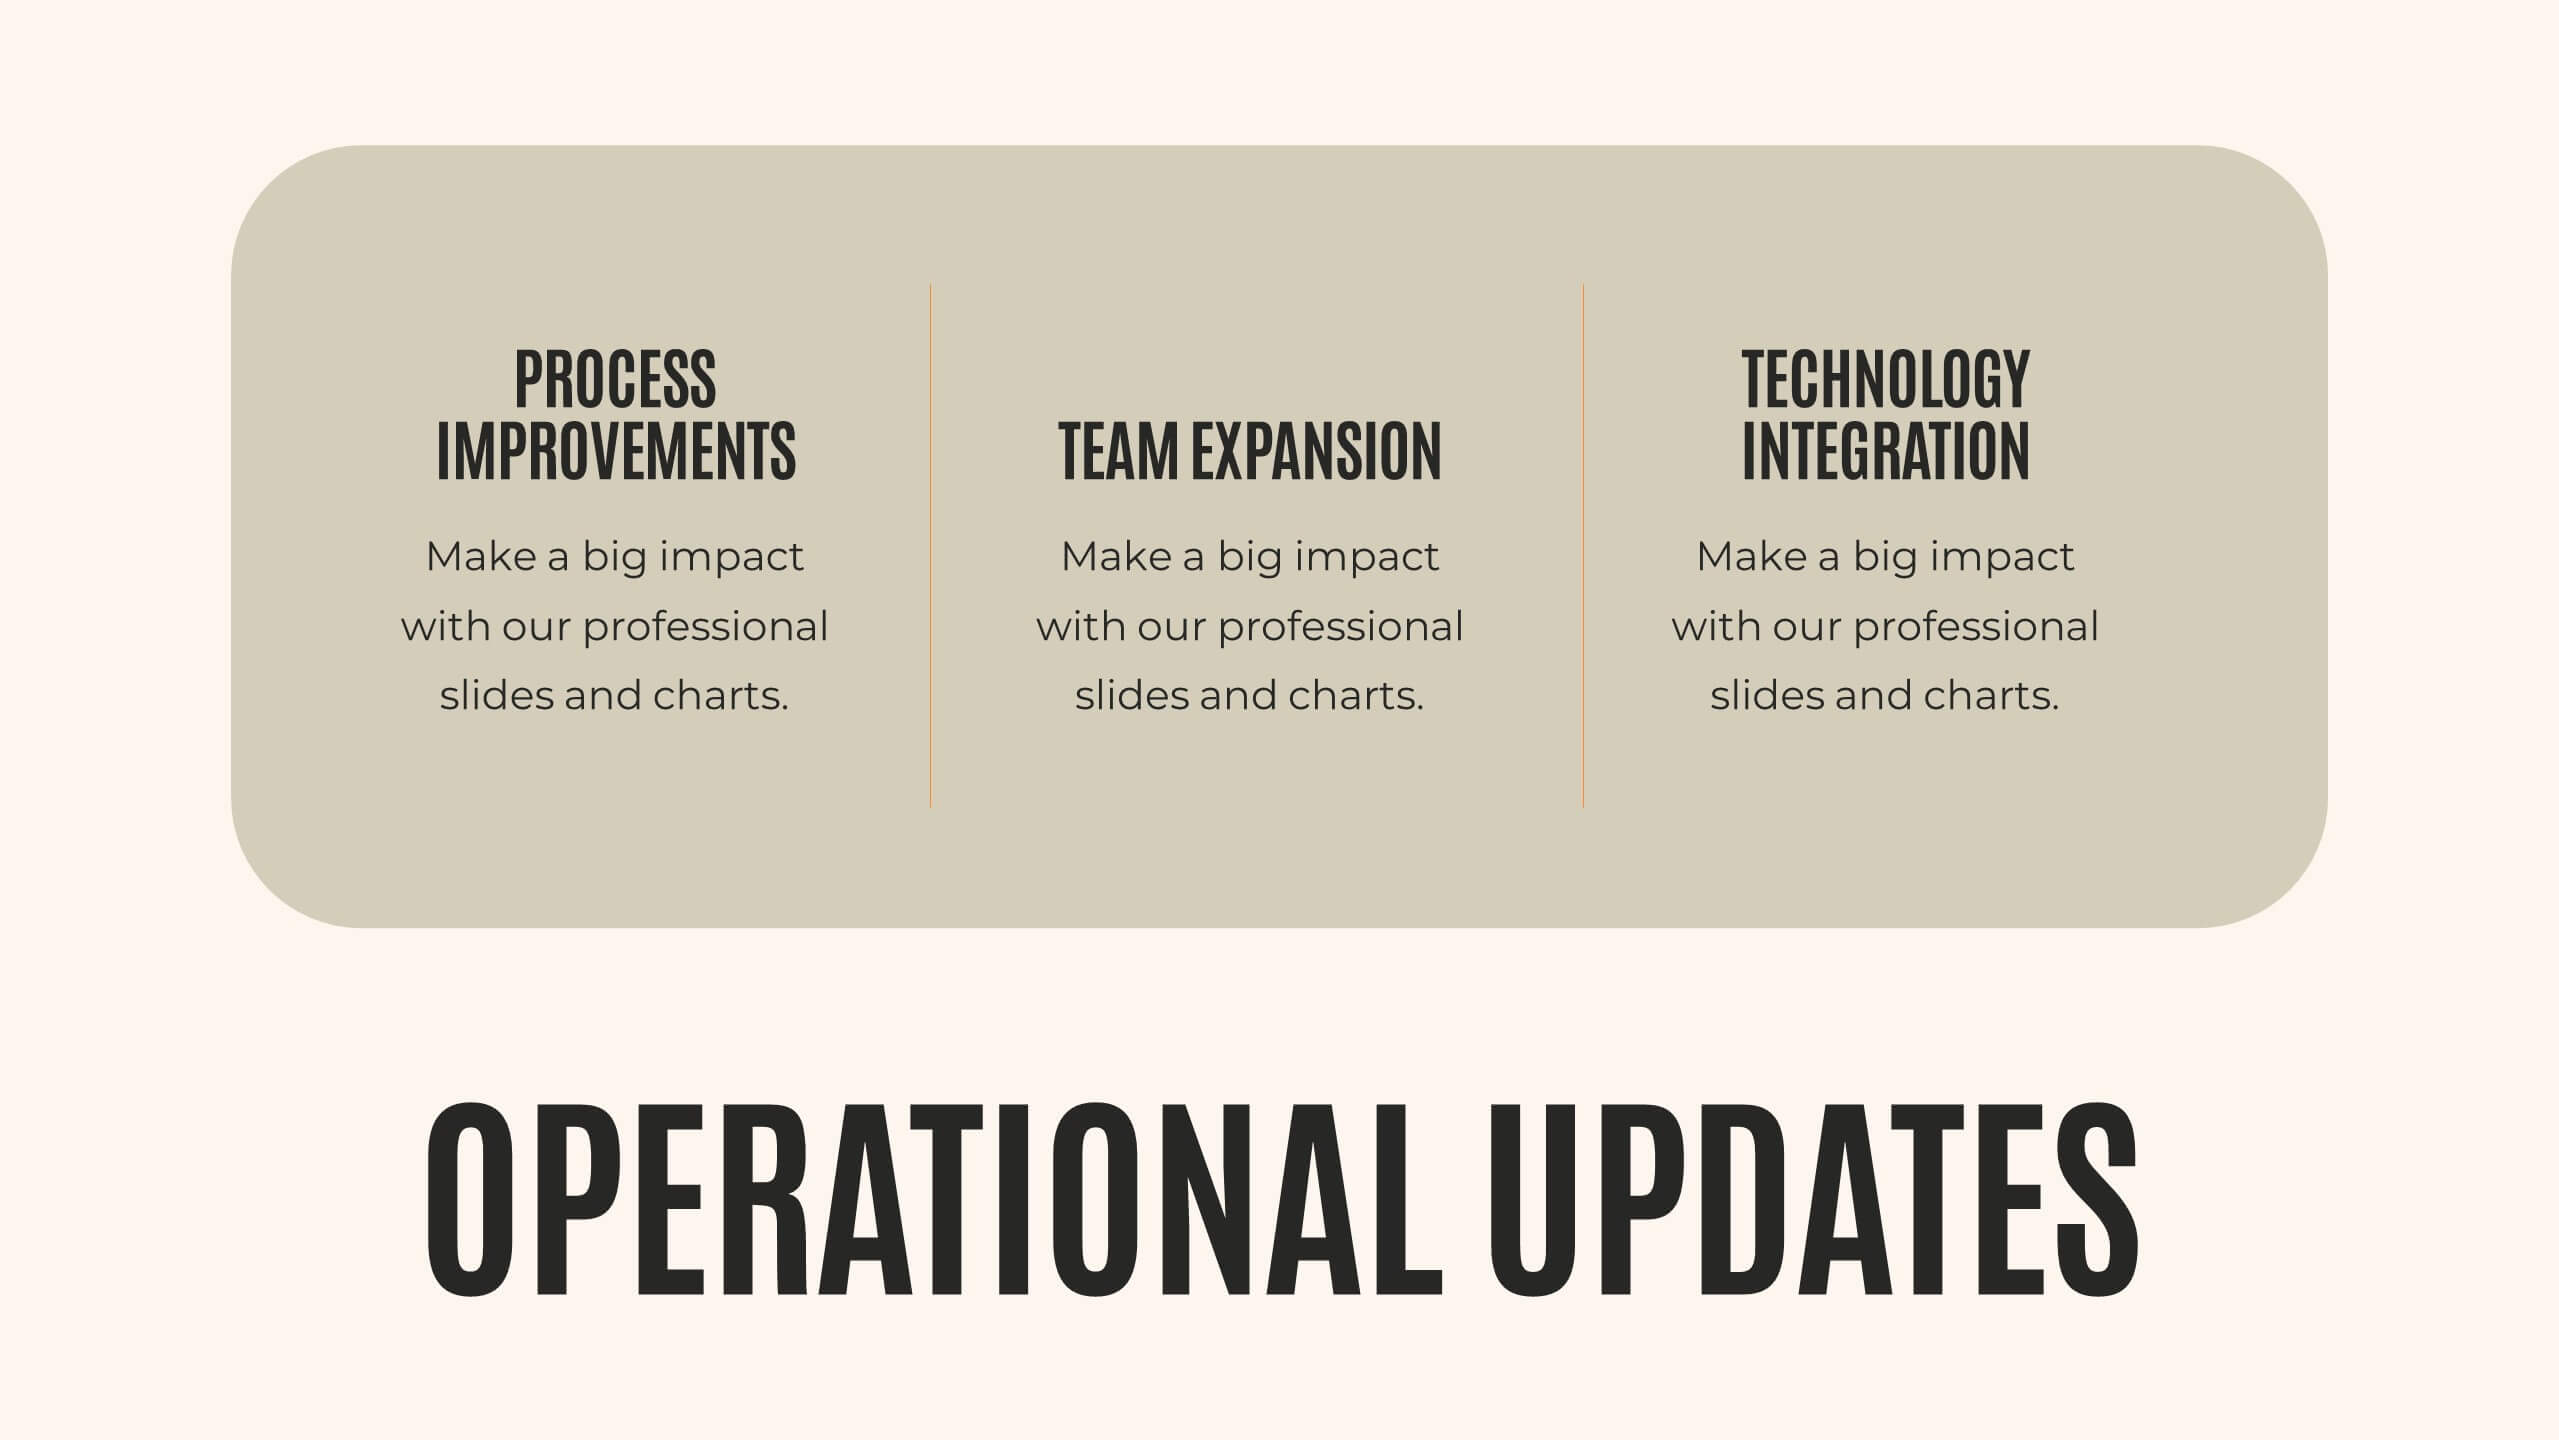
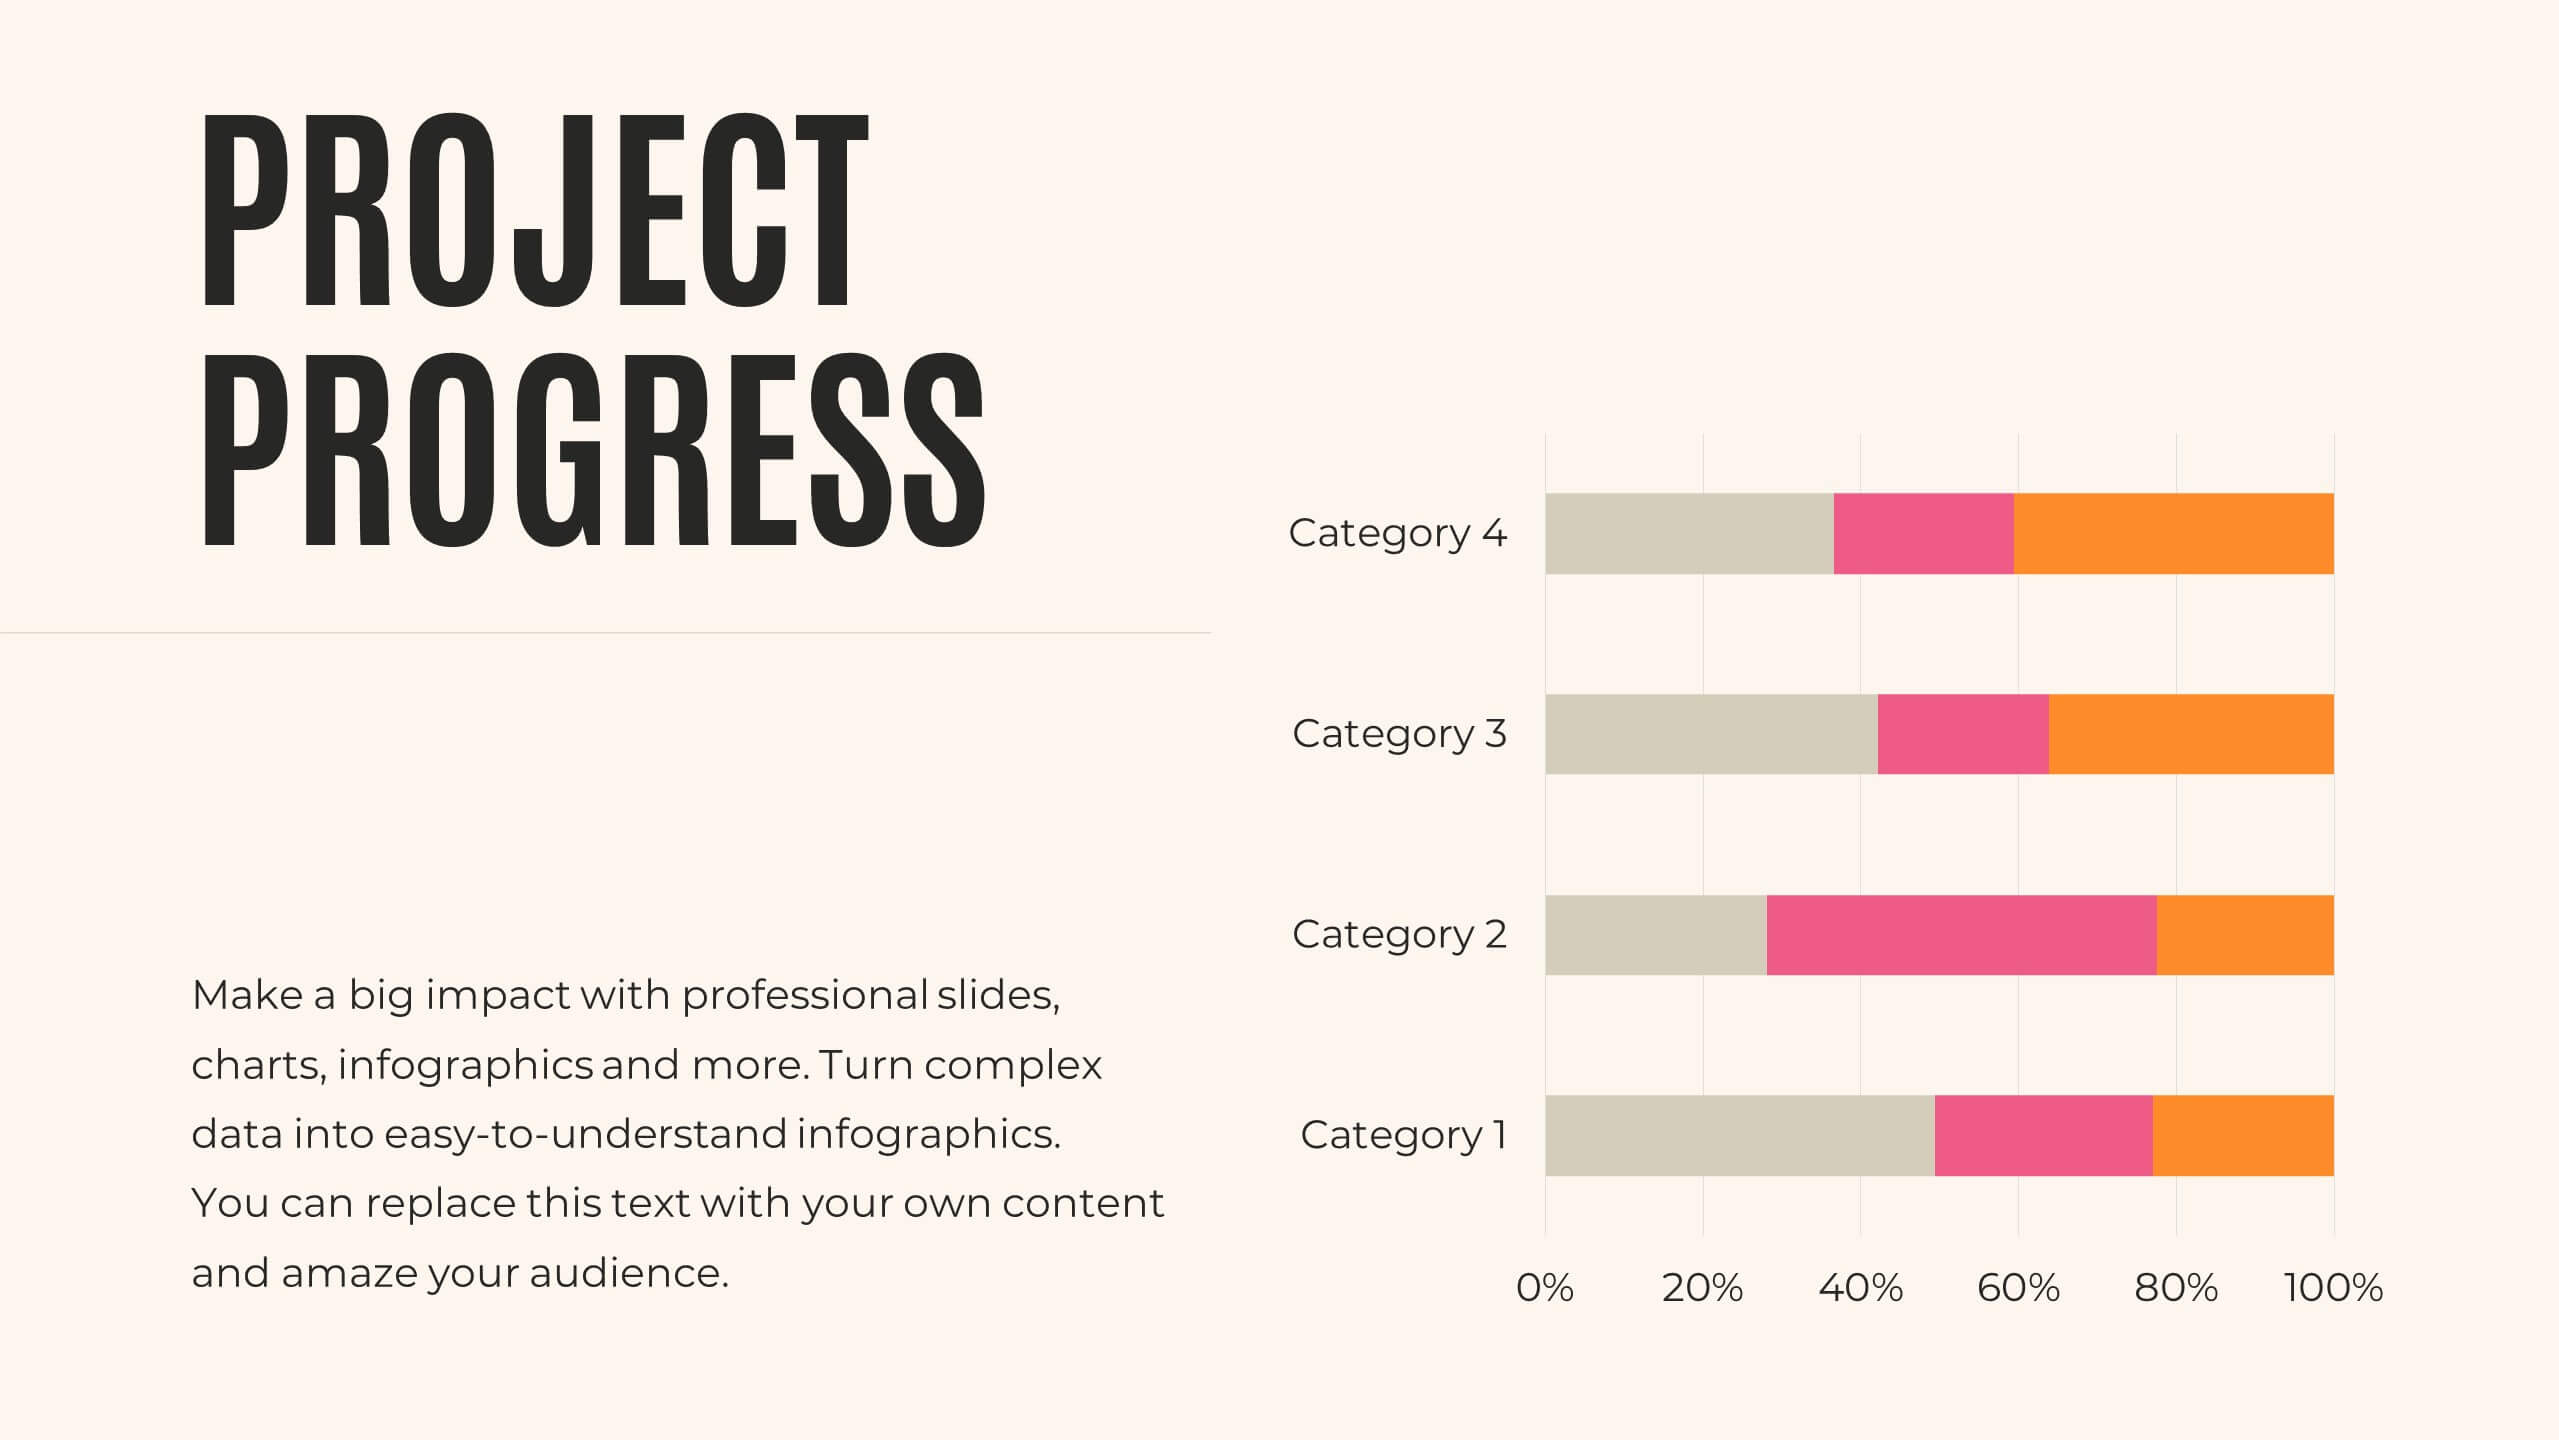
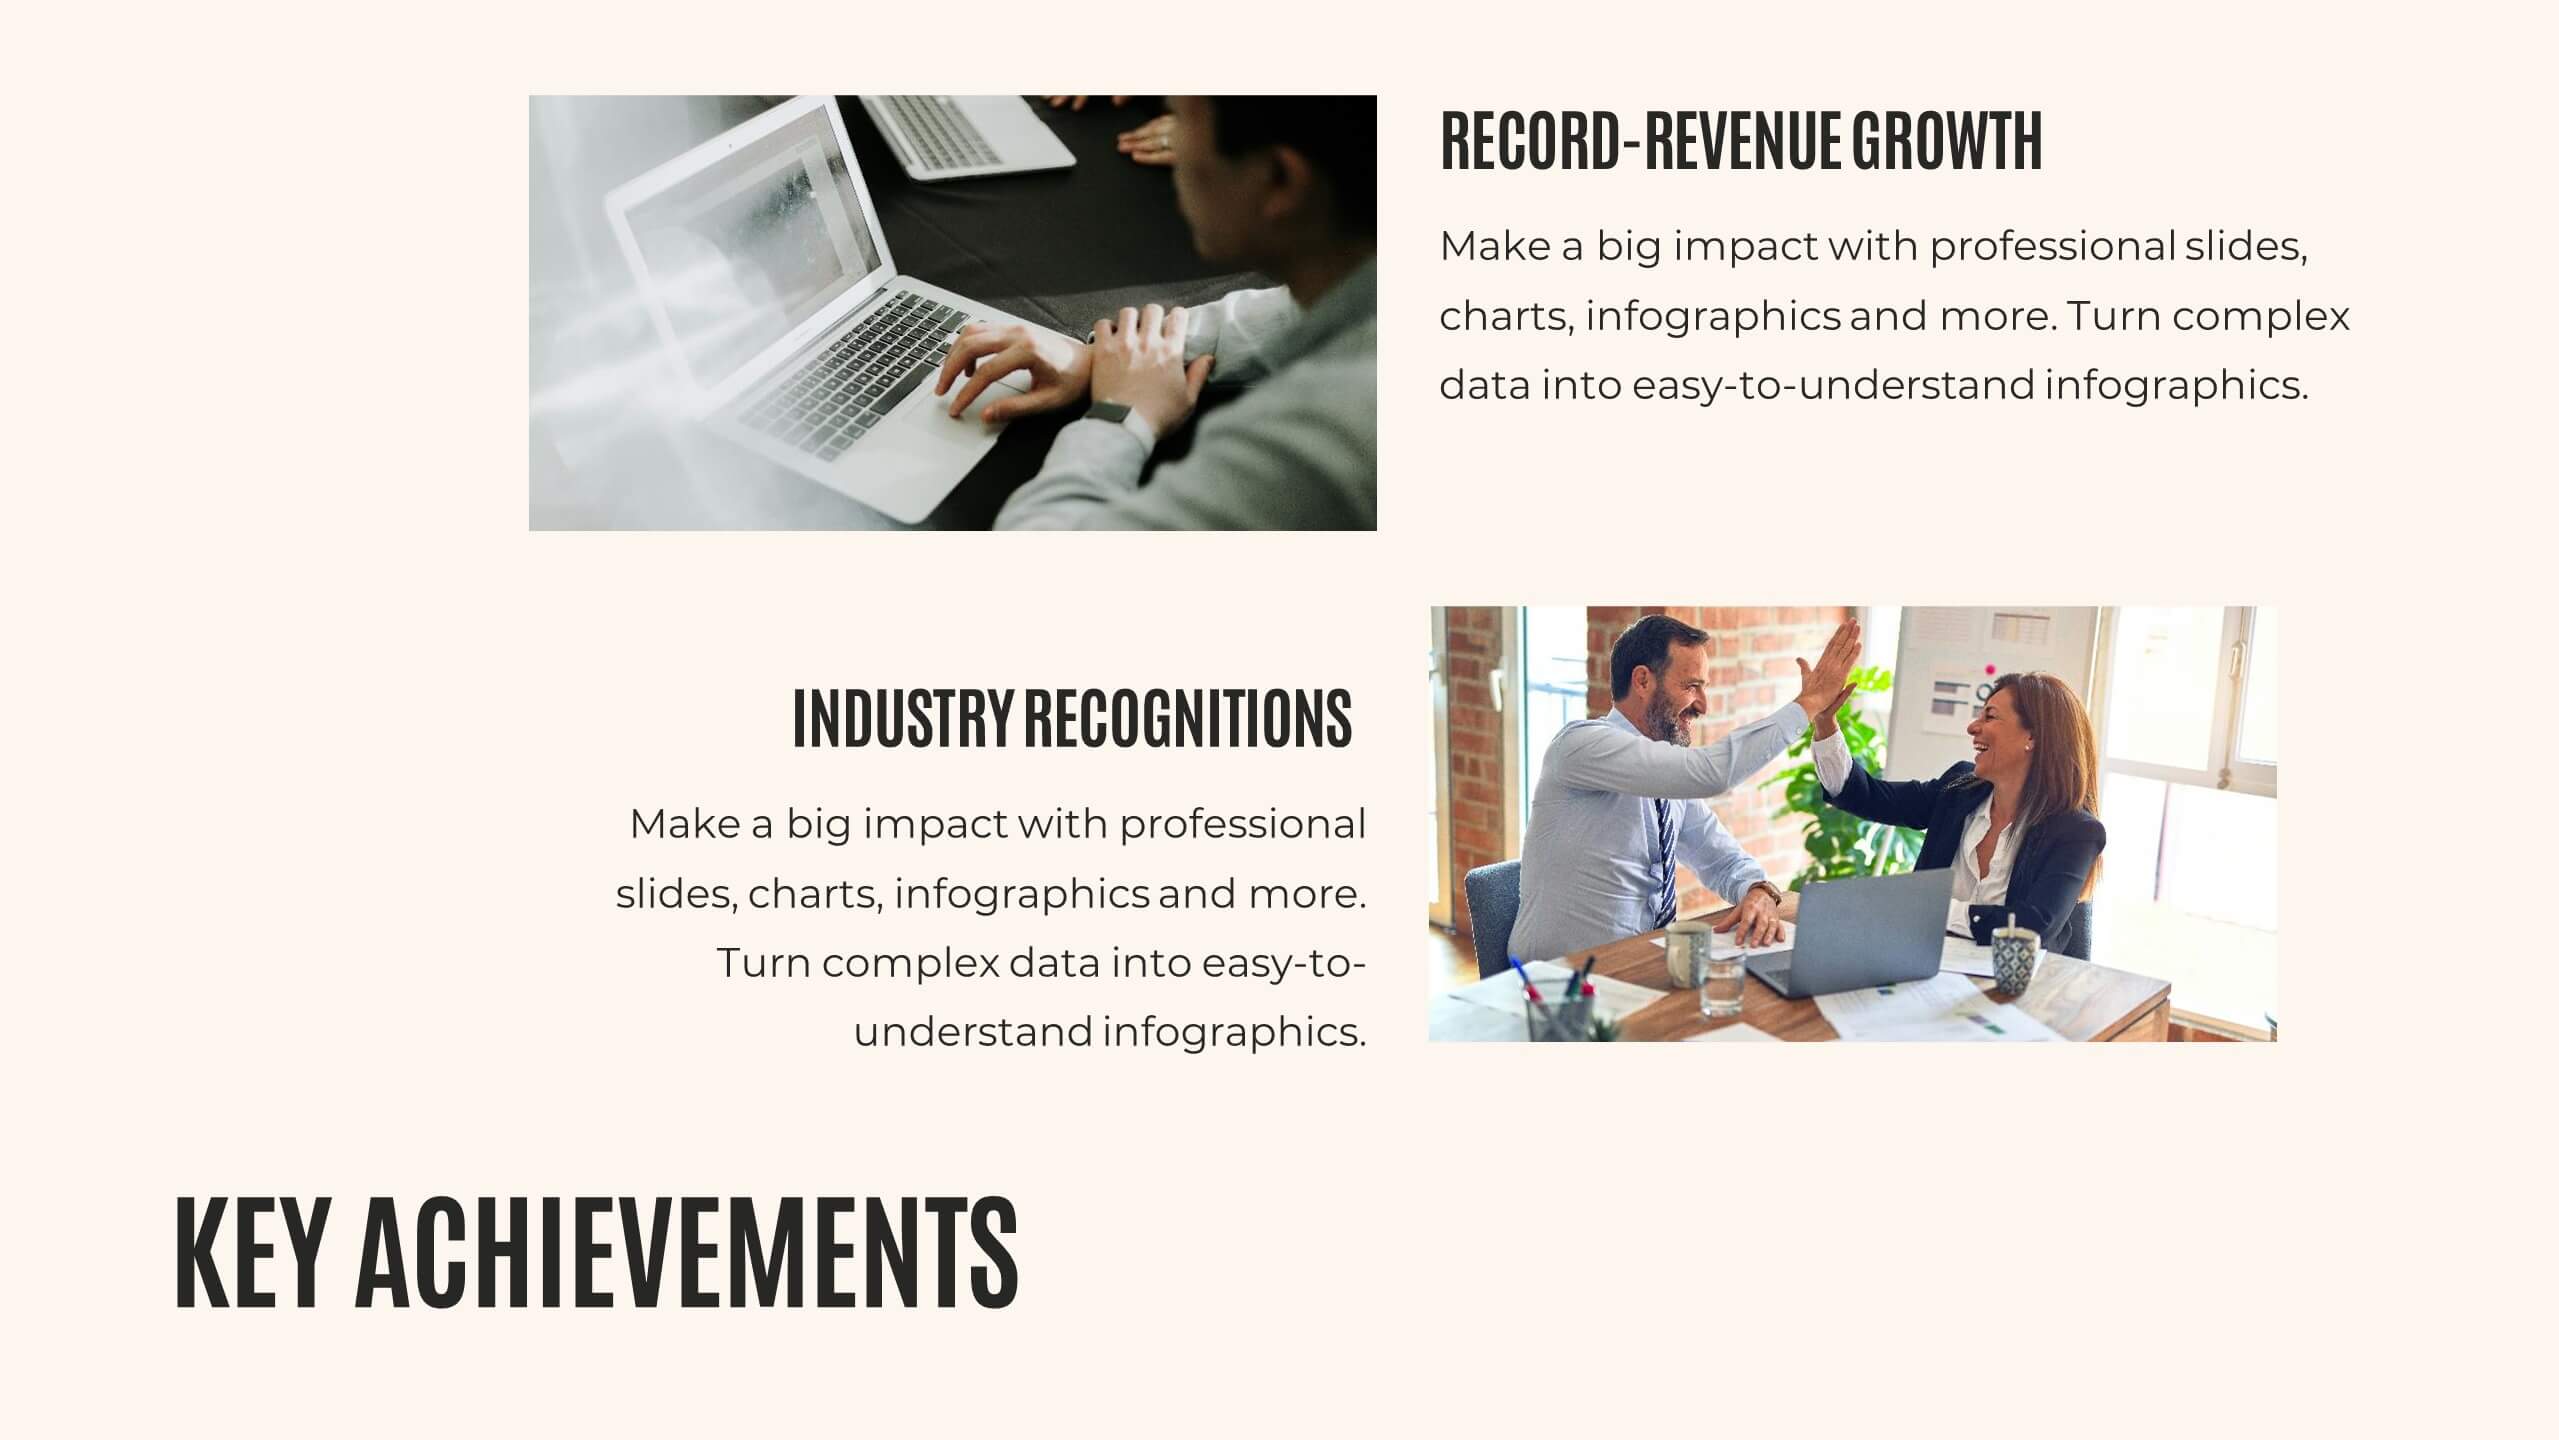
Journey Annual Report Presentation
Present your annual report with clarity and impact! This template covers agenda, key highlights, financial summary, sales performance, and project progress. Ideal for detailing achievements, insights, and future priorities. Compatible with PowerPoint, Keynote, and Google Slides, it ensures your data is visually compelling and easy to understand. Showcase your success effortlessly!


5 slides
Brain Chemistry Infographics
Brain chemistry refers to the complex interplay of chemicals, also known as neurotransmitters, that are responsible for transmitting signals within the brain. These infographic templates are designed to illustrate the intricate workings of brain chemistry. They aim to explain complex concepts in a clear and engaging way, making it suitable for educational settings, psychology courses, neuroscience presentations, or any context where understanding brain chemistry is essential. These templates set the foundation for exploring various aspects of brain chemistry. Colorful illustrations and icons help visualize the neurotransmitters and their impact.


20 slides
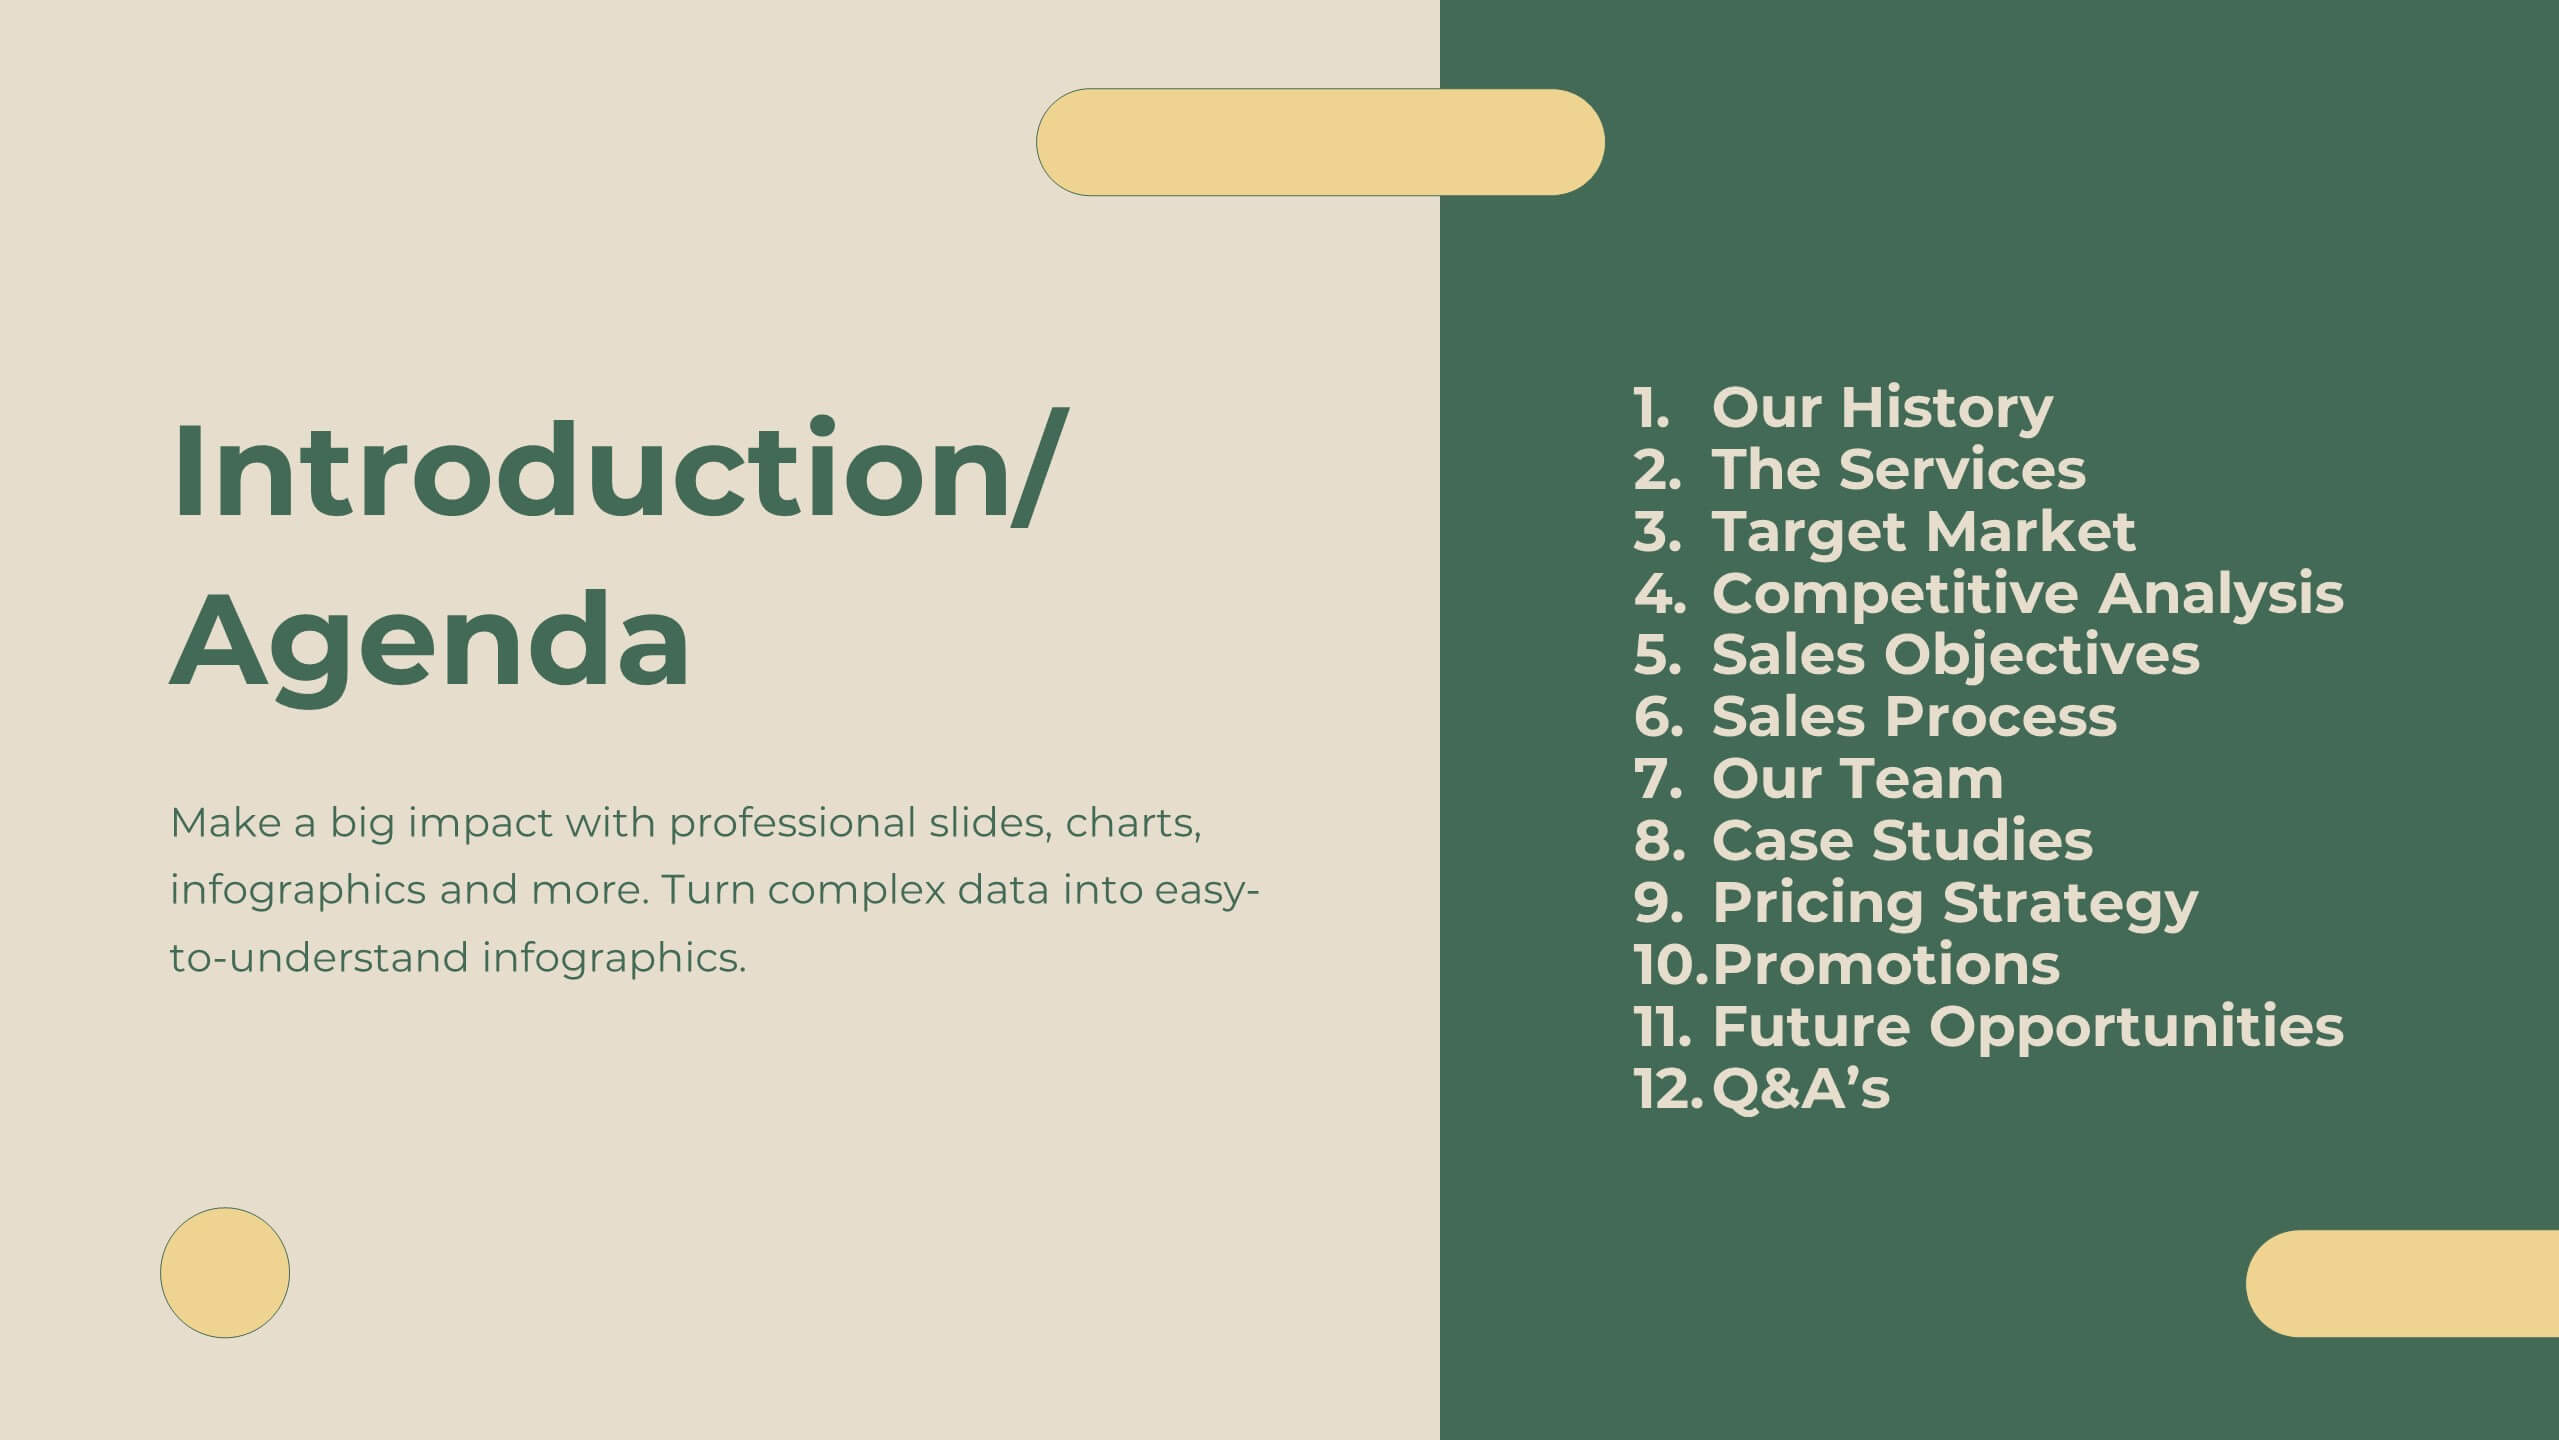
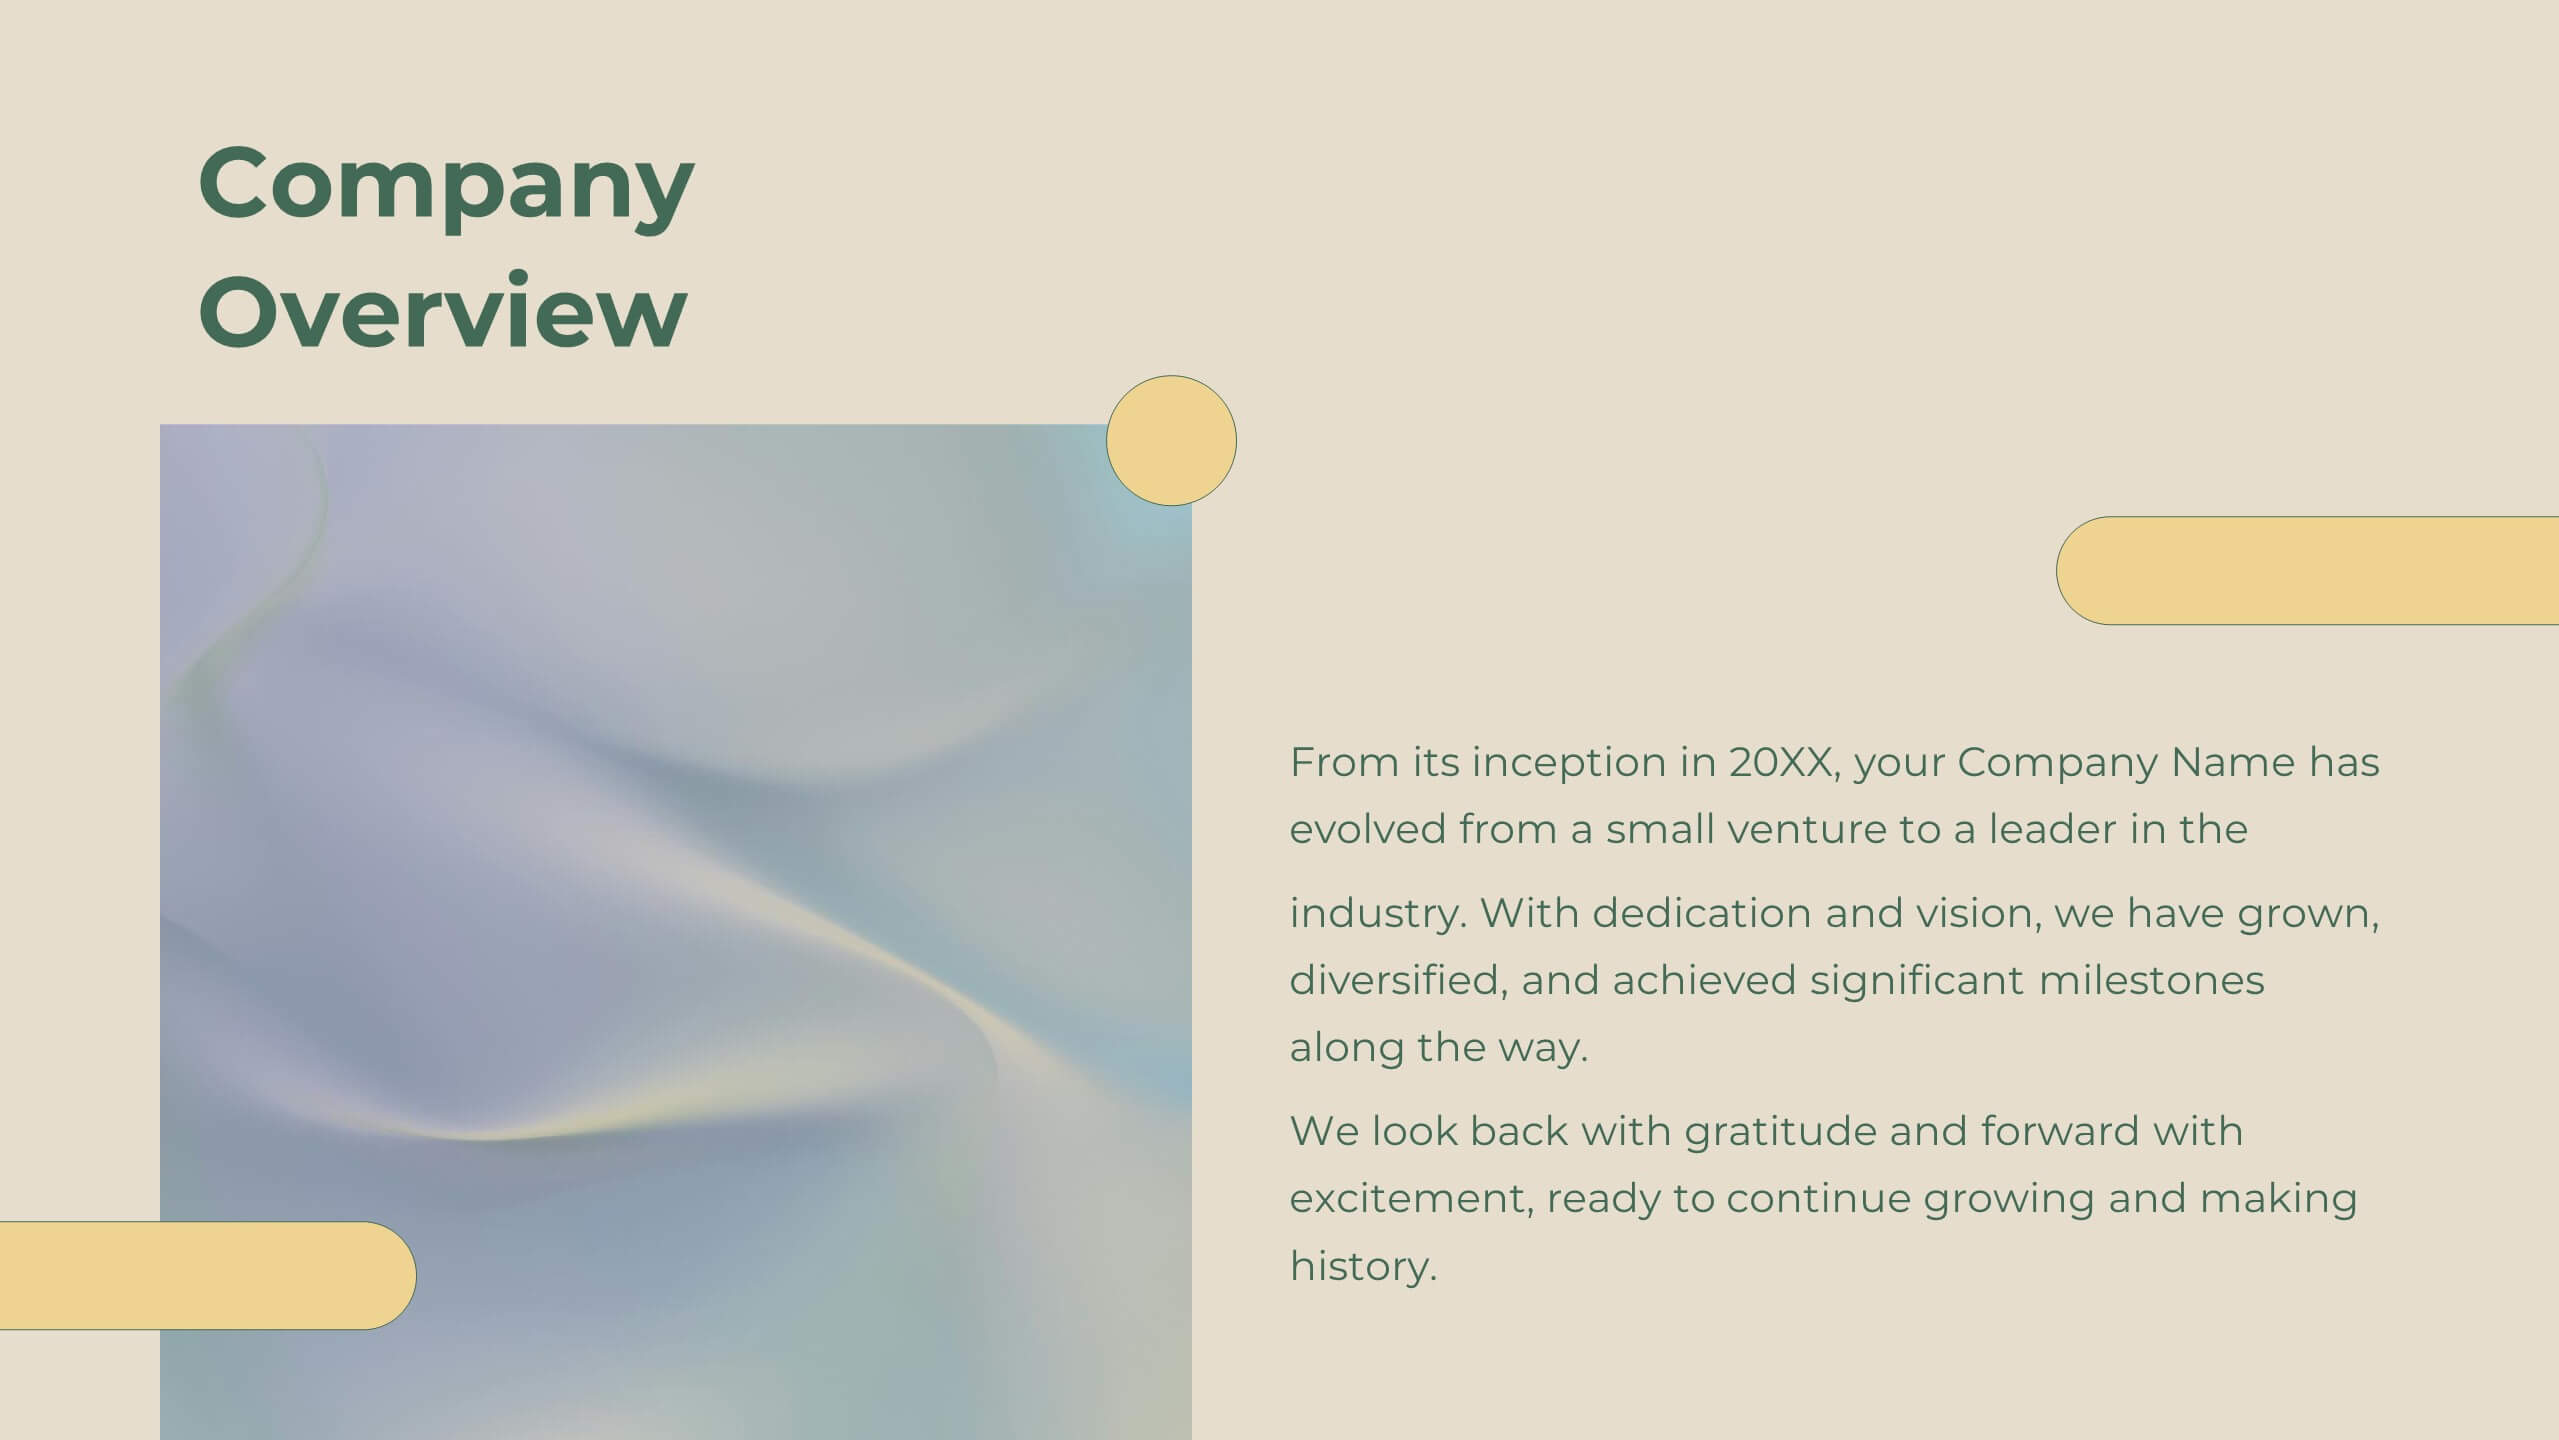
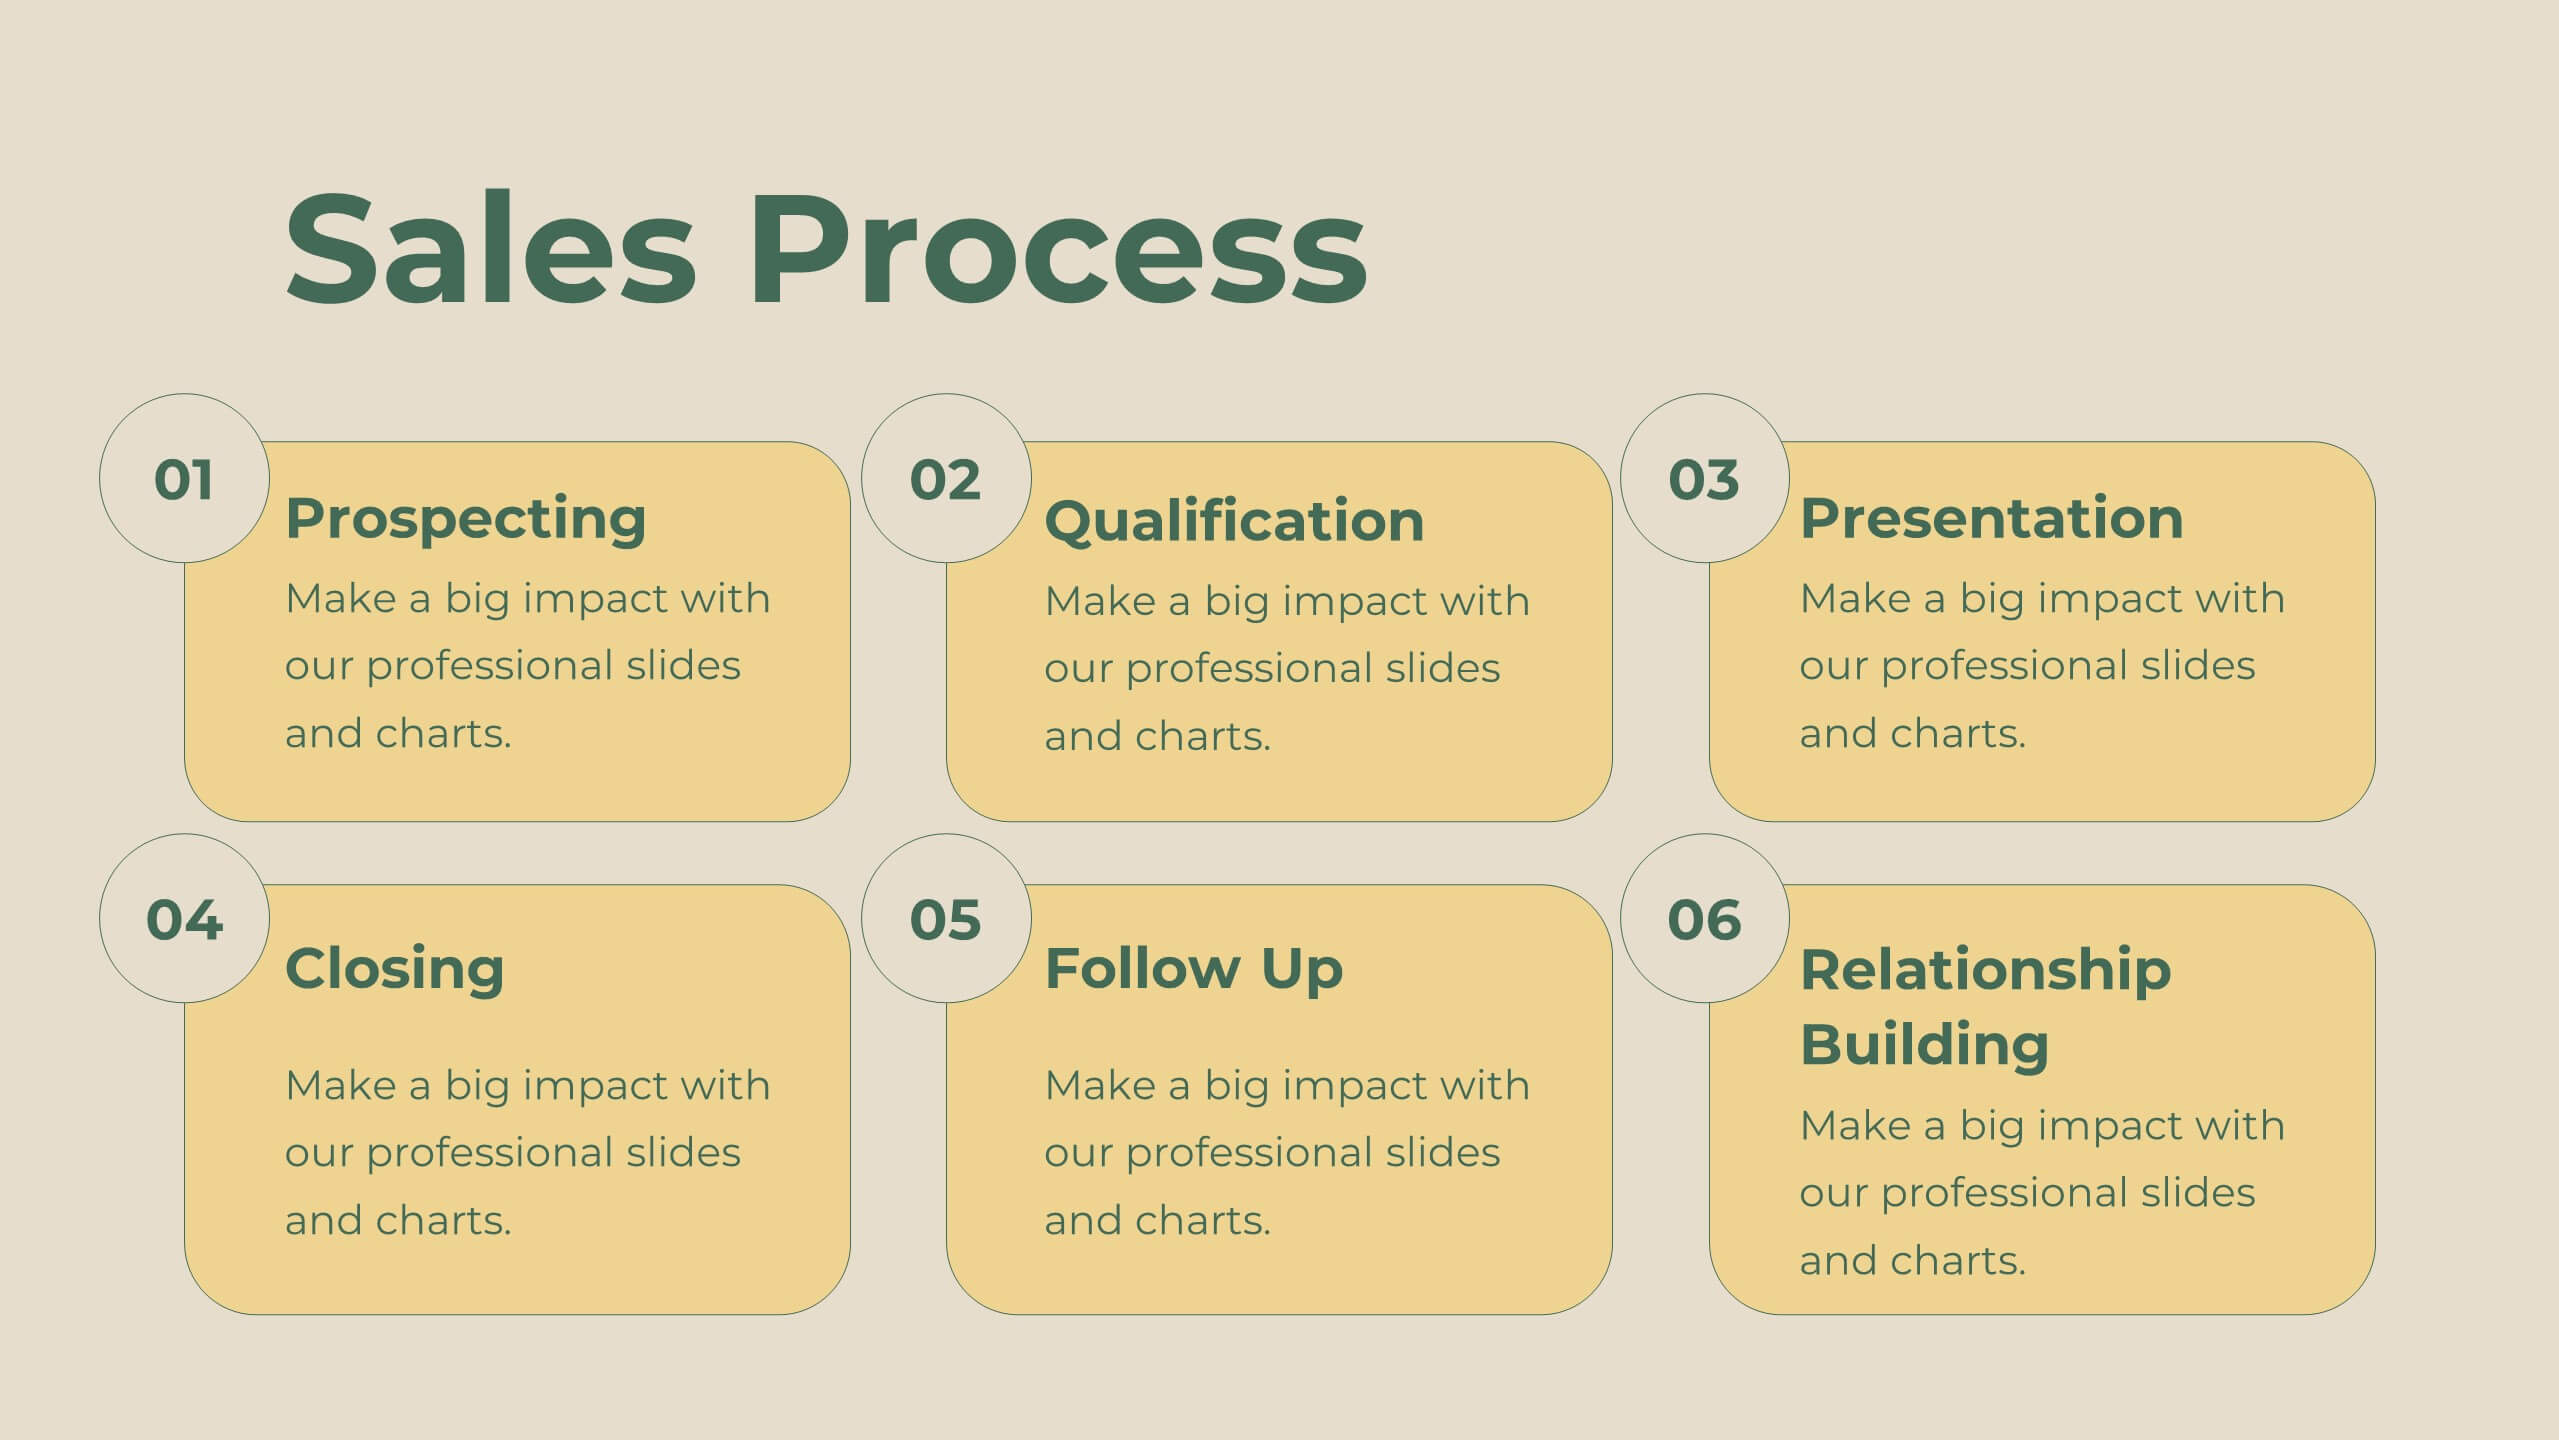
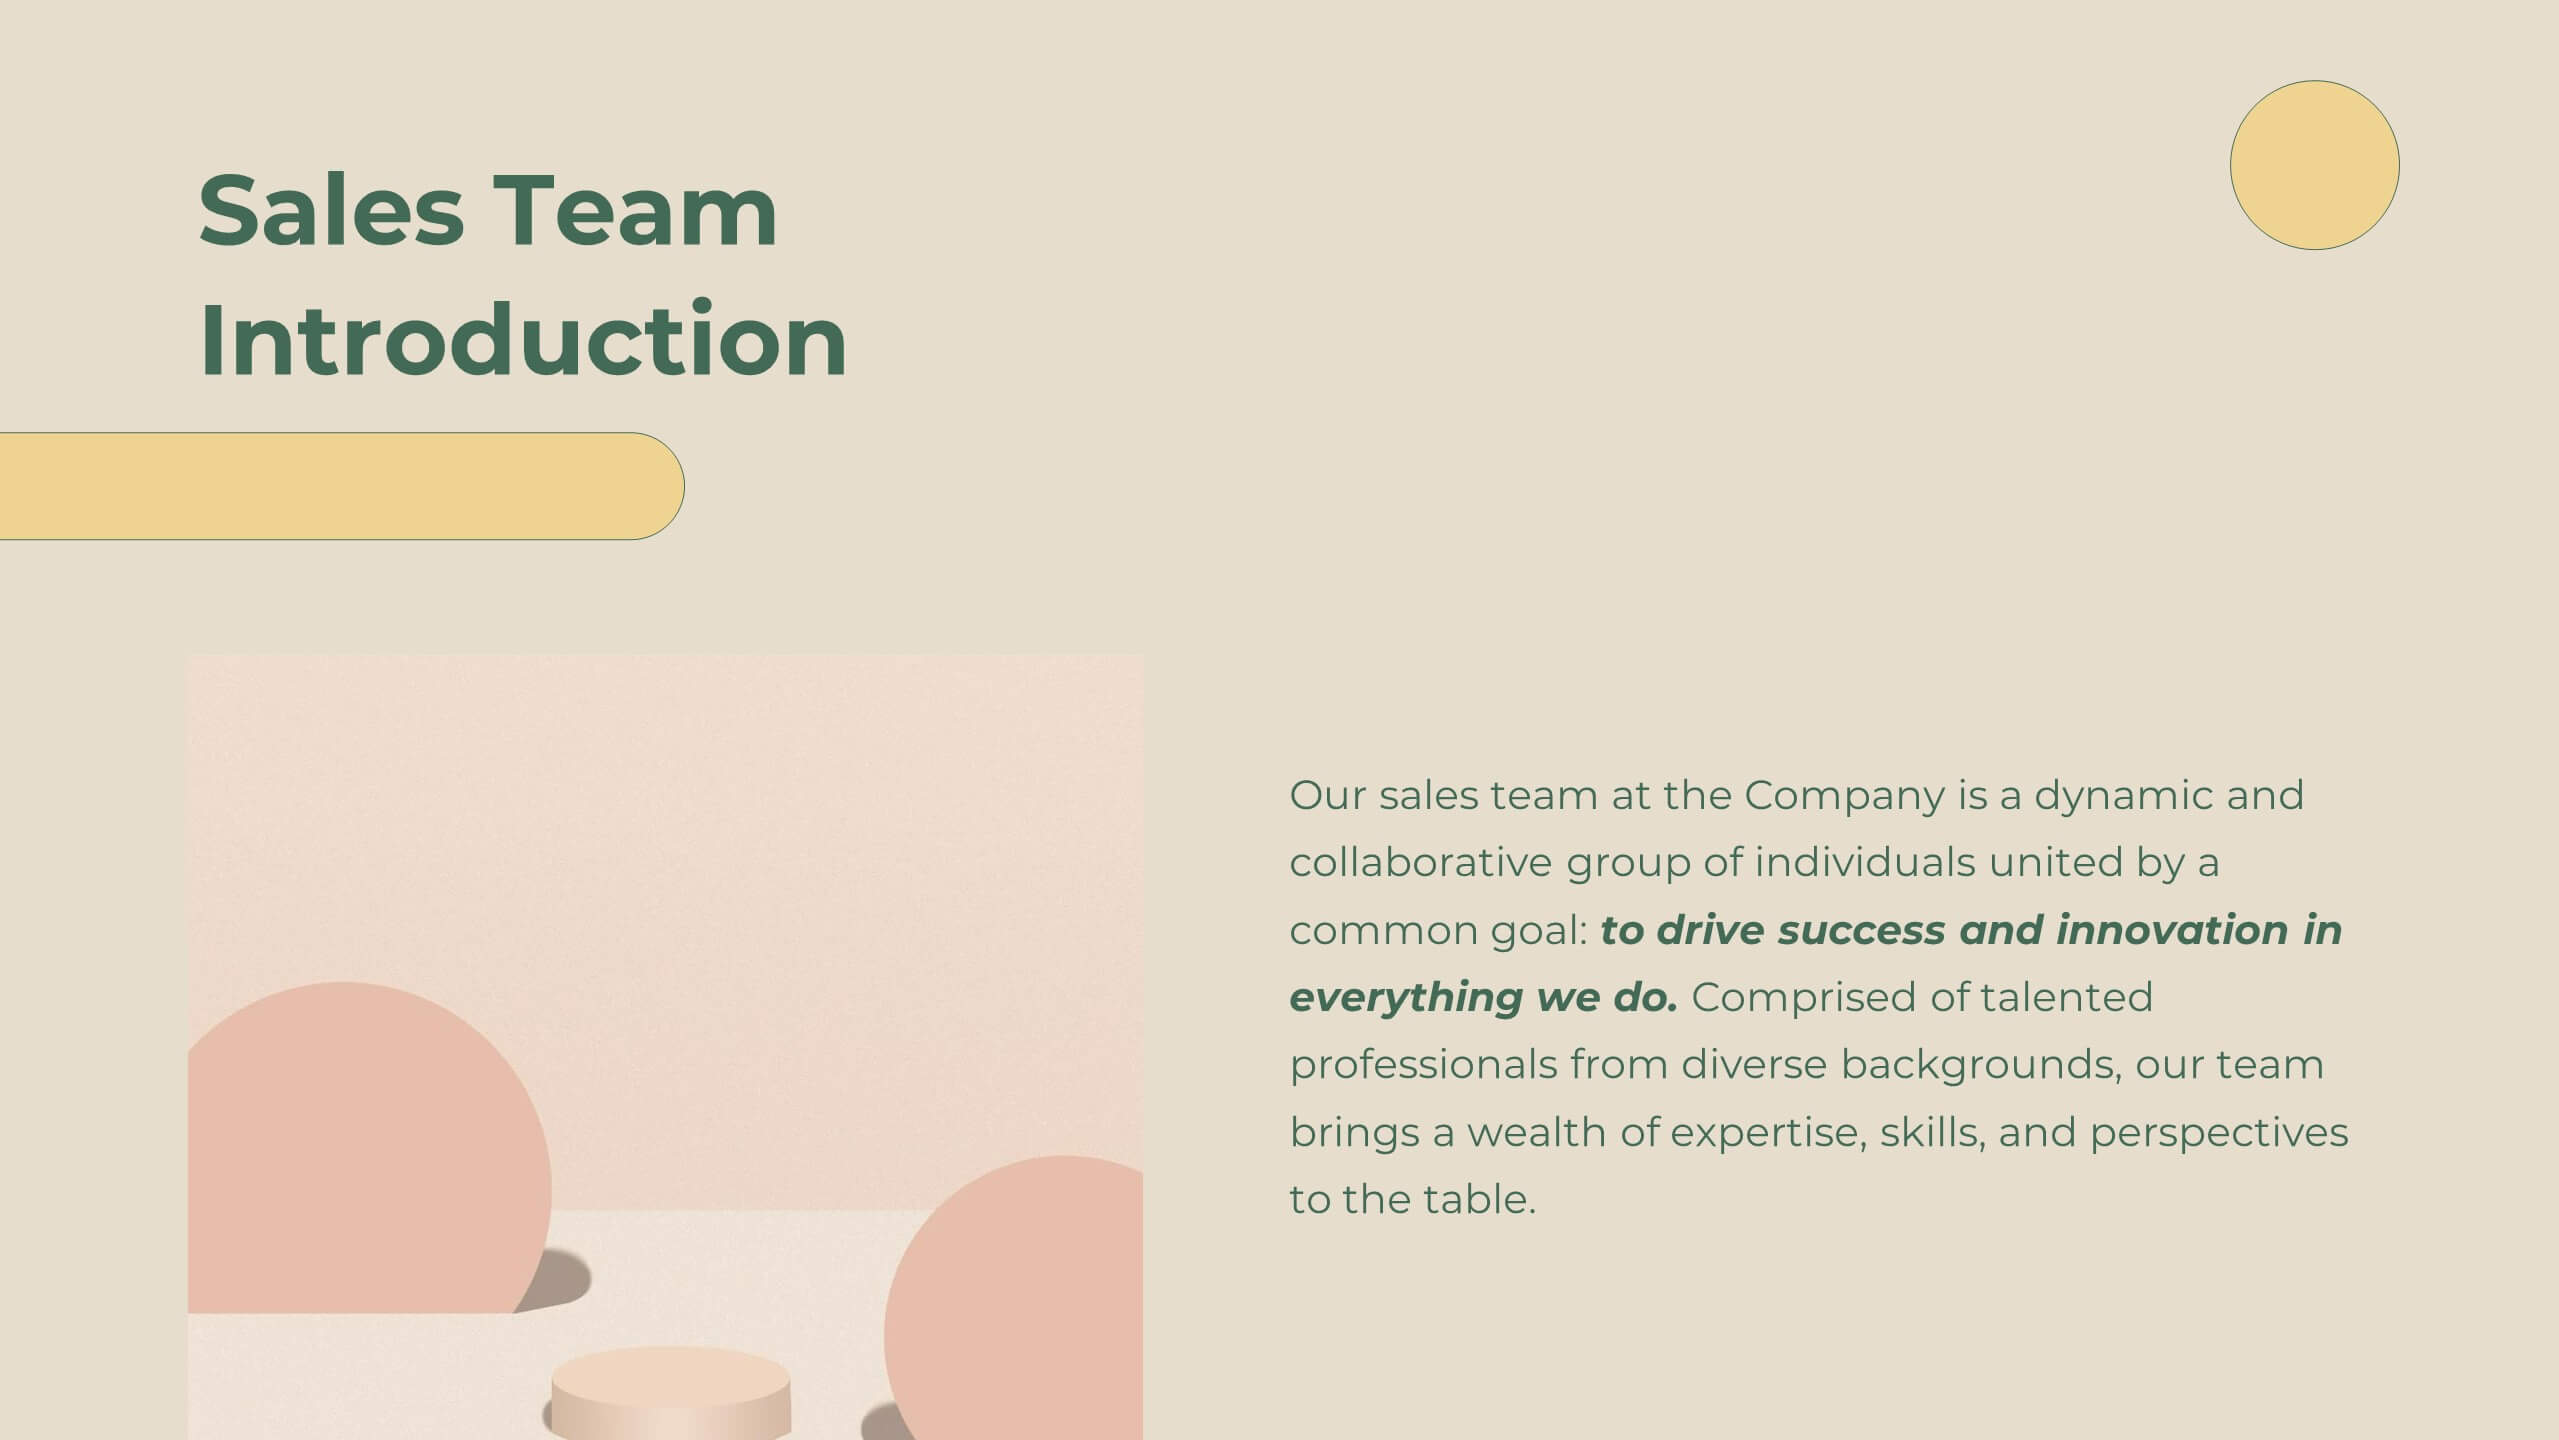
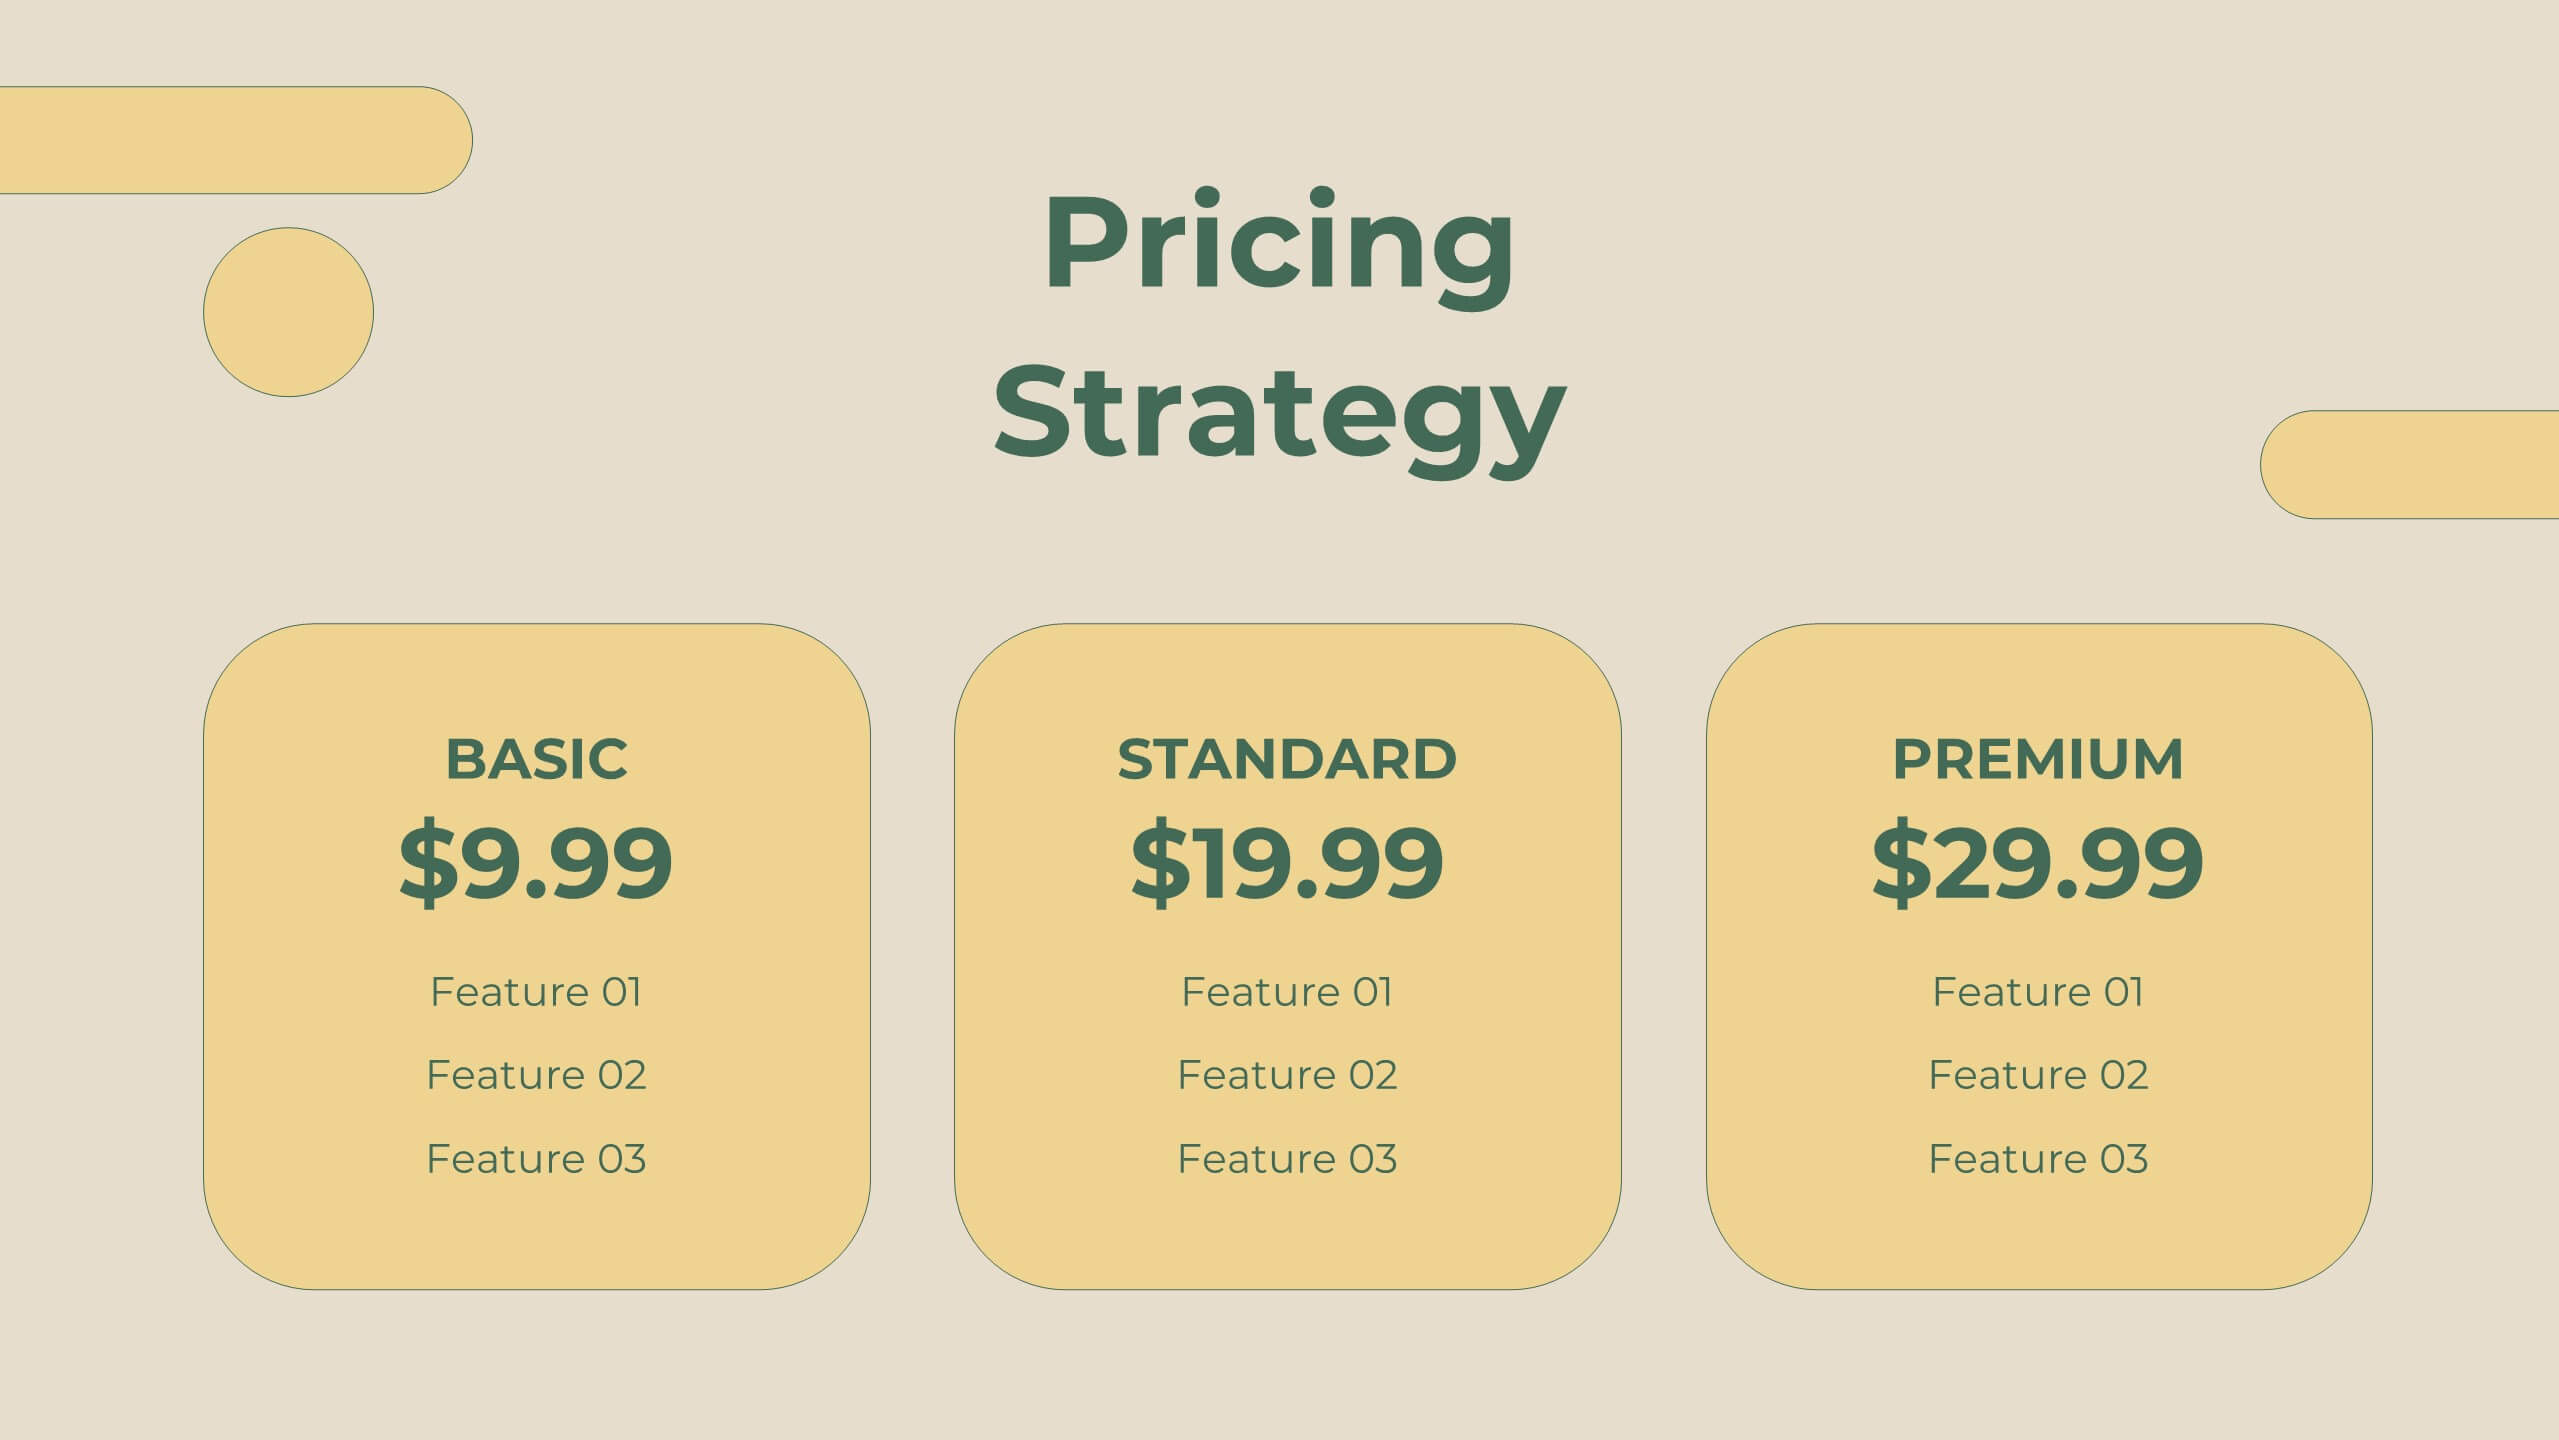
Legacy Sales Strategy Presentation
Boost your sales presentations with this modern template! It features sections for objectives, process, team introduction, customer testimonials, and performance metrics. Ideal for outlining strategies, opportunities, and pricing. Engage your audience with a professional, clean design. Compatible with PowerPoint, Keynote, and Google Slides for seamless integration. Make your sales strategy stand out!


4 slides
Future-Focused Business Vision Planning Presentation
Plan ahead with clarity using the Future-Focused Business Vision Planning infographic. This 4-step layout helps you outline long-term goals, strategic milestones, and action points in a visually structured format. Perfect for business roadmaps, planning decks, and executive briefings. Fully editable in Canva, PowerPoint, and Google Slides.


7 slides
Value Chain Business Infographic
The value chain is a concept used in business management to describe the full range of activities that businesses go through to bring a product or service from conception to delivery to customers. This infographic template is designed to showcase the various activities and processes that add value to your product or service, enlightening your audience about the holistic journey from start to finish. Compatible with Powerpoint, Keynote, and Google Slides. Present a visual representation of a value chain analysis, emphasizing the importance of evaluating each activity's contribution to the overall value.


3 slides
Persona Mapping for Target Audience Presentation
Get clear on who you're speaking to with this visual persona mapping slide. Ideal for marketing plans, customer research, or segmentation strategies, this layout helps you define and compare target audience types with clean icons and text space. Fully editable and works with PowerPoint, Keynote, and Google Slides.


12 slides
Project Completion Checklist
Streamline project tracking with this clean and functional project completion checklist slide. Ideal for task management and progress reporting, it includes editable sections for task descriptions, process stages, current status, and additional notes. With toggles like “In Process,” “On Hold,” “Complete,” and “Overdue,” this layout is perfect for keeping teams aligned. Fully editable in PowerPoint, Keynote, and Google Slides.
4 slides
Directional Arrow Diagram Slide Presentation
Make your message stand out with a bold visual that points your audience in the right direction. This presentation uses clear directional arrows to highlight steps, options, or key decisions in a way that’s easy to follow and visually compelling. Fully editable and compatible with PowerPoint, Keynote, and Google Slides.


6 slides
Supply Chain Management Strategy Presentation
Enhance your logistics planning with the Supply Chain Management Strategy template. This visually structured design simplifies key supply chain components, from procurement to distribution, making it ideal for analysts and operations teams. Fully customizable and compatible with PowerPoint, Keynote, and Google Slides for a seamless and professional presentation experience.


7 slides
Data-Driven Market Segmentation Presentation
Visualize customer segments with clarity using the Data-Driven Market Segmentation Presentation. This template features a structured, interconnected diagram with six customizable data points, ideal for audience targeting, persona mapping, or campaign planning. Clean, modern, and easy to edit in PowerPoint, Keynote, or Google Slides.


10 slides
Hierarchy Tree Structure Slide Presentation
Bring your ideas to life with a dynamic visual flow that connects every stage of your business strategy. Perfect for mapping growth, processes, or team structures, this clean and modern layout keeps your data clear and engaging. Fully compatible with PowerPoint, Keynote, and Google Slides for effortless customization.


10 slides
Corporate Framework and Structure Presentation
Clearly define your corporate framework and structure with this professional infographic template. Ideal for executives, team leaders, and project managers, this slide visually organizes organizational hierarchy, roles, and key responsibilities in a clean and structured layout. Fully editable in PowerPoint, Keynote, and Google Slides, allowing seamless customization for your company's needs.