


Features
- 3 Unique slides
- Fully editable and easy to edit in Microsoft Powerpoint, Keynote and Google Slides
- 16:9 widescreen layout
- Clean and professional designs
- Export to JPG, PDF or send by email


Do you have any questions?
Recommend


21 slides
Juno UX Case Study Presentation
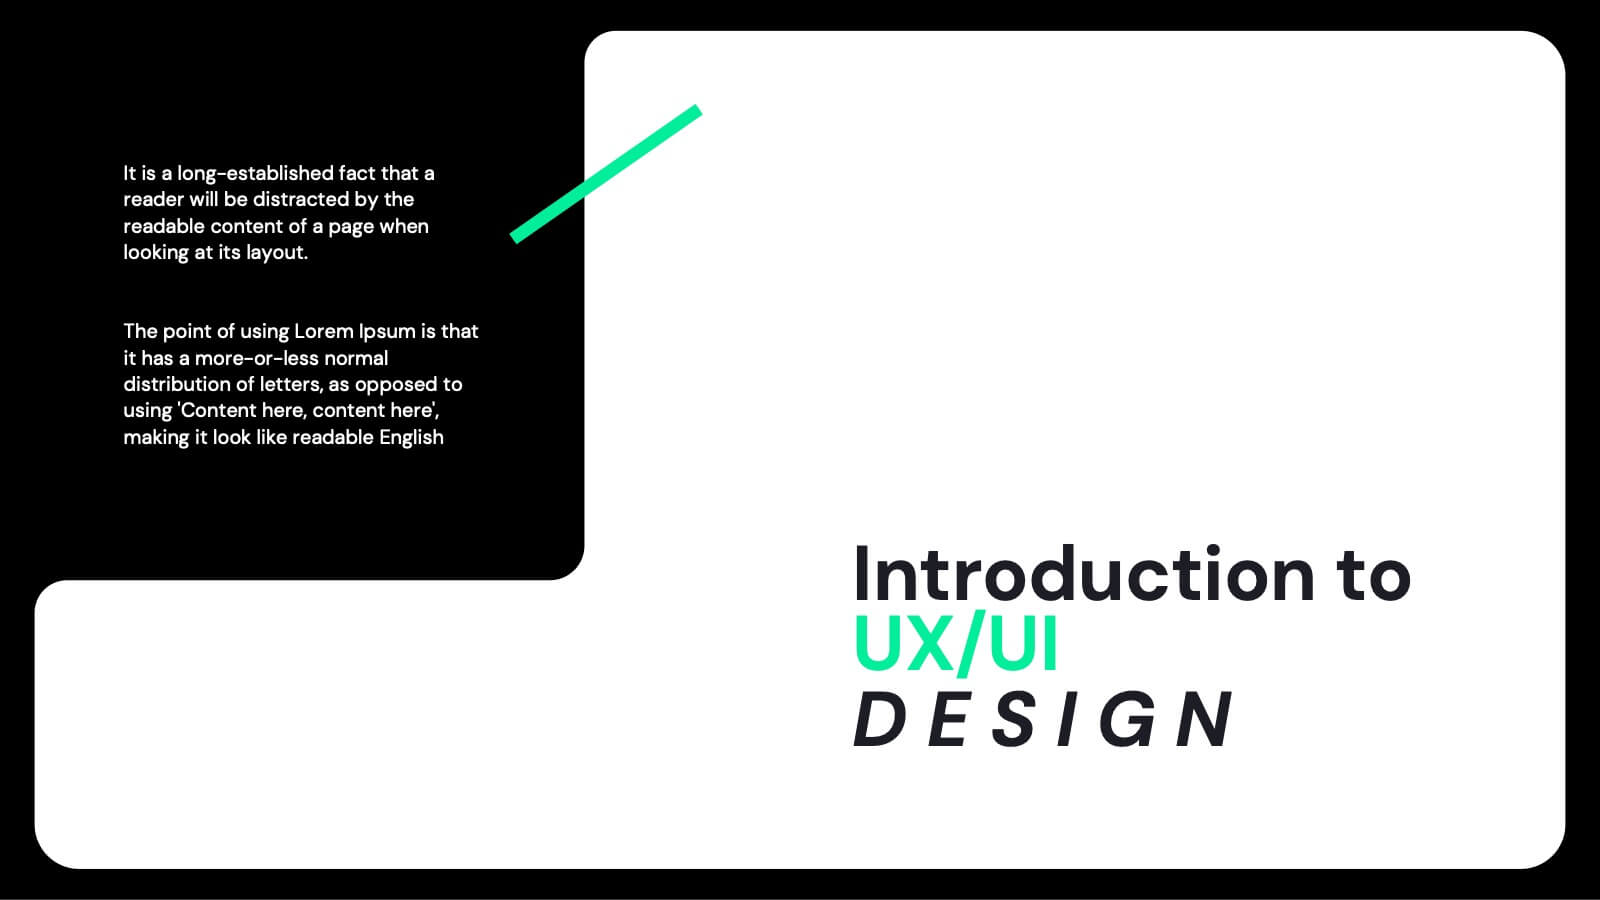
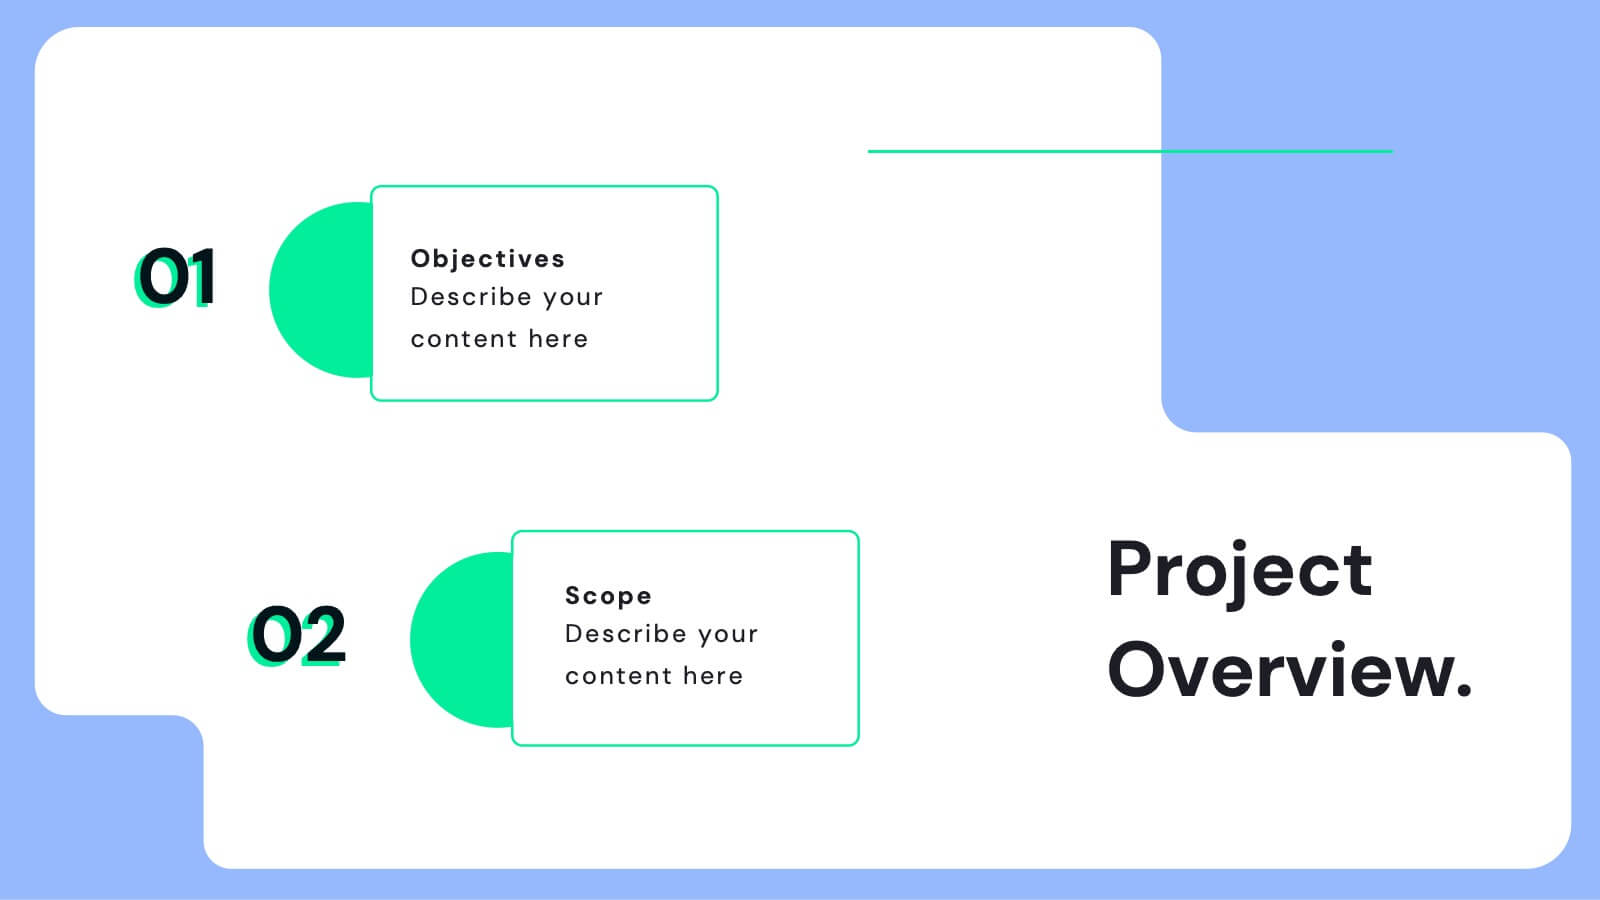
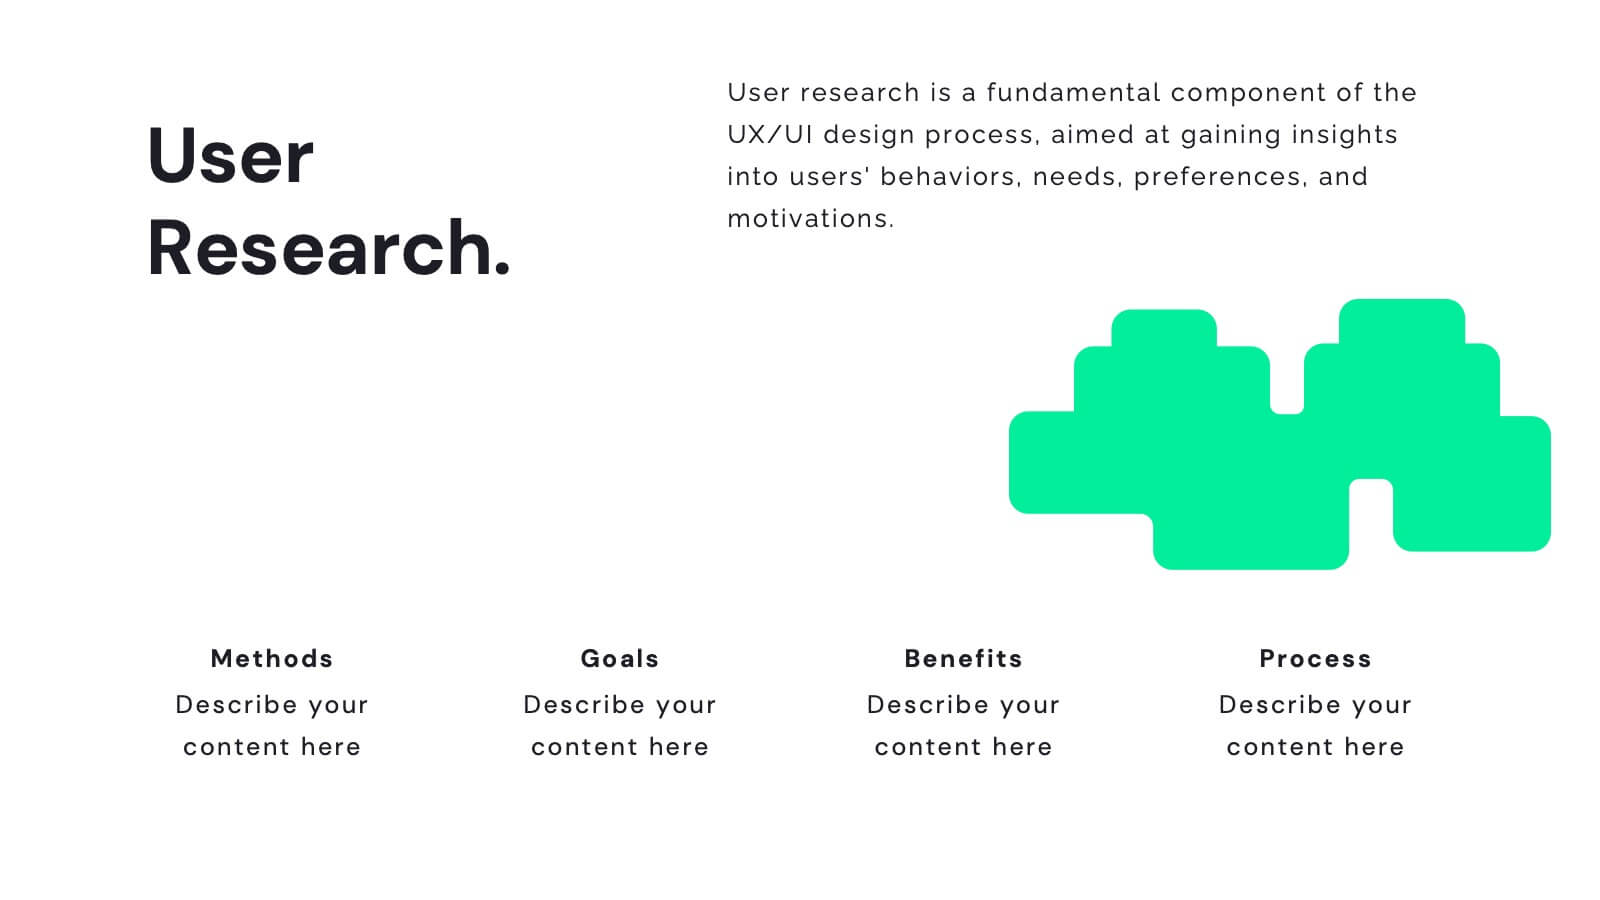
Enhance your UX presentations with this sleek, user-friendly template designed for showcasing detailed case studies and user research. With a modern layout and clear sections for user journey mapping, prototyping, and usability guidelines, this template ensures a professional and engaging presentation. Compatible with PowerPoint, Keynote, and Google Slides, it's perfect for any platform.


6 slides
Hospital Management System Presentation
Bring structure and efficiency to your healthcare operations with this professional presentation. Designed to simplify complex hospital workflows, it helps visualize patient management, service coordination, and system processes with clarity. Ideal for administrators and consultants, it’s fully editable and compatible with PowerPoint, Keynote, and Google Slides for seamless customization.


20 slides
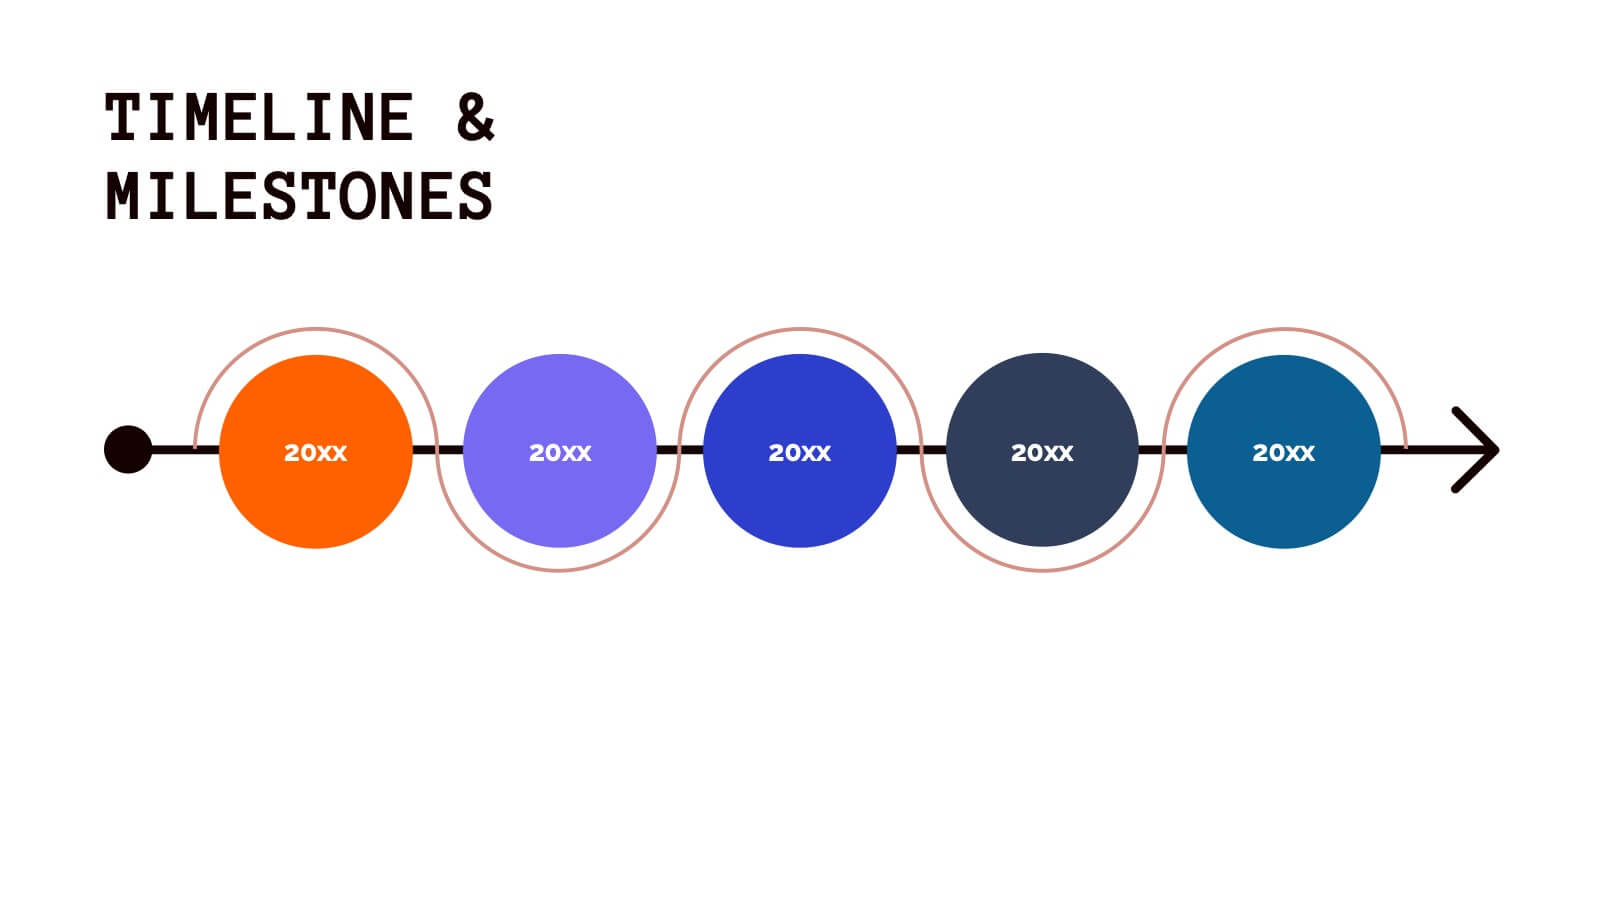
Visionix Project Management Plan Presentation
Streamline your project planning with this clean and modern presentation template. Covering key aspects such as objectives, timeline, budget breakdown, and risk management, it helps you organize and communicate your project strategy effectively. Ideal for business teams and project managers. Compatible with PowerPoint, Keynote, and Google Slides for easy customization.


21 slides
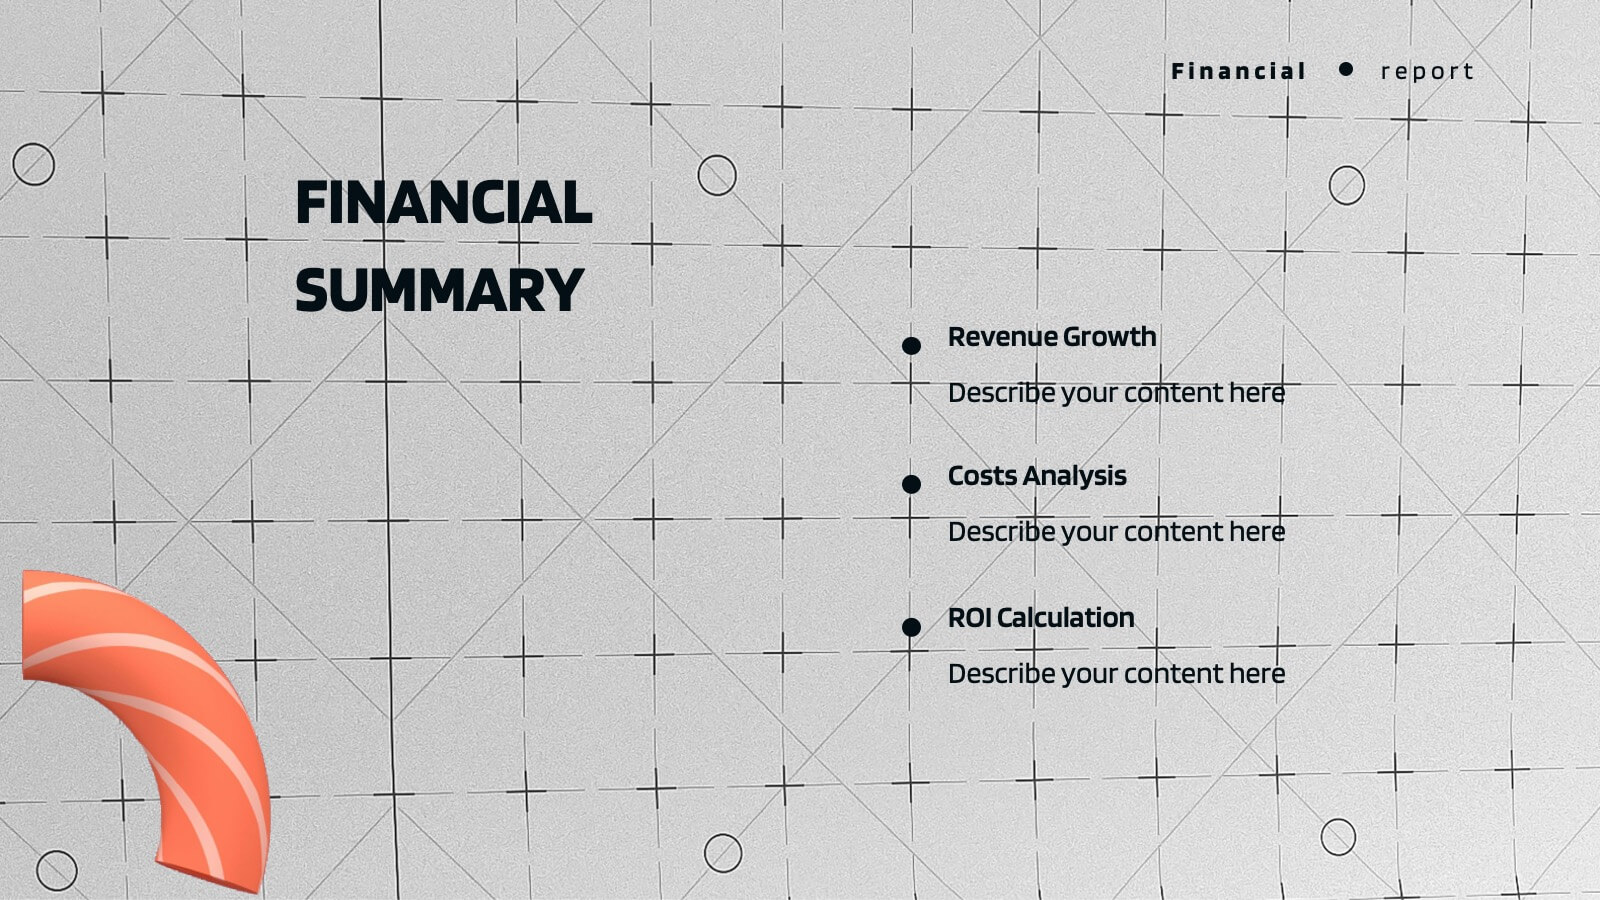
Synergywave Financial Report Presentation
Deliver your financial insights with clarity using this comprehensive report presentation! It covers key sections like performance metrics, sales updates, market trends, and strategic initiatives, ensuring all critical data is well-organized. Whether for stakeholders or internal reviews, this template ensures seamless communication. Fully compatible with PowerPoint, Keynote, and Google Slides.


24 slides
Momentum Investor Pitch Presentation
The Momentum Pitch Deck is your ultimate tool for propelling your business ideas into action! This vibrant and dynamic template is crafted to captivate your audience and clearly convey your company's vision, strategy, and growth potential. Start with an engaging overview, followed by a problem statement that pinpoints the core challenges your solution addresses. Use the market opportunity and competitive landscape slides to showcase the potential for success. The business model canvas and unique selling proposition sections help illustrate how your business stands out from the competition. Highlight your revenue model, marketing strategy, and sales approach to show your path to profitability. Additionally, the template includes sections for technology and innovation, team introduction, and risk analysis, ensuring a comprehensive presentation. Whether you're pitching to investors or stakeholders, this template is fully compatible with PowerPoint, Keynote, and Google Slides, making it the perfect choice for any pitch deck.


4 slides
Business Partnership Development Presentation
Showcase key elements of collaboration with the Business Partnership Development Presentation. This quadrant-style layout is perfect for outlining strategies, stakeholders, or phases of a partnership. Ideal for business proposals, joint ventures, and strategic planning decks. Fully editable in PowerPoint, Keynote, and Google Slides.


4 slides
Regional Analytics for North America Map Presentation
Visualize key performance metrics by region with the Regional Analytics for North America Map Presentation. This slide layout combines stacked bar visuals with a detailed map, allowing you to compare data points across multiple regions. Ideal for reporting trends, KPIs, or market analysis. Fully editable in Canva, PowerPoint, and Google Slides.


4 slides
Execution-Based Strategic Action Plan Presentation
Highlight your execution strategy with this visually striking pinwheel diagram. Each blade represents a focused action step, ideal for showcasing implementation plans or performance initiatives. Fully customizable in PowerPoint, Keynote, and Google Slides—perfect for strategic reviews, team briefings, or progress tracking across four critical areas.


6 slides
Visual Resource Allocation Gantt
Easily map out team workload over time with the Visual Resource Allocation Gantt Presentation. This slide helps you assign tasks across monthly intervals, track resource distribution, and identify scheduling conflicts. Perfect for project managers, department heads, and HR planners aiming to balance capacity and timelines. Fully editable in PowerPoint, Keynote, and Google Slides.


7 slides
Mind Map Infographic Presentation Template
A mind map is a diagram that allows you to visualize how related ideas and concepts are connected to one another. It is especially good for brainstorming, planning and organizing. A mind map allows you to organize information in a way that shows your thinking process and gives you the opportunity for deeper understanding. This template will help others understand how you think about a particular subject or topic. Use this template to "brainstorm" a topic, and create an interesting mind map. You can also use it to share your ideas with others, or to visually organize your thoughts.


6 slides
Commercial Agriculture Infographics
Explore the world of Commercial Agriculture with our customizable infographic template. This template is fully compatible with popular presentation software like PowerPoint, Keynote, and Google Slides, allowing you to easily customize it to illustrate and communicate various aspects of commercial agriculture. The Commercial Agriculture infographic template offers a visually engaging platform to explore and explain the practices, trends, and challenges in modern agriculture for commercial purposes. Whether you're a farmer, agricultural professional, student, or simply interested in food production and sustainability, this template provides a user-friendly canvas to create informative presentations and educational materials. Deepen your understanding of Commercial Agriculture with this SEO-optimized infographic template, thoughtfully designed for clarity and ease of use. Customize it to highlight key agricultural practices, technologies, crop management, and the importance of sustainable farming, ensuring that your audience gains valuable insights into this vital industry. Start crafting your personalized infographic today to explore the world of Commercial Agriculture.

1 slide
Success Roadmap and Personal Achievement Presentation
Visualize your path to success with the Success Roadmap and Personal Achievement Presentation. This stepwise layout guides your audience through key milestones, making it perfect for showcasing personal growth, career progression, or business achievements. Each step features a distinct icon and space for focused insights. Fully editable in Canva, PowerPoint, Keynote, and Google Slides.


5 slides
Innovative Business Solutions Presentation
Elevate your strategy discussions with the Innovative Business Solutions template, providing a visually engaging framework designed to present complex business solutions clearly and effectively. It features a unique puzzle design that integrates up to five key business insights, ensuring each piece contributes to a holistic understanding of strategies or solutions. It is compatible with PowerPoint, Keynote and Google Slides, providing flexibility and ease of use across different platforms.


6 slides
Strategic Planning with PESTEL Presentation
Dive into comprehensive environmental scanning with our "Strategic Planning with PESTEL" presentation template. This layout meticulously breaks down Political, Economic, Social, Technological, Environmental, and Legal factors, enabling thorough market analysis and strategy formulation. Perfect for strategists and analysts, the template supports PowerPoint, Keynote, and Google Slides, facilitating a dynamic and engaging planning session.


6 slides
Macro Environment PESTEL Framework
Navigate market forces with confidence using this dynamic PESTEL framework layout—designed to help you assess Political, Economic, Social, Technological, Environmental, and Legal factors with clarity. Whether for strategy planning or external analysis, this slide keeps your insights visually organized and easy to explain. Fully compatible with PowerPoint, Keynote, and Google Slides.

21 slides
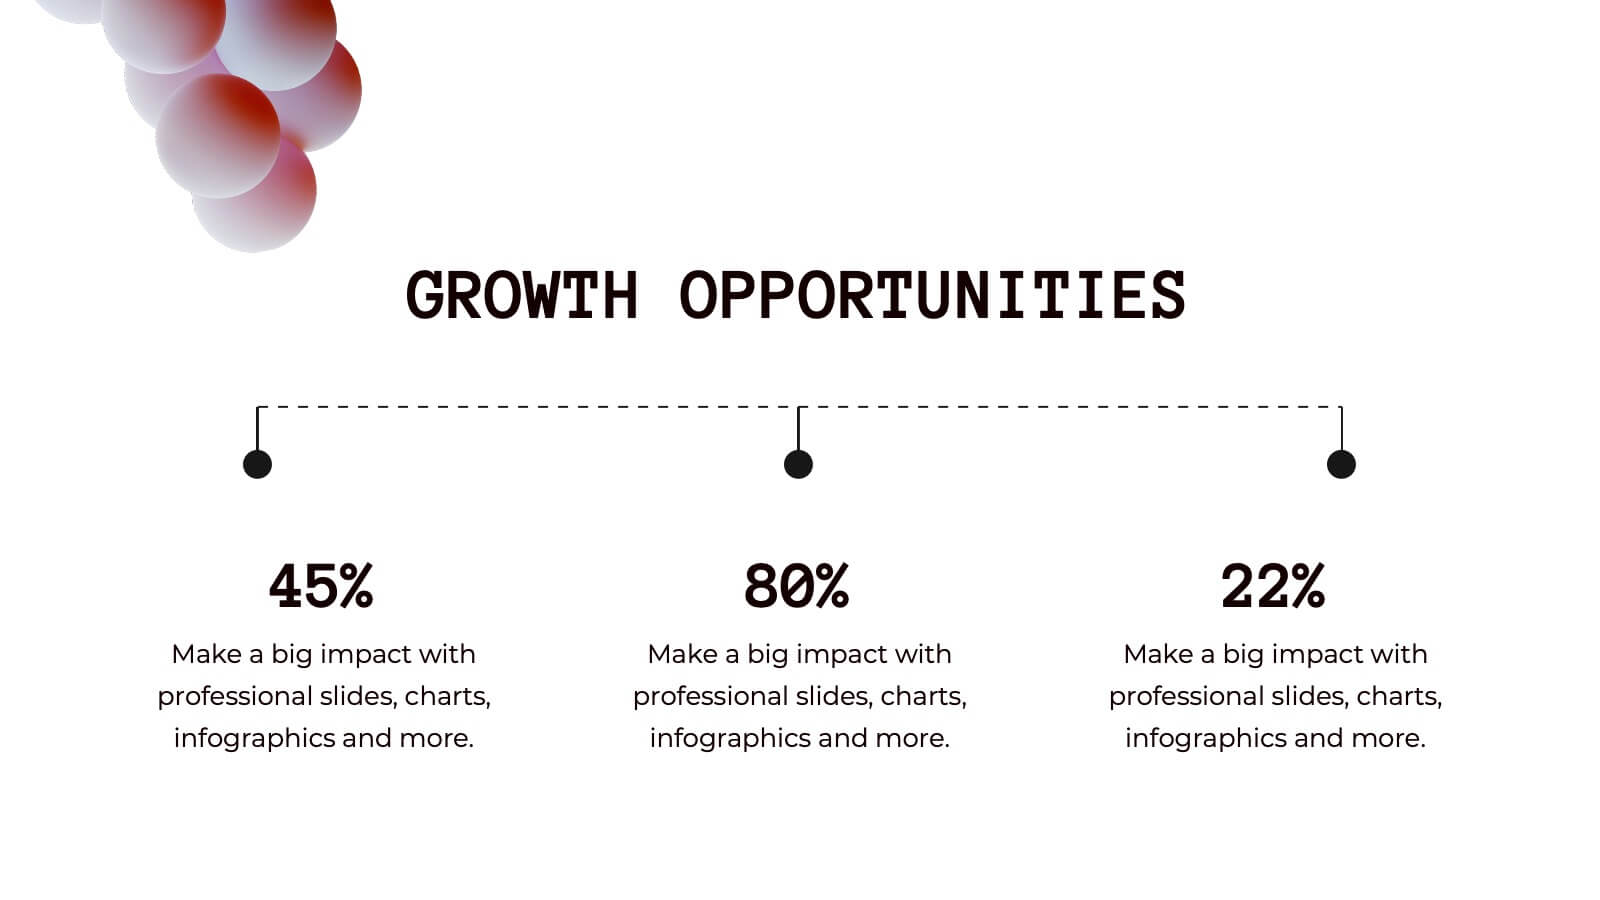
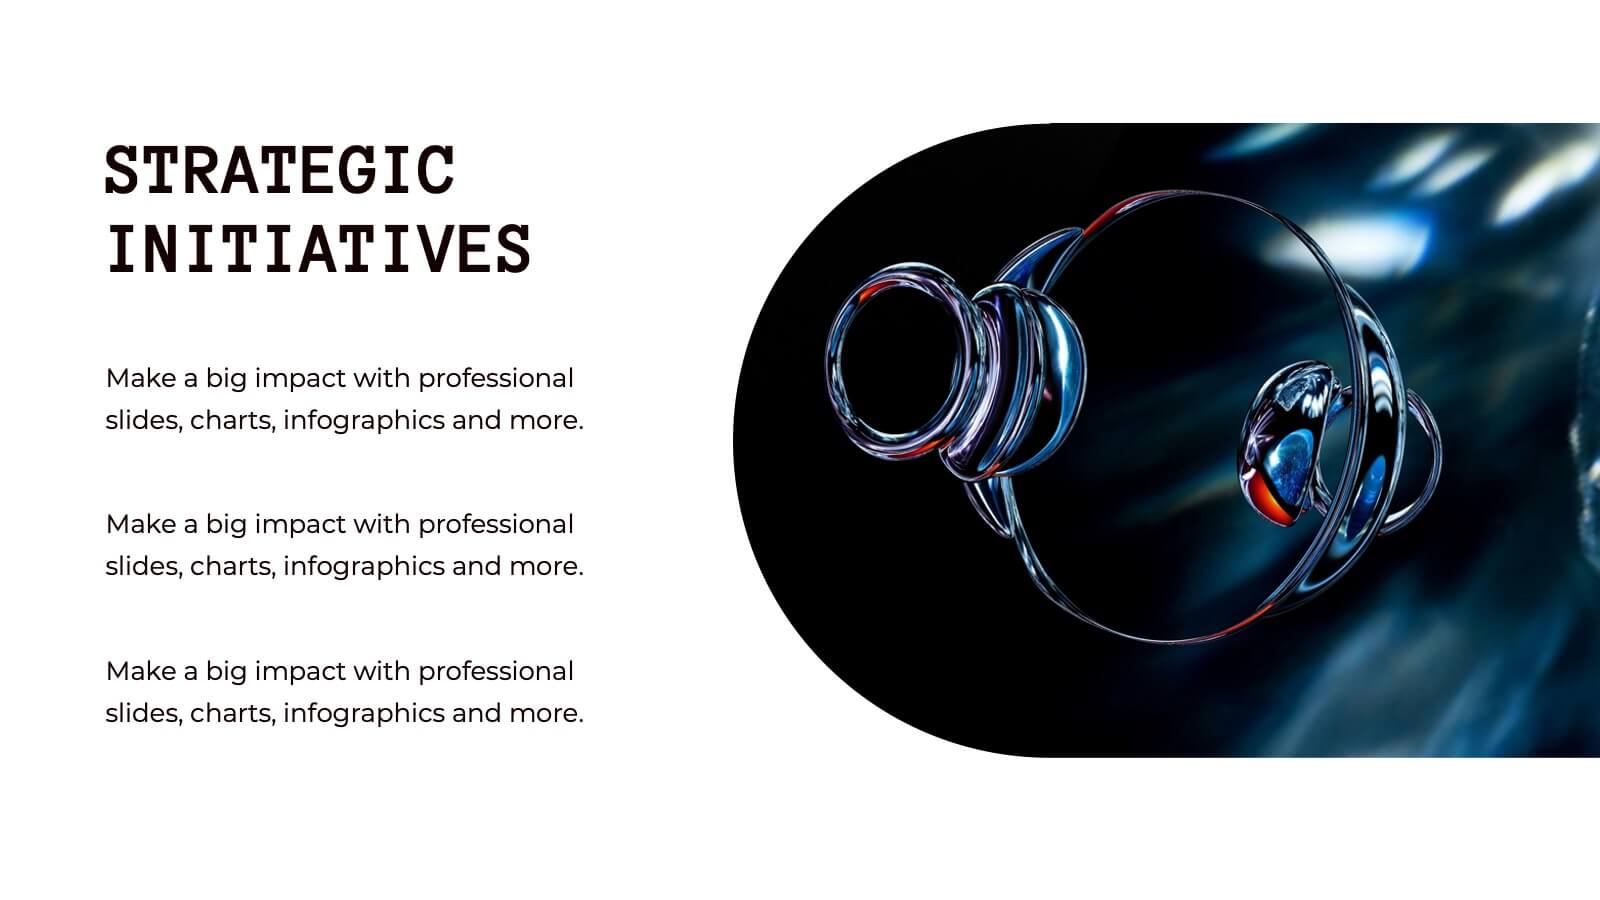
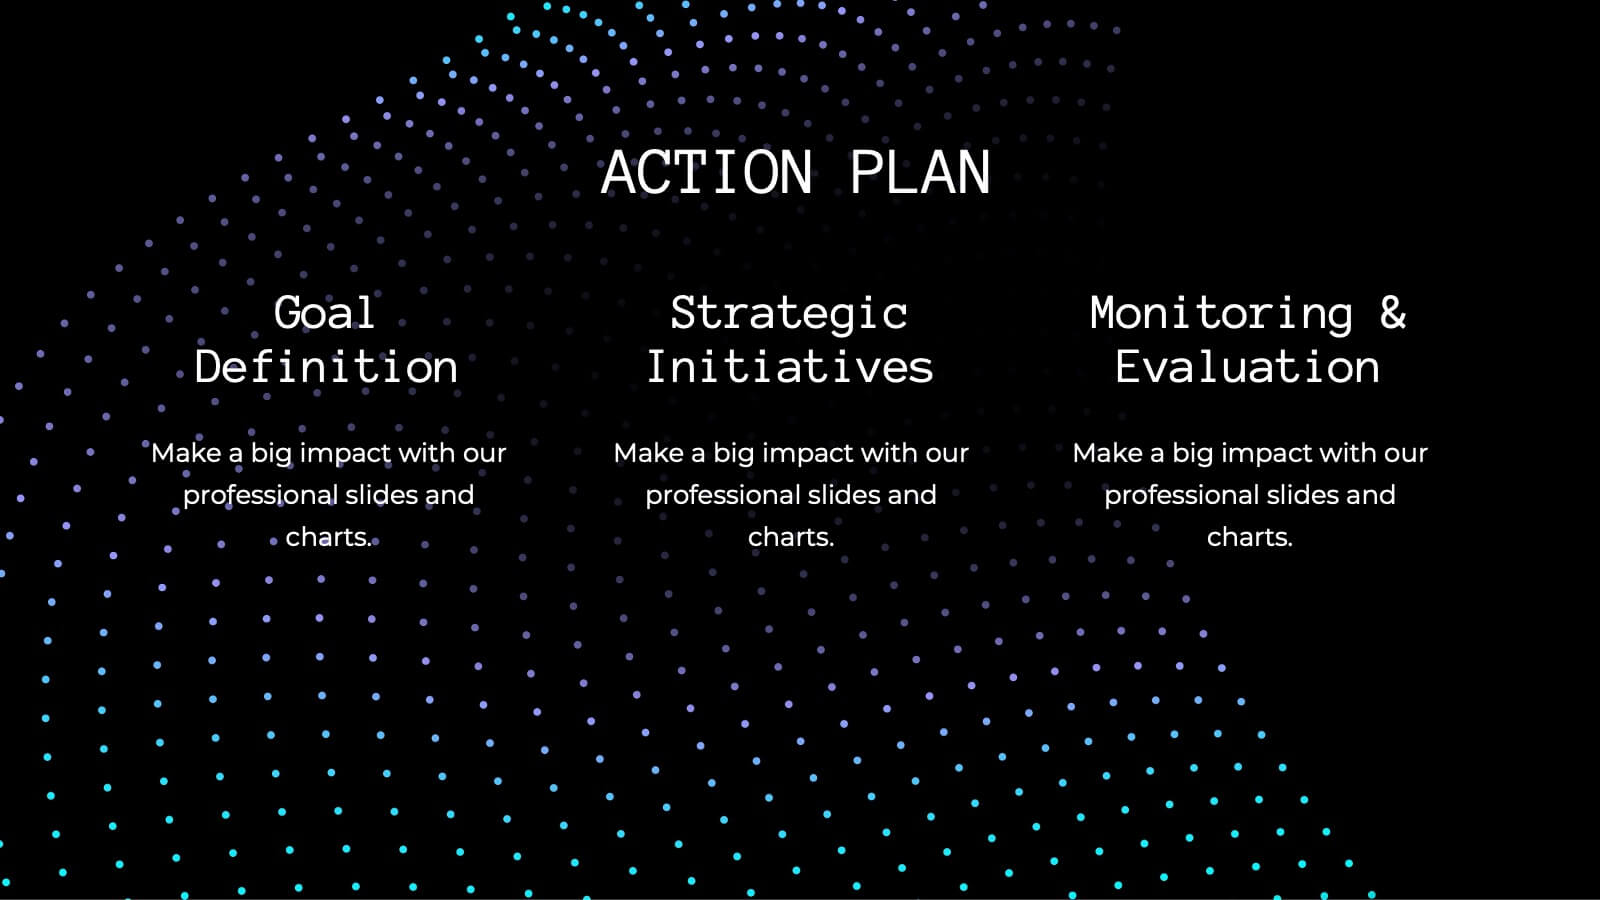
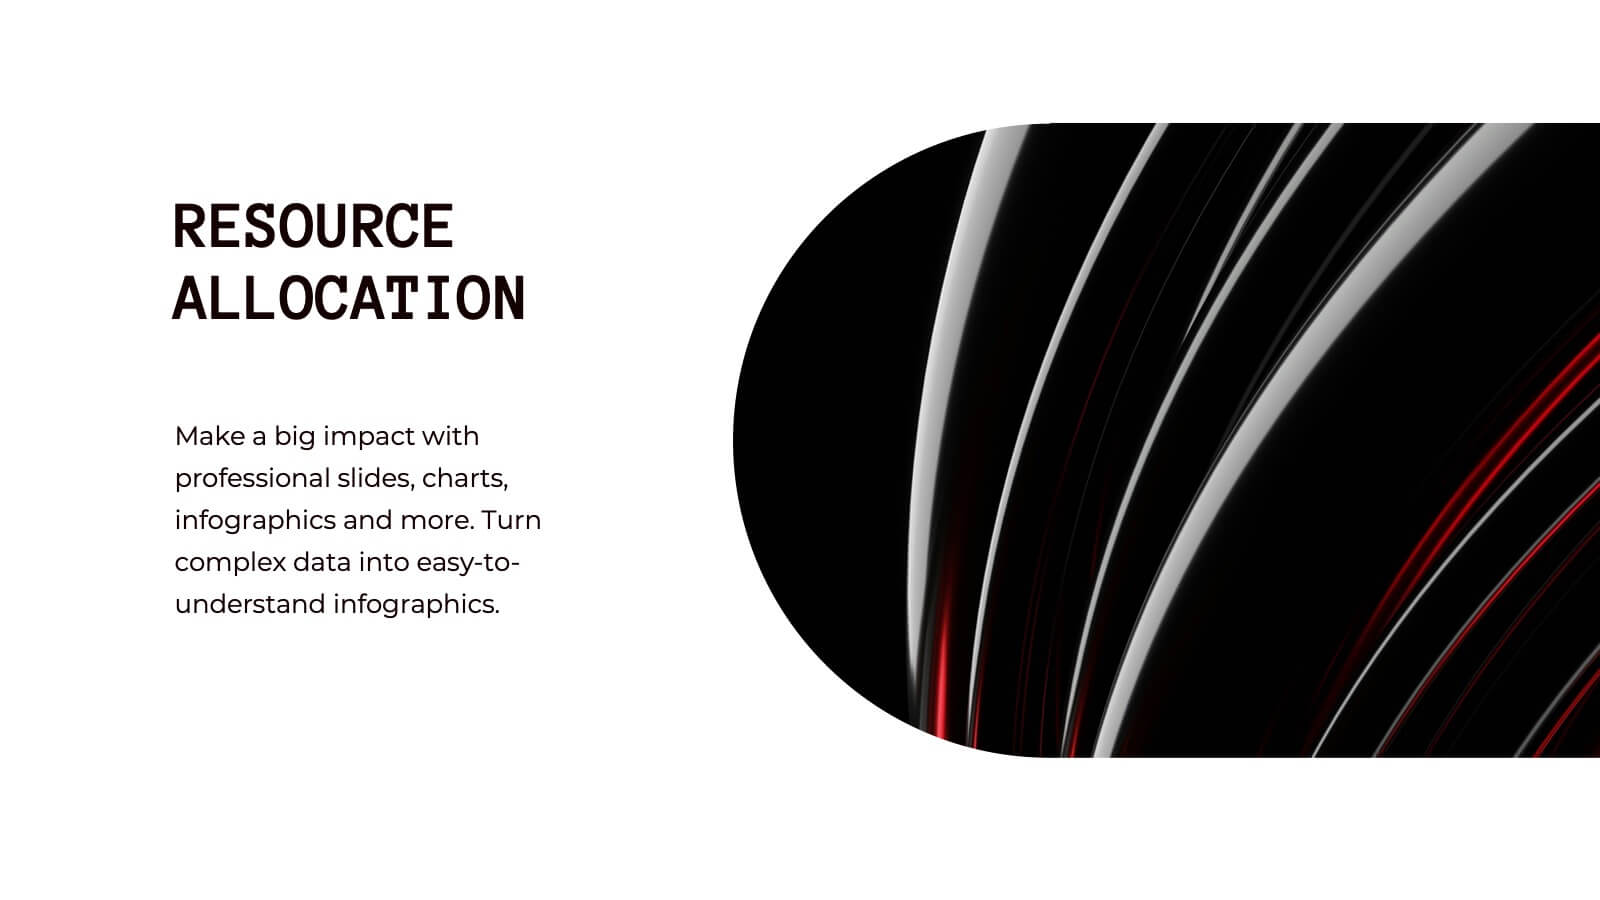
Mermaid Corporate Strategy Proposal Presentation
Present your corporate strategy with confidence using this sleek, modern proposal template! It covers strategic objectives, market trends, SWOT analysis, and resource allocation, ensuring a comprehensive overview of your plan. Fully customizable and compatible with PowerPoint, Keynote, and Google Slides, this template is ideal for launching new initiatives and achieving business goals.


8 slides
Success Metrics and Performance Presentation
Showcase your Success Metrics and Performance with this data-driven presentation template. Designed with bar-style visualizations and percentage-based highlights, this layout is ideal for business analysts, project managers, and executives looking to present key performance indicators (KPIs) with clarity. Featuring customizable colors, icons, and text placeholders, this template ensures clear and impactful storytelling. Compatible with PowerPoint, Keynote, and Google Slides for easy integration.