


Features
- 6 Unique slides
- Fully editable and easy to edit in Microsoft Powerpoint, Keynote and Google Slides
- 16:9 widescreen layout
- Clean and professional designs
- Export to JPG, PDF or send by email


Do you have any questions?
Recommend


8 slides
Competitive Market Strategy Presentation
Stay Ahead in the Market with this Competitive Market Strategy Presentation template. This slide helps you analyze industry competition, market positioning, and strategic advantages with a clean, engaging circular layout. Ideal for business planning, marketing strategy meetings, and competitive analysis, this template allows you to highlight key differentiators and action steps clearly. Fully customizable and available for PowerPoint, Keynote, and Google Slides.


7 slides
Aviation School Infographic Presentation
If you're in search of striking visuals for your upcoming aviation school presentation, we've got just the solution for you. Our expertly crafted infographic template is designed to captivate and engage your audience, ensuring that your message is conveyed with maximum impact. Our template covers a diverse range of aviation topics, including airport and runway security. This guarantees that your information is presented in a clear, concise, and visually compelling manner. With our aviation infographic template, you'll be able to deliver an outstanding presentation that resonates with your audience and leaves a lasting impression.


5 slides
Detailed Customer Profile Layout Presentation
Get to know your audience like never before with this sleek, data-driven layout built for precision and insight. Ideal for marketing, research, and strategy teams, it lets you visualize customer behaviors and demographics clearly. Fully editable and compatible with PowerPoint, Keynote, and Google Slides for seamless presentation design.


5 slides
Projects Milestone Timeline Presentation
Kickstart your story with a clean, engaging timeline that makes every achievement feel purposeful and easy to follow. This presentation helps you outline major milestones, track progress, and communicate project goals with clarity and structure. Ideal for planning, reporting, and strategy sessions. Fully compatible with PowerPoint, Keynote, and Google Slides.


5 slides
Data Entry Infographics
Dive into the intricate world of information management with our data entry infographics. Cast in shades of blue, warm orange, and an array of inviting colors, this vertically styled template is a boon for business analysts, administrative assistants, and database managers. The design, punctuated with relevant graphics, icons, and strategic image placeholders, simplifies complex data narratives. It serves as a visual anchor, ensuring information accuracy and efficiency. This essential tool is instrumental for professionals striving to maintain data integrity while elucidating critical entry processes, thereby fostering a streamlined workflow.


4 slides
Pharmaceutical Industry Overview Presentation
Get a comprehensive view of the pharmaceutical sector with the Pharmaceutical Industry Overview Presentation template. This well-structured layout is designed to present key insights, industry trends, and regulatory frameworks in a visually compelling format. Perfect for industry analysts, healthcare professionals, and business executives, this template is fully editable and compatible with PowerPoint, Keynote, and Google Slides.


5 slides
History of Photography Infographics
The History of Photography traces back to the early 19th century when the concept of capturing and preserving images through a camera was first realized. These infographic templates provide a visually stunning format to showcase the key milestones, influential photographers, and technological advancements that shaped the history of photography. The template consists of vertical infographics, making it easy to present information in a visually appealing and organized manner. It is compatible with Powerpoint, Keynote, and Google Slides, ensuring seamless customization and adaptability to your specific needs.


6 slides
3D Infographic Design
Visualize data like never before with this bold 3D block diagram layout. Designed to break down complex figures into three key segments, it’s perfect for presenting percentages, growth areas, or metric comparisons. Easily editable in PowerPoint, Keynote, and Google Slides.


4 slides
Business Milestone Roadmap Presentation
Visualize your company's journey with this curved-road milestone infographic. Perfect for tracking key goals, quarterly achievements, or strategic plans, this template uses clear markers along a winding path to emphasize progress and direction. Ideal for business updates, project timelines, or growth strategies. Fully editable in PowerPoint, Keynote, and Google Slides.


10 slides
Revenue Growth Strategies and Metrics Presentation
Highlight your key success drivers with the Revenue Growth Strategies and Metrics Presentation. This upward arrow-based layout is perfect for showcasing growth phases, financial KPIs, or strategic revenue initiatives. Clean, professional, and fully editable in PowerPoint, Keynote, and Google Slides—ideal for business reviews, sales pitches, and quarterly updates.


22 slides
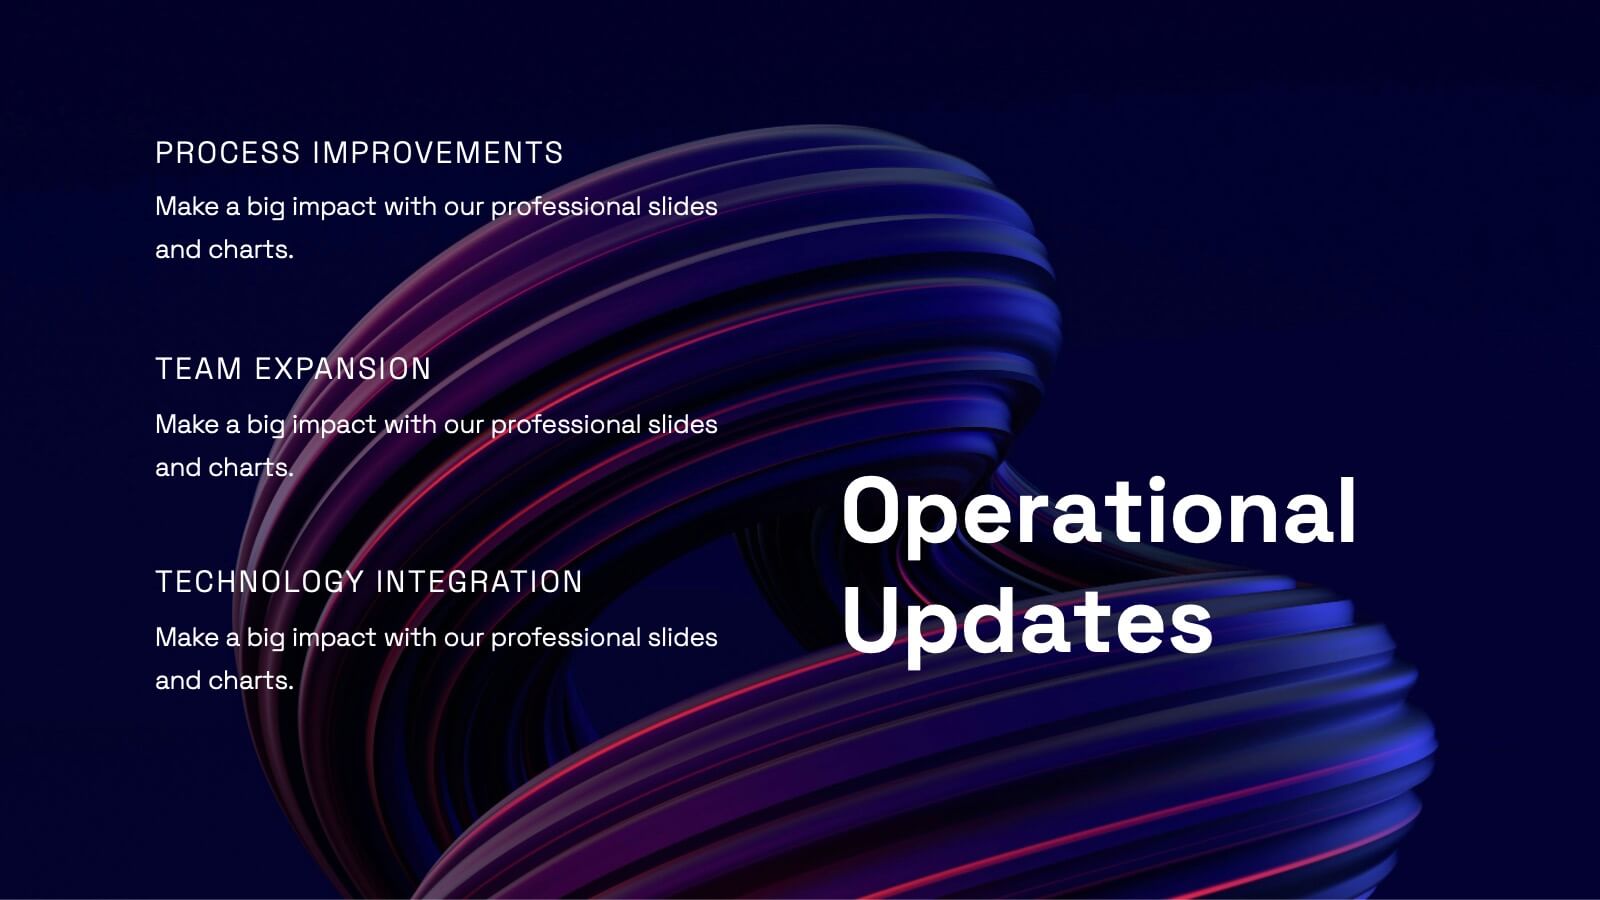
Sublimix Business Operations Plan Presentation
Streamline your company’s workflow with this bold and modern business operations plan presentation. Covering key areas like performance metrics, resource allocation, process improvements, and collaboration opportunities, this template helps you optimize efficiency and strategy. Fully customizable and compatible with PowerPoint, Keynote, and Google Slides for a seamless, professional presentation experience.


21 slides
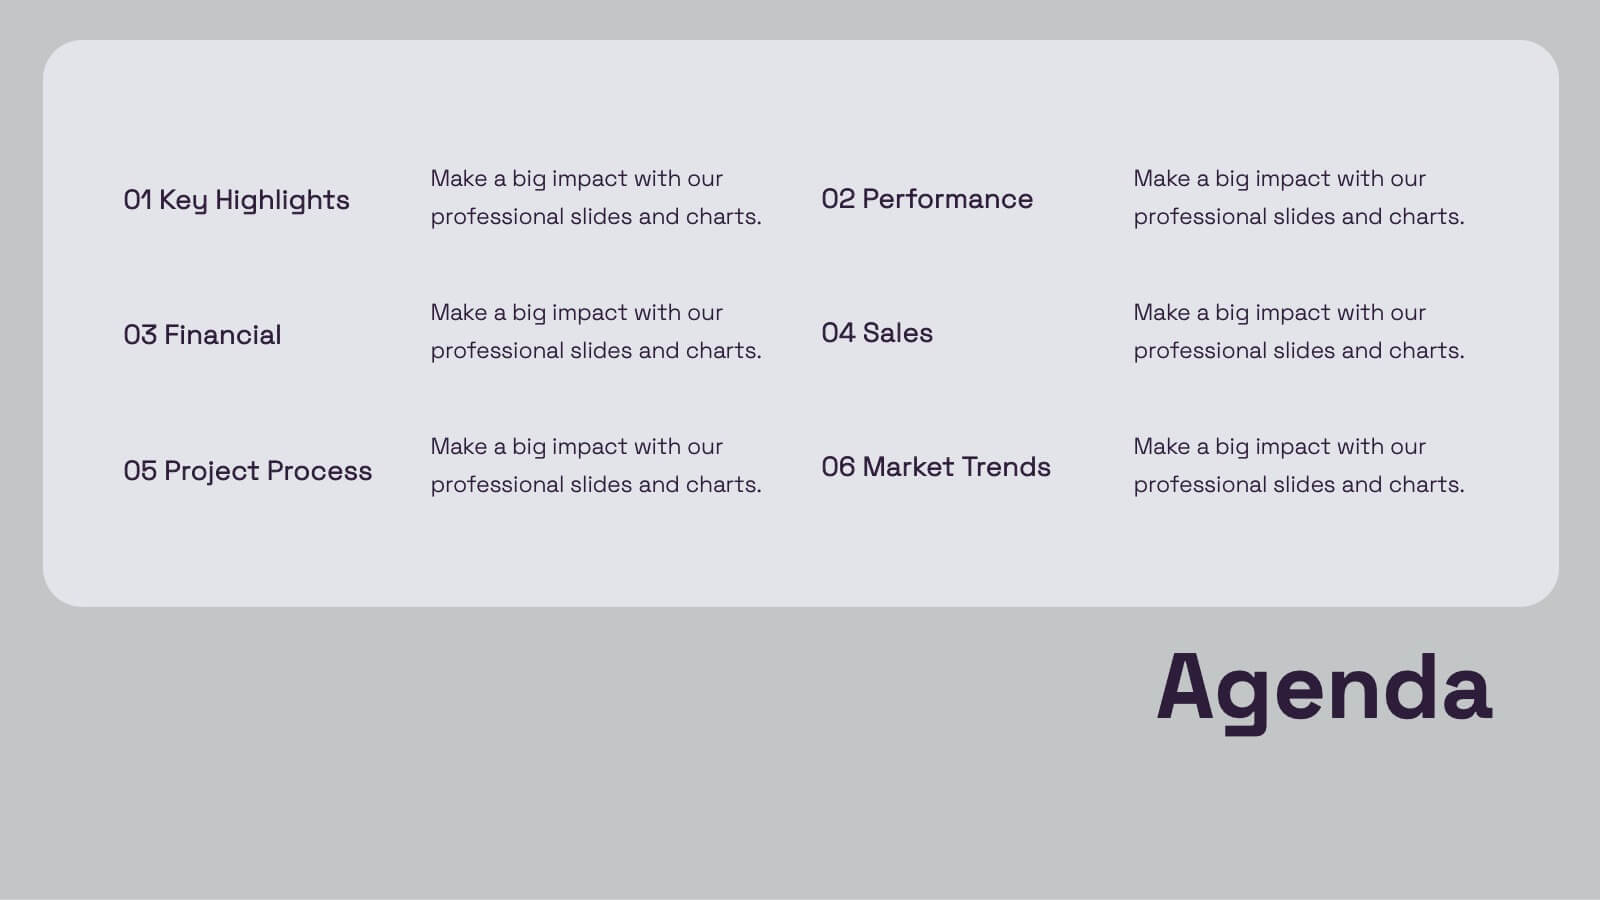
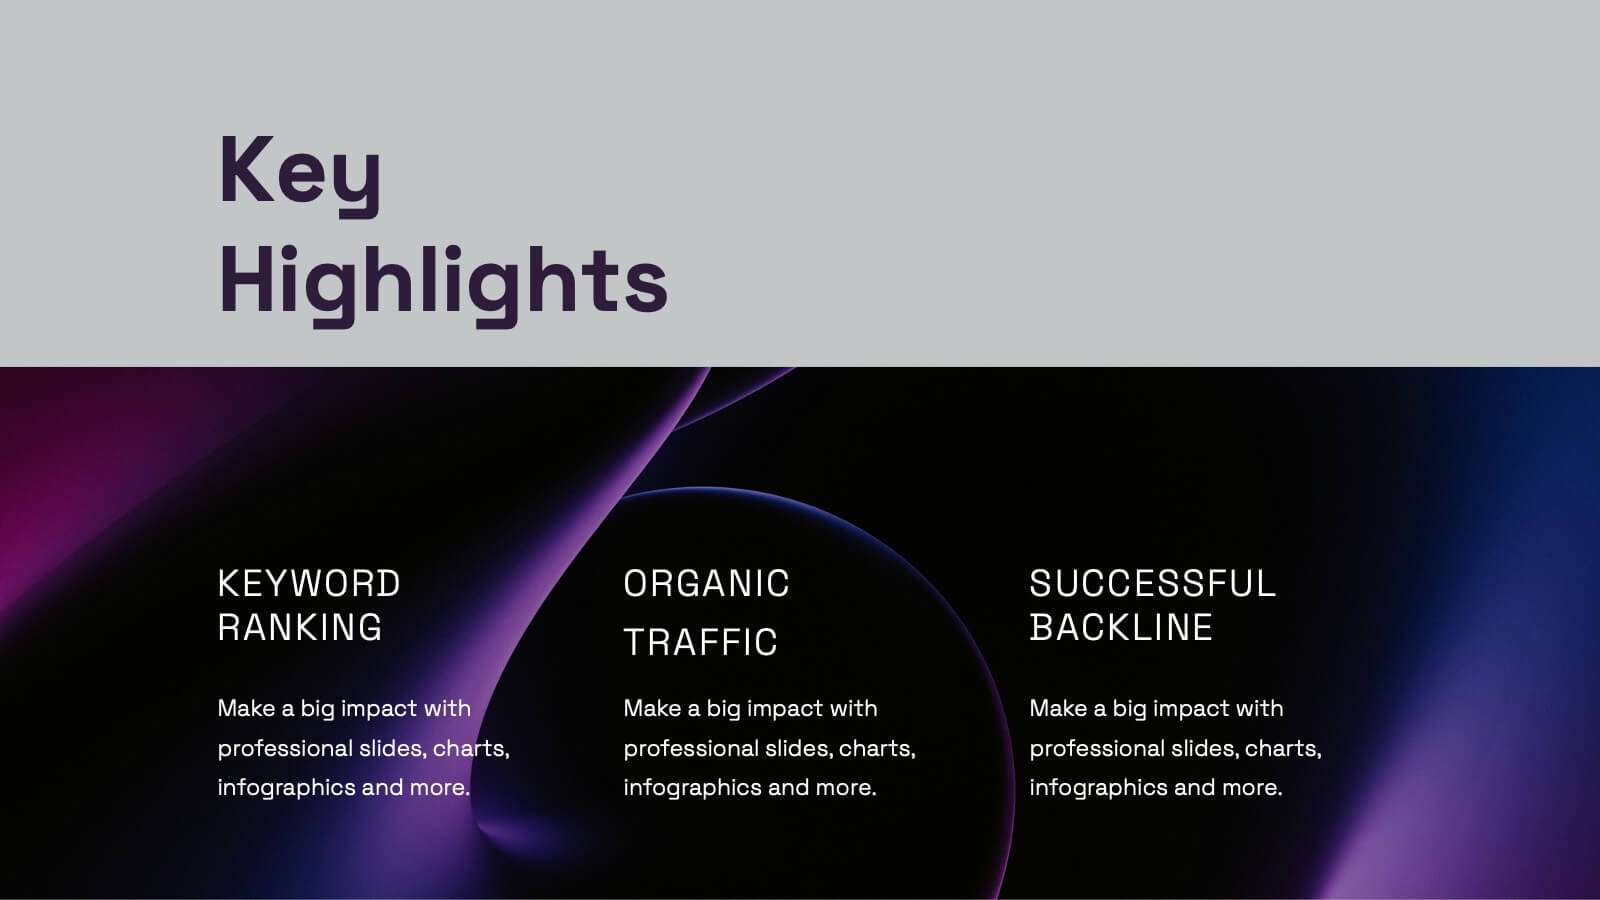
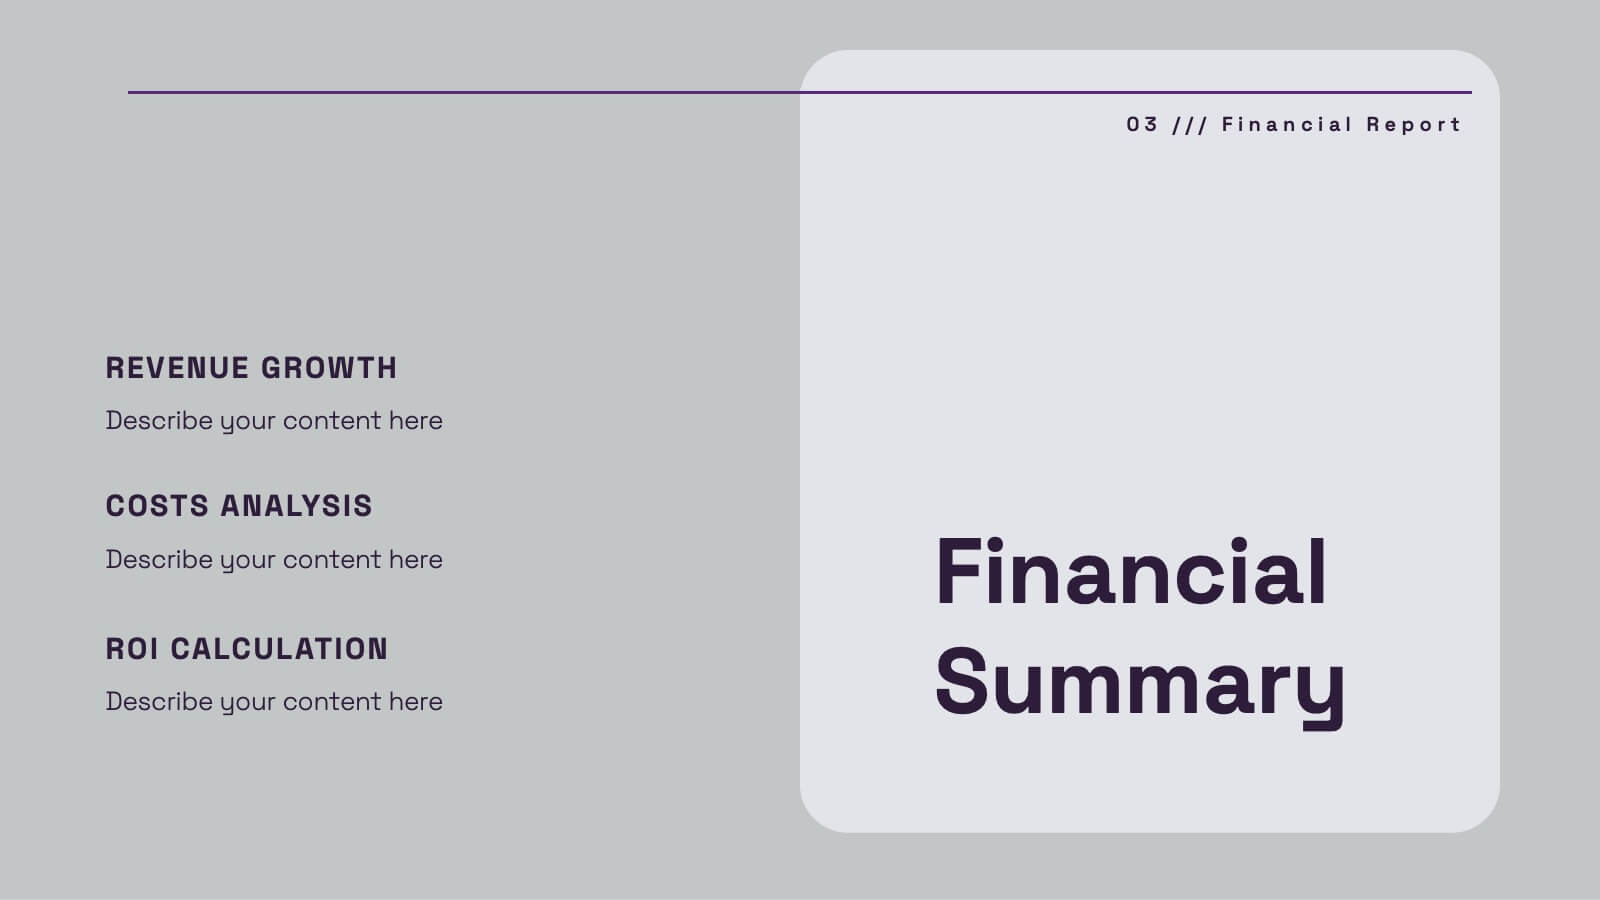
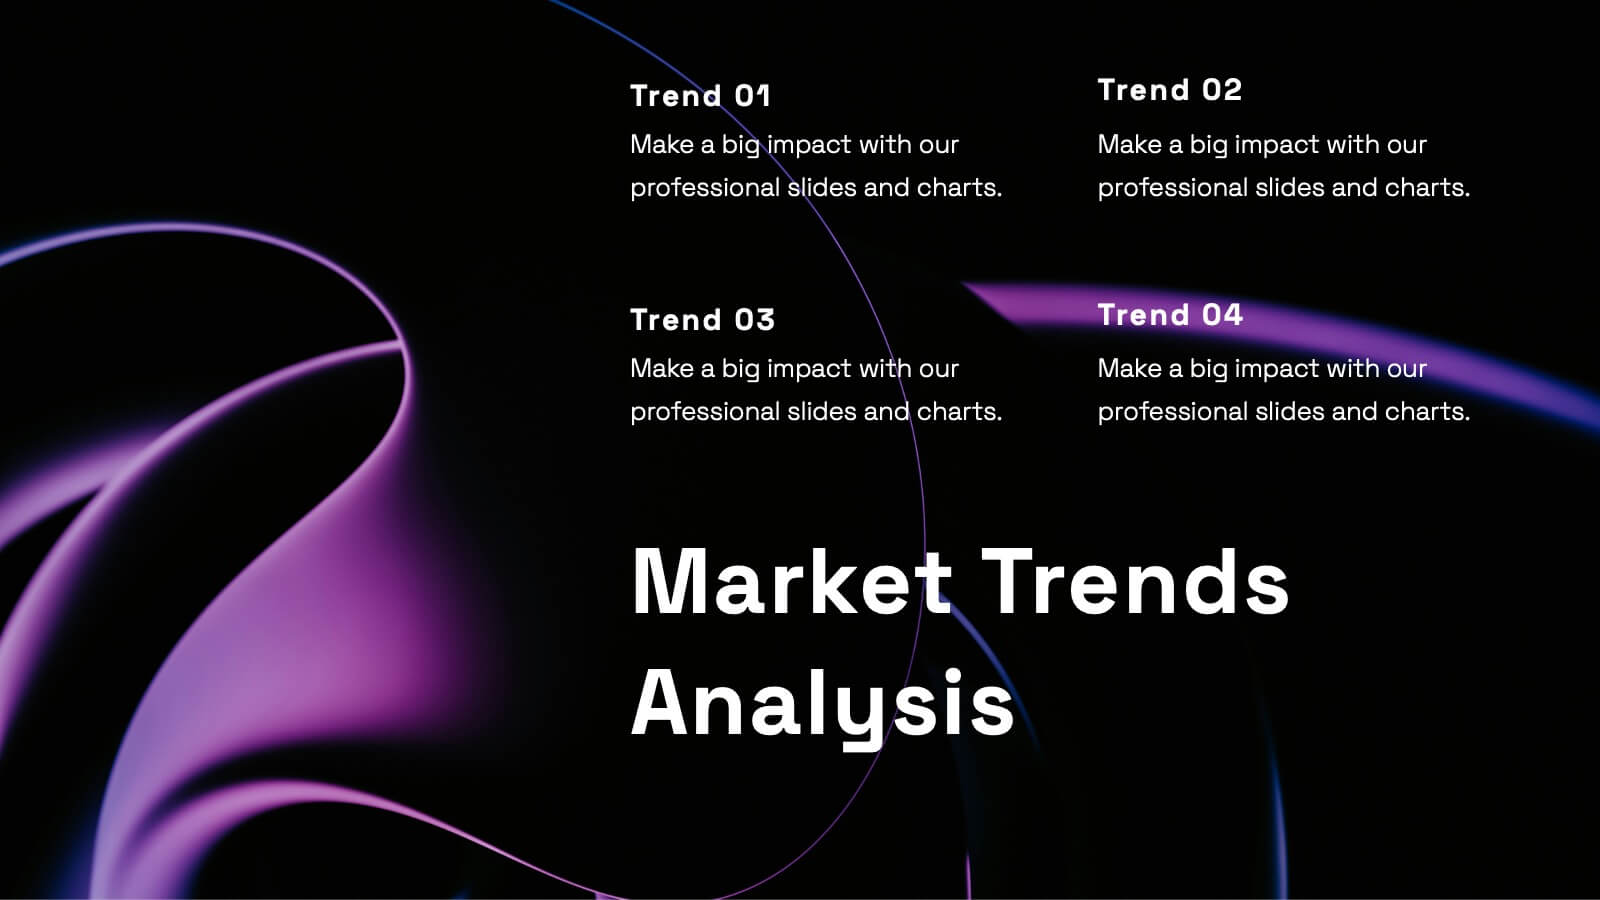
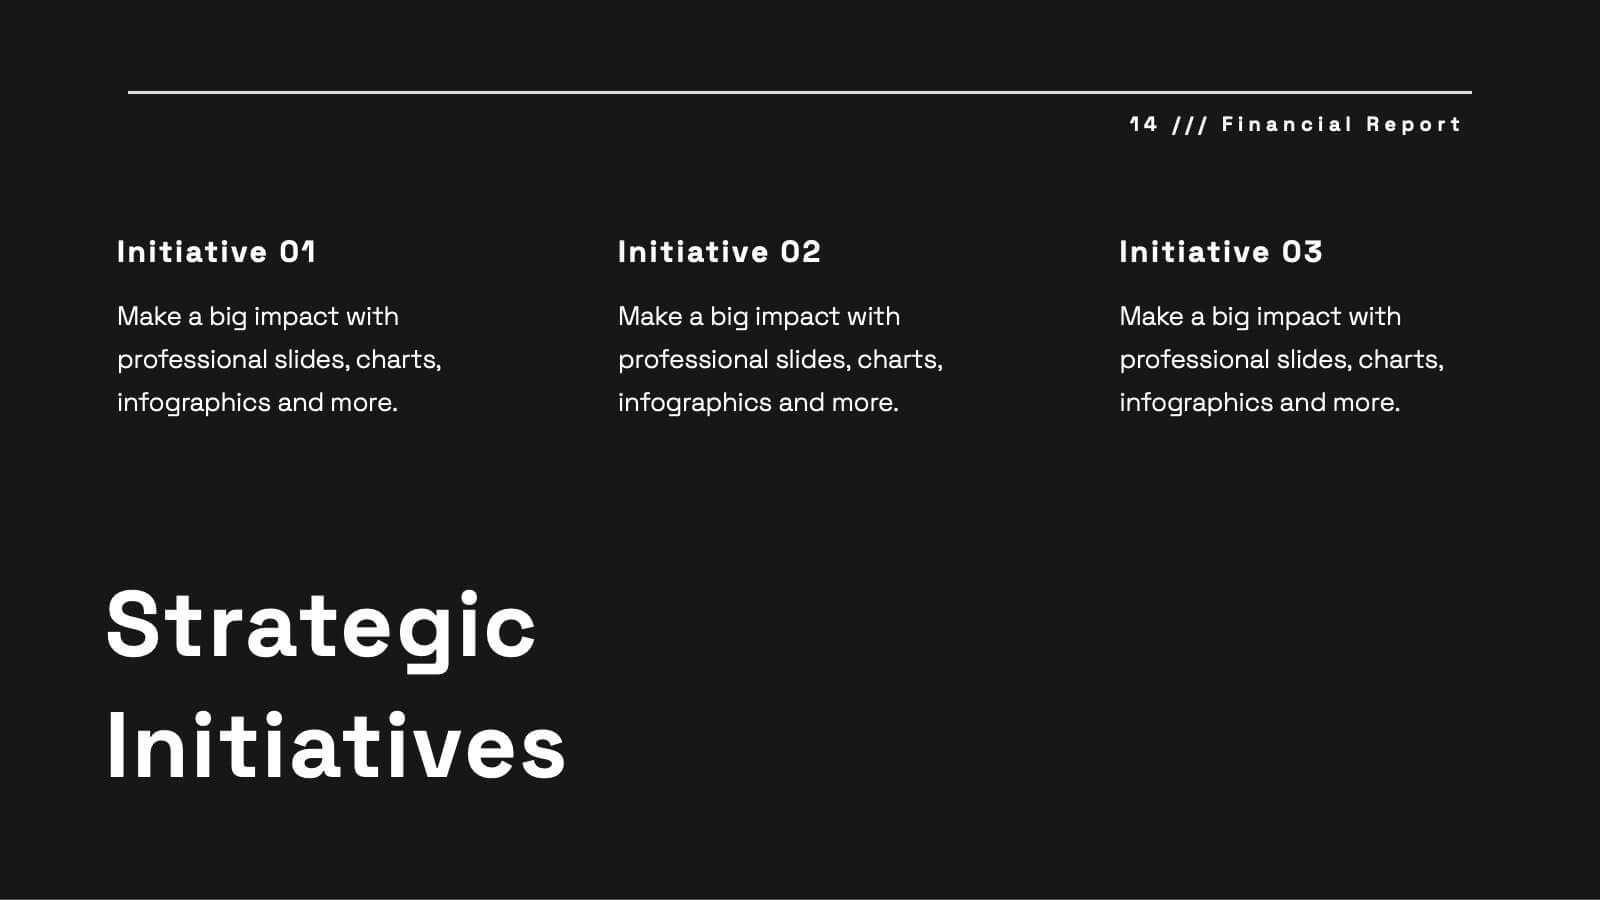
Uplift Financial Report Presentation
Present your financial or business report with this sleek and modern presentation template! It includes essential sections such as performance metrics, financial summaries, project progress, and market trends analysis, ensuring a comprehensive overview. Whether you're discussing key achievements or competitor insights, this template is perfect for delivering a professional and polished report. Compatible with PowerPoint, Keynote, and Google Slides for easy use and customization.


10 slides
Checklist and Action Plan List Presentation
Stay organized and achieve goals efficiently with this checklist and action plan template. Designed for task tracking, project management, and strategic planning, it provides a clear visual structure for prioritizing tasks. Perfect for professionals and teams aiming for productivity. Compatible with PowerPoint, Keynote, and Google Slides for seamless editing and presentation.


5 slides
Restaurant Experience Infographics
The Restaurant industry plays a vital role in providing food, employment, and social spaces while contributing to economic growth and cultural exchange. These infographic templates are designed to showcase various aspects of the restaurant experience. It is an ideal tool for restaurant owners, managers, and marketers to present data, statistics, and key information about their establishment's unique features and offerings. The template includes a collection of eye-catching infographics that cover different elements of the restaurant experience. The graphics are designed in a modern and vibrant style, with attractive colors that capture attention.


26 slides
Forge Brand Strategy Report Presentation
The Brand Strategy Presentation Template is a sleek solution for showcasing brand identity. Highlight mission, values, audience personas, and future growth plans across 26 structured slides. Fully customizable for PowerPoint, Keynote, and Google Slides, it’s ideal for presenting brand insights to clients or stakeholders with professionalism and clarity.


6 slides
Strategy Investing Wheel Infographics
Illustrate your investment strategy effectively with our Strategy Investing Wheel infographic template. This template is fully compatible with popular presentation software like PowerPoint, Keynote, and Google Slides, allowing you to easily customize it to showcase your investment approach using a wheel diagram. The Strategy Investing Wheel infographic template offers a visually engaging platform to depict your investment strategy components, such as asset allocation, risk tolerance, time horizon, and diversification. Whether you're an investor, financial planner, or analyst, this template provides a user-friendly canvas to create informative presentations and reports on your investment strategy. Optimize your investment decision-making with this SEO-optimized Strategy Investing Wheel infographic template, thoughtfully designed for clarity and ease of use. Customize it to showcase your unique strategy, key principles, and investment objectives, helping you communicate your approach to stakeholders and clients effectively. Start crafting your personalized infographic today to convey your investment strategy with impact and clarity.


5 slides
Oceania Business Opportunities Map Presentation
Unlock growth potential with the Oceania Business Opportunities Map template, crafted to showcase key investment zones and emerging markets across the region. Utilize interactive mapping tools to analyze market viability and sector-specific opportunities effectively. Ideal for businesses looking to expand in Oceania. Compatible with PowerPoint, Keynote, and Google Slides.