


Features
- 6 Unique slides
- Fully editable and easy to edit in Microsoft Powerpoint, Keynote and Google Slides
- 16:9 widescreen layout
- Clean and professional designs
- Export to JPG, PDF or send by email


Do you have any questions?
Recommend


21 slides
Aquamarine Creative Portfolio Presentation
Dive into creativity with this stunning aquamarine-inspired portfolio presentation! Perfect for showcasing your creative work, this template allows you to highlight your projects, skills, and achievements with a refreshing and modern design. Its clean and dynamic layout enhances your portfolio's impact. Compatible with PowerPoint, Keynote, and Google Slides.


6 slides
Financial Credit Card Analysis Presentation
The Financial Credit Card Analysis presentation template offers a comprehensive visual tool for comparing different aspects of credit card features. Designed for clarity and impact, this template showcases key data points like interest rates, reward programs, fees, and user benefits across multiple cards in a color-coded format. Each segment is clearly labeled for easy understanding, making it an excellent choice for financial analysts, advisors, or anyone presenting credit card options to clients or within financial education workshops. The modular design allows for customizable sections to adapt to specific needs or to highlight particular cards or features effectively.


6 slides
Company Profile Growth Infographic
The collection of templates presented offers a valuable resource for businesses aiming to articulate their growth and current market standing comprehensively. These templates are designed to deliver essential information through a well-structured and visually appealing format, ideal for engaging stakeholders effectively. Each design is tailored to showcase various aspects of company progress, including detailed financial growth, strategic direction, and key achievements. Features such as timelines, growth charts, and key performance indicators are seamlessly integrated, providing a clear snapshot of the company's journey and ambitions. The templates are adaptable to various corporate needs, making them suitable for annual reports, investor presentations, and internal reviews across different industries. The chosen color schemes and layouts ensure that information is presented clearly and attractively, enhancing readability and projecting a professional corporate image. By facilitating customization to reflect the unique characteristics of any business, these templates serve as indispensable tools for companies eager to communicate their success stories and future prospects in a compelling manner.


7 slides
Pillar of Success Infographic
Pillars of Success is a metaphorical term used to describe principles or key elements that are essential for achieving success in various aspects of life, whether it's in personal development, business, education, relationships, or any other domain. This infographic template unveils the essential principles that constitute the very pillars upon which triumph and accomplishment stand. Compatible with Powerpoint, Keynote, and Google Slides. The pillars represent foundational factors that contribute to success. This template symbolizes the foundation of any successful venture, emphasizing the importance of a strong start.


21 slides
Duskflare Corporate Strategy Proposal Presentation
Present your corporate strategy effectively with this comprehensive template, featuring sections on market trends, SWOT analysis, strategic initiatives, and risk management. Designed for clarity and impact, it’s ideal for outlining high-level goals and action plans. Compatible with PowerPoint, Keynote, and Google Slides for seamless presentations.


4 slides
Value Innovation with Blue Ocean Strategy Presentation
Showcase the balance between value creation and innovation using this dual puzzle layout. Perfect for comparing customer benefits and strategic actions side by side. Each piece is icon-supported for clarity and visual appeal. Fully editable in PowerPoint, Keynote, and Google Slides—ideal for strategy, business development, or executive briefings.


7 slides
Change Management Principles Infographic
Change is the only constant in the business realm, and mastering its management can be the linchpin to success. The change management principles infographic, in its harmonious palette of gray, blue, and red, provides a visually compelling overview of the key tenets governing successful change. Tailored for business leaders, project managers, HR professionals, and organizational consultants, this infographic streamlines complex ideas into easily digestible insights. Crafted to be fully compatible with PowerPoint, Keynote, and Google Slides, it serves as an invaluable tool to illuminate and drive conversations around change in any corporate presentation.


3 slides
Visual Breakdown with Tree Diagram Format Presentation
Illustrate growth stages, concepts, or layered development with the Visual Breakdown with Tree Diagram Format Presentation. This creative design uses three tree icons—seedling, sapling, and mature tree—to represent progression or hierarchy. Ideal for timelines, product evolution, or strategic planning. Fully editable in PowerPoint, Keynote, and Google Slides.


10 slides
Post-Pandemic Business Strategy Presentation
Help your team adapt to the new normal with this sleek and professional slide layout. Featuring a sanitizer bottle graphic as a central metaphor, the design visually supports your content on strategic recovery, operational safety, or workflow changes. Includes four editable text sections, each with modern icons. Ideal for HR, leadership updates, or business continuity plans. Compatible with PowerPoint, Keynote, and Google Slides.


7 slides
Tree Branch Diagram Infographic
The Tree Branch Diagram Infographic is a versatile template designed to showcase hierarchical information and relationships between different categories or levels of data. Its tree-like structure branches out from a central idea, making it ideal for visualizing organizational structures, decision trees, or classification systems. Each branch represents a unique segment of information, which can be further divided into sub-categories, providing a clear and comprehensive view of complex data. The design is user-friendly and adaptable, suitable for use in PowerPoint, Google Slides, and Keynote presentations.


6 slides
Modern Science Report Presentation
Bring your findings to life with a clean, dynamic layout designed to make scientific insights easy to follow. This presentation highlights key data, research points, and lab observations in a structured, visually engaging format that supports clarity and accuracy. Fully compatible with PowerPoint, Keynote, and Google Slides.


21 slides
Cineris Product Roadmap Presentation
Present your product vision and strategy with this professional and modern product roadmap presentation template. Covering key aspects such as product overview, features, competitive analysis, pricing strategy, and production process, this template helps you communicate your plan effectively. Designed for easy customization, it’s perfect for internal team alignment, stakeholder presentations, and strategic planning. Compatible with PowerPoint, Keynote, and Google Slides.


7 slides
Mortgage Comparison Infographic
Make the home buying decision easier with our mortgage comparison infographic template. This user-friendly and visually engaging infographic allows you to compare different mortgage options, helping your audience make informed financial choices. Use the charts to illustrate how the loan term impacts the total cost of the mortgage, making it easier to choose the right term. Fully customizable and compatible with Powerpoint, Keynote, and Google Slides. With this template, you can demystify mortgage options and empower individuals to choose the mortgage that best fits their needs and financial goals.


21 slides
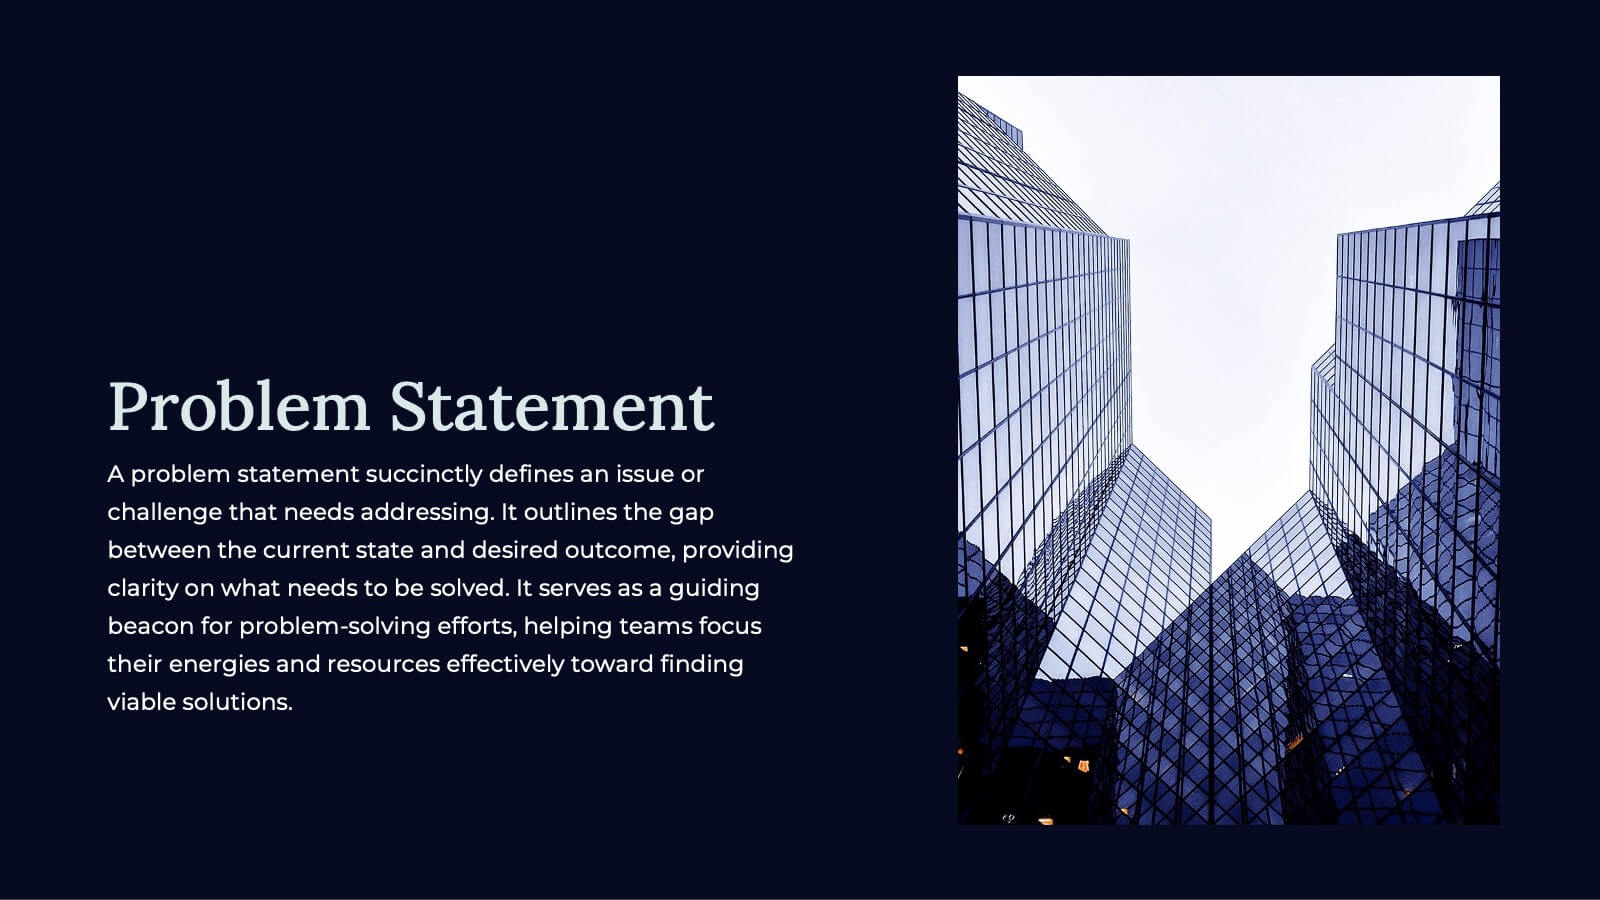
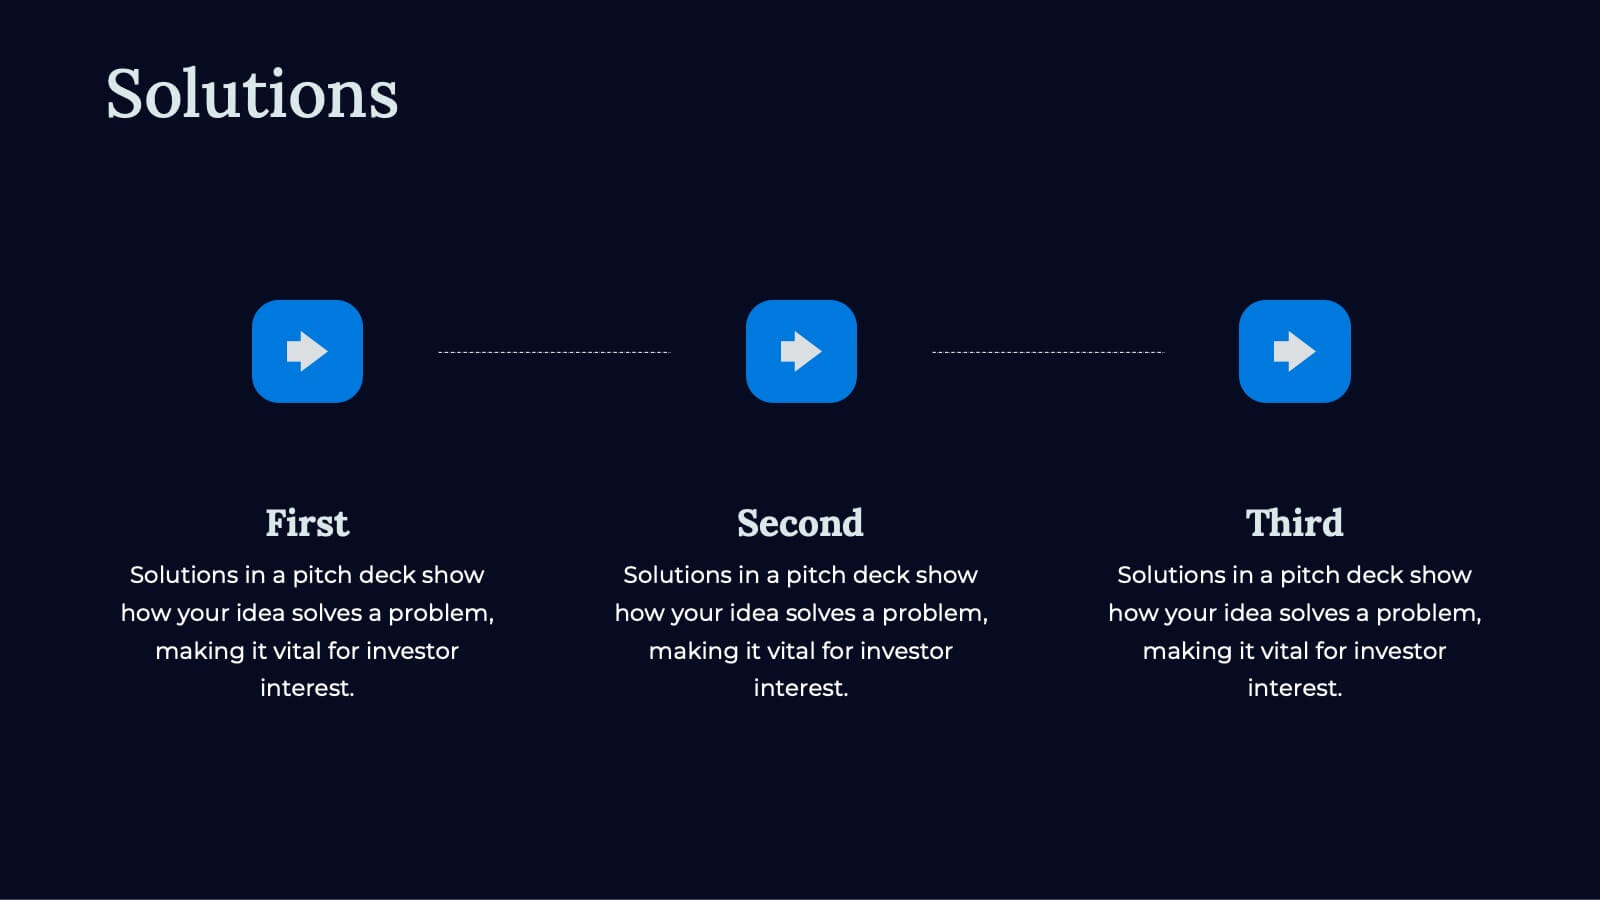
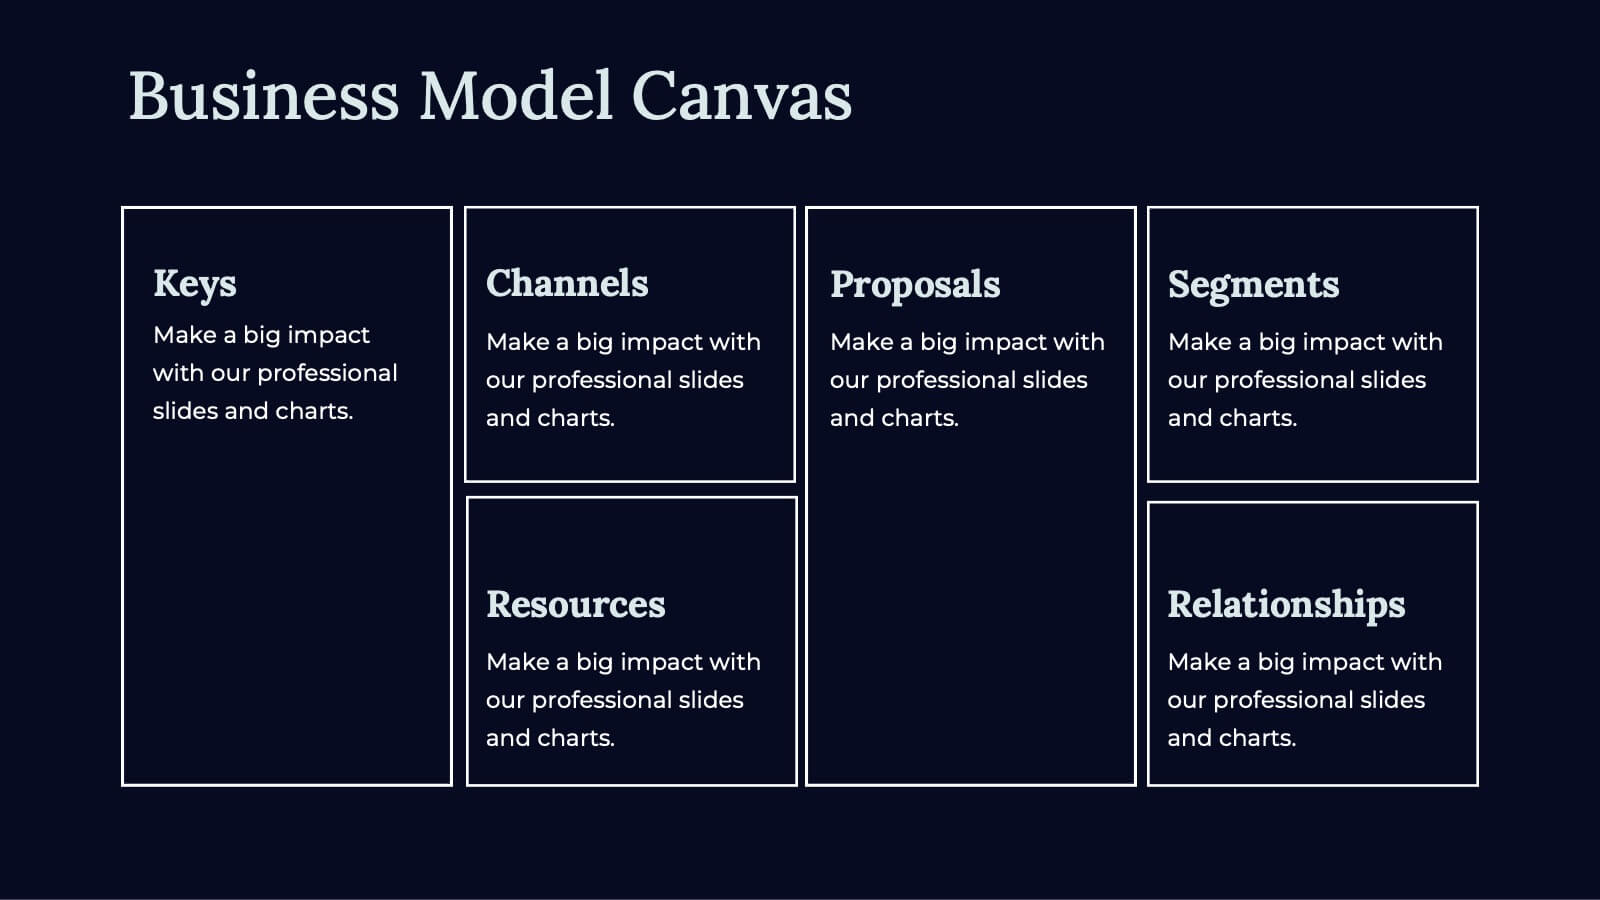
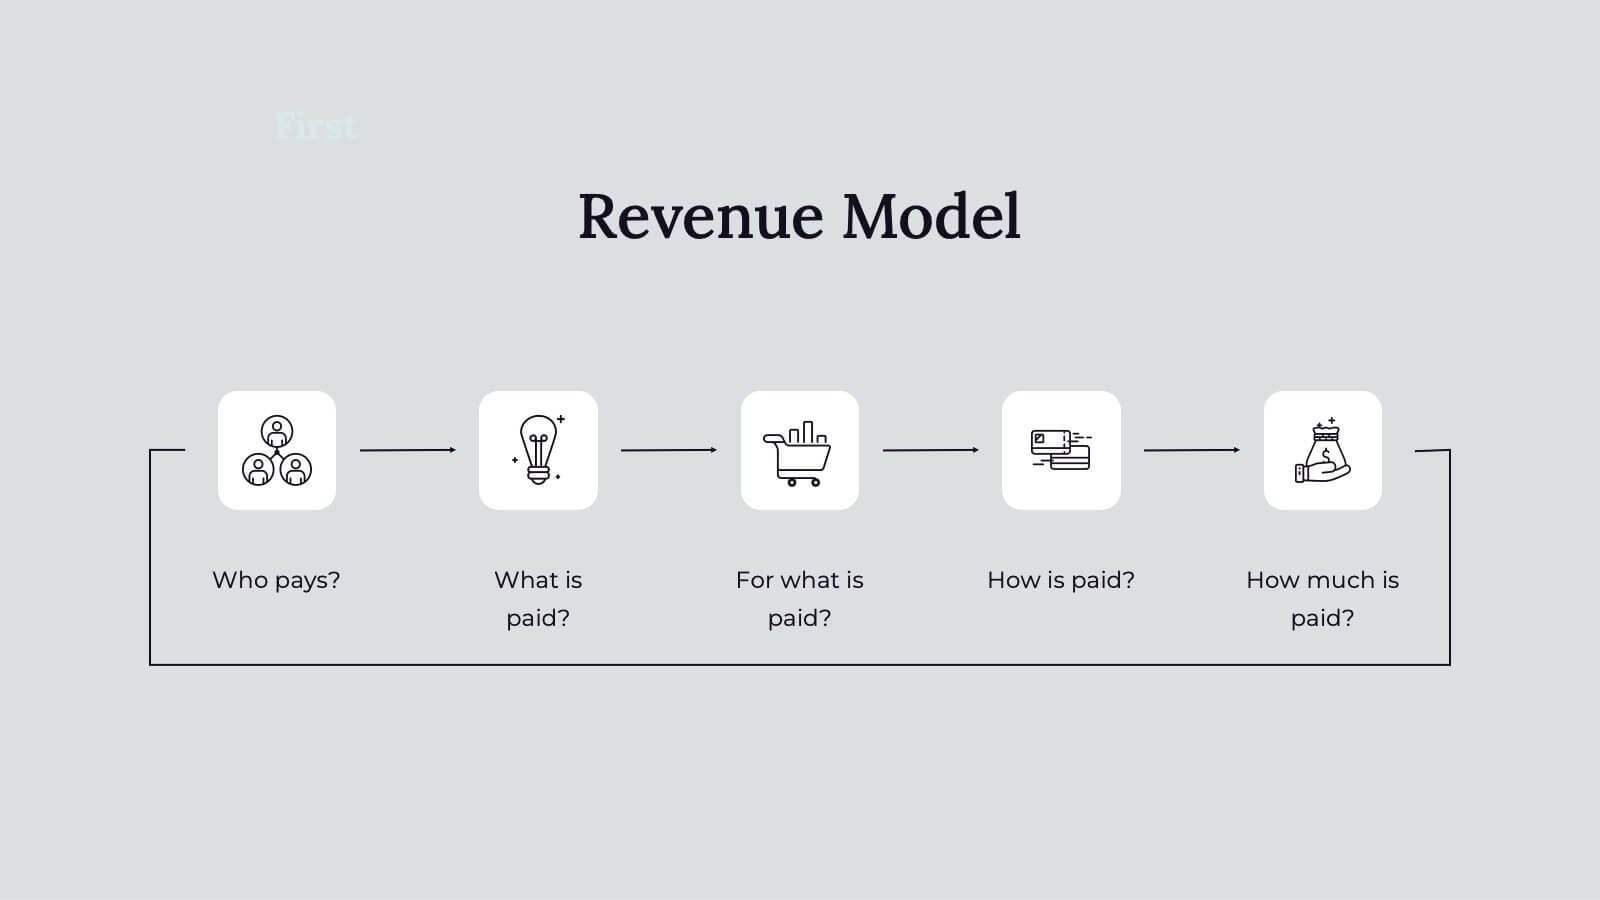
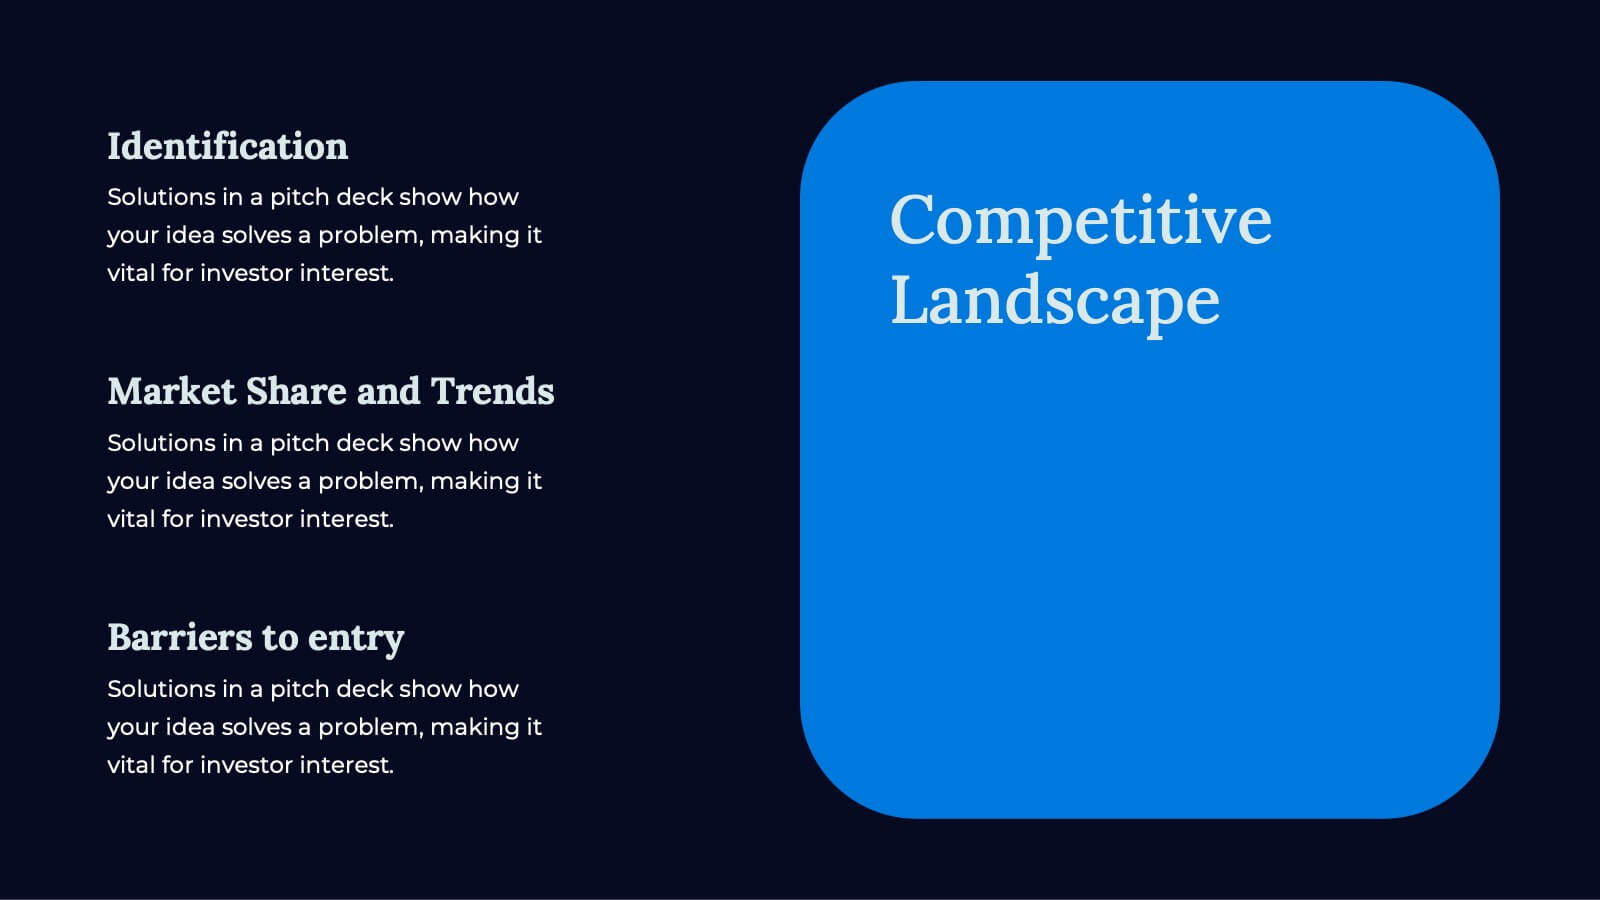
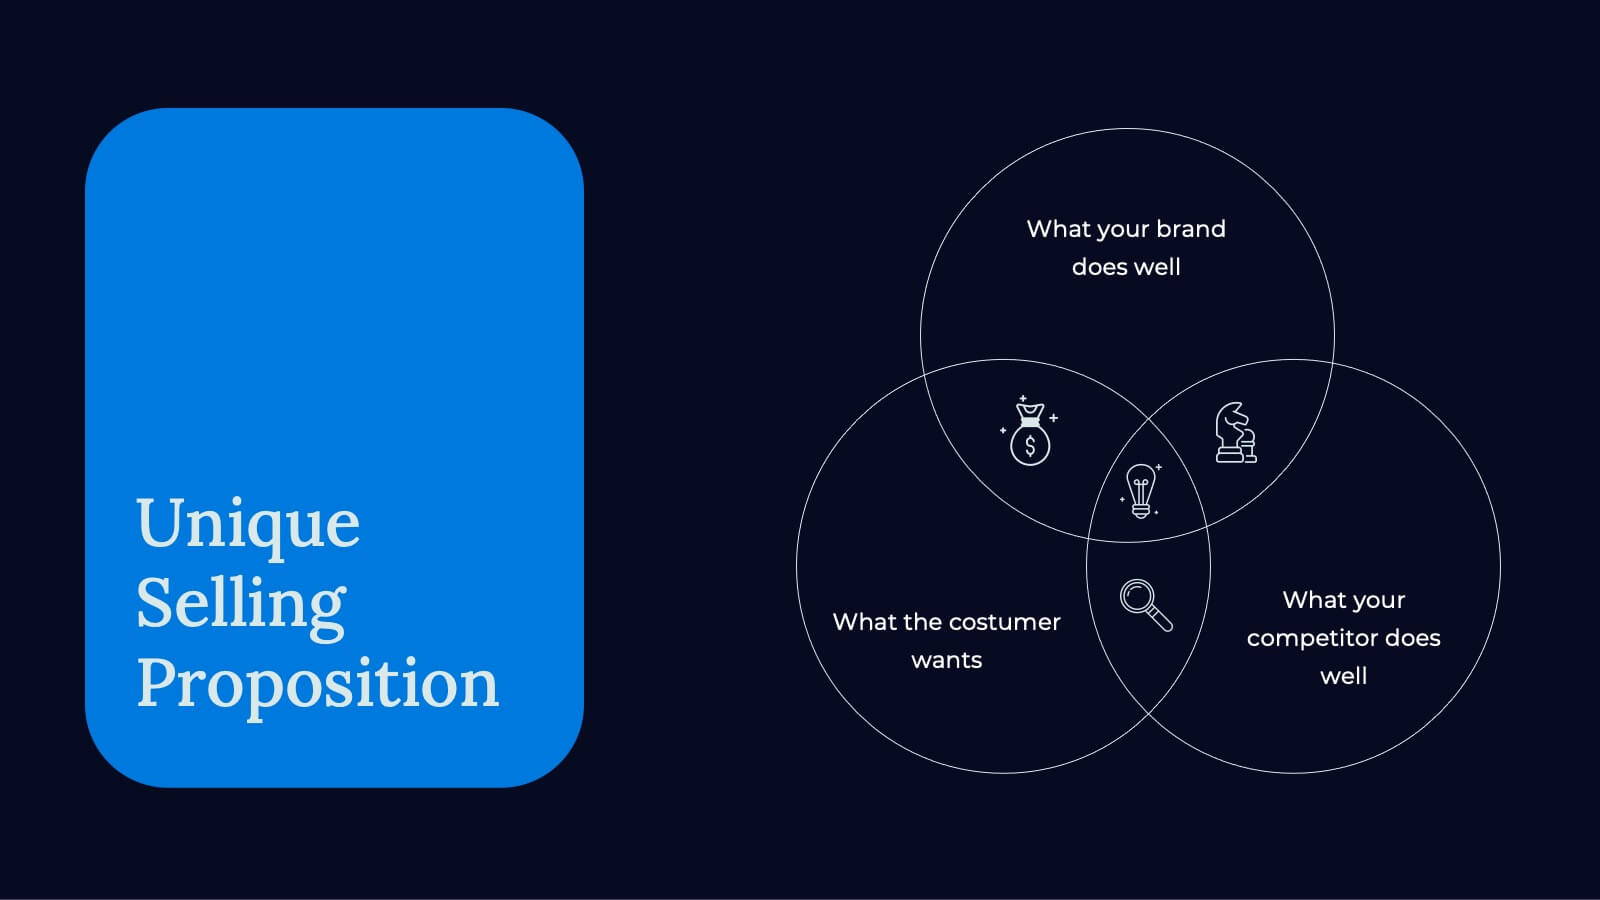
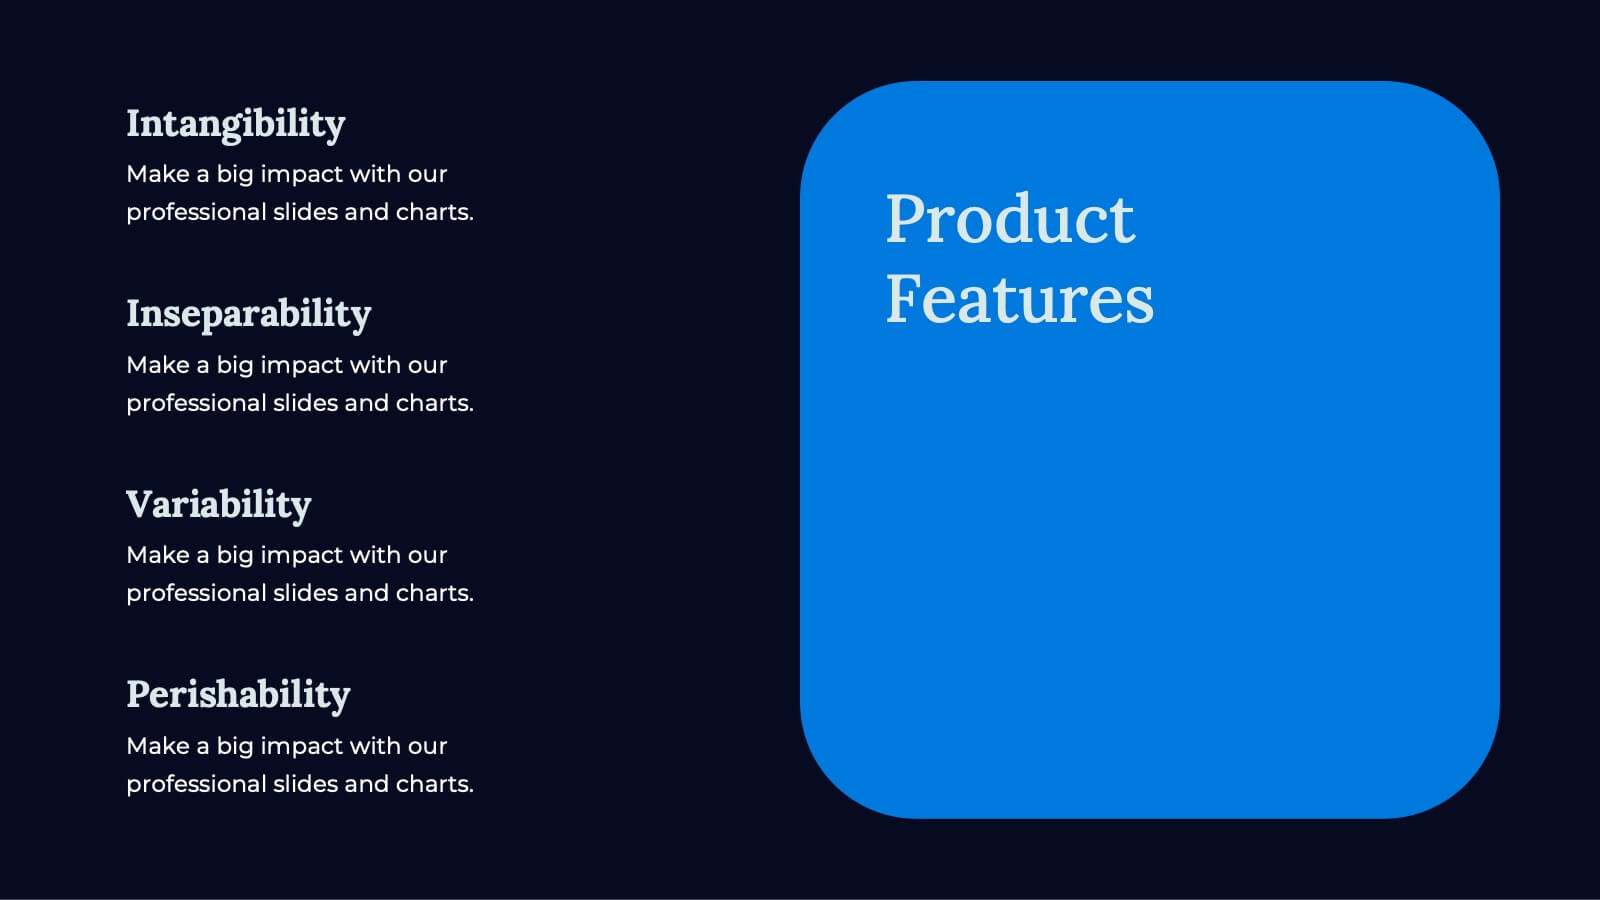
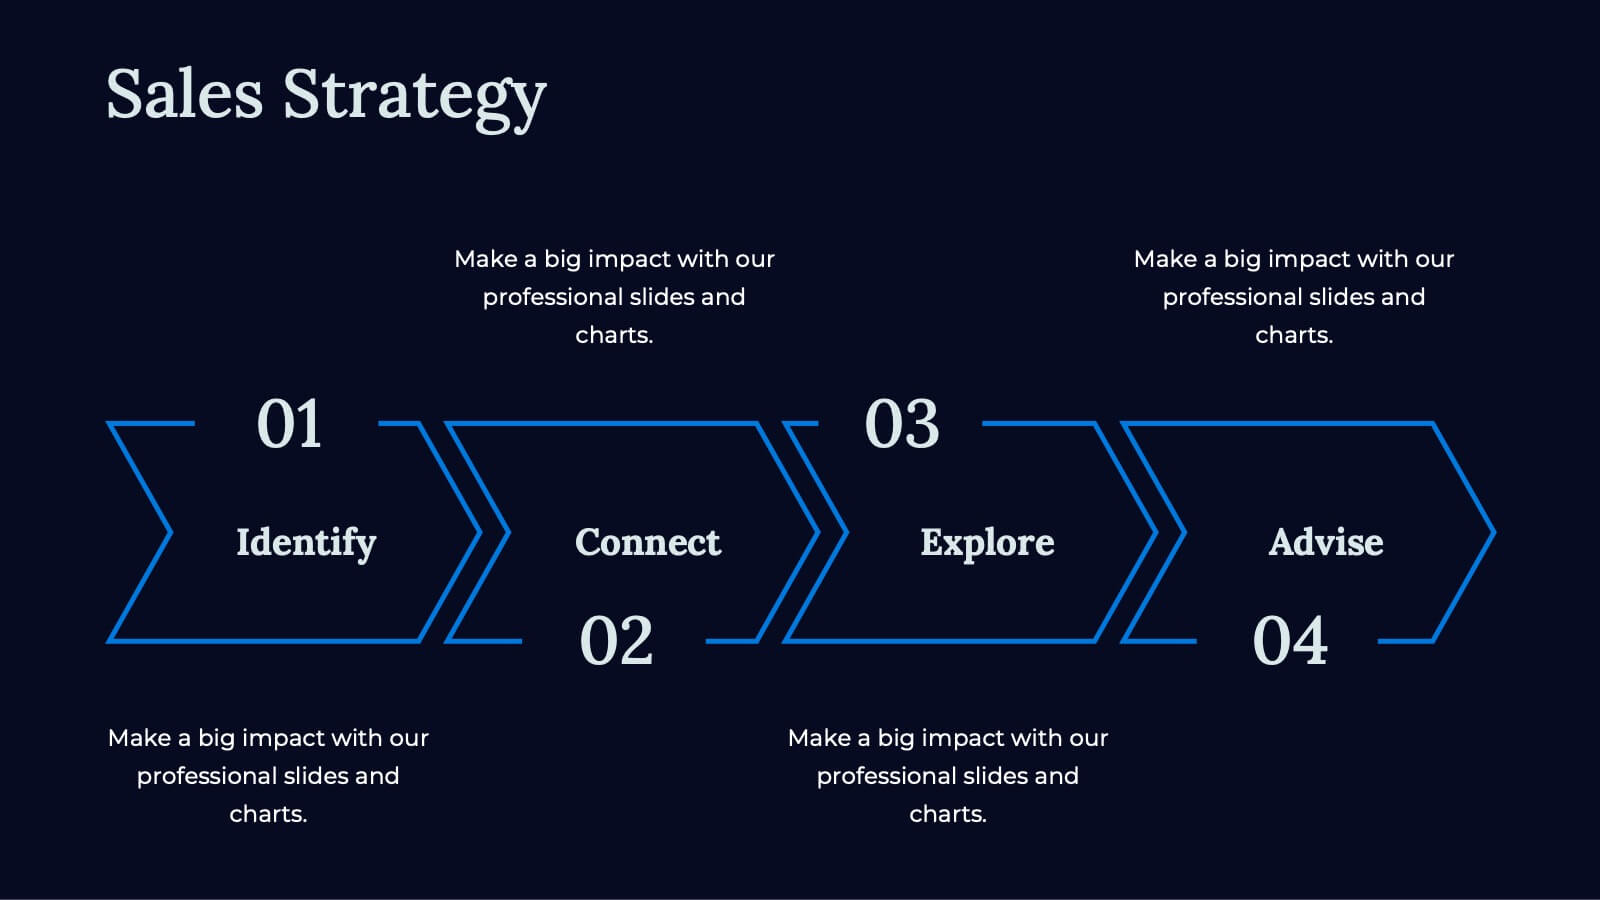
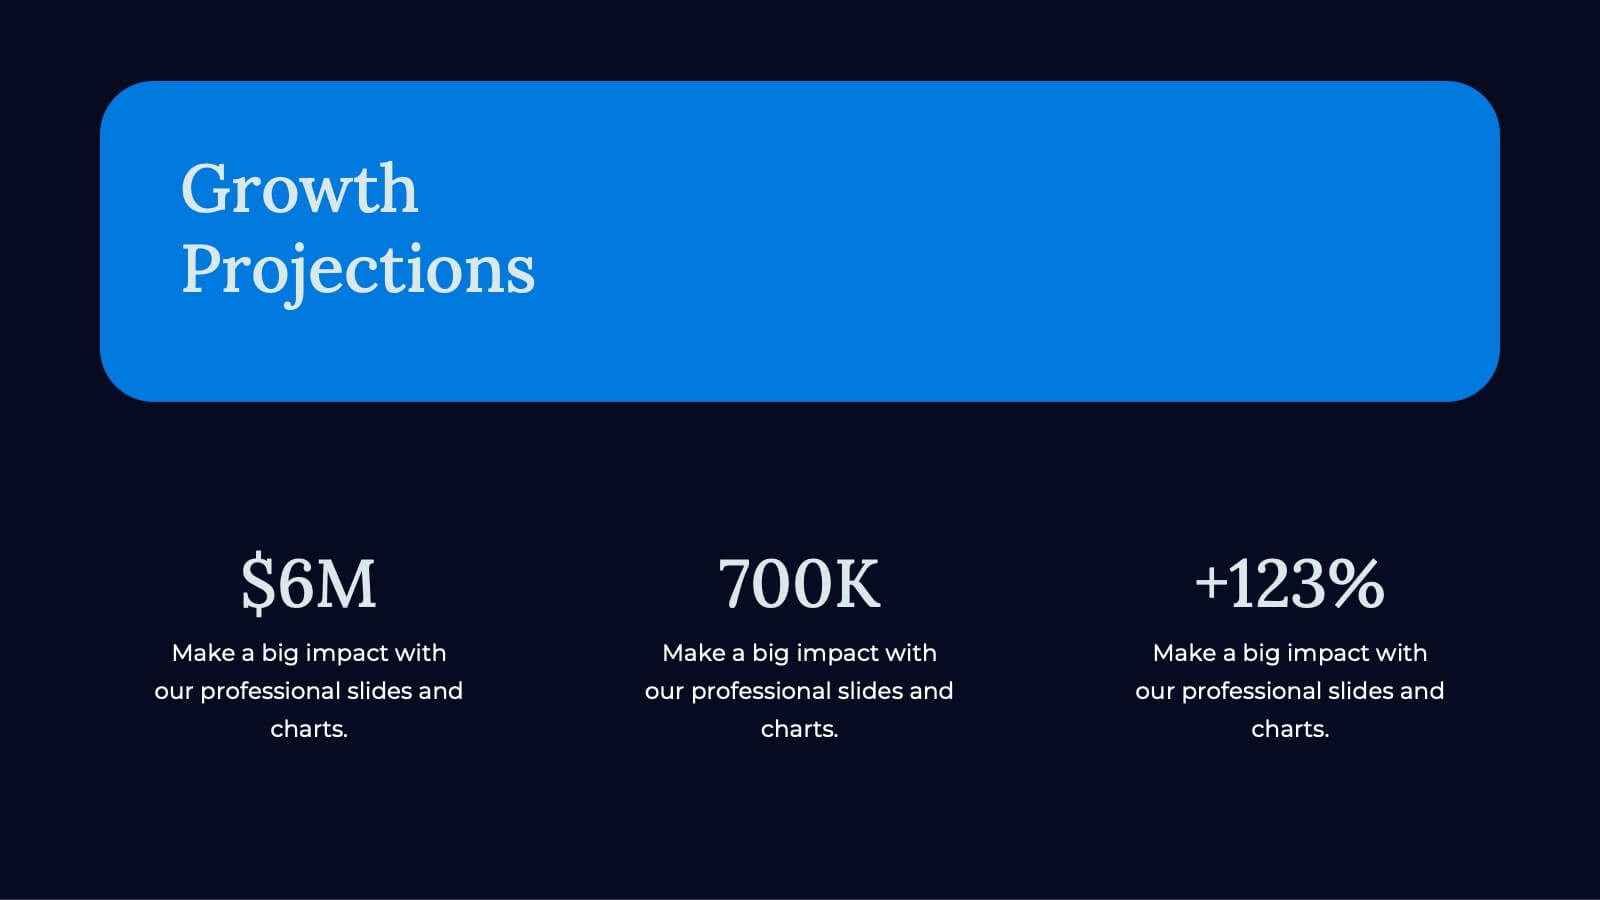
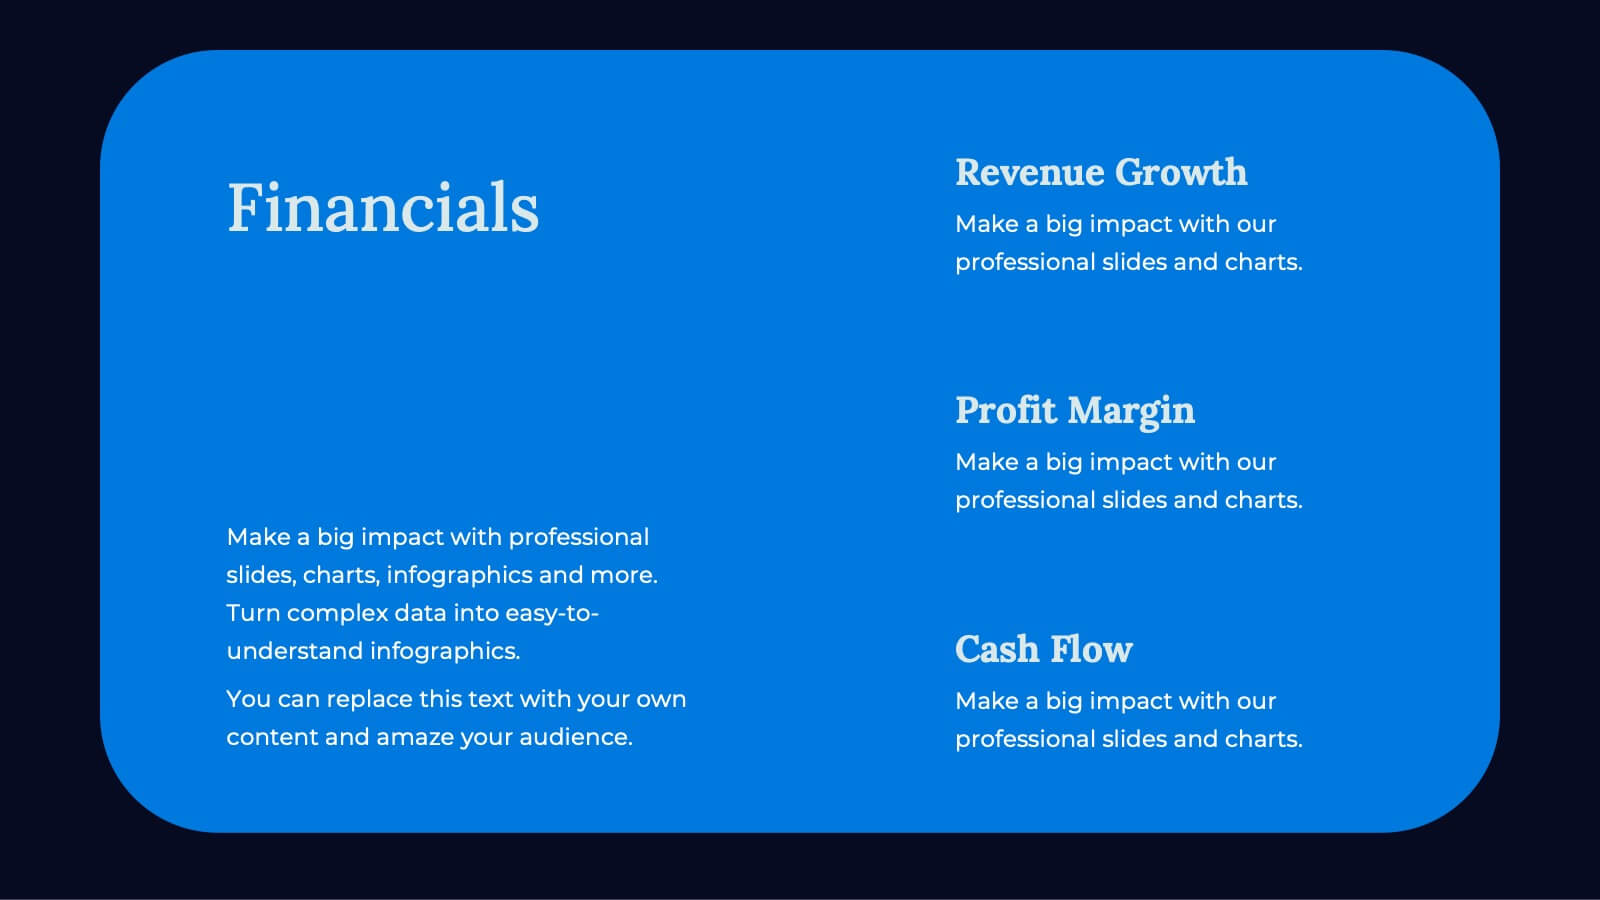
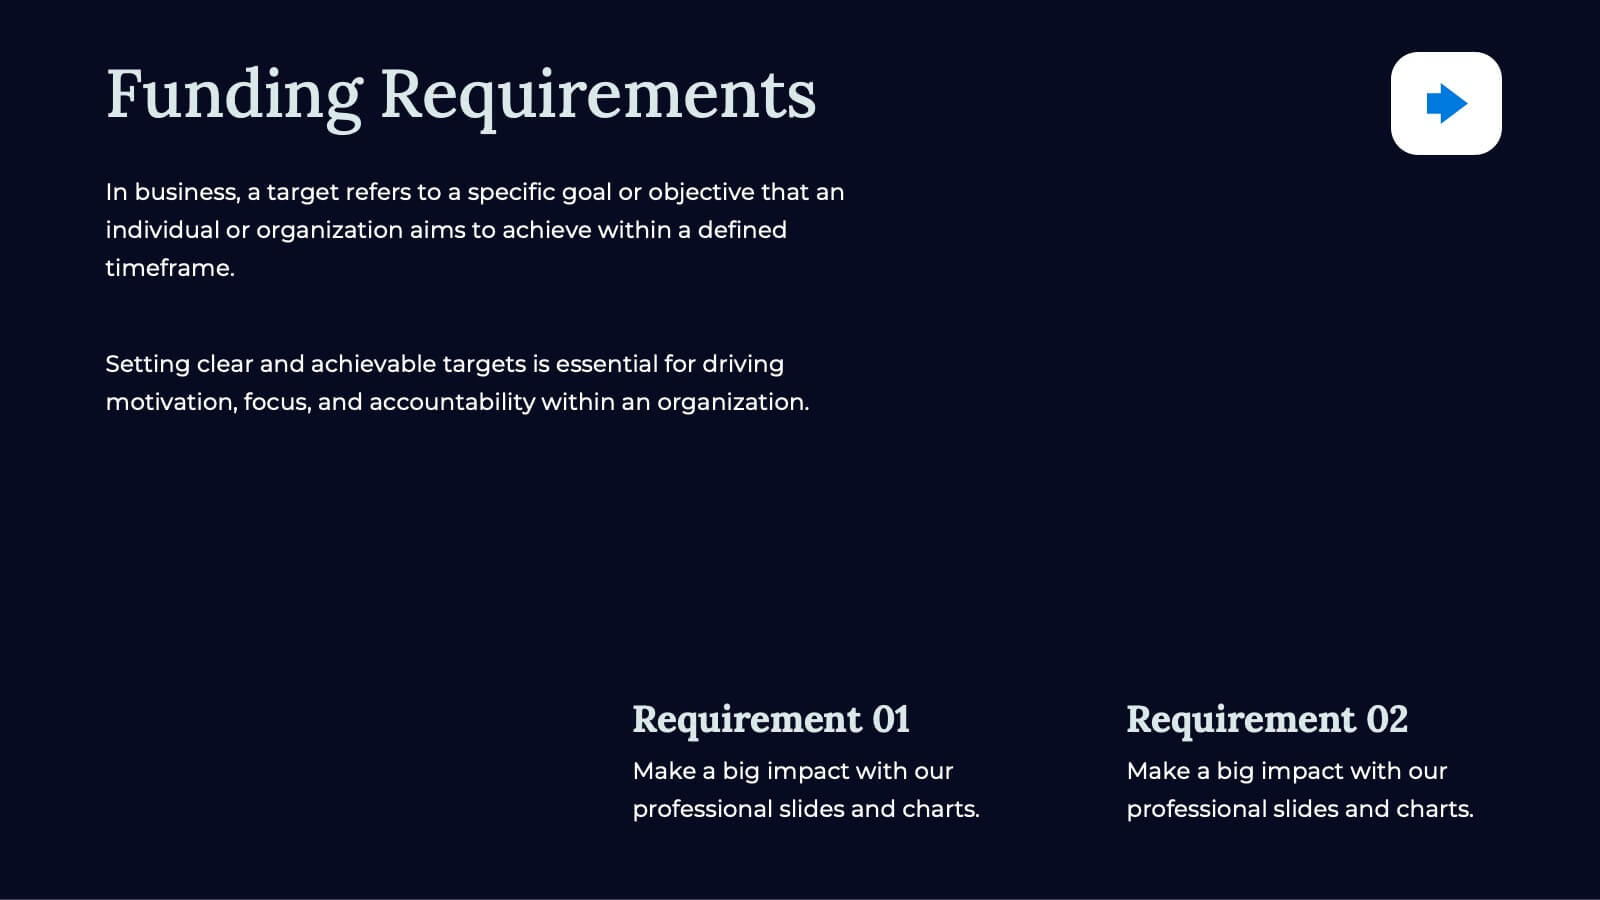
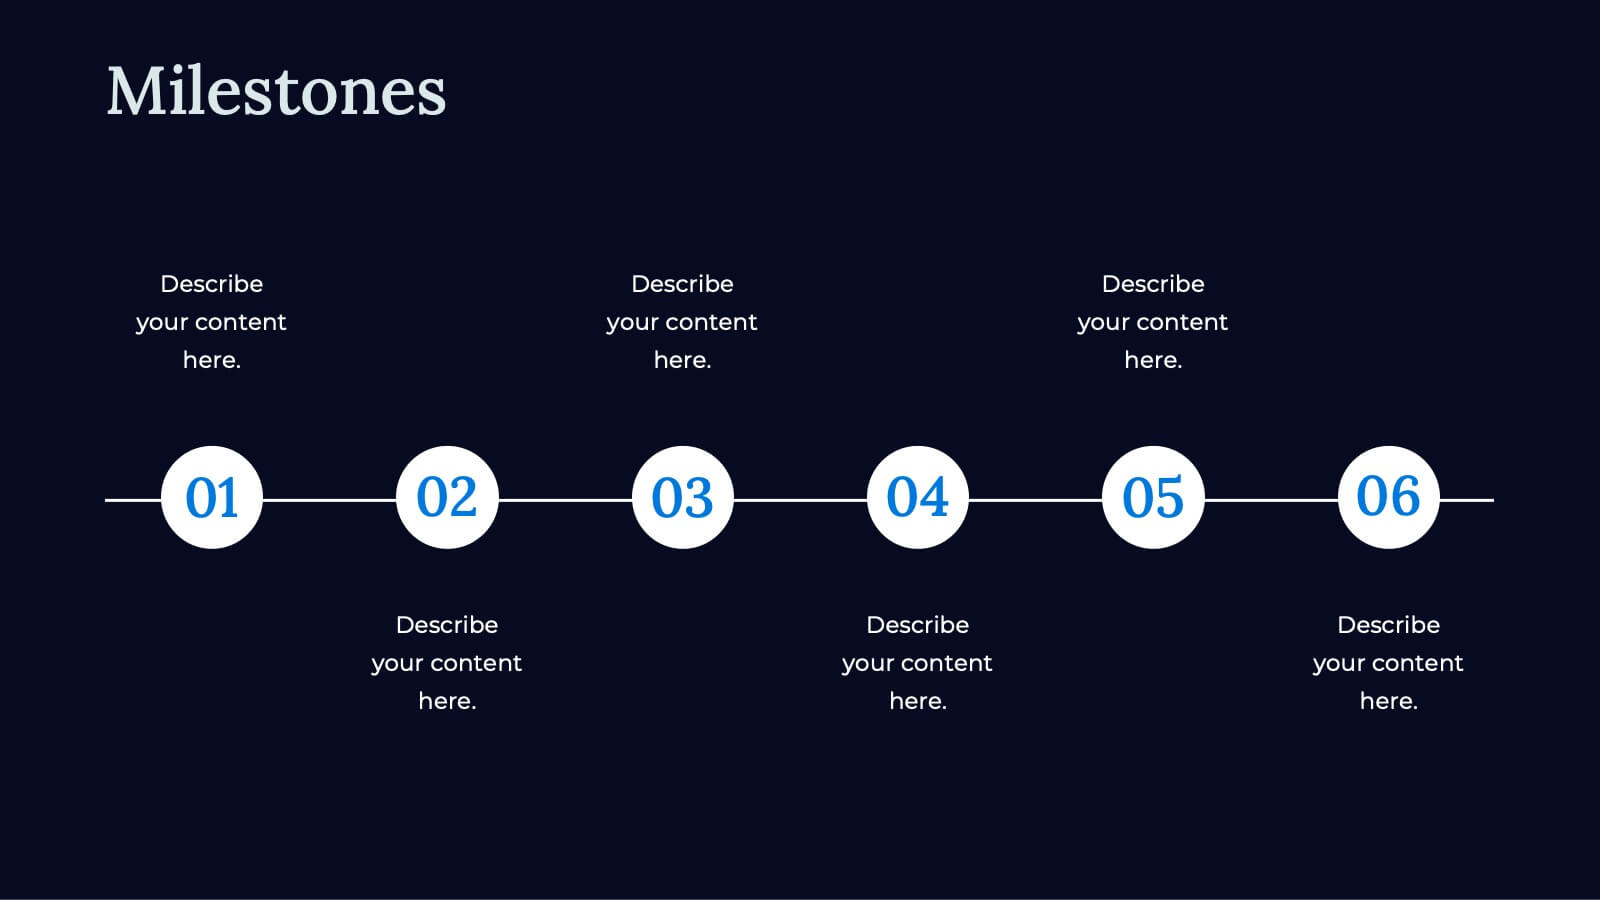
Apex Business Idea Pitch Deck Presentation
Craft powerful business pitch decks with this sleek template. Present your company overview, problem statement, solutions, and market opportunity. Showcase your business model, revenue model, competitive landscape, and unique selling proposition. Perfect for highlighting financials, growth projections, and funding requirements. Compatible with PowerPoint, Keynote, and Google Slides. Impress investors and stakeholders with clear, concise, and visually appealing presentations.


20 slides
Nightshade Design Portfolio Presentation
The Design Portfolio Presentation Template offers 20 slides to showcase your creative work, including design briefs, elements, processes, and feedback. Perfect for professionals to highlight projects with a modern, vibrant layout. Fully editable and compatible with PowerPoint, Keynote, and Google Slides.
6 slides
Arrow Process Infographic
The Arrow Process Infographic offers a dynamic and directional flow to represent various stages or steps in a process. This template is designed with sharp arrows pointing the way forward, symbolizing progress and direction. Each arrow segment provides space for text to describe the step or milestone, making it an excellent tool for illustrating sequences,or timelines. The colors can be customized to match corporate branding or to highlight different phases distinctly. Suitable for PowerPoint, Google Slides, and Keynote presentations, this infographic can be effortlessly integrated into professional slideshows or training materials, ensuring an impactful delivery of process-related information.


6 slides
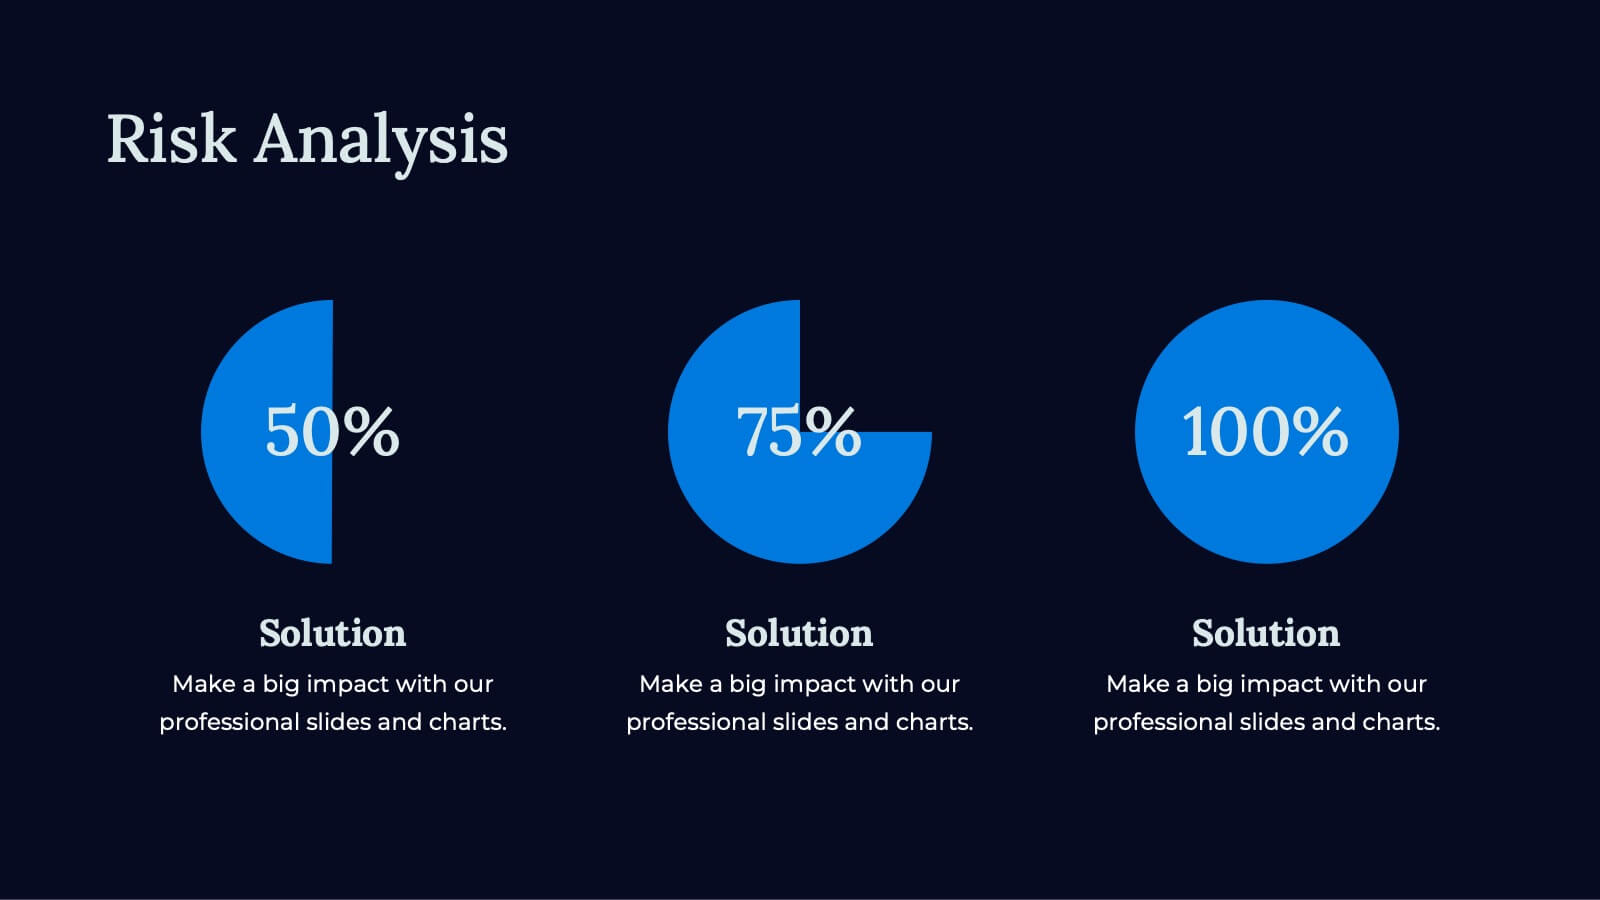
Security Strategy and Risk Management Presentation
Keep your data safe and your strategy sharp with this modern, professional template built to explain protection frameworks, risk mitigation, and security planning. Its clean visuals make complex concepts easy to understand for teams and clients alike. Fully compatible with PowerPoint, Keynote, and Google Slides for effortless editing and presentation.