


Features
- 4 Unique slides
- Fully editable and easy to edit in Microsoft Powerpoint, Keynote and Google Slides
- 16:9 widescreen layout
- Clean and professional designs
- Export to JPG, PDF or send by email


Do you have any questions?
Recommend


3 slides
Supply Chain and Transportation Map Presentation
Navigate the complexities of modern logistics with this engaging visual designed to map out each phase of product movement. This infographic breaks down the supply chain and transportation process into three clear stages—road, lift, and ship—making it easy to explain workflows or illustrate system improvements. Compatible with PowerPoint, Keynote, and Google Slides.


12 slides
Employee Feedback Smile Score Presentation
Track employee sentiment with this engaging employee feedback smile score template! Featuring a visually intuitive gauge design, this layout helps HR teams and managers assess workplace satisfaction and identify areas for improvement. Ideal for performance reviews, team surveys, and organizational assessments. Fully customizable and compatible with PowerPoint, Keynote, and Google Slides.


4 slides
Healthcare Medical Infographic Presentation
Bring your healthcare insights to life with a clean, calming design that makes complex medical data easy to follow. This presentation highlights key health metrics, patient information, and wellness topics using simple visuals and structured layouts for clarity. Fully compatible with PowerPoint, Keynote, and Google Slides.


7 slides
Marketing Calendar Schedule Organizer
Stay on top of every post, caption, and campaign with this simple and stylish visual planner—built to make your content calendar finally feel manageable. Designed to help marketers organize platforms, posting times, and links all in one place, it’s your go-to tool for streamlined weekly planning. Fully compatible with PowerPoint, Keynote, and Google Slides.


24 slides
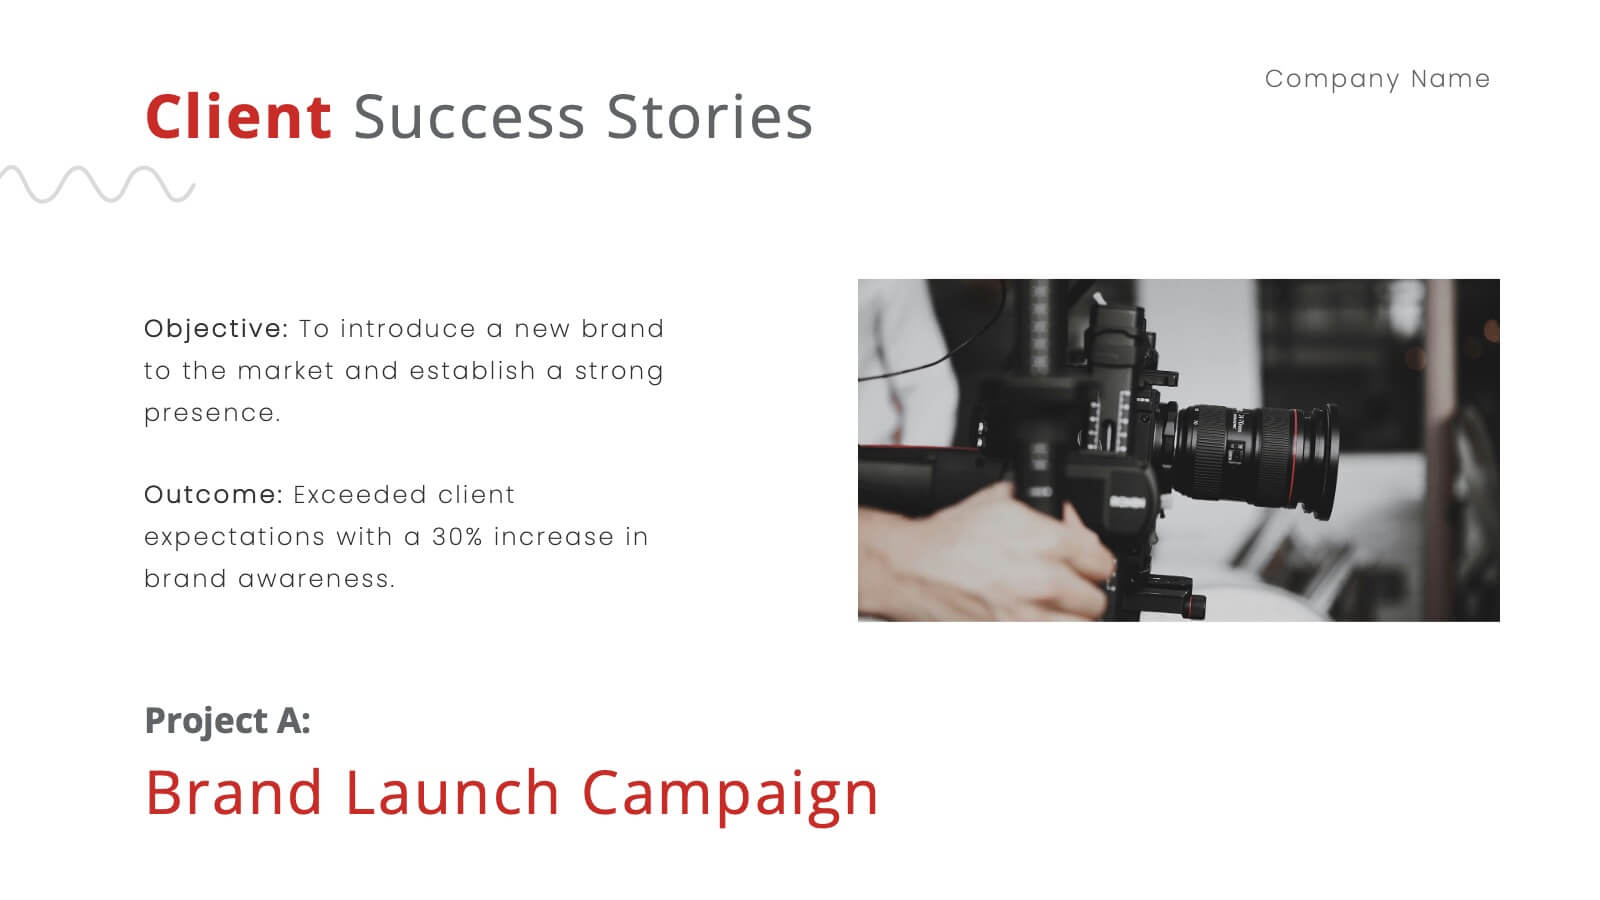
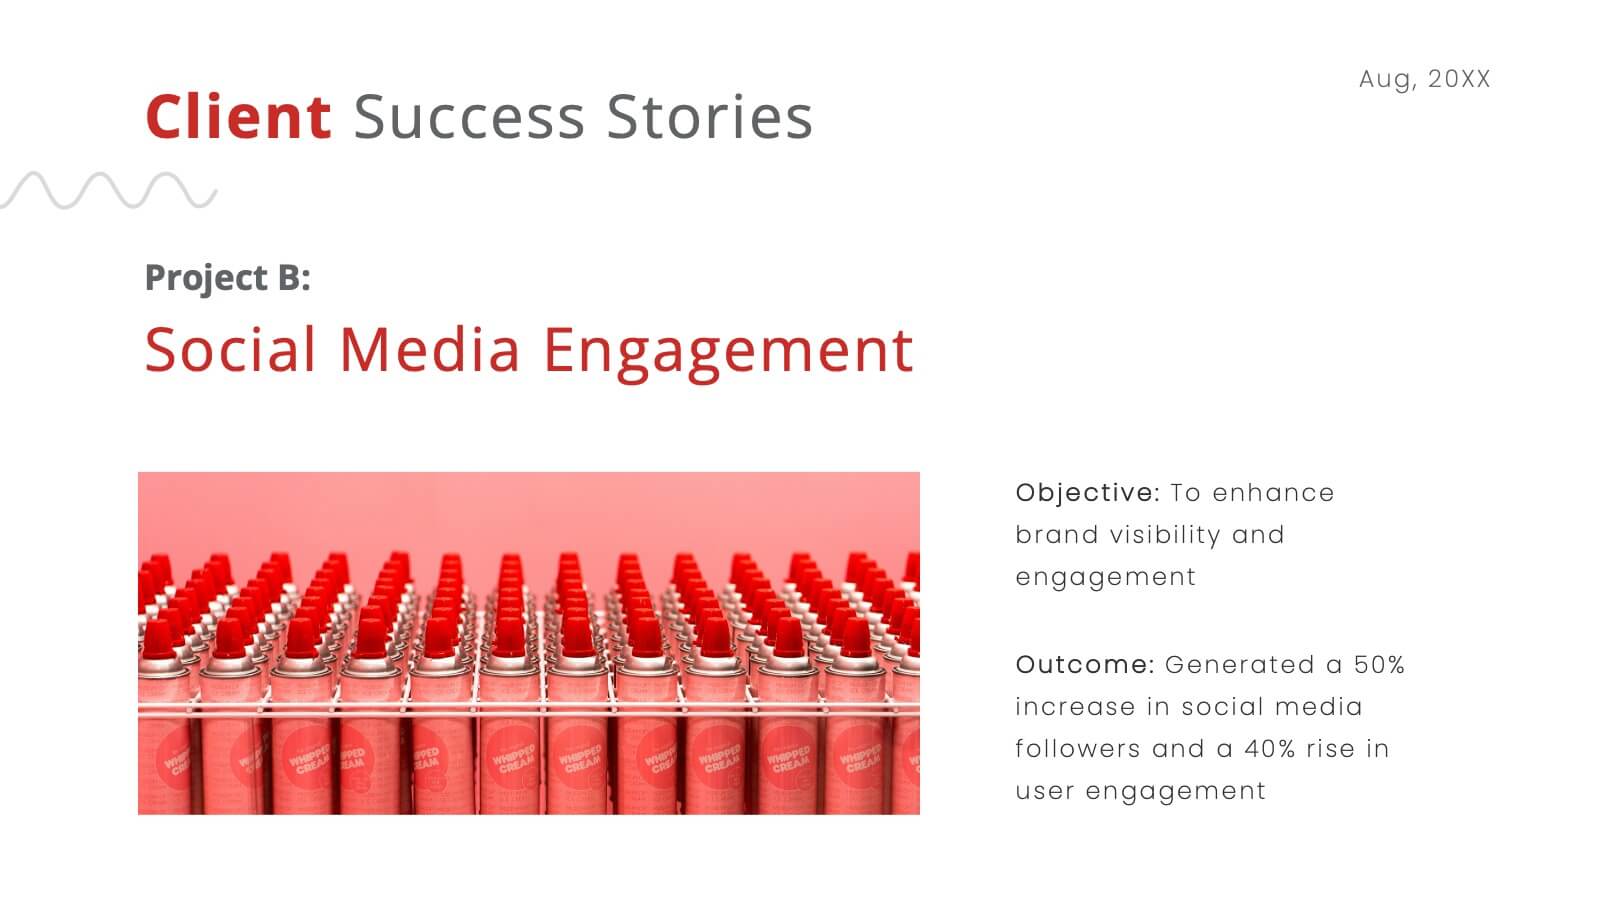
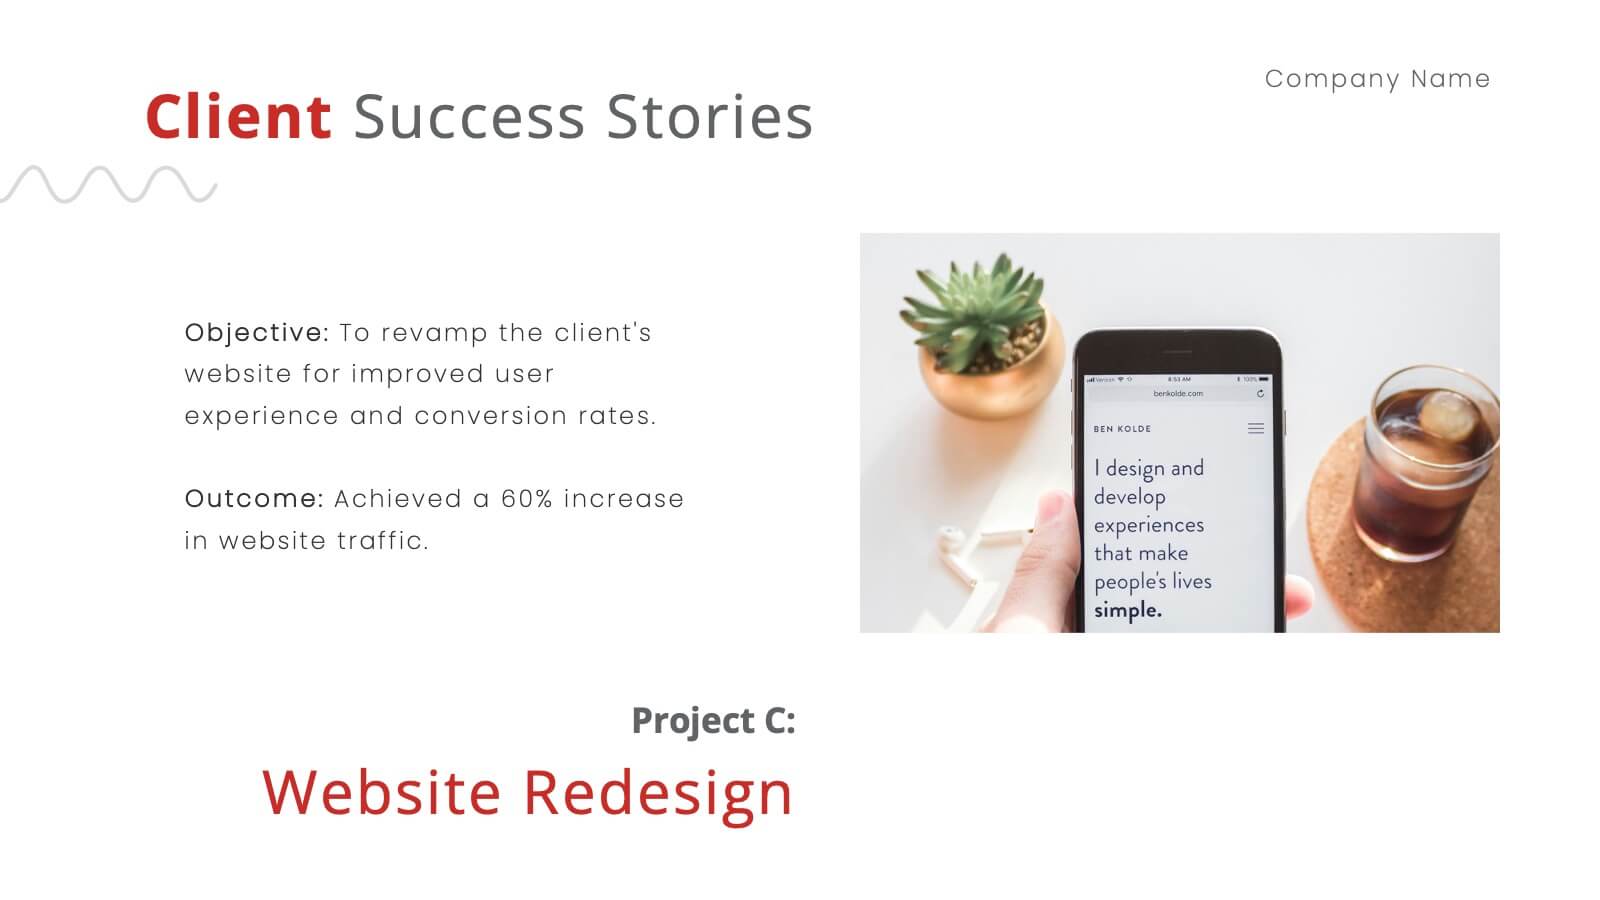
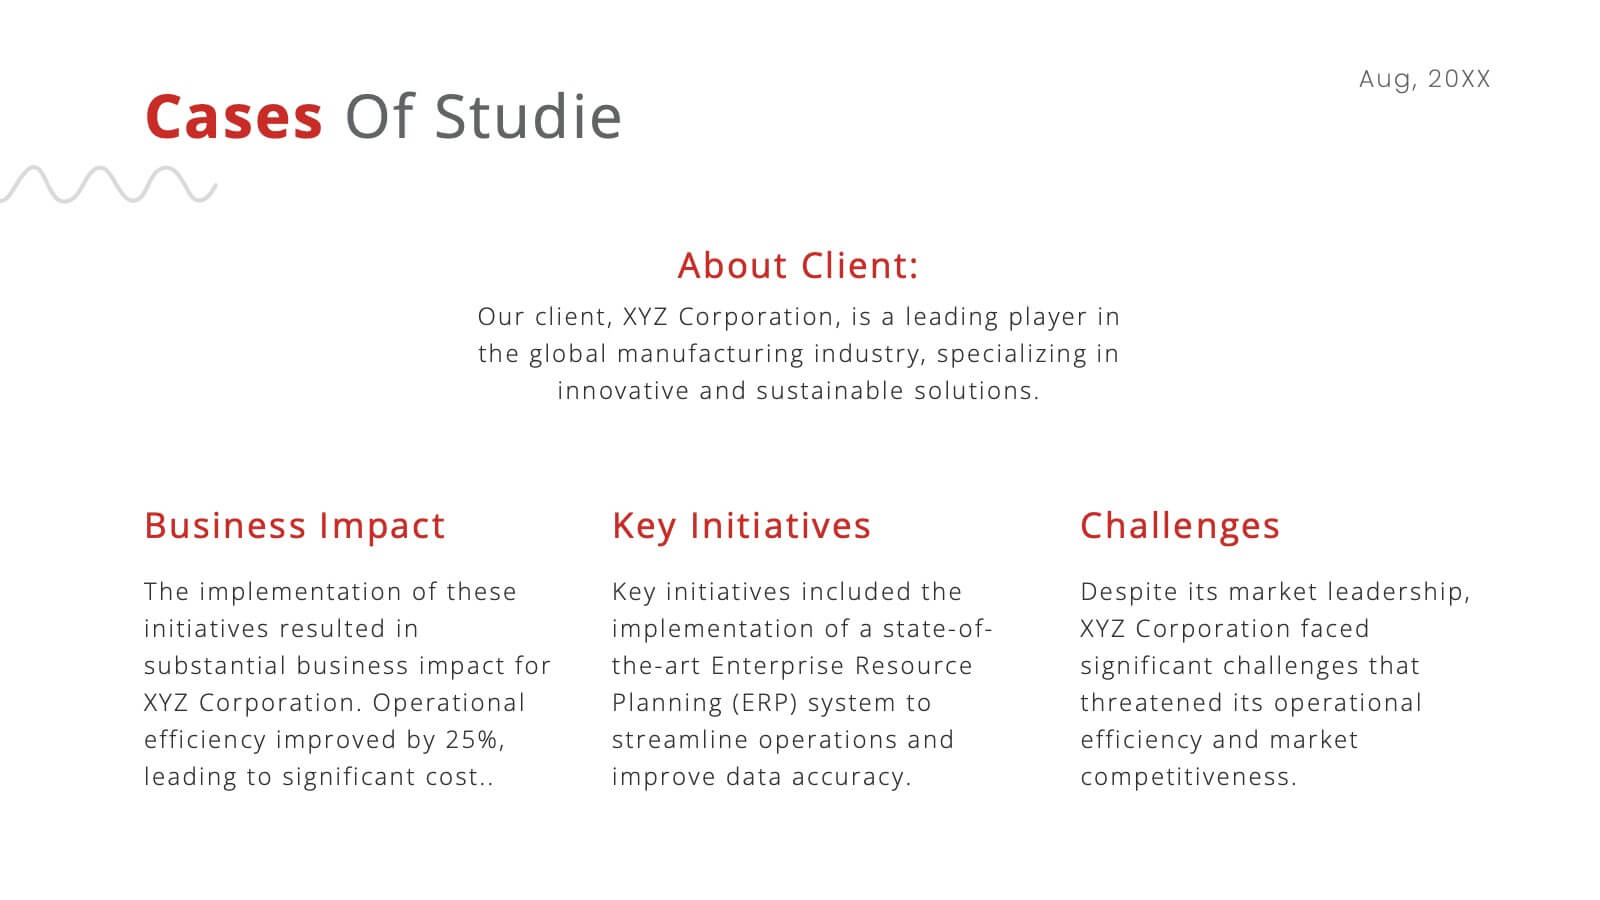
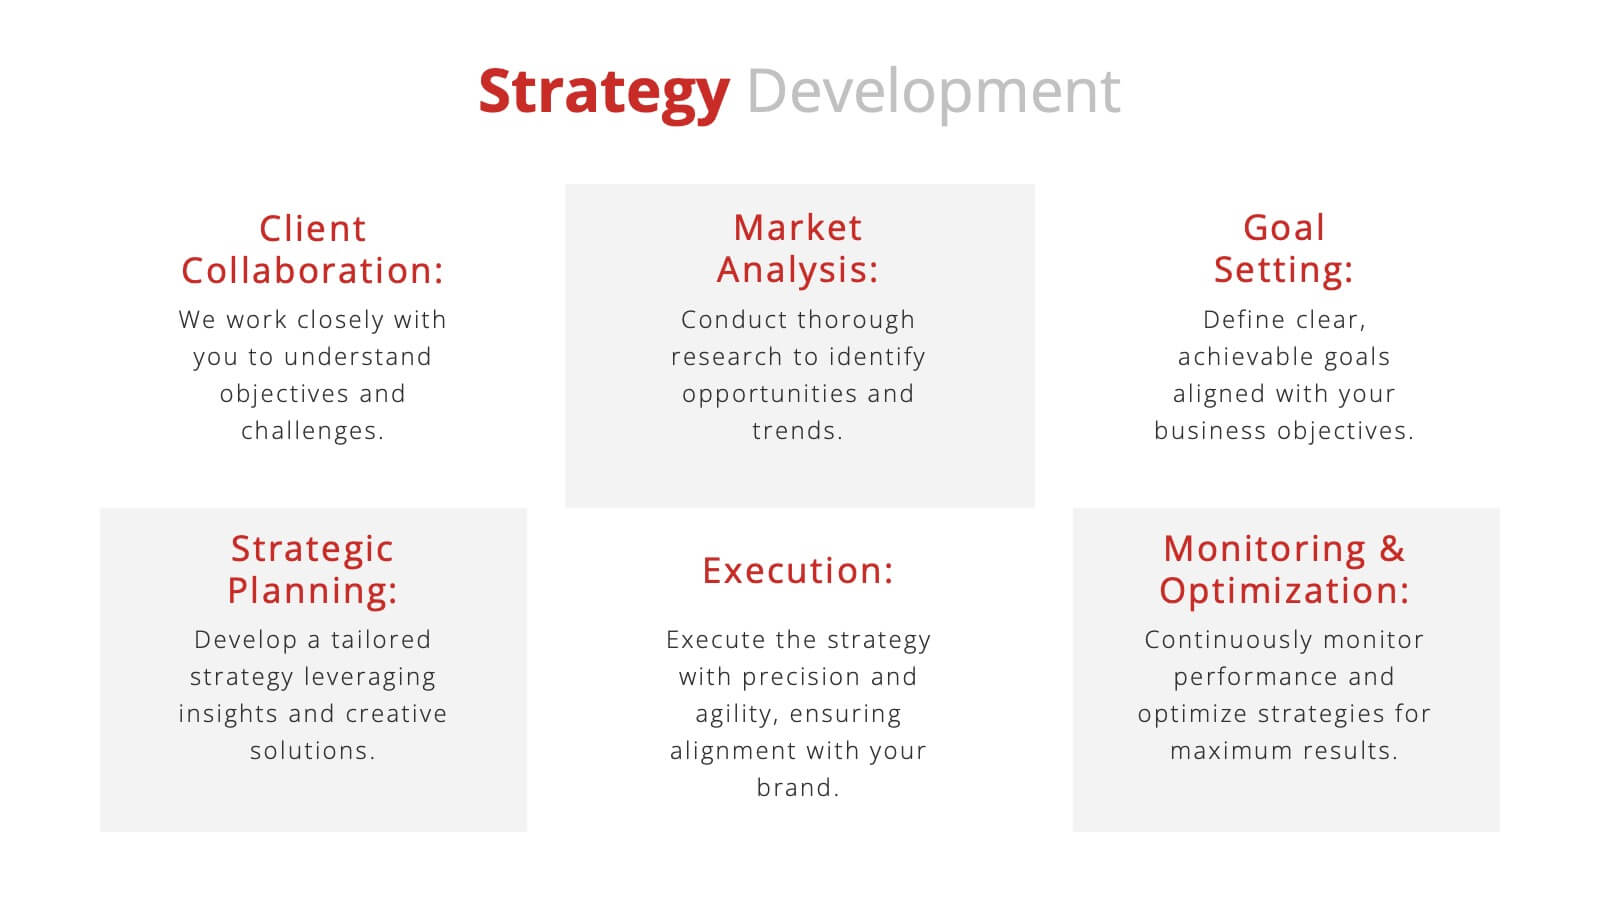
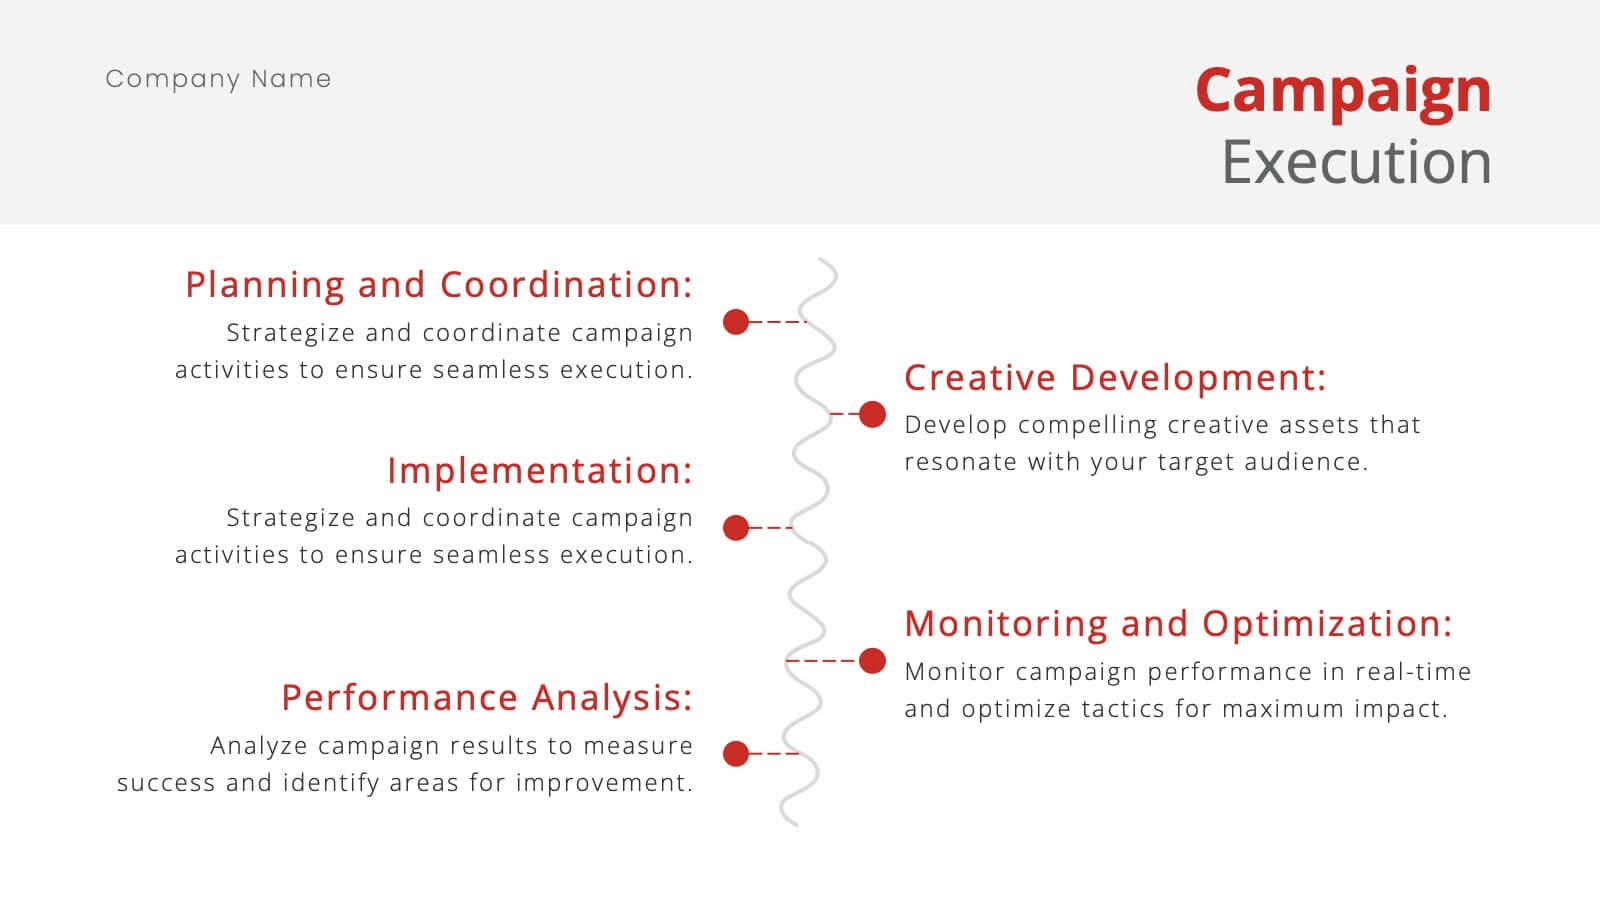
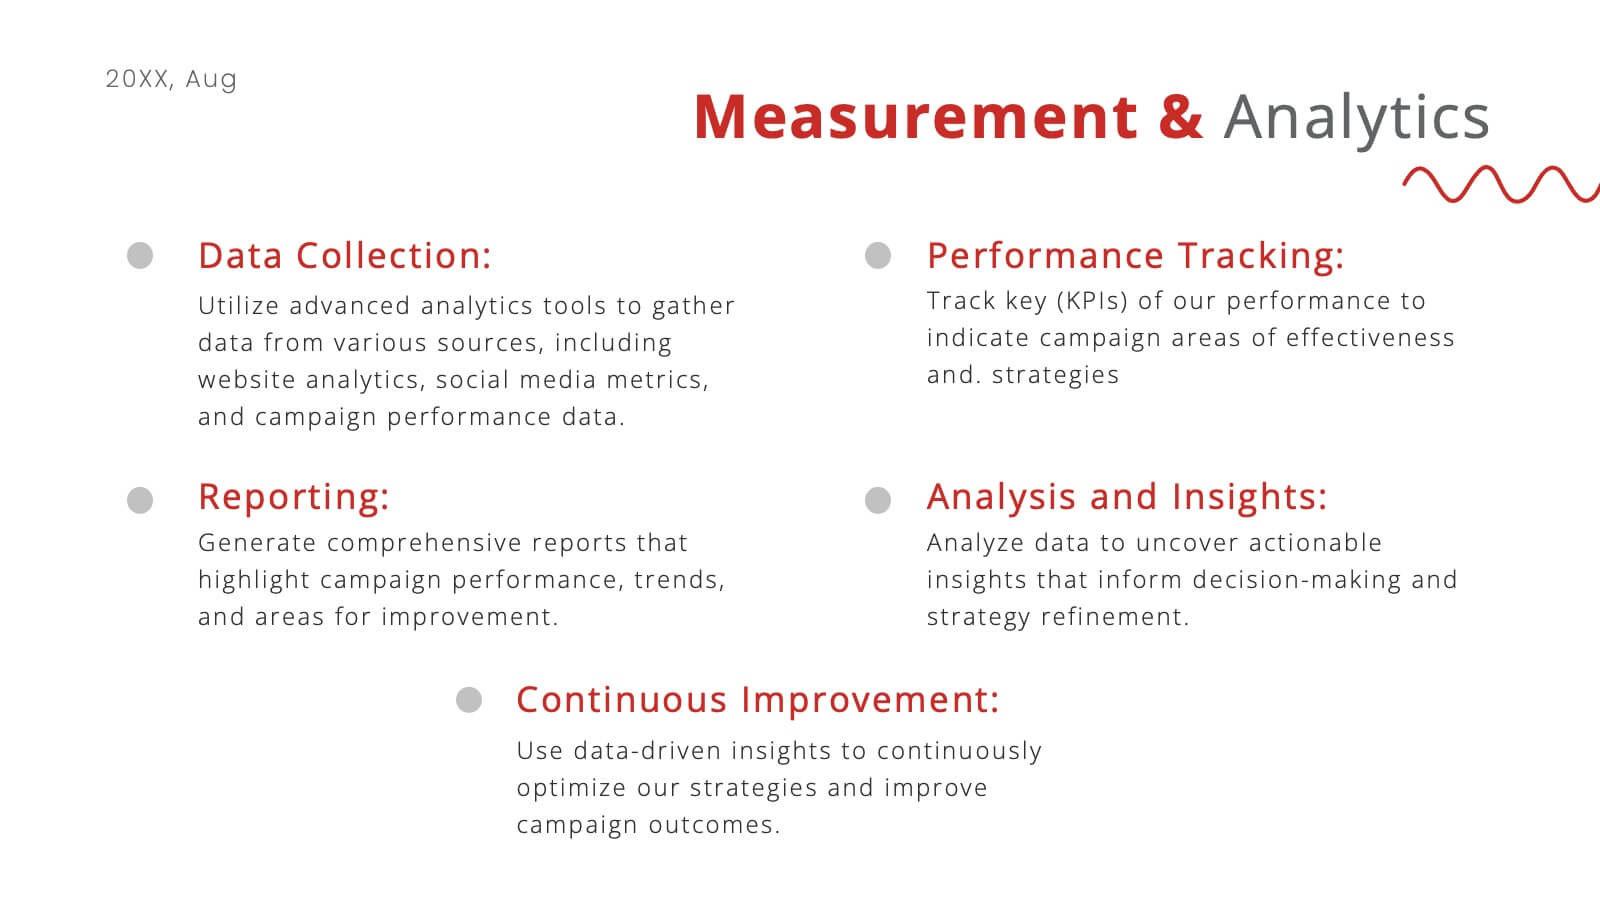
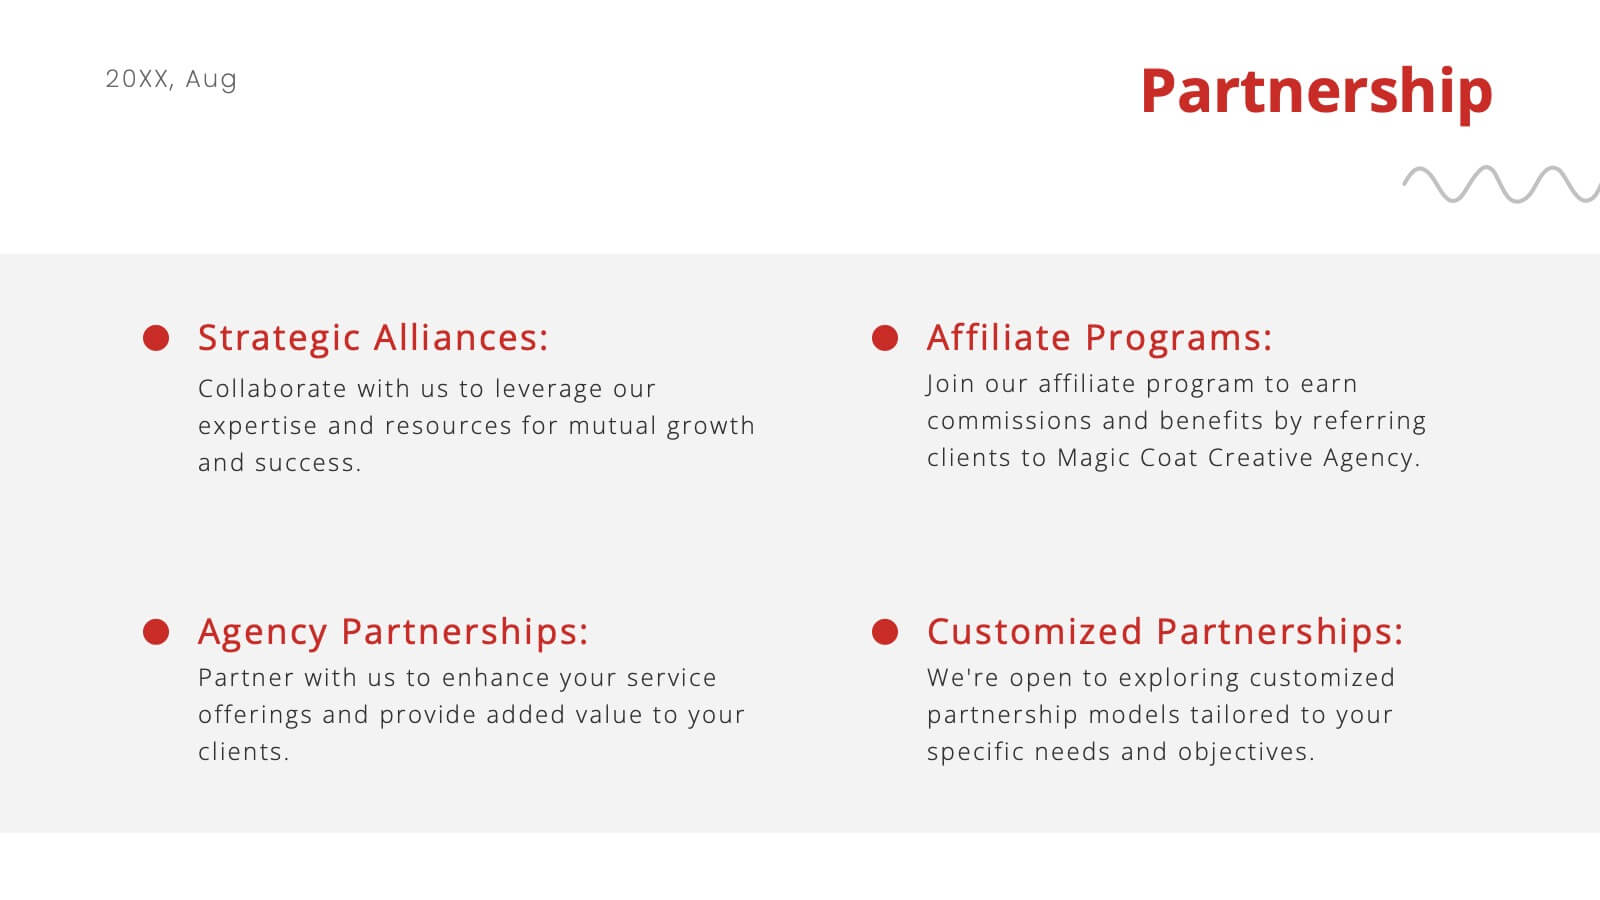
Nickel Advertising Agency Proposal Presentation
Take your advertising agency to the next level with this sleek and modern presentation template! Highlighting your services, team, success stories, and marketing strategies, it’s the perfect tool to showcase your agency’s strengths and capabilities. Fully customizable and compatible with PowerPoint, Keynote, and Google Slides, this template is ideal for impressing potential clients and partners.


6 slides
Statistical Data Analysis Presentation
Delve into the details with the "Statistical Data Analysis" presentation templates, designed to simplify complex information into digestible insights. These templates feature interconnected gears symbolizing the intricate processes of data analysis, ideal for statisticians and analysts looking to present their findings effectively. Fully compatible with PowerPoint, Keynote, and Google Slides, they are a must-have for anyone presenting statistical data.


5 slides
Financial Market Trends and Forecast Presentation
Visualize economic shifts and data insights with this upward growth line infographic. Ideal for presenting financial forecasts, investment strategies, and market milestones, this layout features a stylized arrow path with icons, letter markers, and space for detailed annotations. Fully editable and compatible with PowerPoint, Keynote, and Google Slides.


7 slides
Housing Investment Strategy Presentation
Visualize housing strategies with this clean, key-focused layout. Featuring a central house-and-key icon flanked by six sections, this slide is perfect for outlining investment stages, market insights, or project milestones. Fully editable in Canva, PowerPoint, and Google Slides—ideal for real estate professionals, developers, or analysts presenting actionable housing strategies.


20 slides
Professional Business Presentation
Deliver impactful insights with our Professional Presentation template. Ideal for enterprise projects, it features slides for introductions, methodology, budget breakdowns, and more. This template facilitates thorough business analyses and clear communication of objectives and results, compatible with PowerPoint, Keynote, and Google Slides.


4 slides
Key Business Insights Executive Summary
Present your insights like a pro with this dynamic, timeline-inspired slide that makes key data points easy to follow. Designed to highlight four major takeaways or milestones, this visual format is ideal for summarizing business progress, strategy updates, or operational highlights. Fully editable in PowerPoint, Keynote, and Google Slides.


7 slides
Scrum Sprints Planning Presentation
Kick off your workflow with a dynamic visual that maps out every phase of your team’s process in a clean, structured layout. This presentation helps explain planning cycles, task sequencing, and collaborative decision-making in a clear, engaging format. Fully compatible with PowerPoint, Keynote, and Google Slides.


7 slides
Asia Map Overview Infographic
Dive into the vast and varied landscape of Asia with our collection of infographic slides designed to provide an insightful overview of the continent. These templates are ideal for educators, business professionals, and researchers looking to present data on Asia’s geography, demographics, economic status, and more. Each slide is meticulously crafted to display information clearly and attractively, using maps, charts, and icons to represent statistical data and trends across Asia. The different shades and colors used in the maps distinguish between countries, regions, or data points, making it easy for audiences to grasp complex information at a glance. These templates are fully customizable, enabling you to highlight specific areas or data according to your presentation needs. Whether discussing population growth, economic development, or environmental concerns, these slides are an excellent resource for conveying detailed information in a visually engaging format.


7 slides
Time Management Strategies Infographic Presentation
Time management is the process of planning, organizing, and allocating time effectively to achieve specific goals and objectives. This simple and professional template shows you the basics of time management. It uses a combination of bullet points, tables and illustrations to give you the information you need in a practical form. Use this presentation as a step-by-step guide on how you can become more efficient at managing daily business tasks. This infographic template is designed to help you manage your time and prioritize your actions by highlighting the different aspects of a task.


6 slides
End-to-End Value Chain Process Presentation
Visualize every link in your process with the End-to-End Value Chain Process Presentation. This modern chain diagram helps illustrate each stage of your business or production flow—from initial input to final output. It's ideal for strategy, supply chain, and operational planning. Fully editable in PowerPoint, Keynote, Canva, or Google Slides.


6 slides
Strategic Planning with PESTEL Presentation
Dive into comprehensive environmental scanning with our "Strategic Planning with PESTEL" presentation template. This layout meticulously breaks down Political, Economic, Social, Technological, Environmental, and Legal factors, enabling thorough market analysis and strategy formulation. Perfect for strategists and analysts, the template supports PowerPoint, Keynote, and Google Slides, facilitating a dynamic and engaging planning session.


20 slides
Chordstream Professional Portfolio Showcase Presentation
The Portfolio Presentation Template offers a modern and creative design, perfect for showcasing your projects, philosophy, and services. With 20 customizable slides, it includes sections for project highlights, pricing, client testimonials, and contact information. Compatible with PowerPoint, Keynote, and Google Slides, this template ensures professional impact for creatives.


4 slides
Risk vs Impact Matrix Layout Presentation
Visualize risk levels clearly with the Risk vs Impact Matrix Layout Presentation. This customizable template helps you assess and categorize potential risks based on their likelihood and impact, using a clear 3x3 color-coded grid. Ideal for project managers, risk analysts, and strategy teams. Compatible with PowerPoint, Keynote, Google Slides, and Canva.