


Features
- 4 Unique slides
- Fully editable and easy to edit in Microsoft Powerpoint, Keynote and Google Slides
- 16:9 widescreen layout
- Clean and professional designs
- Export to JPG, PDF or send by email


Do you have any questions?
Recommend


7 slides
Real Estate Companies Infographic
Real estate companies are organizations that engage in various aspects of the real estate industry, which involves the buying, selling, managing, or investing in properties. Creating an infographic about real estate companies can be a great way to showcase key information, trends, and benefits of various real estate firms. Customize the content, design, and visuals to create an engaging and informative infographic that provides insights into the real estate industry and the leading companies within it. Real estate is a dynamic field, and your infographic can serve as a valuable resource for potential clients and investors.


28 slides
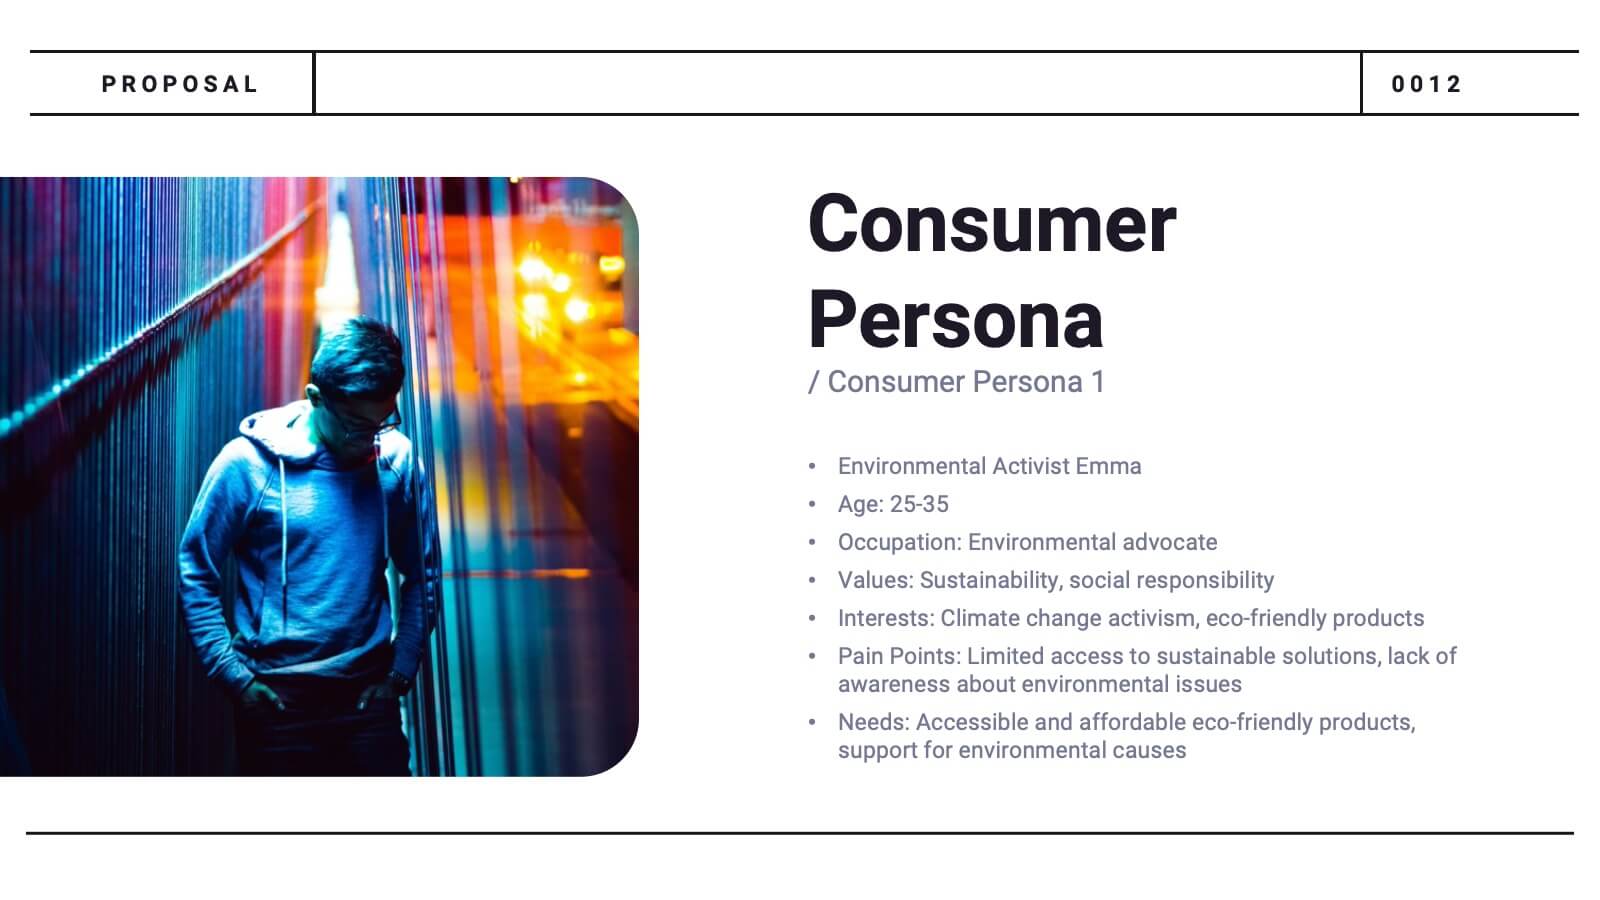
Glowspire Brand Guidelines Proposal Presentation
This brand identity template covers essential components: logo, imagery, color, typography, and voice & tone. It includes slides for consumer persona, market analysis, USP, brand positioning, and strategy. Ideal for establishing a cohesive brand, it highlights brand touchpoints across digital, print, packaging, and advertising mediums. Customizable for various platforms.


5 slides
User Experience Survey Findings Presentation
Present key insights from your user research in a clean and impactful way with this survey findings slide. Designed to highlight percentages and categories clearly, it helps your audience quickly understand what users value most. Ideal for UX reports and product feedback reviews. Fully compatible with PowerPoint, Keynote, and Google Slides.


5 slides
Watercolor Background Design Presentation
Add an artistic edge to your presentation with this Watercolor Background Design Template. Featuring soft, abstract paint splashes behind vibrant alphabet icons, it’s perfect for creative professionals, educators, or marketing teams looking to highlight four core ideas or comparisons. Fully editable in PowerPoint, Keynote, and Google Slides for a seamless customization experience.


6 slides
IT Infrastructure and Services Management Presentation
Visualize key operations clearly with the IT Infrastructure and Services Management Presentation. This slide features a circular diagram paired with five editable content blocks—perfect for mapping infrastructure elements like networks, servers, and tools. The icon-ring design adds clarity and structure to complex workflows. Fully compatible with PowerPoint, Keynote, and Google Slides.


4 slides
Oceania Business Growth Opportunities Map Presentation
Highlight key business locations across Oceania with this clean and modern map slide. Featuring pinpoint icons and four customizable title areas, it’s ideal for showcasing market entry points, regional offices, or investment zones. Fully editable in PowerPoint, Keynote, and Google Slides for seamless business planning and strategic presentations.


5 slides
Customer Experience Empathy Map Presentation
Enhance Customer Understanding with the Empathy Map Presentation! This Customer Experience Empathy Map template is designed to help businesses visualize customer needs, thoughts, emotions, and behaviors for improved engagement and strategy. Featuring a clear quadrant-based layout, this template allows you to map out customer insights, pain points, and expectations for more effective decision-making. Ideal for marketers, UX designers, and business strategists, this fully editable template is compatible with PowerPoint, Keynote, and Google Slides, making


12 slides
5 Step Process Diagram Presentation
Step up your presentation game with our sleek "5 Step Process Diagram Presentation" template! Ideal for depicting interconnected processes or workflows, this infographic uses a central hexagonal design to connect five key steps, ensuring clarity and ease of understanding. Whether for academic, business, or personal projects, this template’s intuitive layout and customizable color schemes make it a versatile choice for any presentation. Compatible with PowerPoint, Keynote, and Google Slides, it’s designed to enhance the way you visualize complex information.


5 slides
HIV Treatment & Awareness Infographics
Explore the critical realms of healthcare with our HIV treatment & awareness infographics. Rendered in striking shades of red and blue, this vertical, informative, and creatively designed template serves as a profound educational tool. It's intricately crafted for healthcare professionals, awareness campaign coordinators, and community health educators, providing a visual journey through the complexities of HIV understanding. This infographic includes compelling graphics and relevant icons, making it indispensable for those seeking to inform, prevent, and empower communities about HIV. Elevate awareness with clarity and a deep sense of humanity, one fact at a time.


5 slides
Financial Market Trends and Forecast Presentation
Visualize economic shifts and data insights with this upward growth line infographic. Ideal for presenting financial forecasts, investment strategies, and market milestones, this layout features a stylized arrow path with icons, letter markers, and space for detailed annotations. Fully editable and compatible with PowerPoint, Keynote, and Google Slides.


4 slides
Roadmap to Personal and Business Success Presentation
Guide your audience through a strategic journey with this roadmap-themed presentation. Featuring traffic cones on a winding path, it’s ideal for illustrating goals, milestones, or stages of development. Fully editable in PowerPoint, Keynote, and Google Slides—perfect for growth plans, personal development, project timelines, or business success strategies.


5 slides
Environment Articles Infographic
The Environment is important for a number of reasons, it is essential that we take care of it and minimize our impact on it. This vertical Infographic is a visual representations of information related to environmental topics, presented in a vertical format. These infographics are designed to effectively communicate key facts, statistics, and concepts about the environment in a visually appealing and easily digestible manner. This consist of a series of vertically arranged sections or columns, each containing relevant information and visuals. These sections can cover a wide range of environmental topics, such as climate change, renewable energy, pollution, and sustainable practices.


7 slides
Demographic Segmentation Infographic Presentation
A Demographic Infographic is designed to provide a quick and easy-to-understand snapshot of the key demographic trends and insights. This Template is easy to edit and intuitive, so you can create a stunning presentation in minutes. With this template, you can focus on your content and the design. It's a multipurpose template which means it can be used for different topics: business, education, marketing, and more. You can use this as a template to explain concepts related to your studies, statistics or market research. This template is compatible with Powerpoint, Keynote and Google Slides.


3 slides
Supply Chain and Transportation Map Presentation
Navigate the complexities of modern logistics with this engaging visual designed to map out each phase of product movement. This infographic breaks down the supply chain and transportation process into three clear stages—road, lift, and ship—making it easy to explain workflows or illustrate system improvements. Compatible with PowerPoint, Keynote, and Google Slides.


6 slides
Porter's Five Forces Market Analysis Presentation
Gain a competitive edge with this Porter's Five Forces market analysis template! Designed to help businesses assess industry dynamics, this structured layout highlights competitive rivalry, supplier power, buyer influence, new market entries, and substitute threats. Perfect for strategists and analysts. Fully customizable and compatible with PowerPoint, Keynote, and Google Slides.


5 slides
Digital Marketing Agency Infographics
Elevate your agency's presentation game with our digital marketing agency infographics template. Designed in a vibrant palette of pink, white, and blue, this vertical infographic is a powerhouse tool tailored for marketing professionals, digital agencies, and consultants aiming to showcase their services, success stories, and unique strategies effectively. The template is a visual feast, featuring compelling graphics, diverse icons, and designated spaces for images that capture the essence of digital trends and marketing breakthroughs. Its intuitive design aids in breaking down complex information, ensuring your agency's innovative solutions are client-ready.


5 slides
Execution Model Using RAPID Framework Presentation
Visualize decision-making accountability with the Execution Model Using RAPID Framework Presentation. This clean, color-coded matrix organizes roles across tasks using the RAPID method—Recommend, Agree, Perform, Input, Decide—making it easy to assign responsibilities at a glance. Ideal for strategic planning, team alignment, and project execution. Editable in PowerPoint, Google Slides, Keynote, and Canva.