


Features
- 6 Unique slides
- Fully editable and easy to edit in Microsoft Powerpoint, Keynote and Google Slides
- 16:9 widescreen layout
- Clean and professional designs
- Export to JPG, PDF or send by email


Do you have any questions?
Recommend


5 slides
Team Goals and Alignment Strategy Presentation
Align your team with clarity using the Team Goals and Alignment Strategy Presentation. This slide visually connects individual roles to a central target, making it ideal for showcasing strategic alignment, shared objectives, or team contributions. Fully customizable in Canva, PowerPoint, or Google Slides for seamless team planning.


6 slides
Strategic Planning with Hexagon Diagram
Visualize complex plans with clarity using the Strategic Planning with Hexagon Diagram Presentation. This slide layout features six connected hexagons forming a cohesive structure around a central idea—perfect for mapping out strategic pillars, initiatives, or departmental functions. Each segment is color-coded and labeled A–F, making it easy to present interconnected elements such as goals, KPIs, resources, risks, and action plans. Fully editable in PowerPoint, Keynote, and Google Slides, you can customize the layout to fit your organizational strategy or project flow.


6 slides
Product Launch Milestone Plan Presentation
Turn your big idea into a successful launch with this bold and structured presentation design. Perfect for outlining goals, tracking phases, and measuring progress, it keeps your product roadmap clear and engaging. Easily editable and compatible with PowerPoint, Keynote, and Google Slides for seamless presentation creation.


6 slides
Business Strategy Pyramid Presentation
Outline your strategic priorities with clarity using the Business Strategy Pyramid Presentation. This template features a five-step 3D pyramid that highlights key business goals, initiatives, or stages. Each layer includes icons and numbered sections for easy interpretation. Ideal for strategy meetings, executive briefings, and growth plans. Fully editable in PowerPoint, Keynote, and Google Slides.


5 slides
Insurance Policy Infographics
Dive into the intricacies of insurance with our insurance policy infographics. Rendered in a professional palette of blue and an array of engaging colors, this creative, vertical template simplifies the often complex world of insurance policies. Ideal for insurance agents, companies, and educators, it provides a visual aid to explain coverage specifics, terms, and conditions or to compare policy offerings clearly and effectively. The infographic includes aesthetically pleasing graphics, symbolic icons, and designated spaces for factual data, making it a quintessential tool for enhancing audience understanding and promoting informed decision-making.


21 slides
Curiosix Project Milestones Report Presentation
Stay on track with this professional and visually appealing project milestones report presentation template. Ideal for tracking progress, managing timelines, and presenting key objectives, deliverables, and risk management strategies. It features a modern design with fully editable slides, perfect for business meetings and project reviews. Compatible with PowerPoint, Keynote, and Google Slides.


10 slides
Key Strategies for Business Success Presentation
Achieve your goals with the Key Strategies for Business Success Presentation template. This structured and visually compelling slide deck is designed to outline essential business strategies, success factors, and growth plans. Featuring a clean and professional layout, this template is perfect for entrepreneurs, corporate teams, and business consultants. Fully customizable and available for PowerPoint, Keynote, and Google Slides, making it easy to tailor for your specific needs.


26 slides
Leyna Presentation Template
Leyna is an elegant and minimalist wedding planner presentation template. This wonderful presentation template will help couples know what all you’ll offer as a wedding planner. We have made it easy for you this this multipurpose template because you will be able to edit easily to make sure it fits what you need. We have built a clean, responsive and modern design for them to have a great experience on what they are looking for in the best way possible. This template provides a professional and clean design for your business or personal use. It's time to impress the potential clients!


4 slides
Project Proposal Executive Summary Presentation
Optimize your project presentations with the 'Project Proposal Executive Summary' template. Crafted to clearly showcase your project’s most crucial elements, this template uses visuals and concise text to highlight objectives and deliverables effectively. Ideal for professionals preparing proposals in PowerPoint, Keynote, or Google Slides.


26 slides
Hotel Chain Deluxe Company Profile
Dive into the lavish world of Miami's finest hotel chains, where luxury meets tropical allure. Drenched in the vibrant shades of green and sun-kissed orange, our template exudes the freshness and opulence of Miami's hospitality scene. Graced with luxurious graphics, iconic landmarks, and evocative image placeholders, it's a visual treat that captures the city's essence. Flawlessly curated for Powerpoint, Keynote, or Google Slides. A gem for travel agencies, luxury travelers, hotel reviewers, or anyone keen on showcasing the pinnacle of Miami's hospitality. Experience luxury; let Miami's best hotels unfold.


22 slides
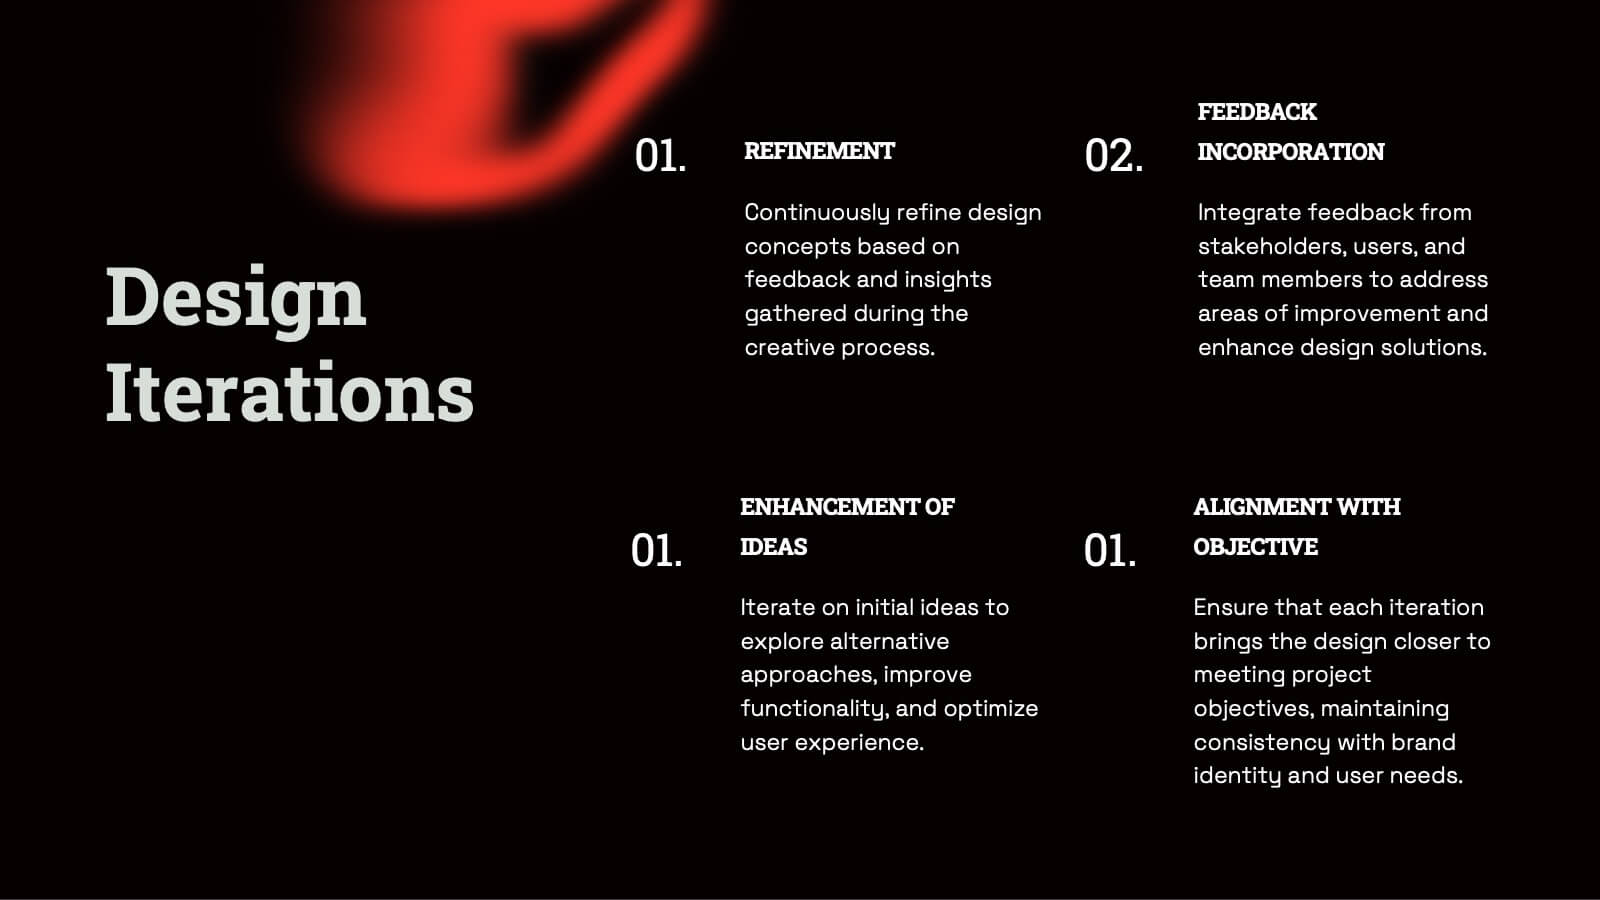
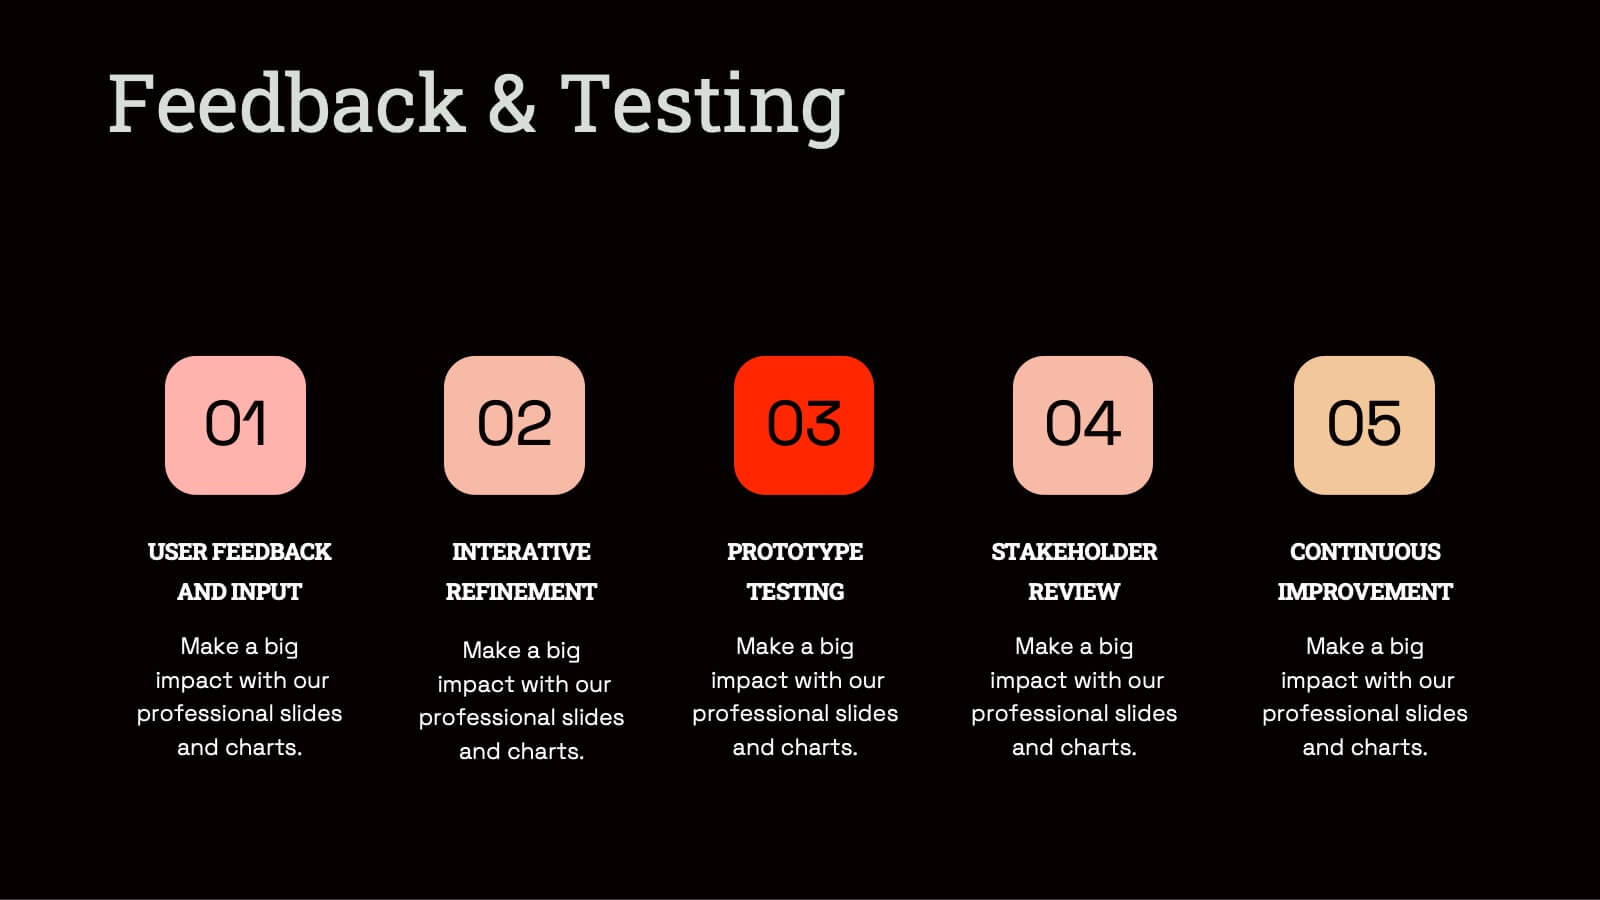
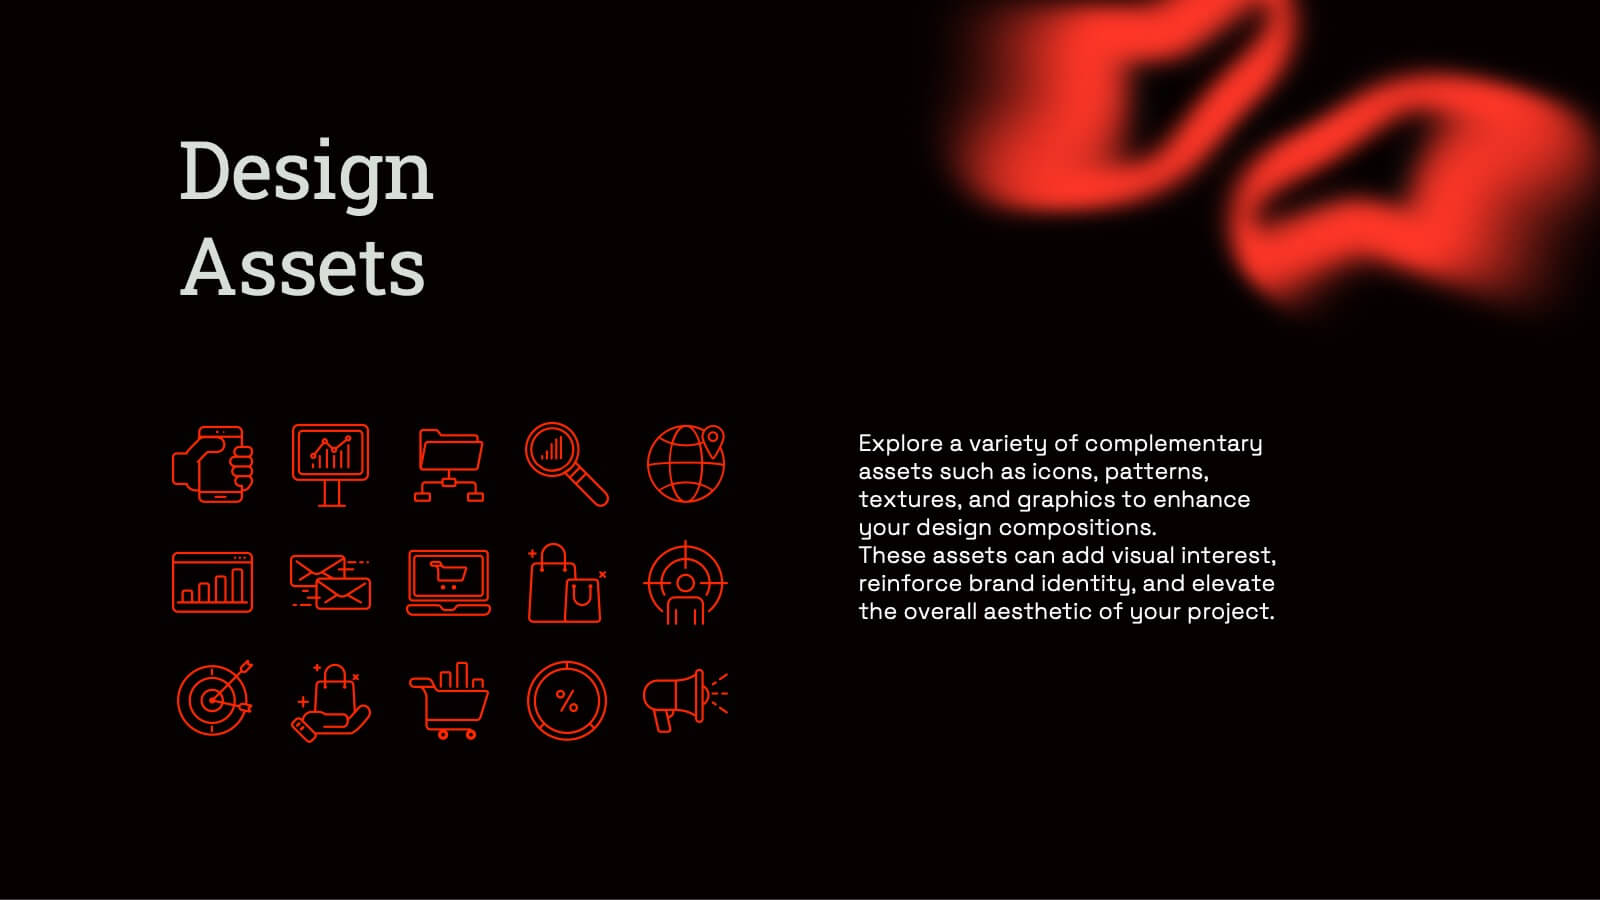
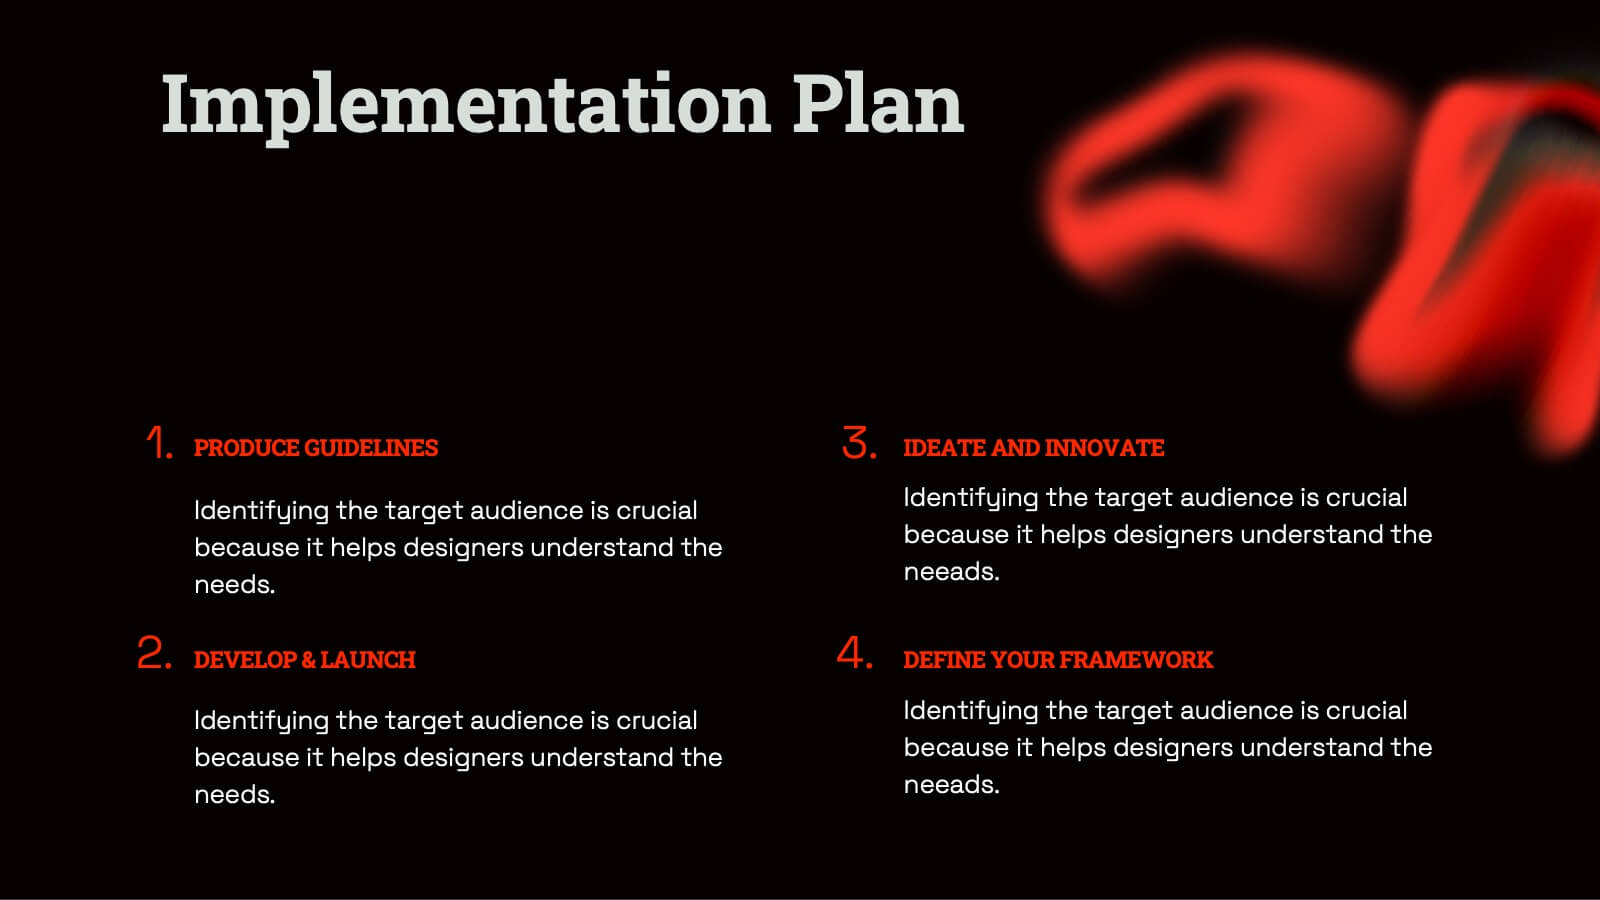
Radiant Graphic Design Project Plan Presentation
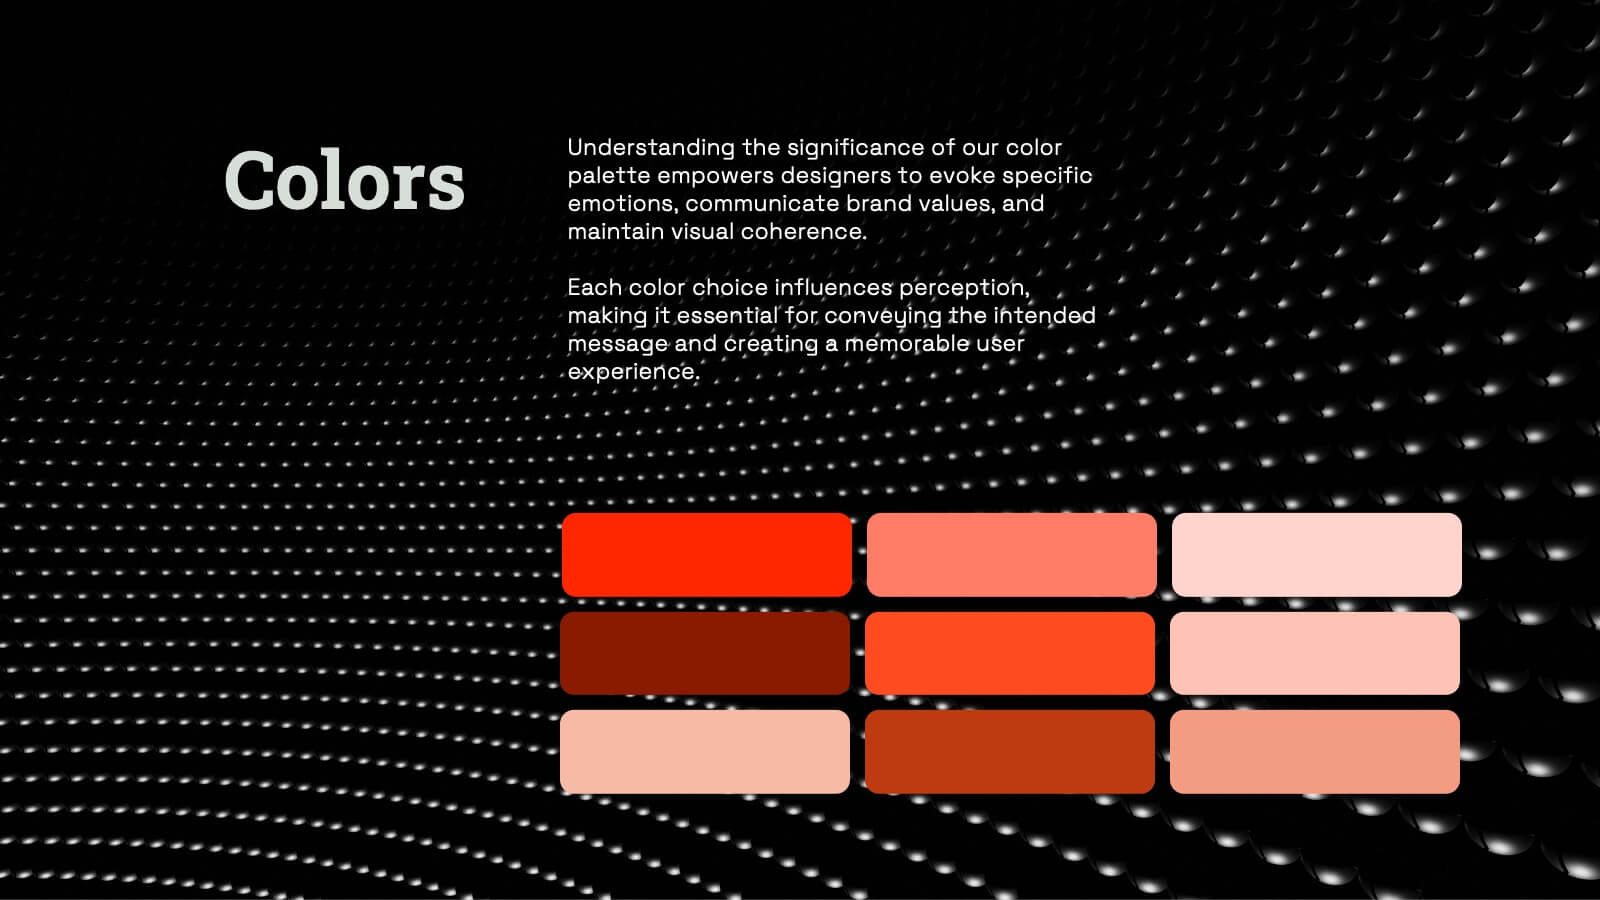
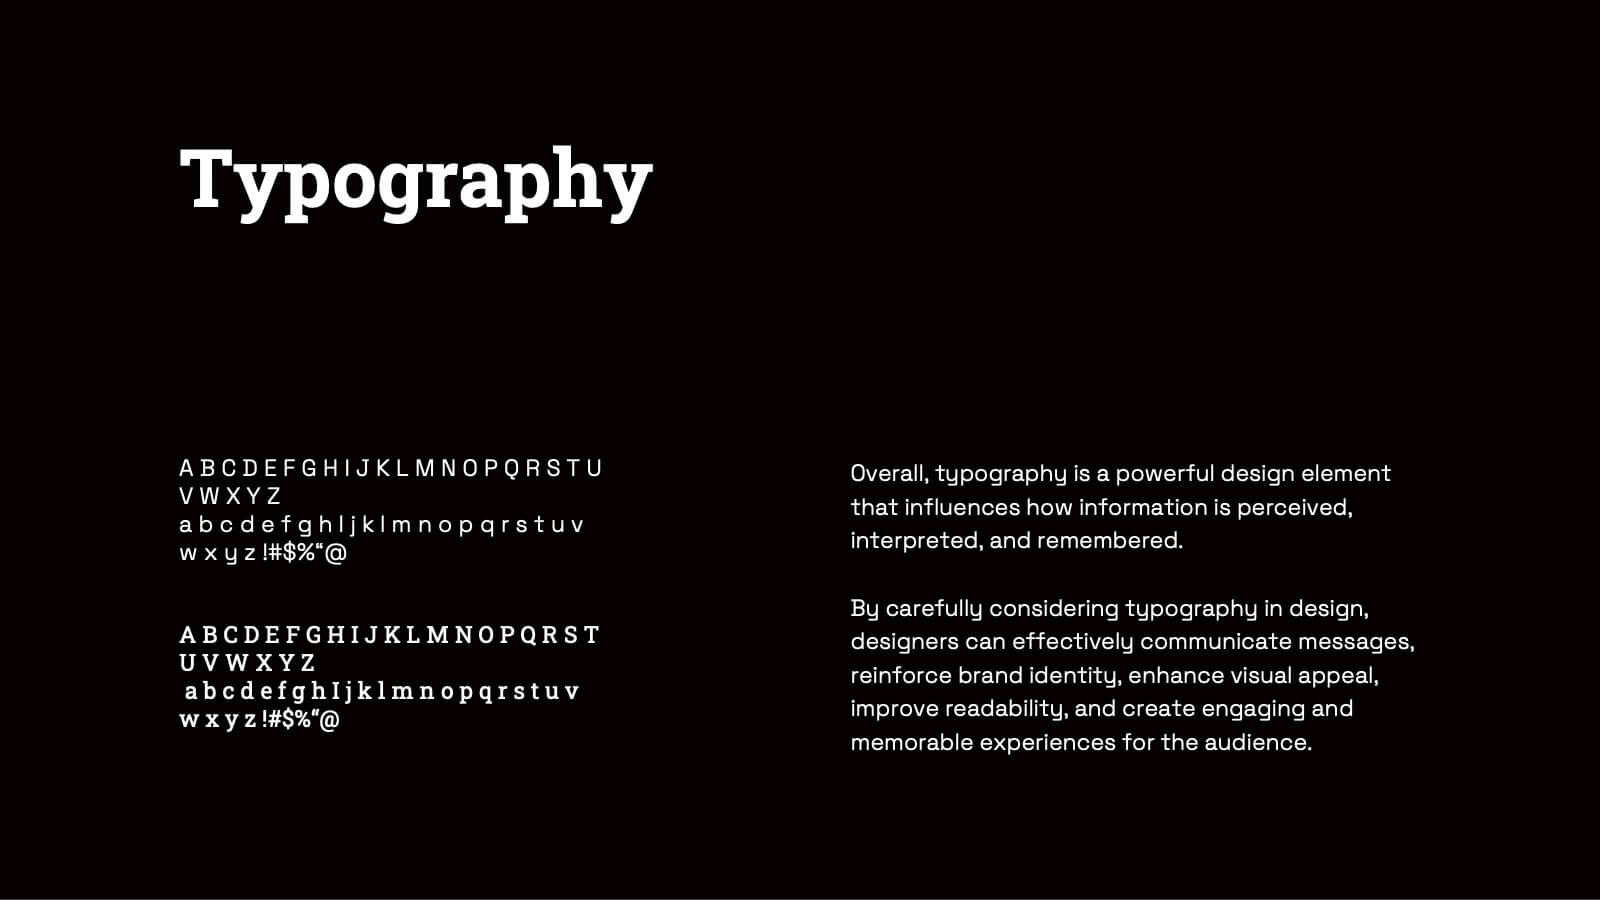
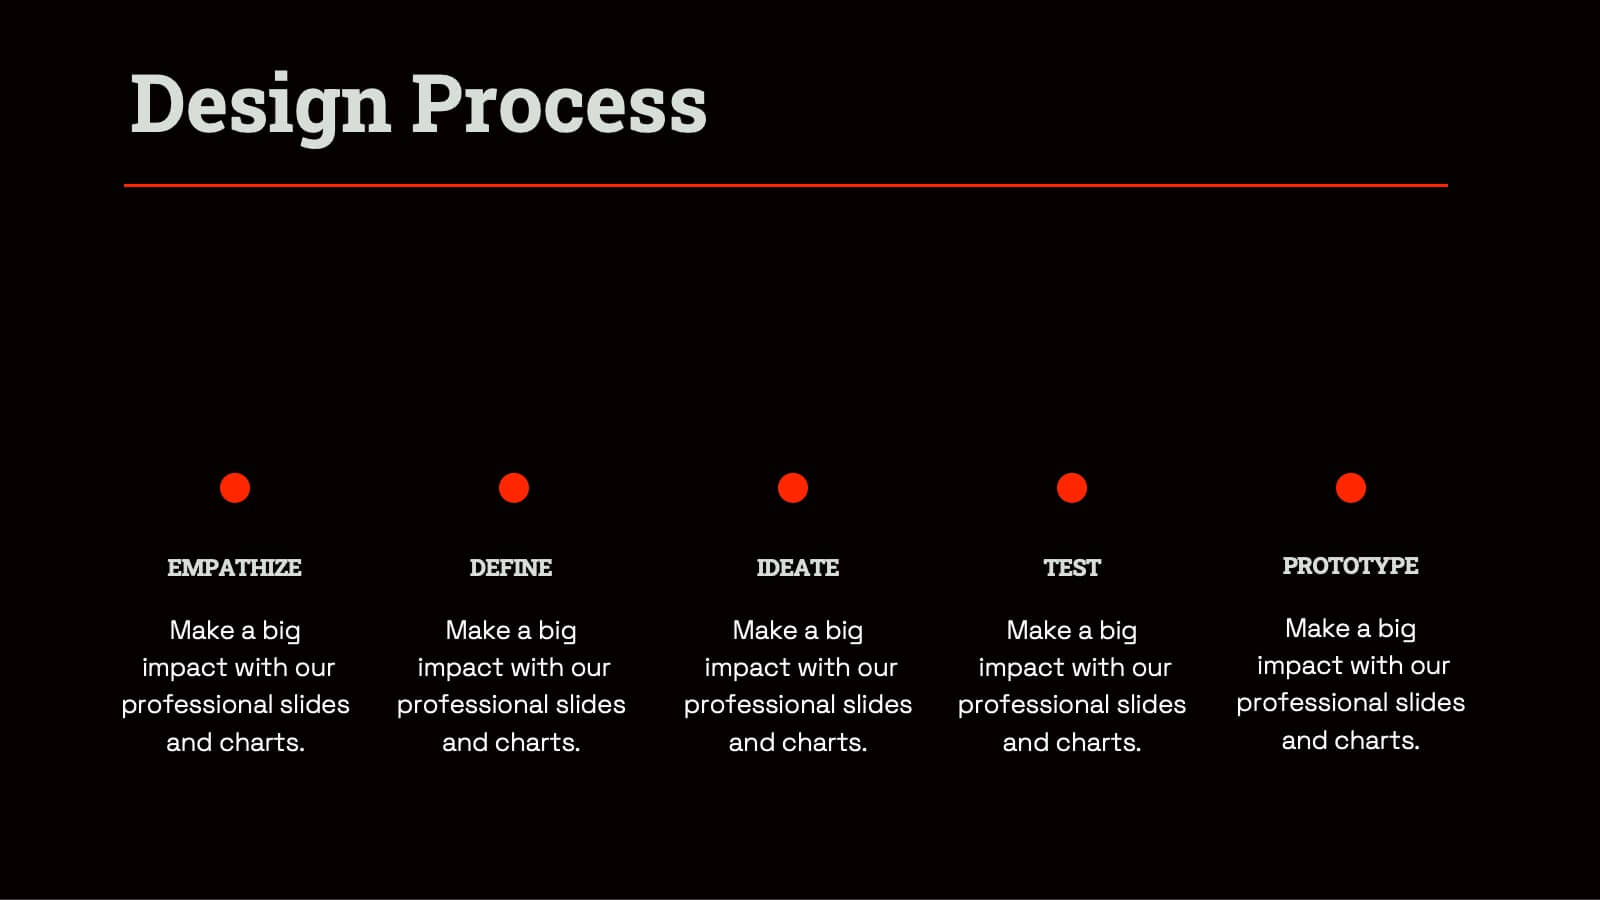
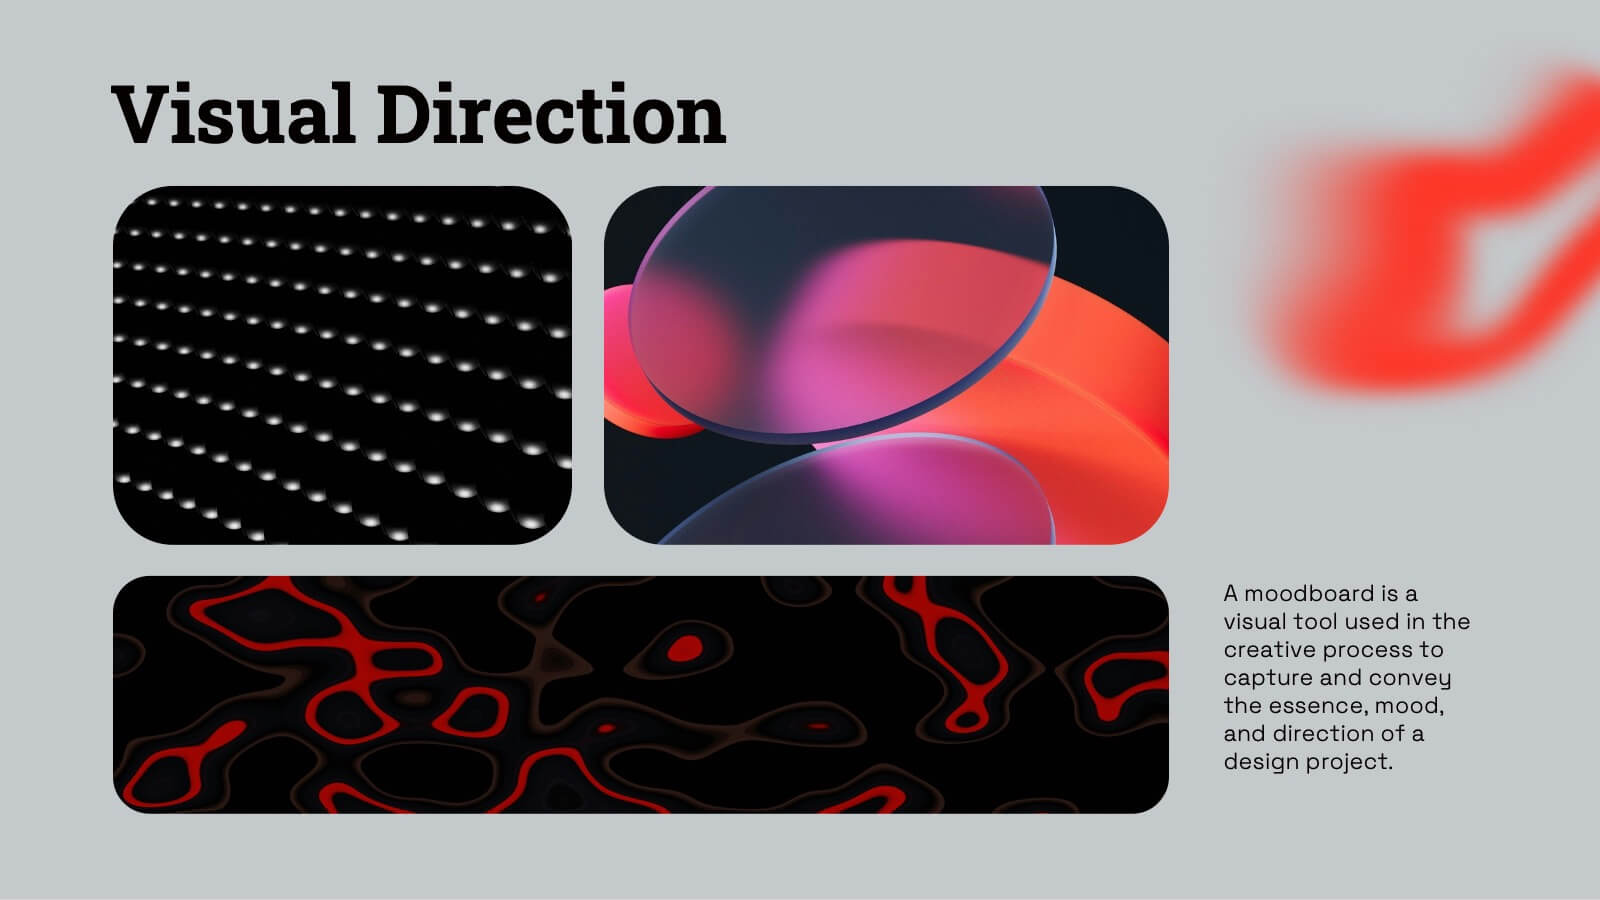
Unleash your creativity with this bold and dynamic graphic design project plan template! Perfect for showcasing design elements, textures, and typography, this template guides you through every phase, from concept development and prototyping to feedback and final presentations. Ideal for visual direction and design asset management, it’s fully compatible with PowerPoint, Keynote, and Google Slides for seamless use.


5 slides
Business Growth and Expansion
Visually communicate each stage of business development with this Business Growth and Expansion diagram. Featuring a dynamic circular flow, this editable slide is perfect for showcasing progress, scaling strategies, or roadmap milestones. Fully compatible with PowerPoint, Keynote, and Google Slides—ideal for business plans and strategic presentations.


5 slides
Pets Paradise Infographics
"Pets Paradise" is used to refer to a place or concept that revolves around providing a perfect and delightful environment for pets. These vertical infographics are designed to celebrate the wonderful world of pets and provide essential information for pet owners and enthusiasts. This infographic template covers a wide range of topics related to pets, showcasing their impact on human lives and the importance of responsible pet ownership. The templates present fascinating statistics about pet ownership worldwide. These infographics are fully customizable, allowing users to modify colors, fonts, and layout to align with their personal preferences.


6 slides
Business Flow Chart Design Presentation
Bring clarity and momentum to your process with a clean, visual layout that turns complex steps into an easy-to-follow flow. This presentation helps teams map stages, responsibilities, and progress with confidence, making it perfect for planning, strategy, and operations. Fully compatible with PowerPoint, Keynote, and Google Slides.


5 slides
Project Execution Next Steps Presentation
Streamline your workflow with the Project Execution Next Steps Presentation template. Designed for project managers and teams, this visual slide helps break down execution phases into clear, actionable steps. The connected chain layout ensures smooth project tracking, making it easy to communicate progress and responsibilities. Fully customizable in PowerPoint, Keynote, and Google Slides for seamless project planning and execution.


7 slides
Work From Home Infographic Presentation Template
A Work From Home Infographic is a visual representation of data related to working from home. This infographic can be used as a guide to get you through some of the best opportunities available. Use this template to get the necessary tools to start working from home. Use this infographic to show your audience how many people work from home by adding statistics, tips and interesting facts. This template is designed to effectively communicate complex information in a simple format, making it great for exploring the topic of working from home. This is a perfect way to promote your business!


5 slides
African Continent Map Slide Presentation
Visualize your data across Africa with a modern, easy-to-read map design that highlights regional trends and insights. Perfect for showcasing demographics, market distribution, or project reach, this template combines clarity and impact. Fully compatible with PowerPoint, Keynote, and Google Slides for smooth customization and presentation flexibility.