


Features
- 6 Unique slides
- Fully editable and easy to edit in Microsoft Powerpoint, Keynote and Google Slides
- 16:9 widescreen layout
- Clean and professional designs
- Export to JPG, PDF or send by email


Do you have any questions?
Recommend


5 slides
North American Business Overview and Map Presentation
Showcase regional performance data across North America with this clean, data-driven map slide. Highlight four key statistics using pinpoint markers and modern percentage indicators. Ideal for market overview, financial reporting, or strategic insights. Fully customizable and compatible with PowerPoint, Keynote, and Google Slides for seamless business presentations.


5 slides
Sports Industry Market Trends Presentation
Visualize key metrics in the sports sector with this dynamic Sports Industry Market Trends slide. Designed with a timeline layout and medal-inspired percentage rings, it allows you to highlight four core insights or data points. Ideal for industry overviews, competitor benchmarking, or annual sports business reports. Fully editable in PowerPoint, Keynote, and Google Slides.

22 slides
Mystic Startup Strategy Presentation
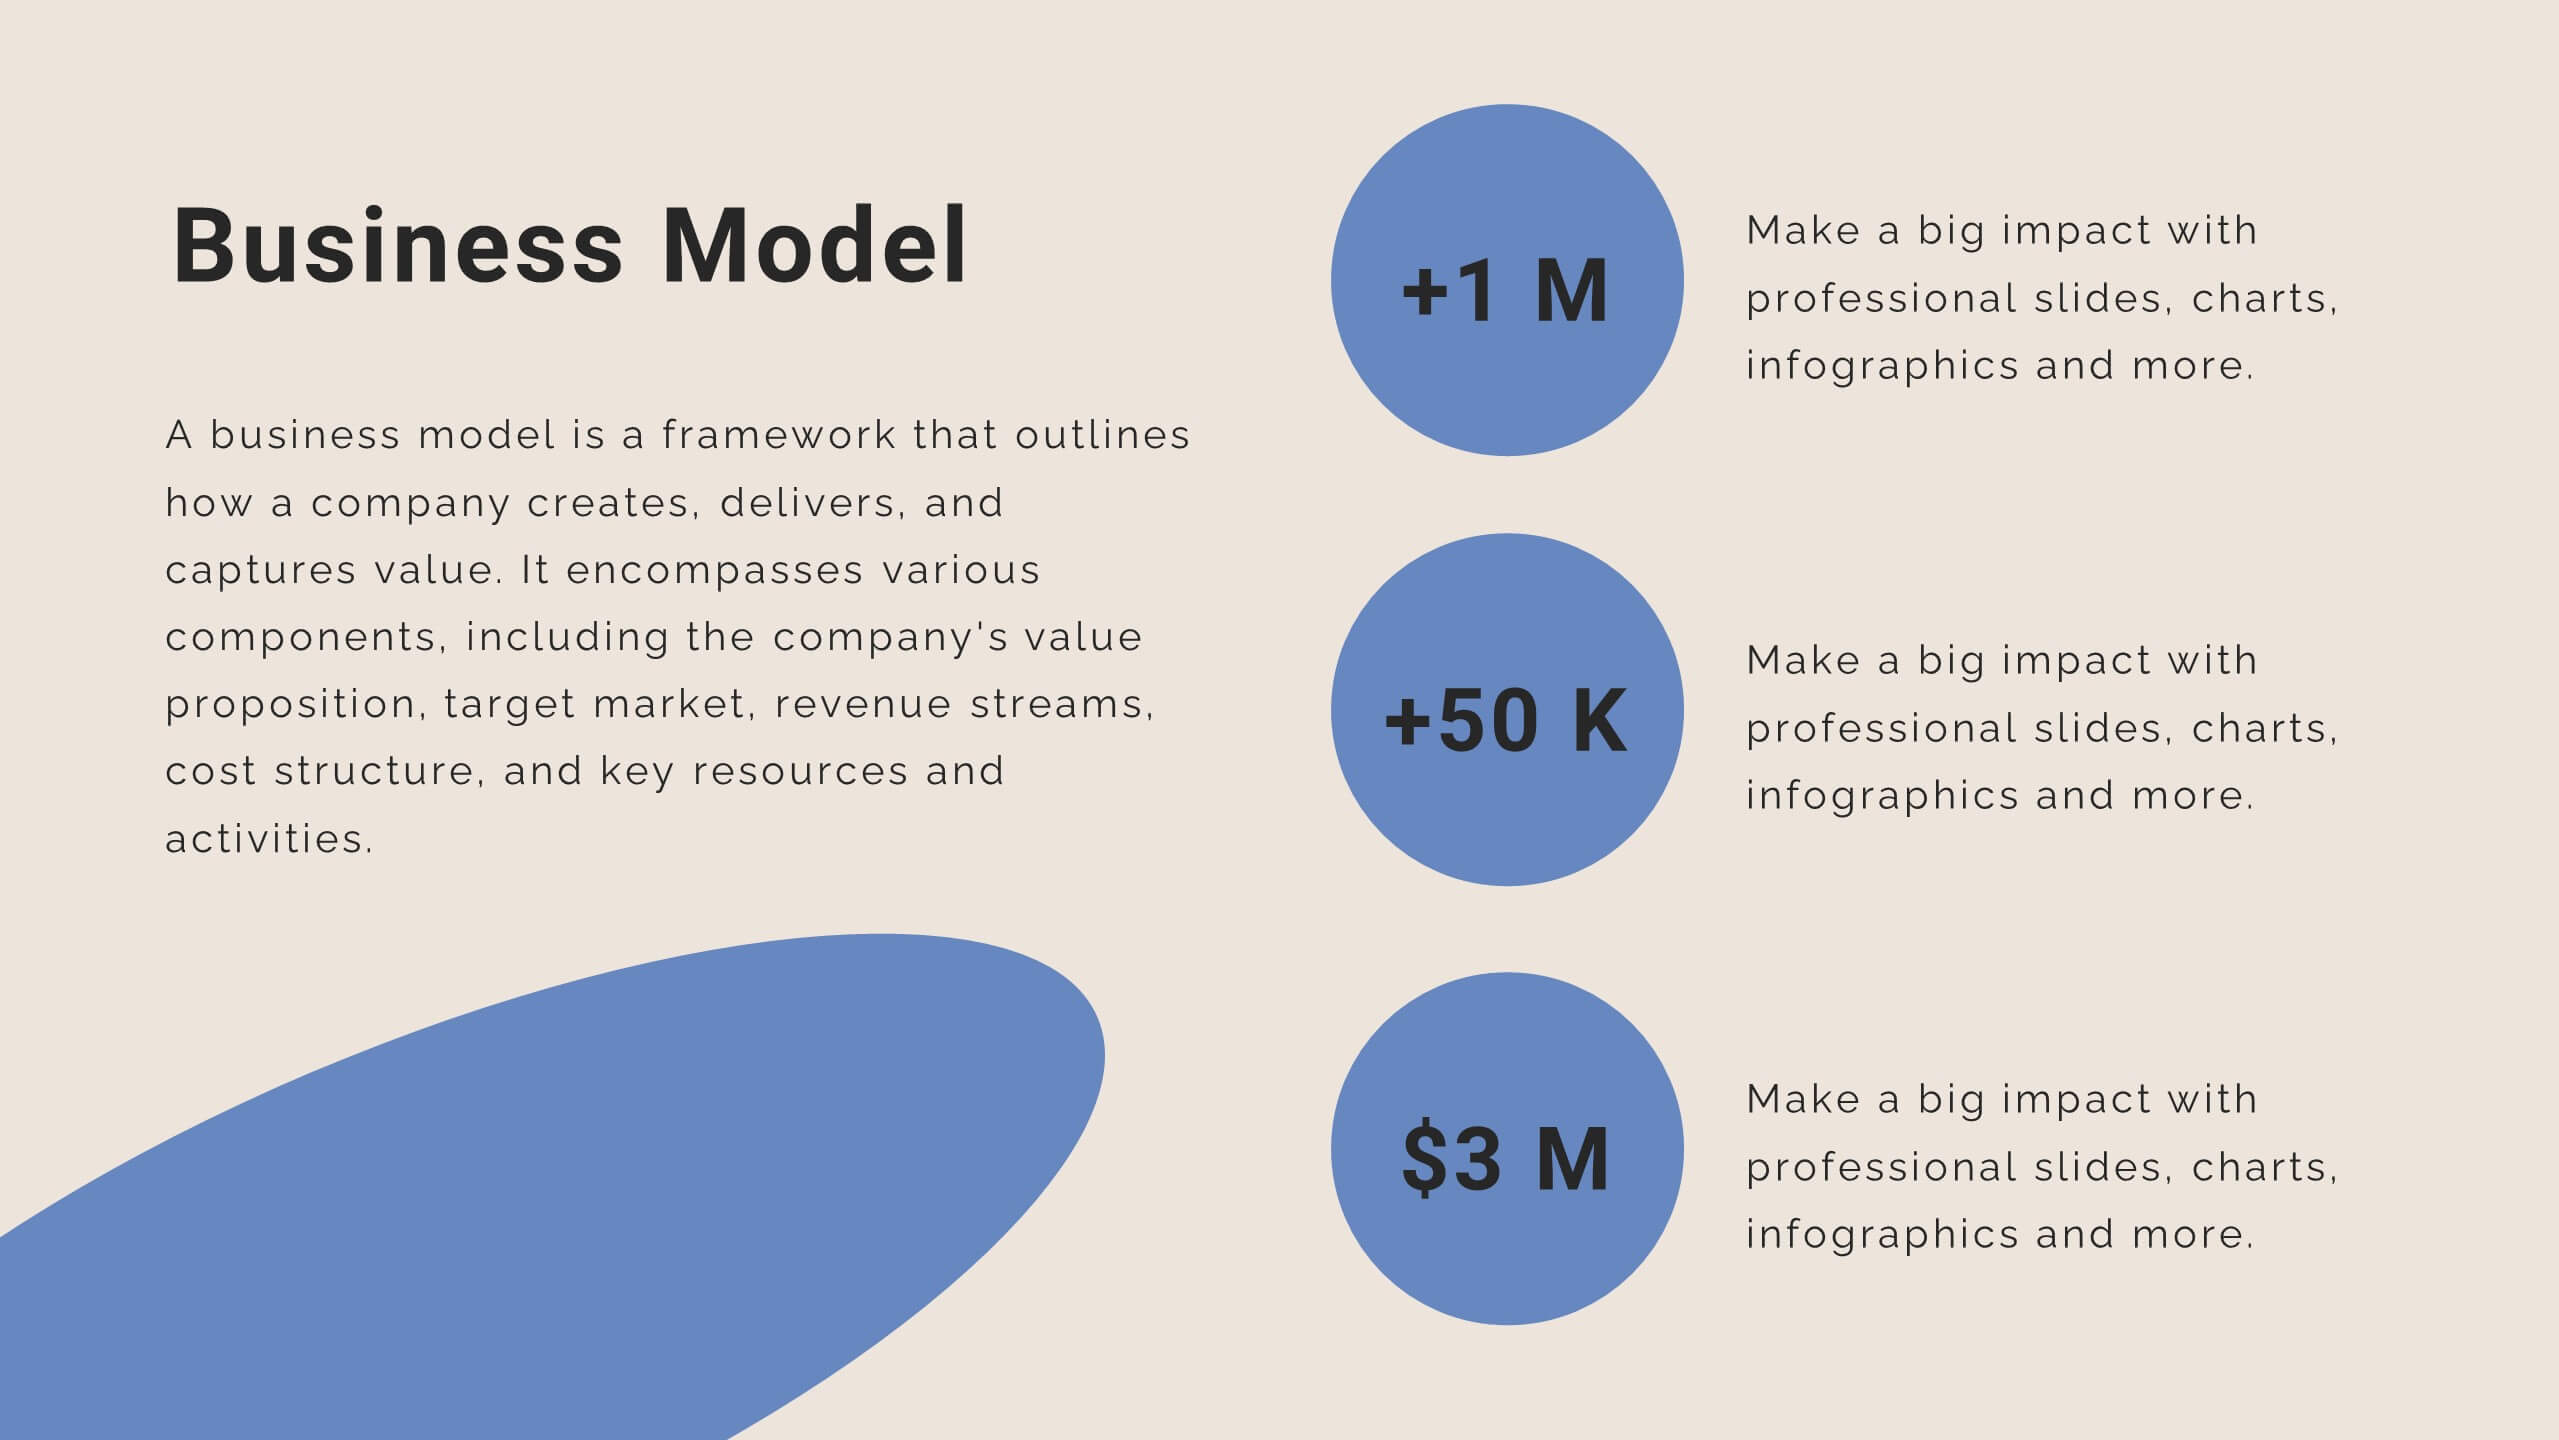
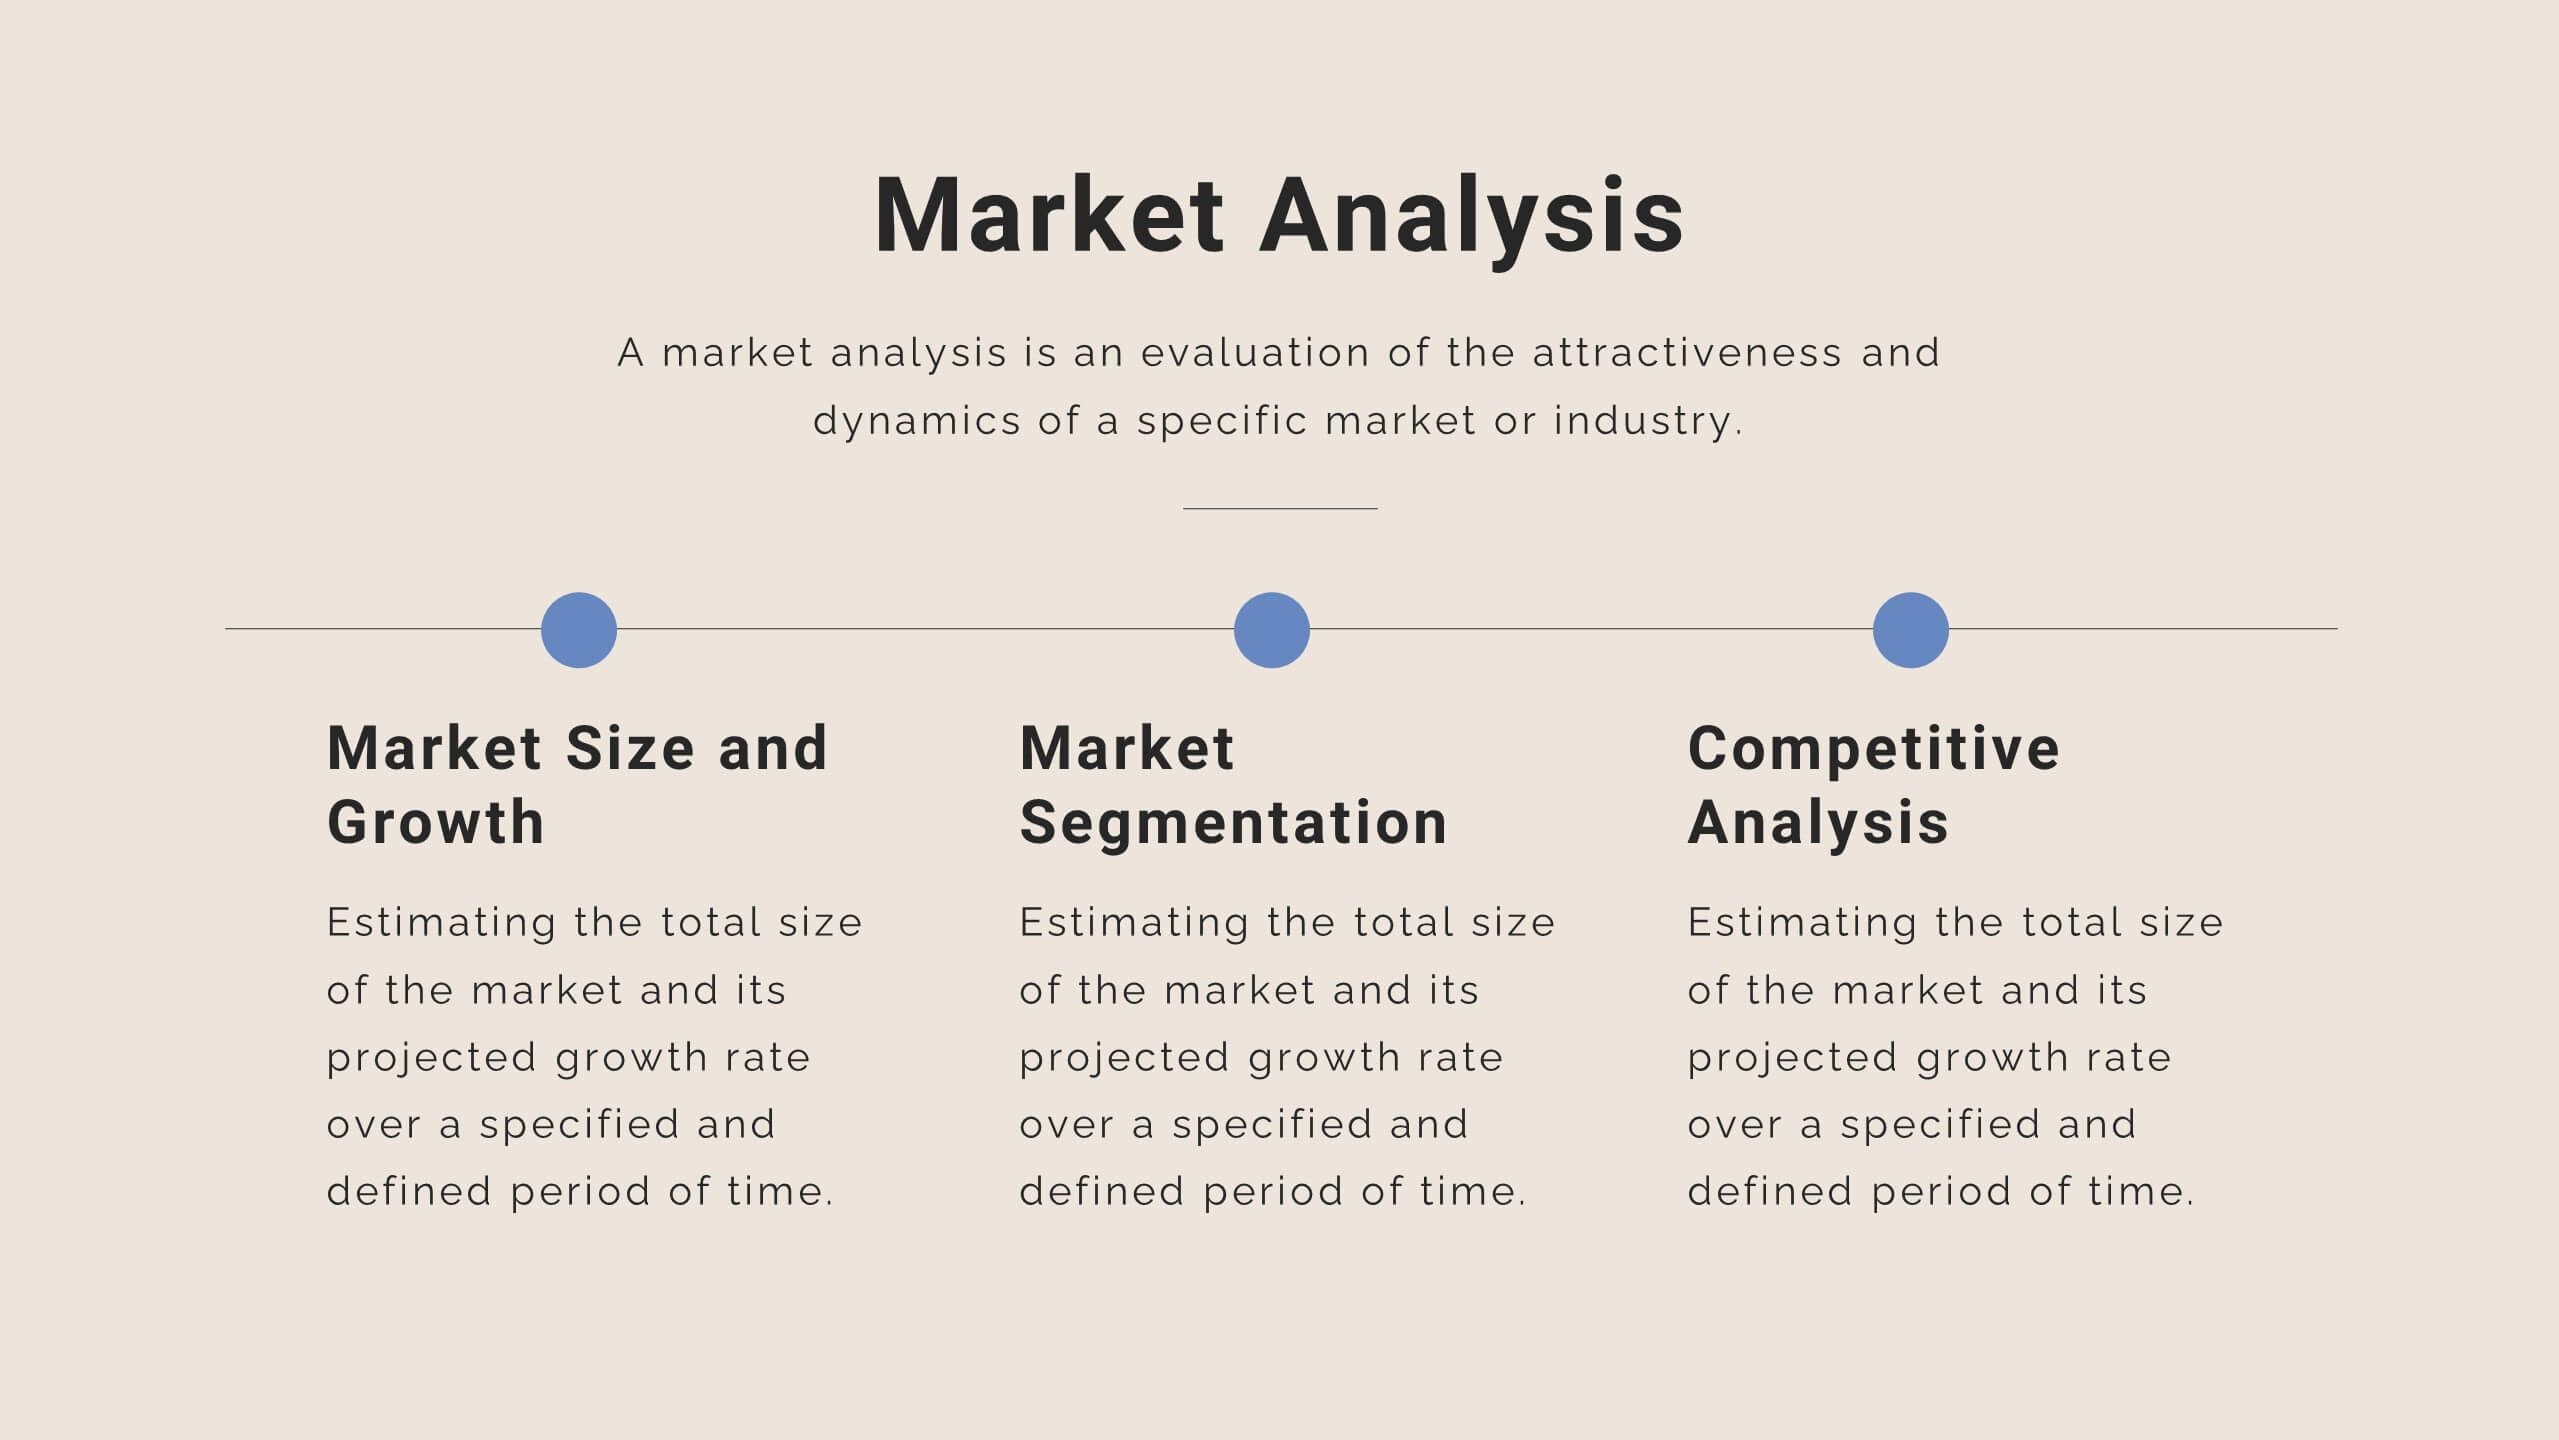
Launch your startup with confidence using this comprehensive funding proposal template! Perfect for showcasing your mission, vision, and business model to potential investors. Highlight your unique value proposition and growth plan with style. Compatible with PowerPoint, Keynote, and Google Slides, this template ensures your pitch stands out and secures the funding you need.


8 slides
Card Services Comparison Layout Presentation
Highlight key differences in financial products with this Card Services Comparison Layout Presentation. Featuring a sleek smartphone-centered design, this template allows you to clearly compare up to three card types or financial service features. Perfect for fintech presentations, banking pitches, or product feature breakdowns. Fully customizable in PowerPoint, Keynote, and Google Slides.


20 slides
Earthsong UX UI Design Pitch Deck Presentation
This UX/UI Design Pitch Deck Template is a visually engaging and professional presentation designed to showcase your design process, from research and ideation to prototyping and final execution. It includes key sections such as design brief, target audience, design elements, project timeline, and implementation strategy, ensuring a comprehensive overview of your project. Fully customizable for PowerPoint, Keynote, and Google Slides, making it perfect for design agencies, freelancers, and creative professionals looking to impress potential clients and stakeholders.


3 slides
Credit Card Comparison Chart Presentation
Make financial decisions feel clearer and more visual with this clean comparison-focused layout designed to highlight key features side by side. It helps you simplify data, explain differences, and guide smarter choices with confidence. Fully editable and compatible with PowerPoint, Keynote, and Google Slides.


4 slides
Blue Ocean Innovation Approach Presentation
The Blue Ocean Innovation Approach Presentation offers a clear and modern layout for visualizing strategic innovation. Featuring layered diamond shapes representing Cost, Value Innovation, and Buyer Value, this slide helps explain how businesses can move beyond competition by creating new market spaces. Each section includes editable titles and text boxes, ideal for outlining strategies, key concepts, or benefits. Designed for consultants, strategists, and business leaders, the template is fully customizable in PowerPoint, Keynote, and Google Slides. Perfect for presenting blue ocean thinking in a polished, professional format.


7 slides
Executive Summary Plan Infographic Presentation
An Executive Summary Infographic is a visual representation of the key points and highlights of a longer report or document. Use this creative template as a way to present complex information in a simplified and visually appealing way, allowing busy executives and decision-makers to quickly understand the main findings and recommendations. This template includes a mix of charts, graphs, and other visual elements, along with text. This template's purpose is to help busy executives and decision-makers understand the main points of a report, without having to read through the entire document.


7 slides
Artificial Intelligence Presentation Template
An Artificial Intelligence infographic is a visual representation of information related to AI. This high-definition infographic is completely customizable and will allow you to see advances in AI and other networks. Artificial Intelligence, is evolving rapidly. It's important that we understand what's going on so that we can ensure the future of this technology is beneficial to society. In this informative infographic, you will be able to learn and inform about everything from the difference between artificial intelligence and the differences between expert systems by adding you own data.


7 slides
Six Sigma Project Infographic
Six Sigma is a data-driven methodology and quality improvement approach that aims to eliminate defects and reduce variation in processes. This infographic template is a visual representation of the Six Sigma methodology, which is a data-driven approach used by organizations to improve their processes and reduce defects. The infographic aims to explain the key concepts and steps involved in the Six Sigma process in a clear and concise manner. It is designed to help individuals understand the methodology and its benefits, and can be used as a reference tool for Six Sigma practitioners and those interested in process improvement.


5 slides
Big Data Analytics Slide Presentation
Bring your insights to life with a clean, modern slide that transforms complex information into a simple visual journey. This layout helps you explain key data points, trends, and analytical steps with clarity and ease, making your message instantly understandable. Compatible with PowerPoint, Keynote, and Google Slides.


7 slides
Leadership Skills Infographic
Leadership skills encompass a range of abilities and qualities that enable an individual to guide, motivate, and manage a team or group of people effectively. Embark on this joyful adventure through the realm of leadership skills, and let the vibrant colors and engaging design of our leadership skills infographic spark the leader within you. Compatible with Powerpoint, Keynote, and Google Slides. This template is designed to allow you to lead with a commitment to excellence. Roam through the realms of teamwork and collaboration, learning how to unite diverse individuals towards a common goal.


4 slides
Strategic Business Objectives Framework
Showcase your company's top strategic goals with this clean and professional slide. Each briefcase icon represents a key business objective, perfect for planning, reporting, or investor updates. Fully customizable in PowerPoint, Keynote, and Google Slides.


6 slides
Deluxe Loyalty Program Infographics
Explore the Deluxe Loyalty Program with our customizable infographic template. This template is fully compatible with popular presentation software like PowerPoint, Keynote, and Google Slides, allowing you to easily customize it to showcase the features, benefits, and advantages of the Deluxe Loyalty Program. The Deluxe Loyalty Program infographic template offers a visually engaging platform to highlight the rewards, incentives, and exclusive offers available to members of the program. Whether you're a business owner, marketer, or customer relations specialist, this template provides a user-friendly canvas to create informative presentations and promotional materials for your loyalty program. Optimize your loyalty program's visibility and appeal with this SEO-optimized infographic template, thoughtfully designed for clarity and ease of use. Customize it to showcase program tiers, benefits, points accumulation, and member testimonials, ensuring that your audience understands the value of participating in the Deluxe Loyalty Program. Start crafting your personalized infographic today to promote customer loyalty and engagement effectively.


5 slides
Dual Axis Butterfly Diagram Presentation
Give your data the spotlight it deserves with a modern layout designed for clarity and balance. This presentation is perfect for comparing two perspectives, processes, or variables side by side in a visually appealing way. Fully customizable and compatible with PowerPoint, Keynote, and Google Slides.


5 slides
Root Cause Analysis Fishbone Format Presentation
Break down complex problems with the Root Cause Analysis Fishbone Format Presentation. Designed to identify contributing factors visually, this diagram helps teams analyze causes across multiple categories—ideal for quality control, troubleshooting, and process improvement. Fully editable in Canva, PowerPoint, or Google Slides for effortless customization.


4 slides
Company Welcome and Overview Presentation
Set the tone for your business presentation with this professional welcome slide. Designed to introduce your company, services, or mission, it includes a customizable photo and clear text sections. Ideal for onboarding, team meetings, or proposals—fully editable in Canva, PowerPoint, or Google Slides for a polished first impression.