


Features
- 26 Unique slides
- Fully editable and easy to edit in Microsoft Powerpoint, Keynote and Google Slides
- 16:9 widescreen layout
- Clean and professional designs
- Export to JPG, PDF or send by email


Do you have any questions?
Recommend


20 slides
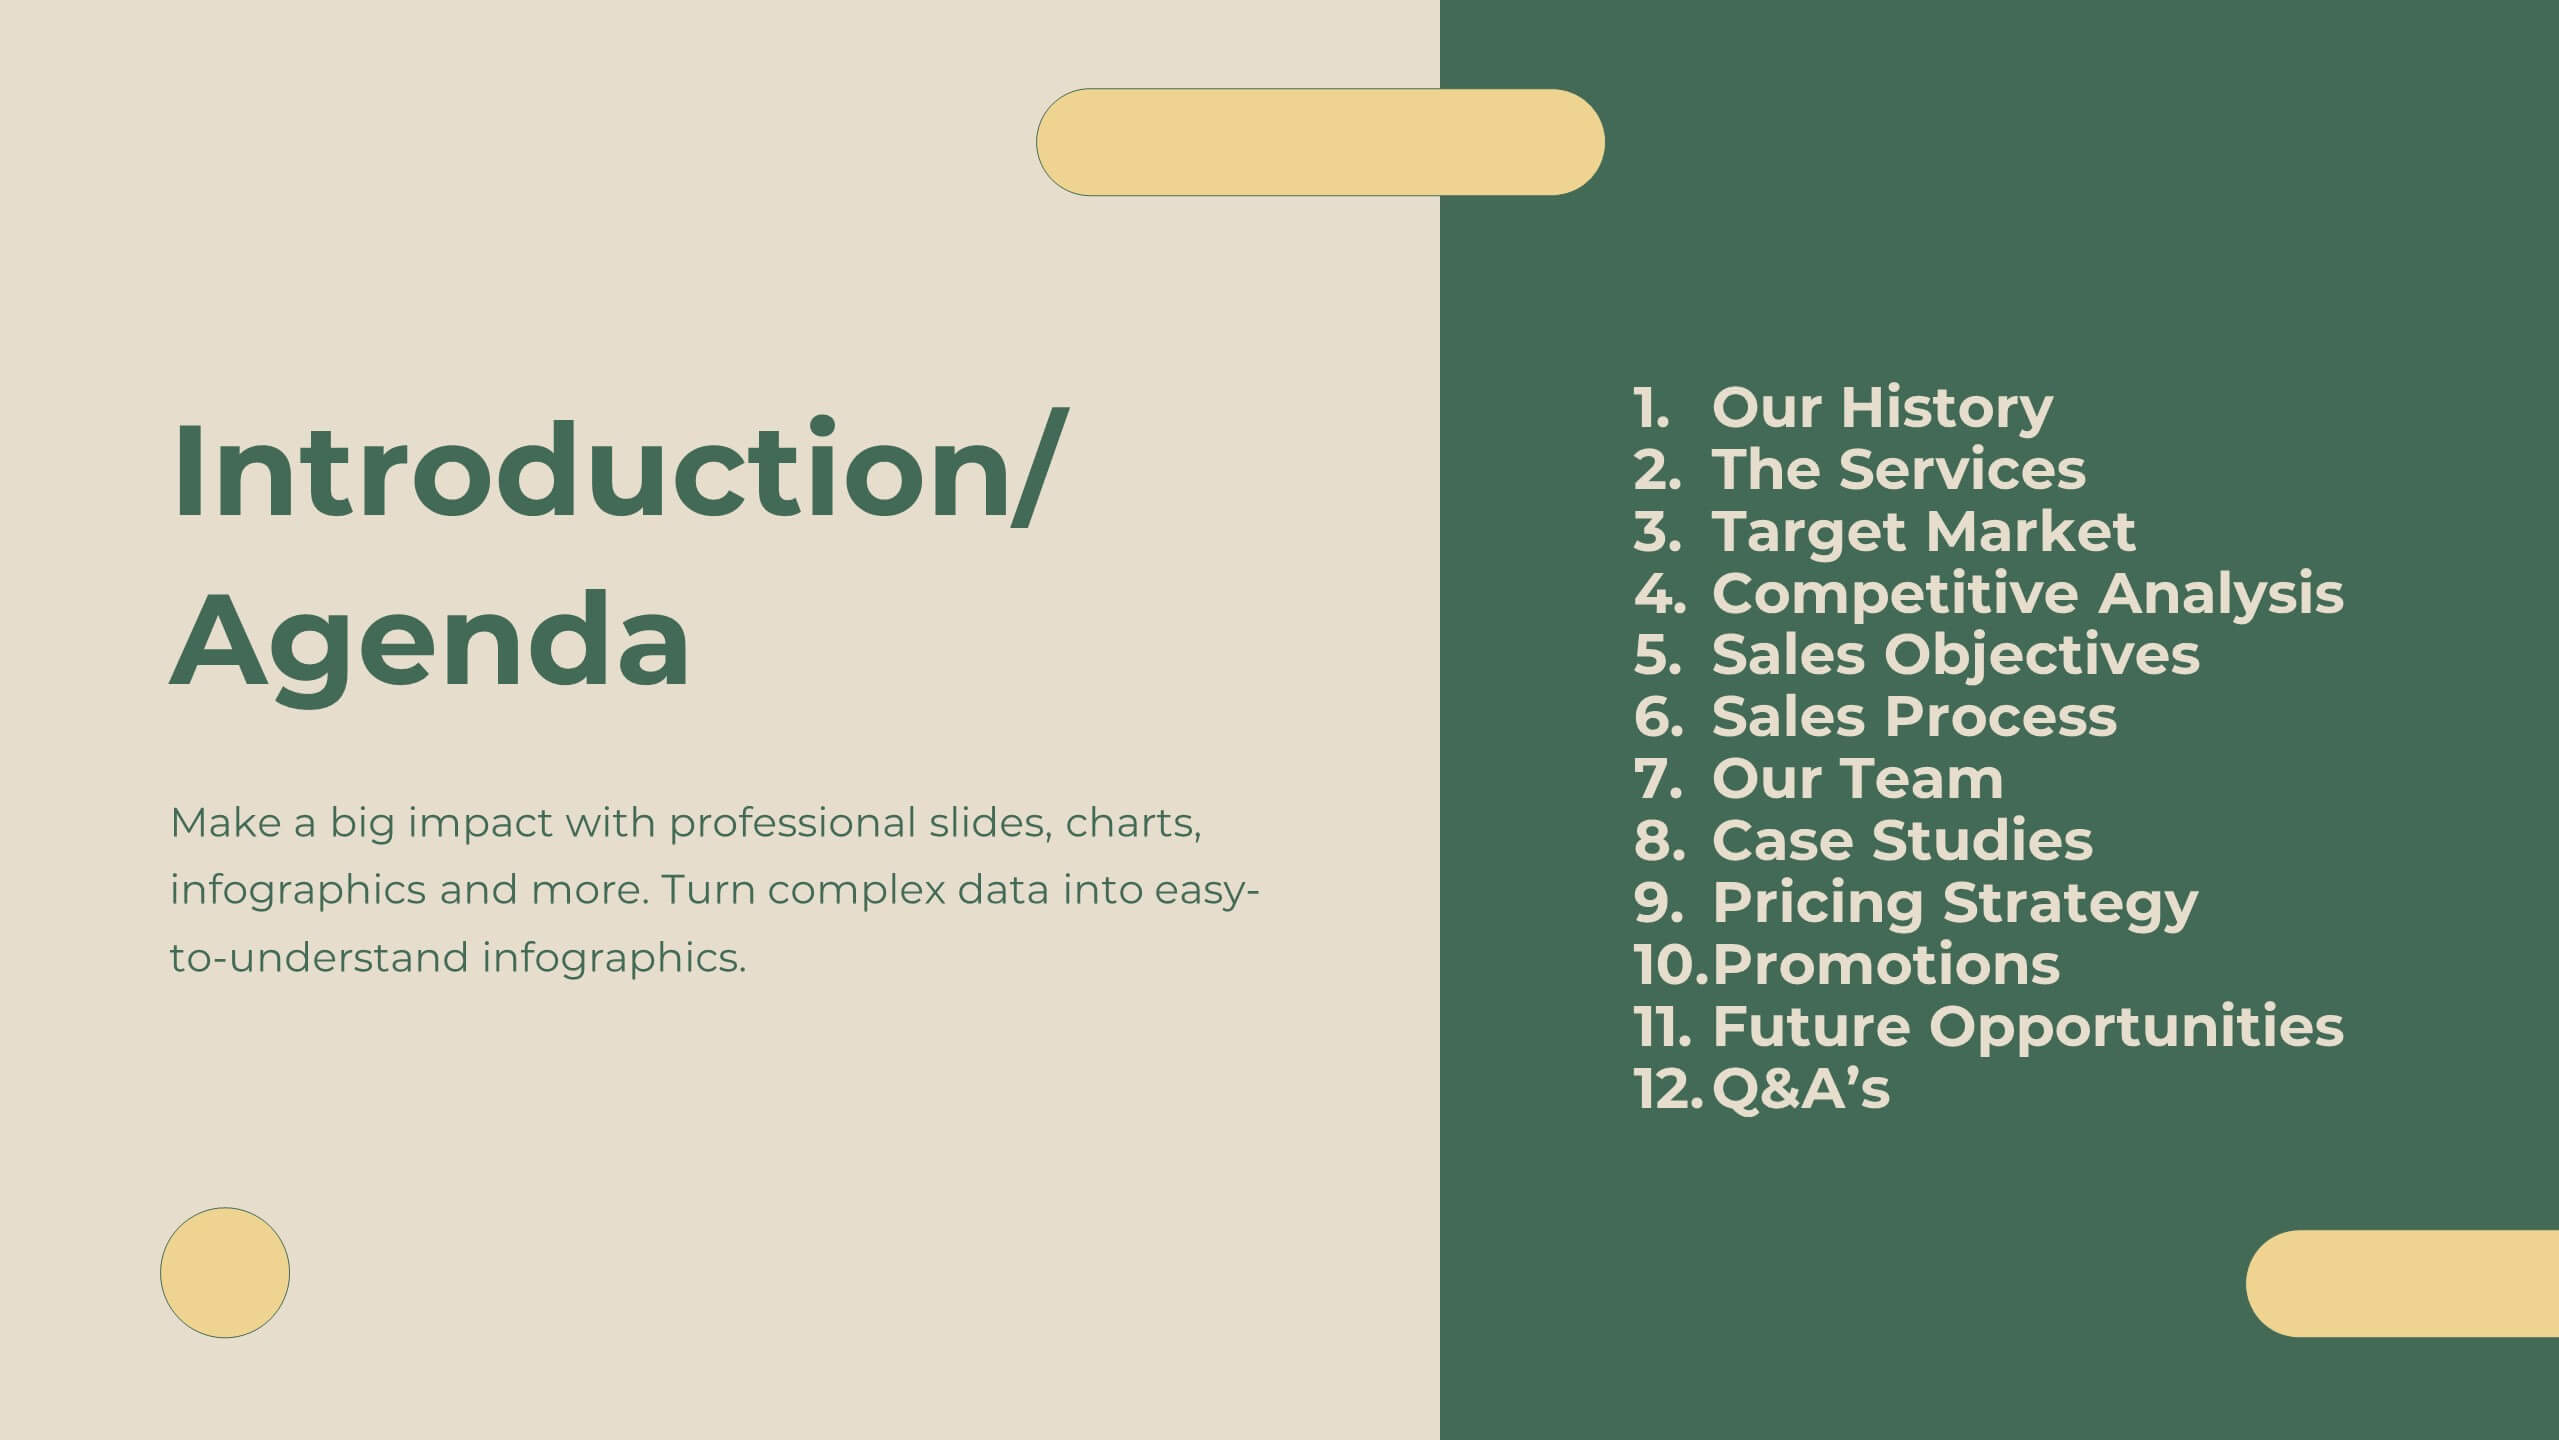
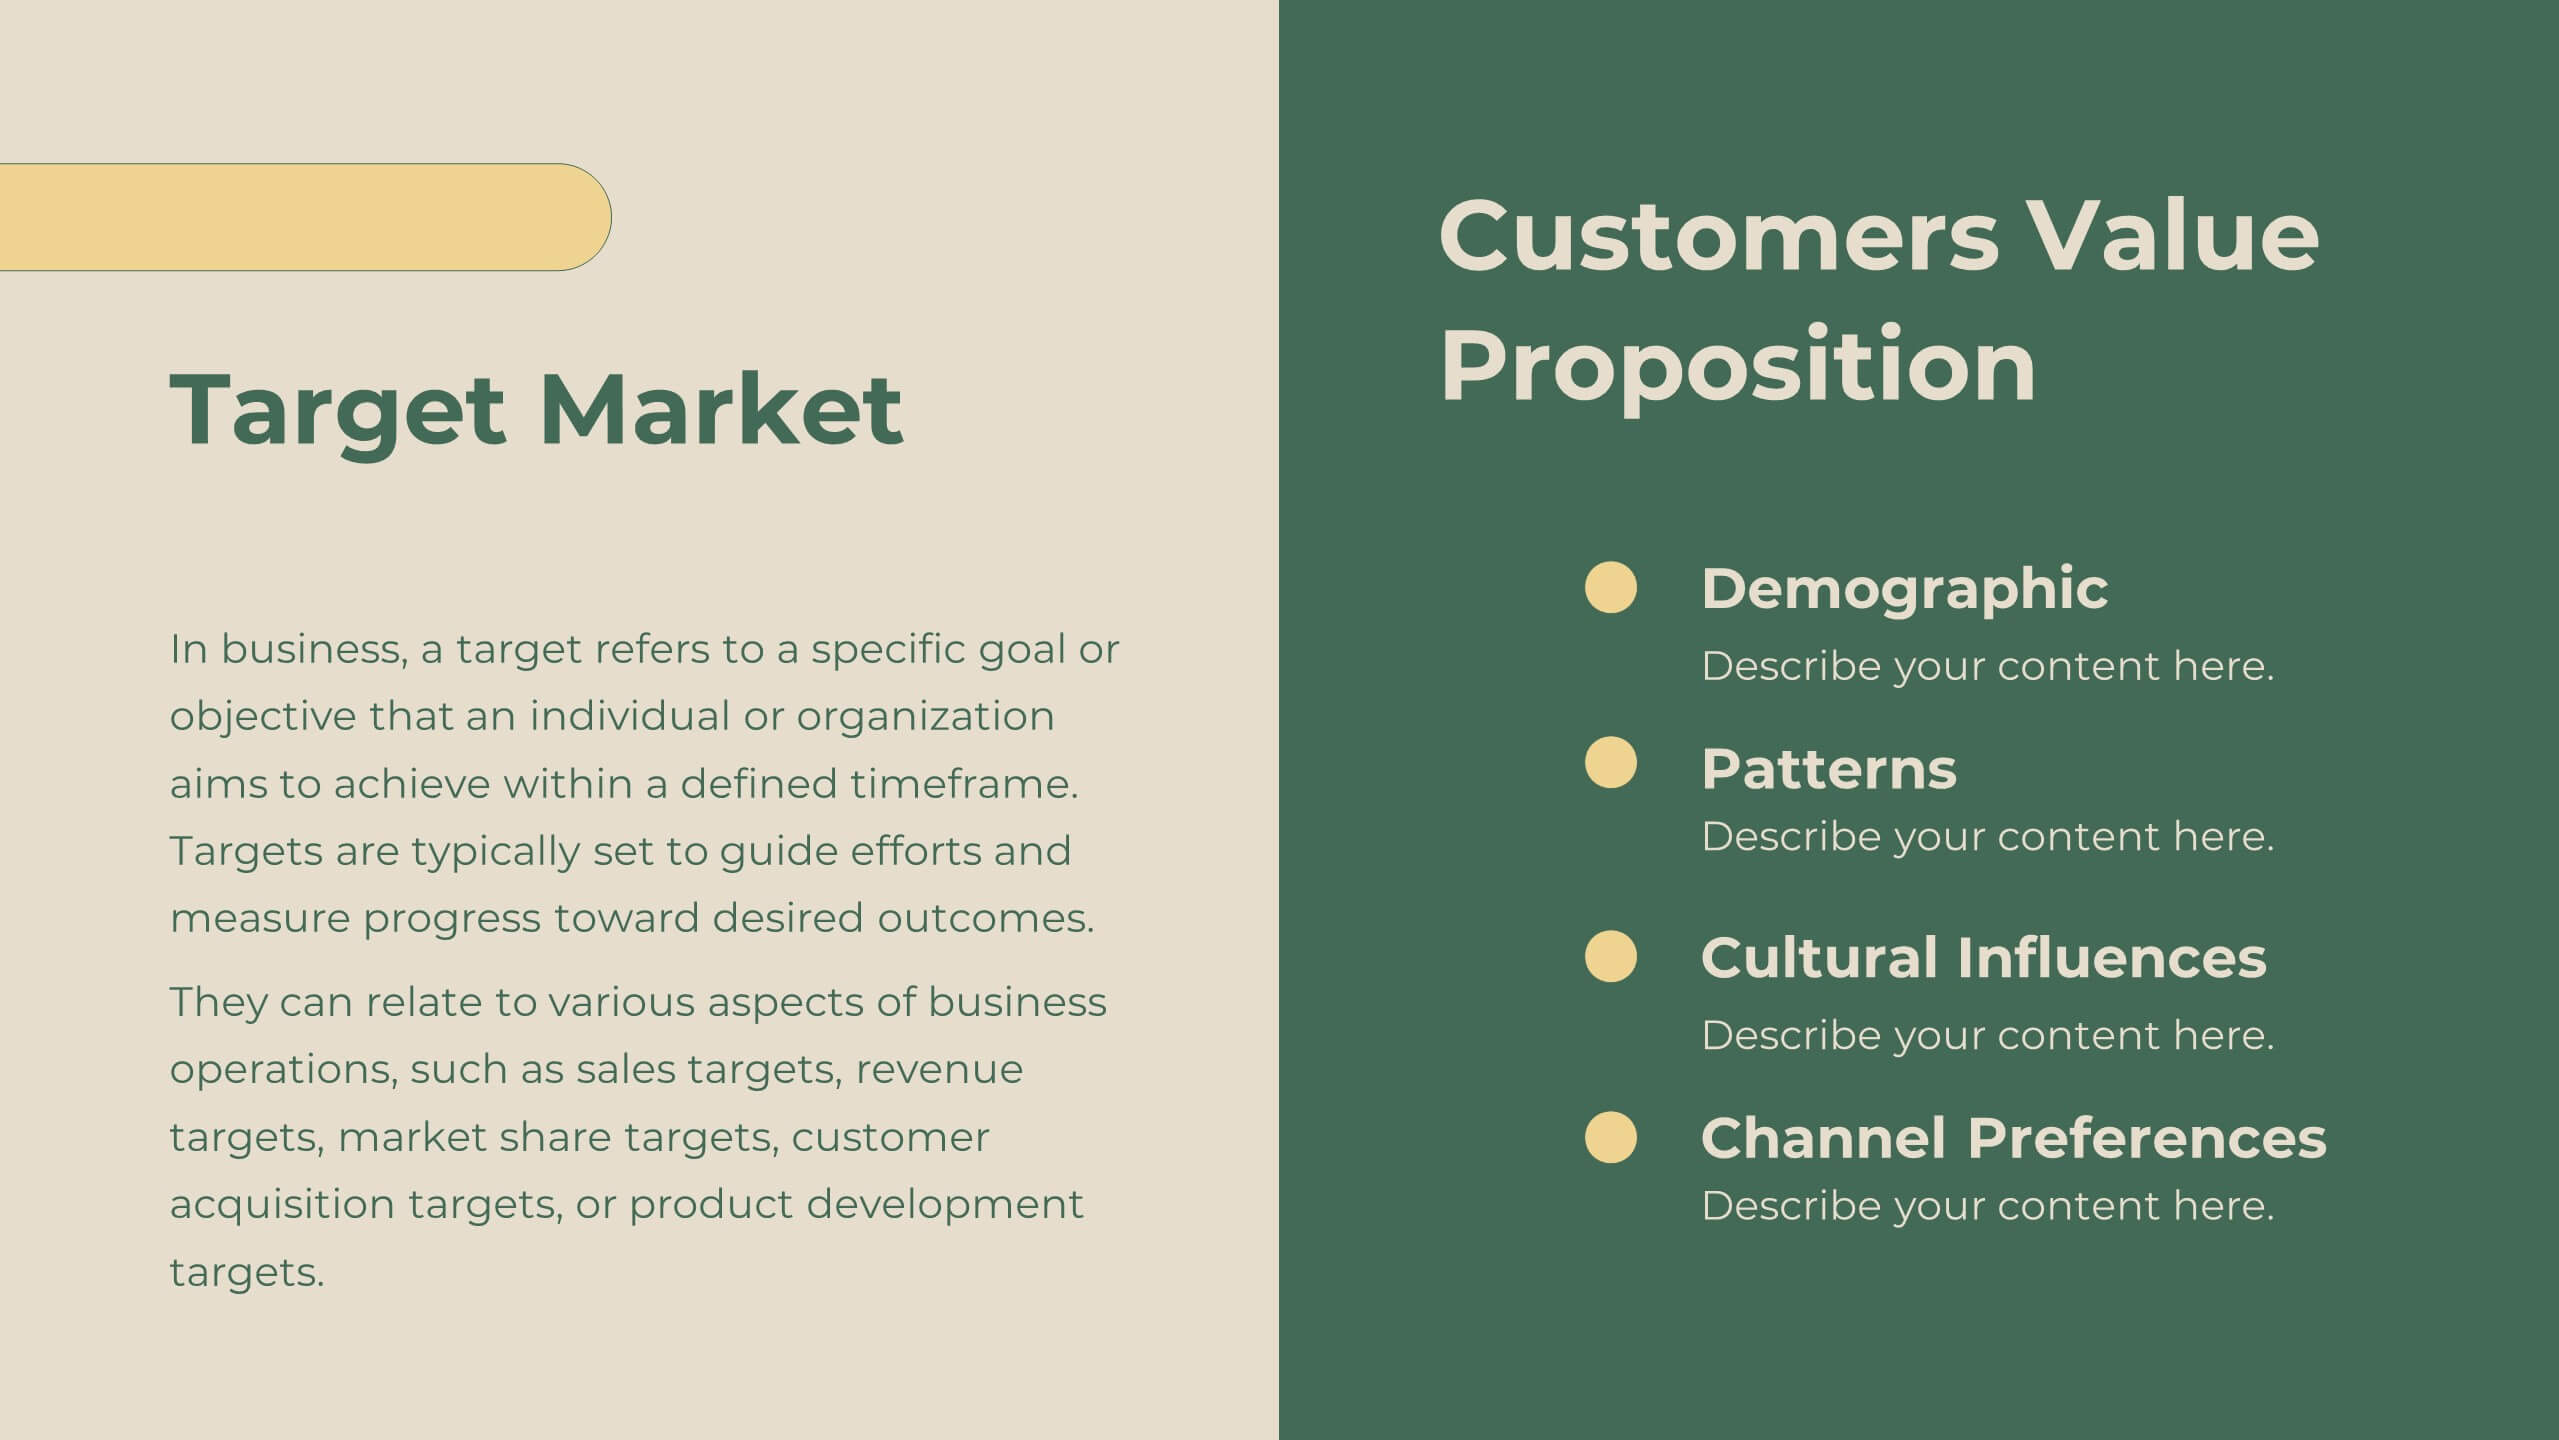
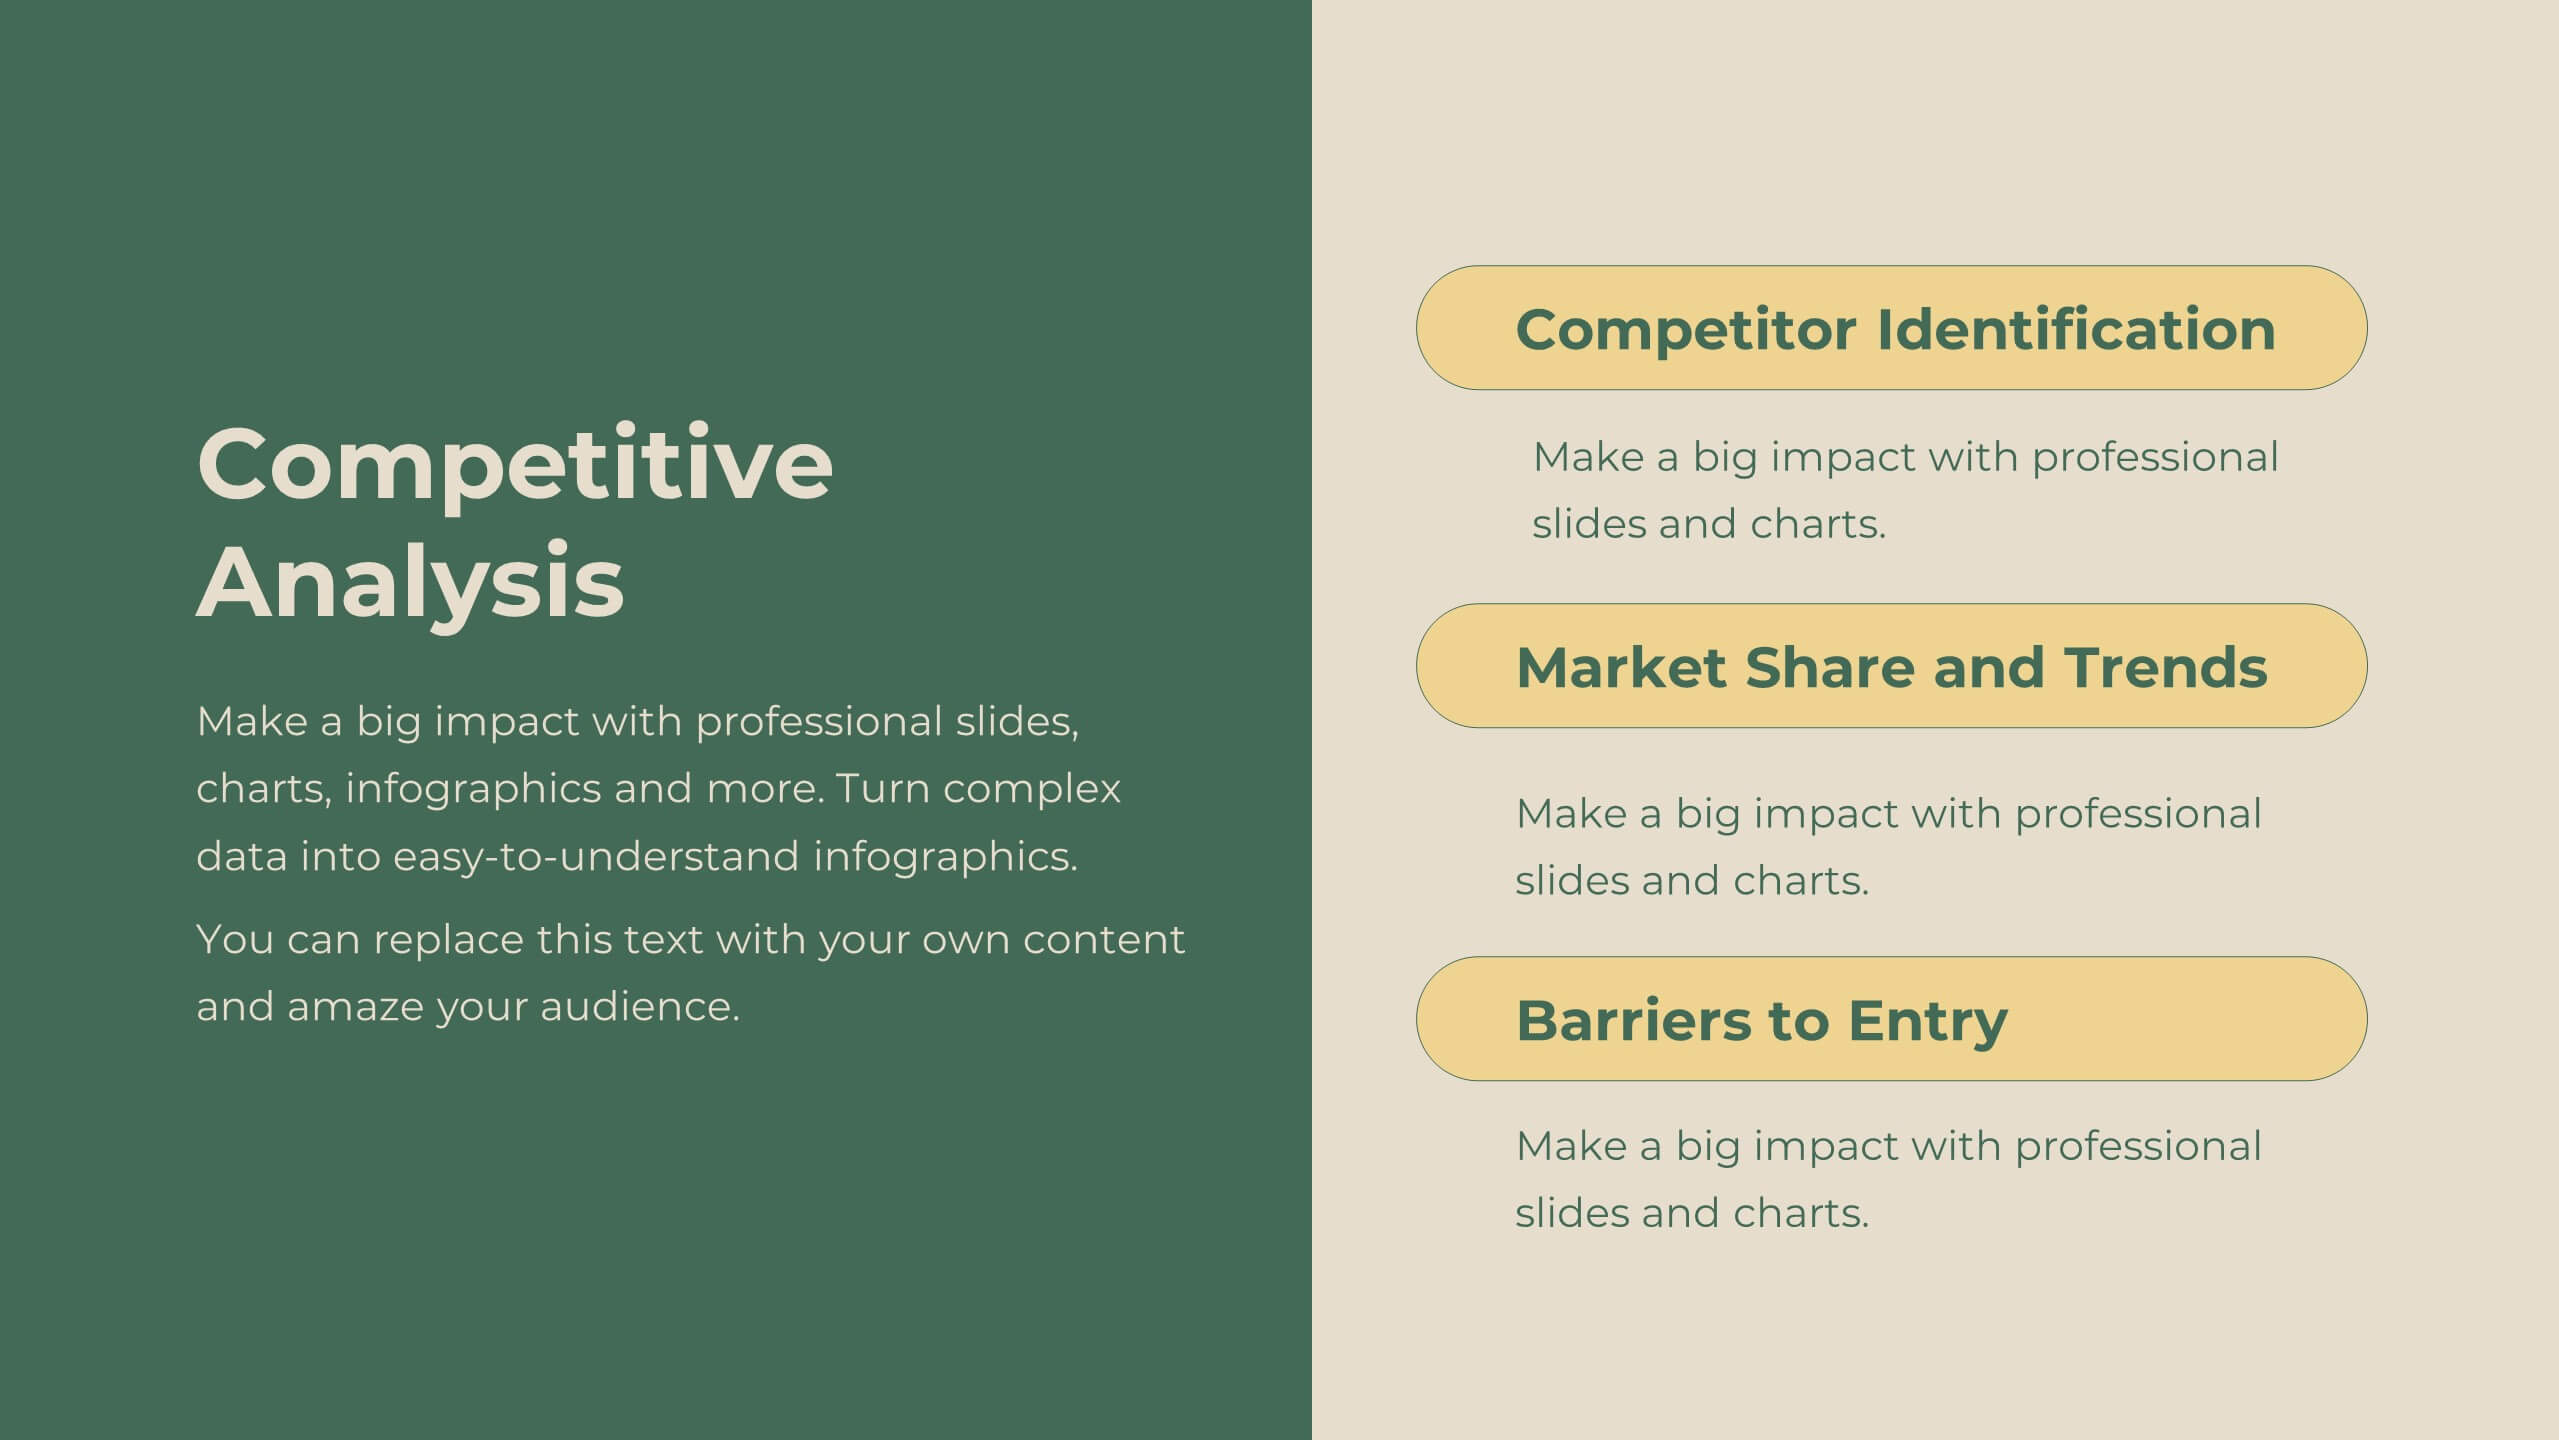
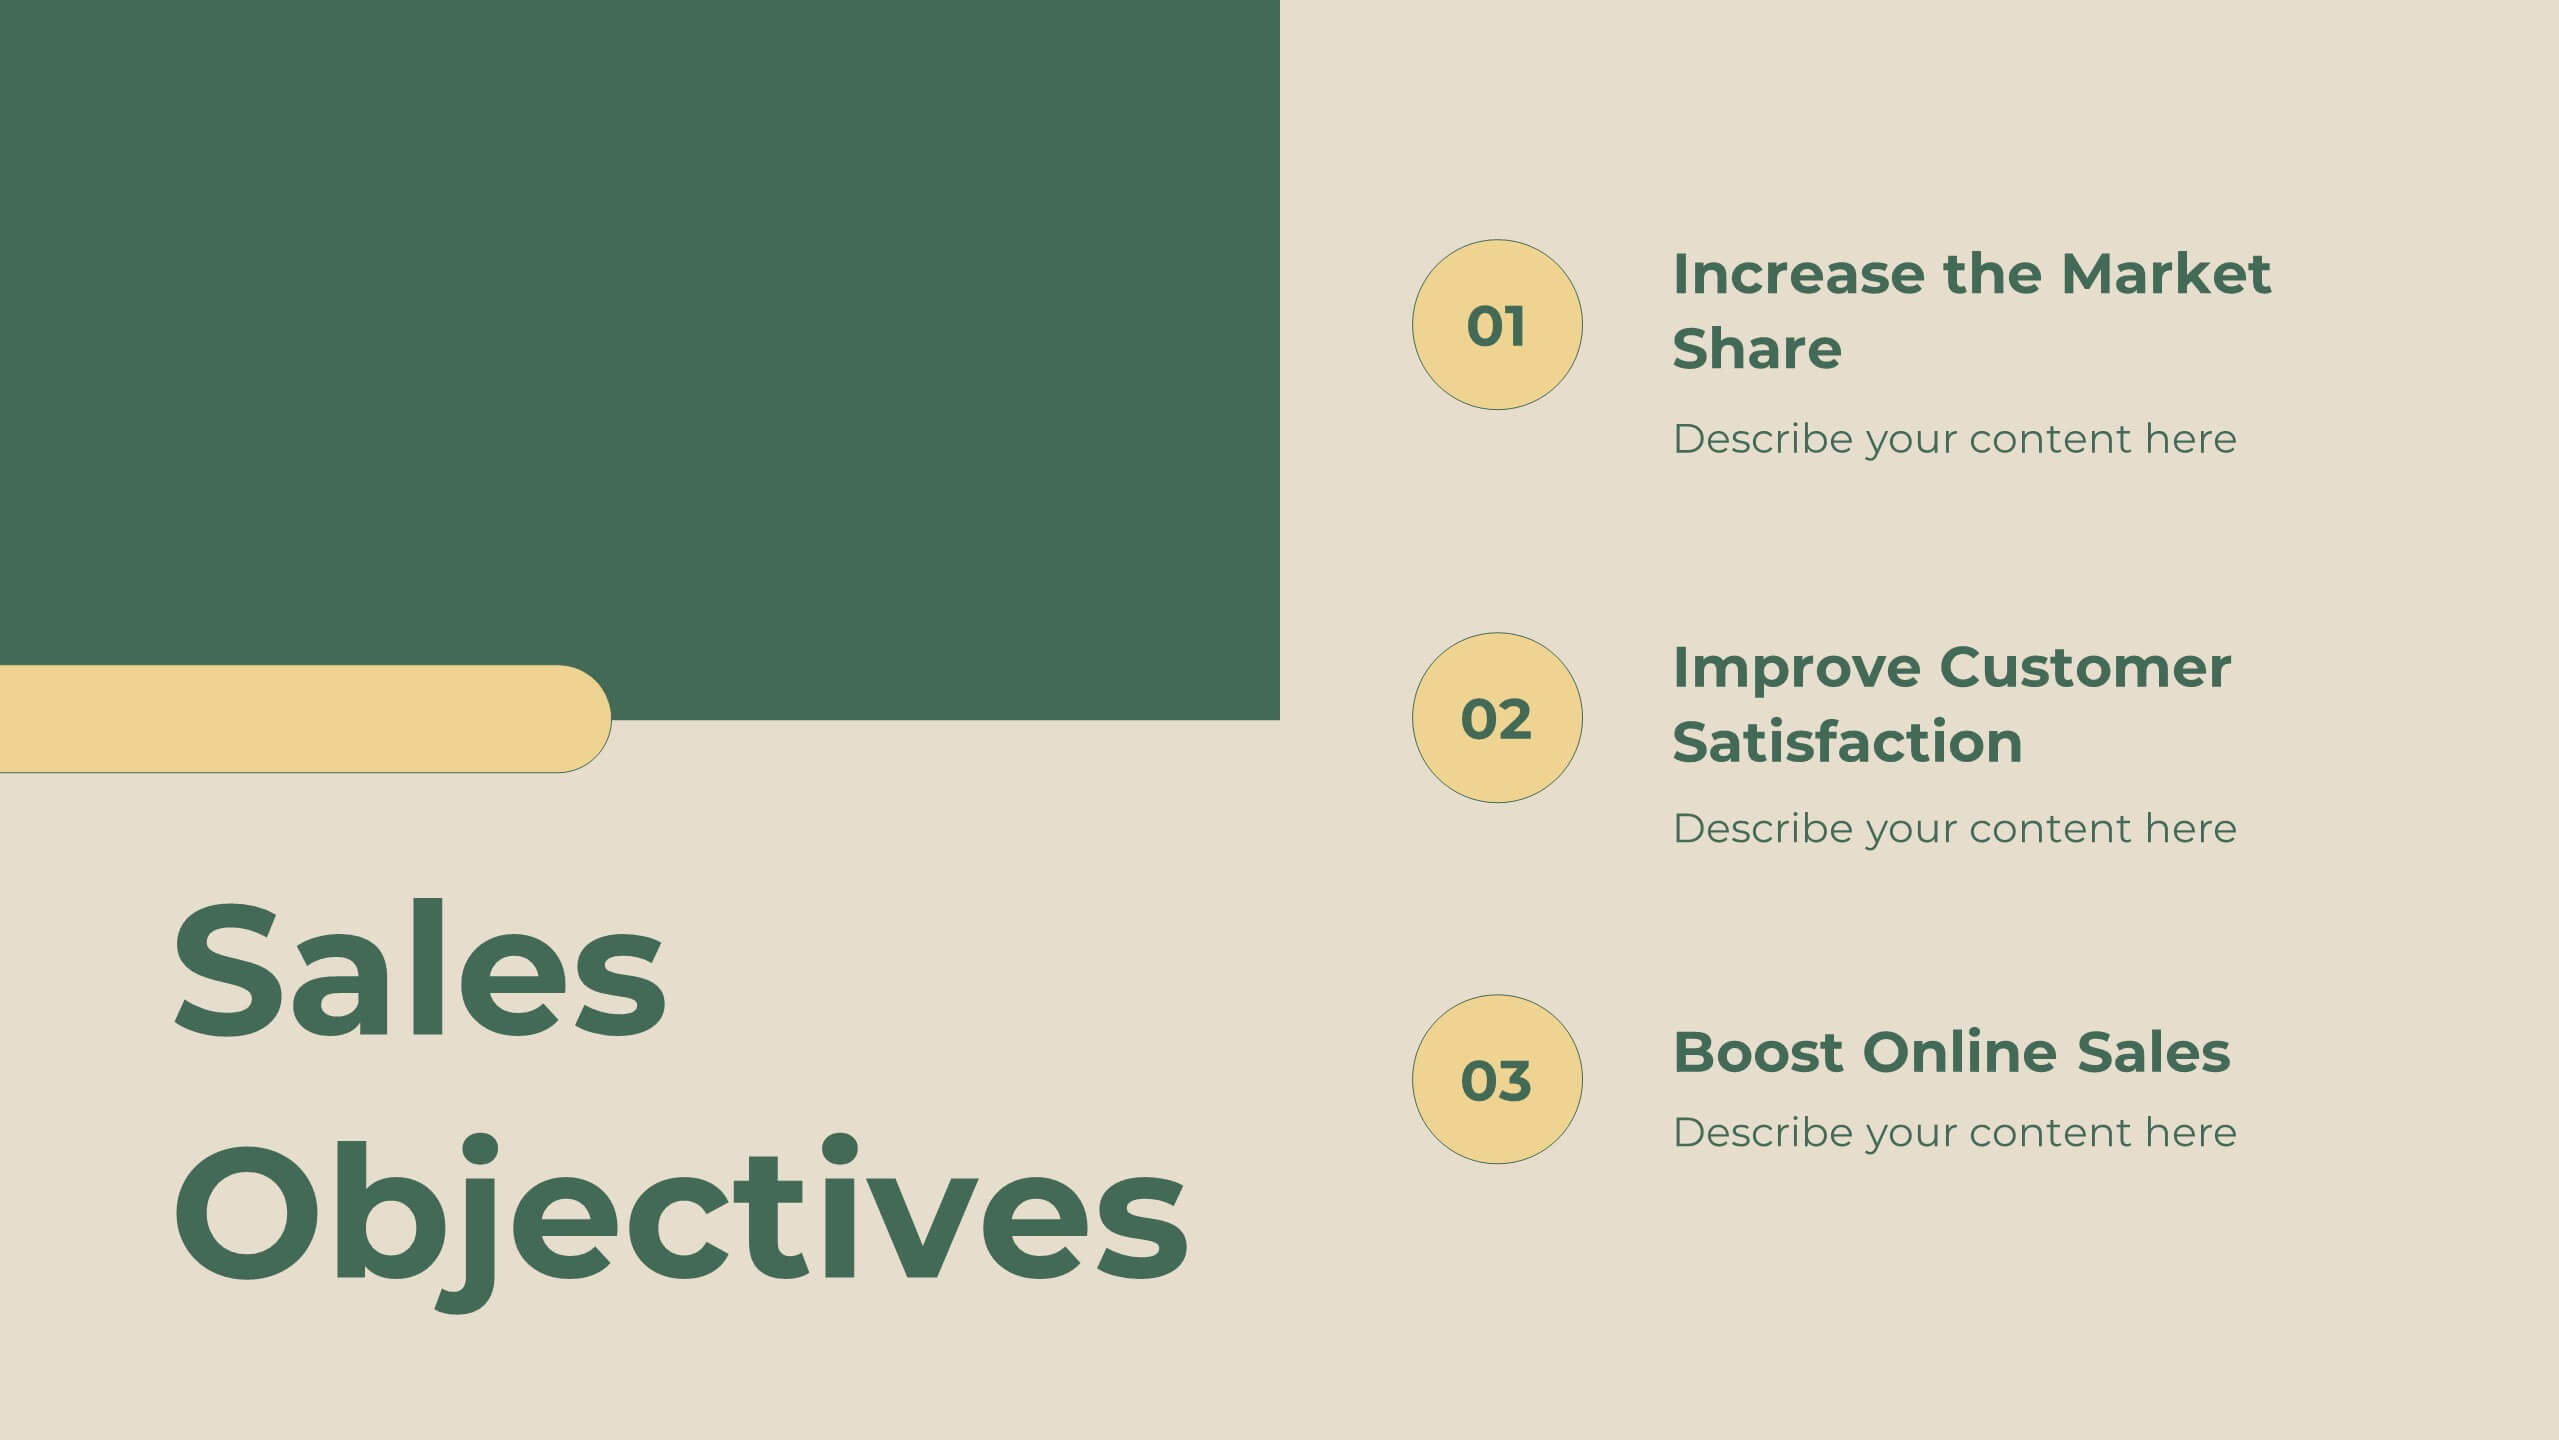
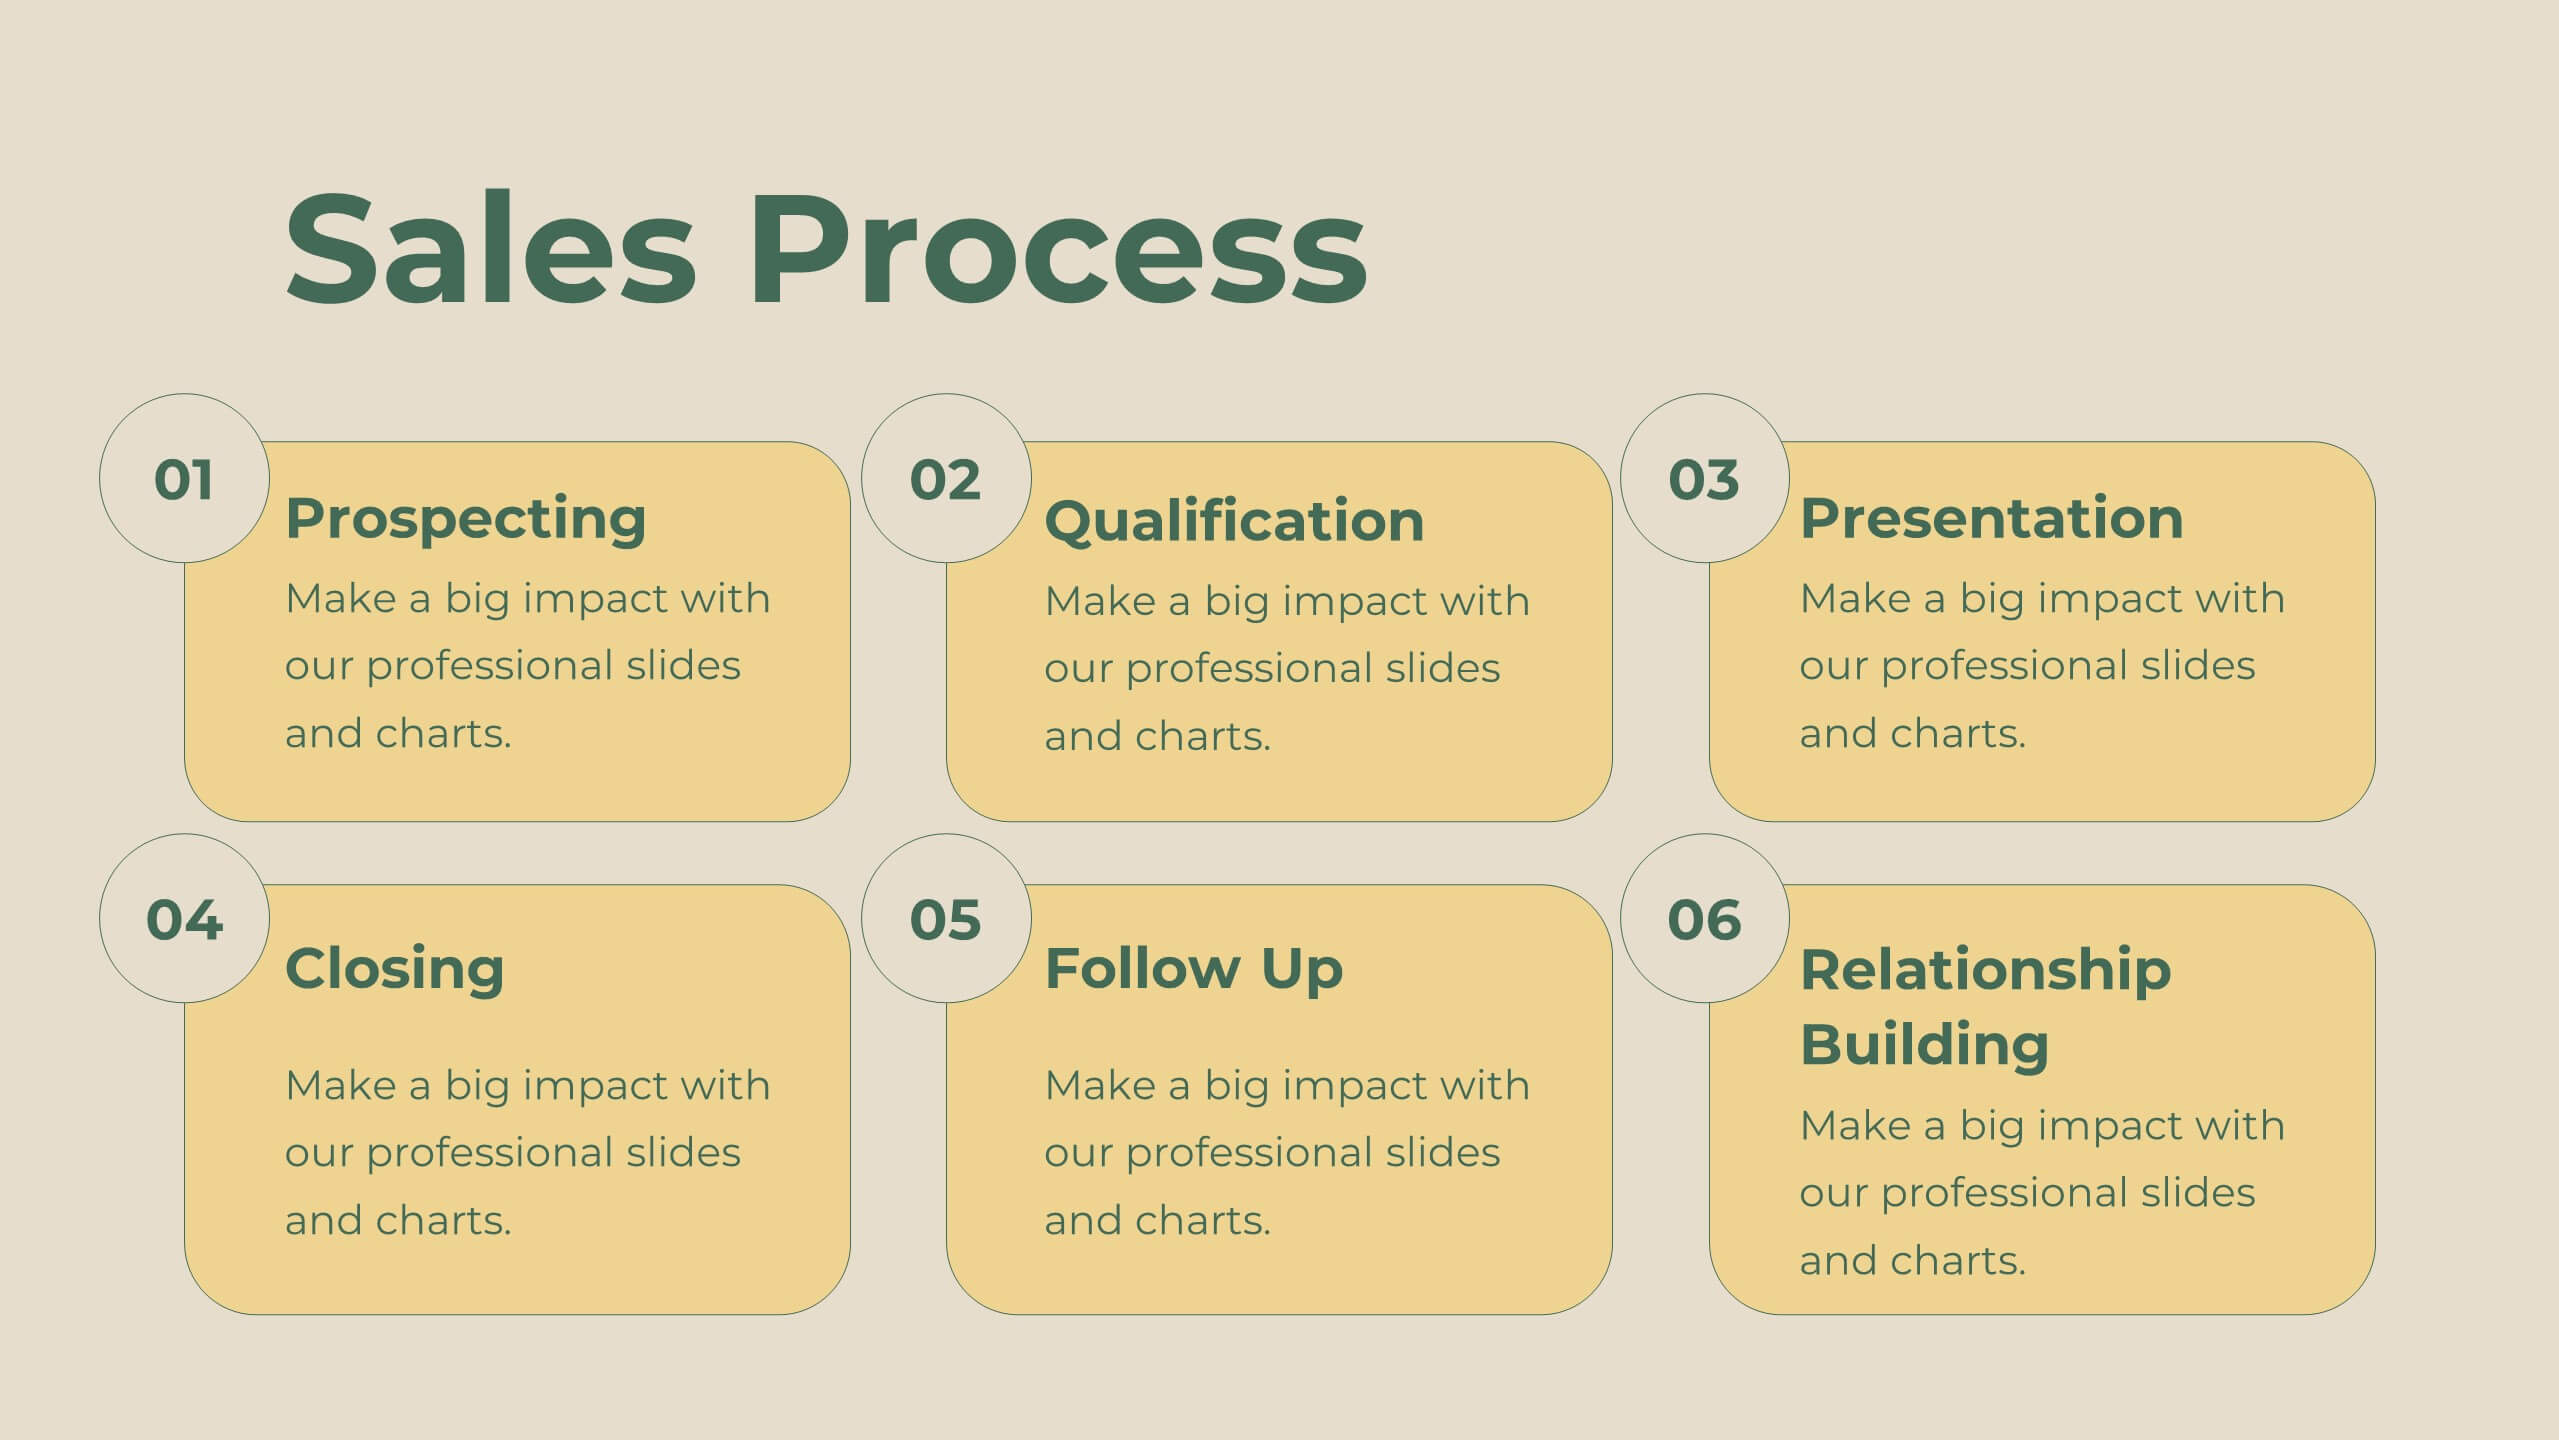
Legacy Sales Strategy Presentation
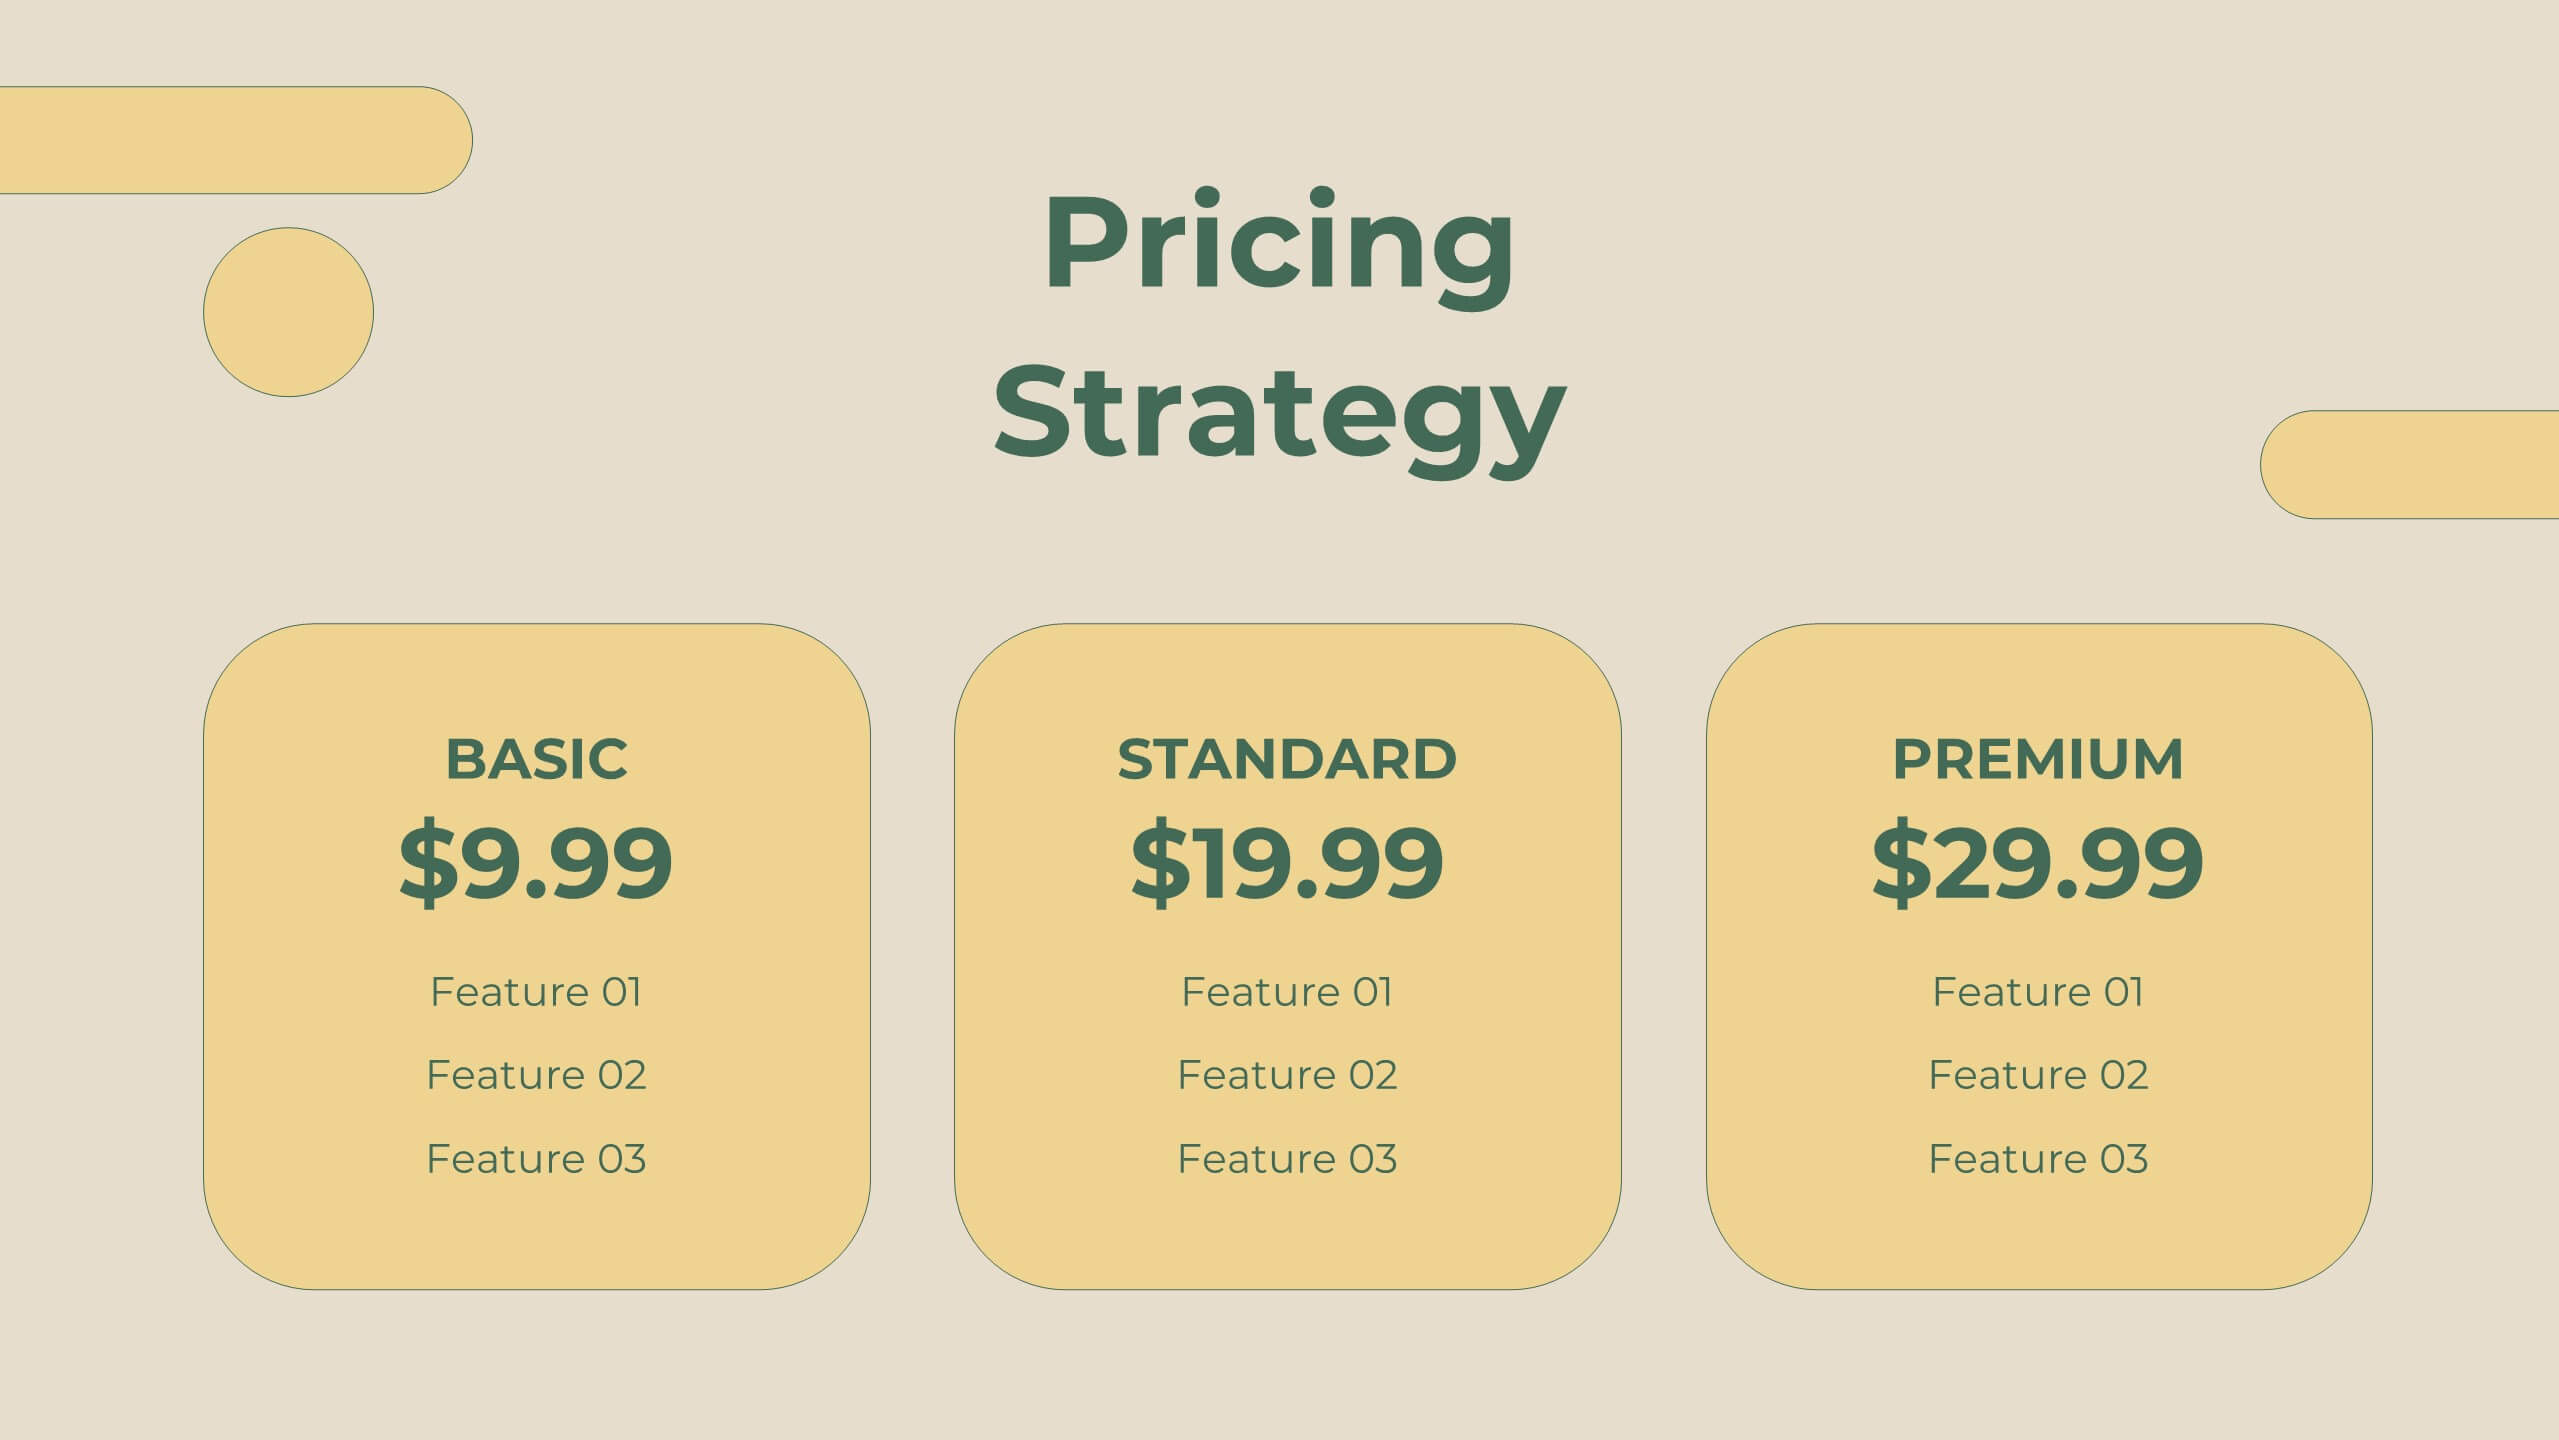
Boost your sales presentations with this modern template! It features sections for objectives, process, team introduction, customer testimonials, and performance metrics. Ideal for outlining strategies, opportunities, and pricing. Engage your audience with a professional, clean design. Compatible with PowerPoint, Keynote, and Google Slides for seamless integration. Make your sales strategy stand out!
4 slides
Arrow Path Business Journey Presentation
Visualize growth, decisions, and direction with the Arrow Path Business Journey Presentation. This dynamic slide is designed to illustrate key stages, multiple outcomes, or strategic forks in the road. Great for showing parallel team tracks, phased development, or transformation journeys. Fully editable and works seamlessly in PowerPoint, Google Slides, and Canva.


5 slides
Business Development Five-Step Plan Presentation
Accelerate your growth with the Business Development Five-Step Plan presentation. This structured template guides you through key stages of business expansion, from strategy to execution. Designed for entrepreneurs, startups, and corporate teams, this clear and engaging format ensures effective planning and communication. Fully customizable for PowerPoint, Keynote, and Google Slides to fit your specific needs.


14 slides
Business Innovation and Idea Development Presentation
Drive Business Innovation and Idea Development with this dynamic and structured template, perfect for illustrating creative processes, strategic growth, and idea execution. Designed with a lightbulb-themed layout, this presentation helps break down complex concepts into clear, engaging sections. Fully customizable and compatible with PowerPoint, Keynote, and Google Slides, making it an essential tool for entrepreneurs, teams, and business leaders looking to present ideas with impact.


5 slides
Concentric Circle Model Presentation
Make your ideas ripple outward with a layered, modern design that visualizes relationships and hierarchies in a clear, engaging way. Perfect for mapping influence, impact, or organizational structures, this layout brings balance to your visuals. Fully editable and compatible with PowerPoint, Keynote, and Google Slides for seamless customization.

21 slides
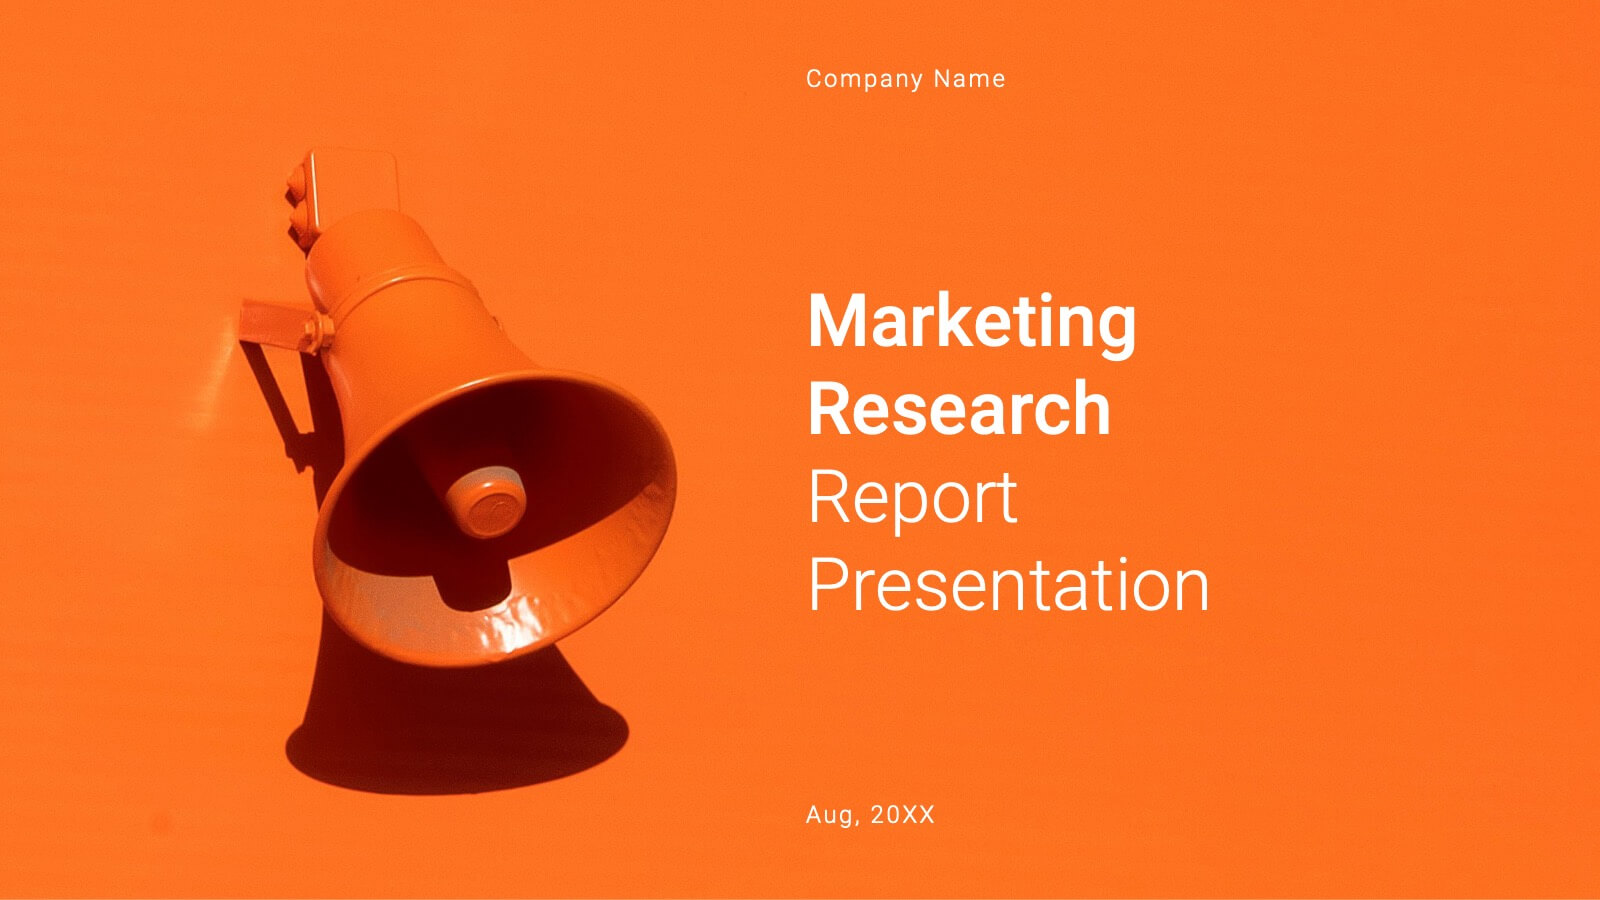
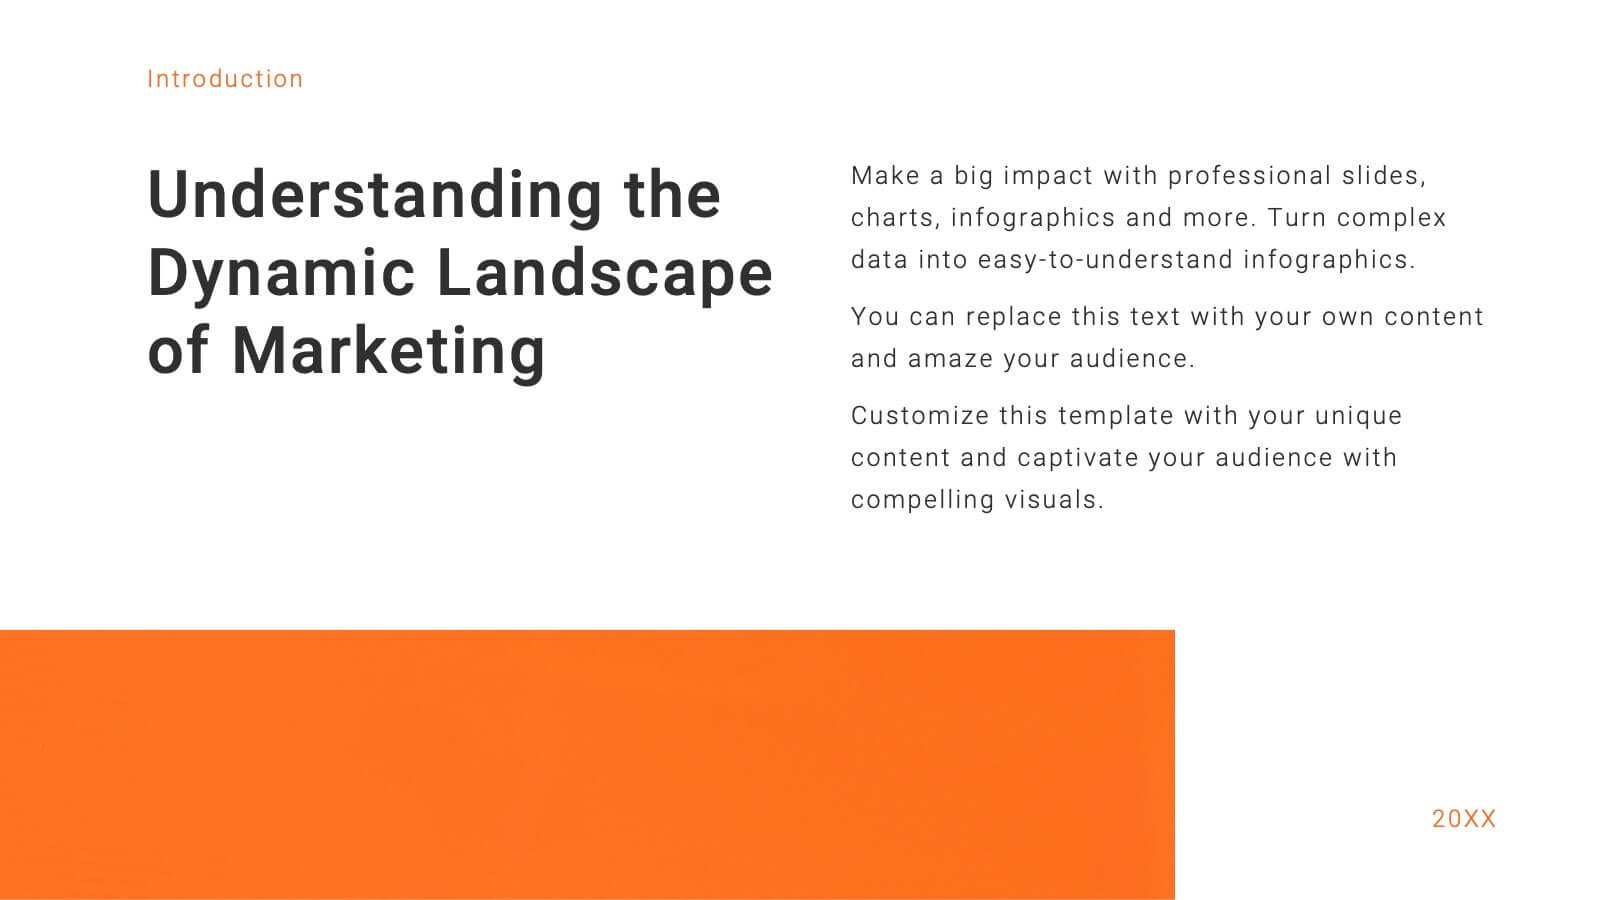
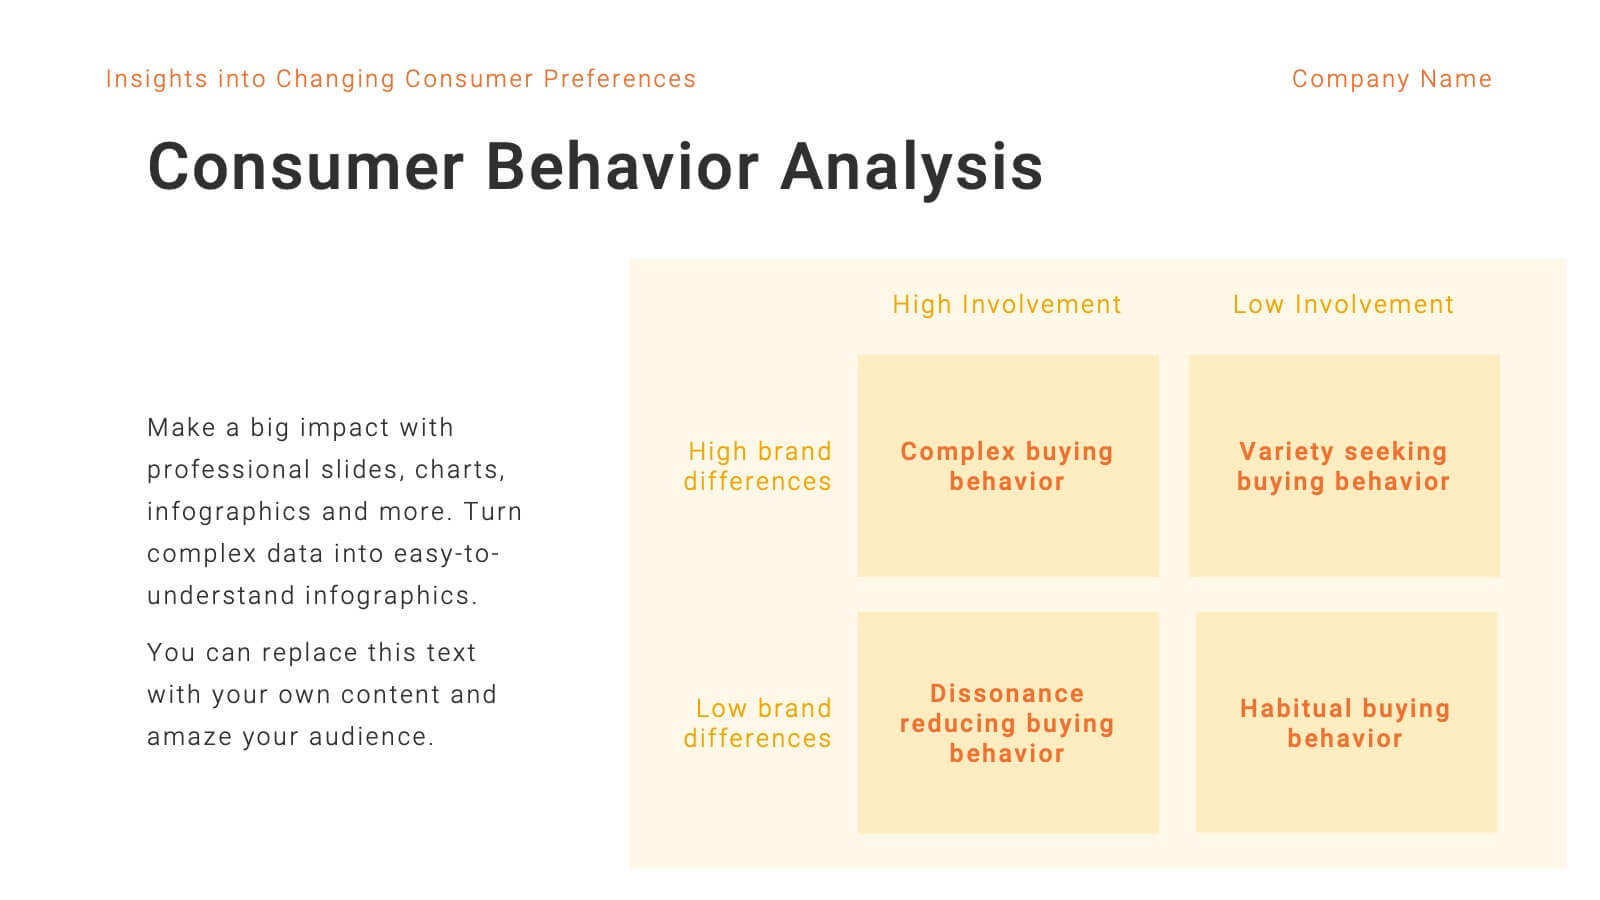
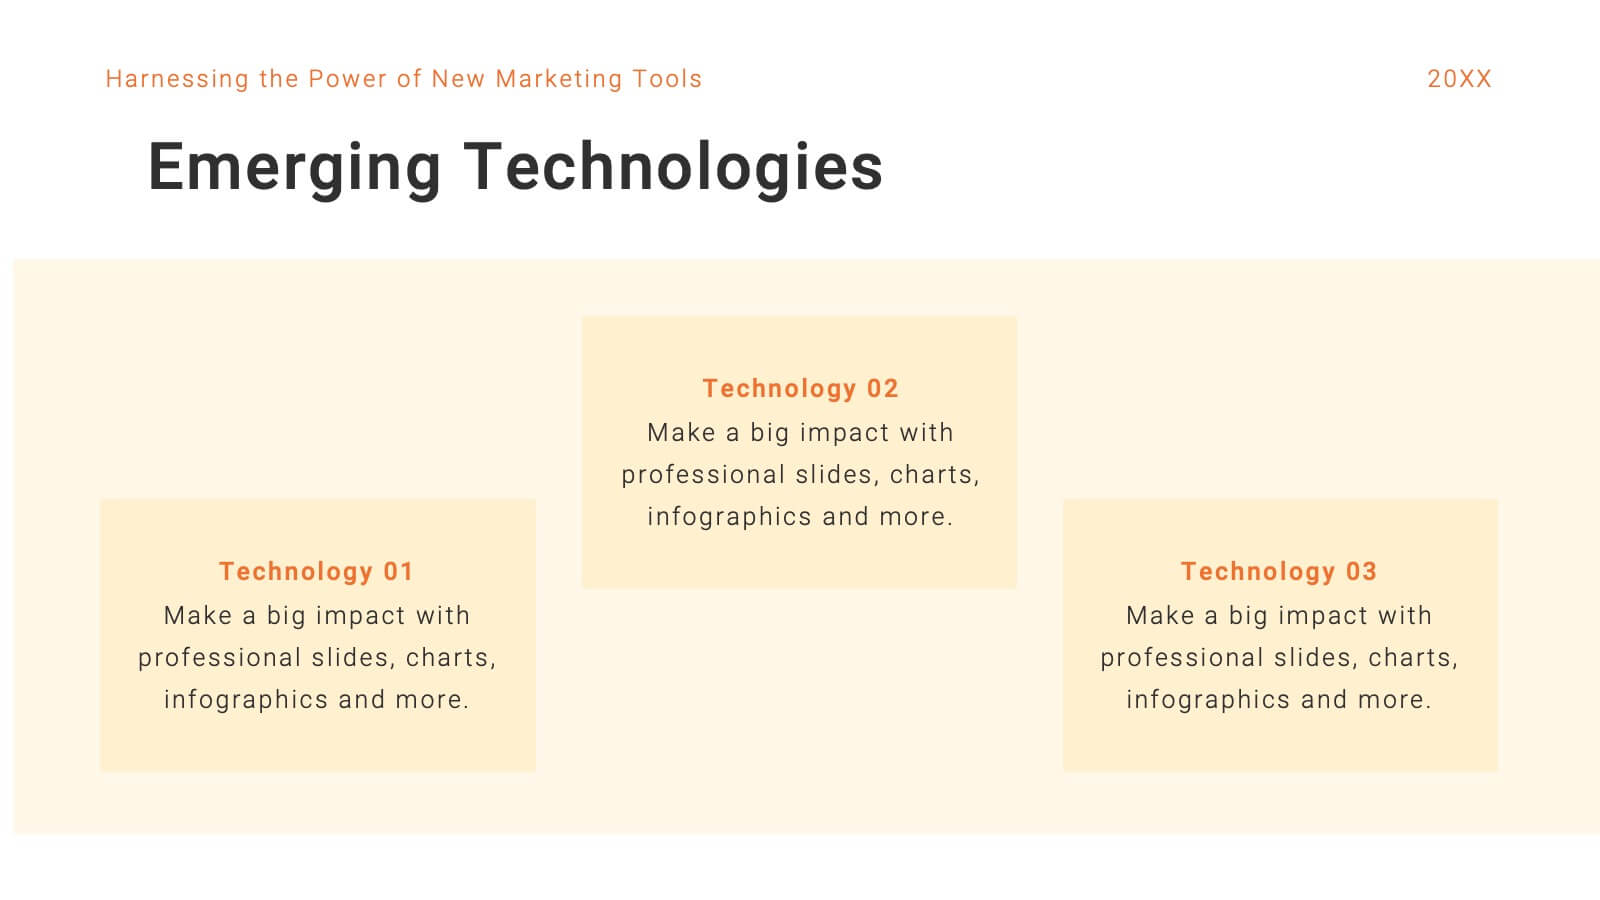
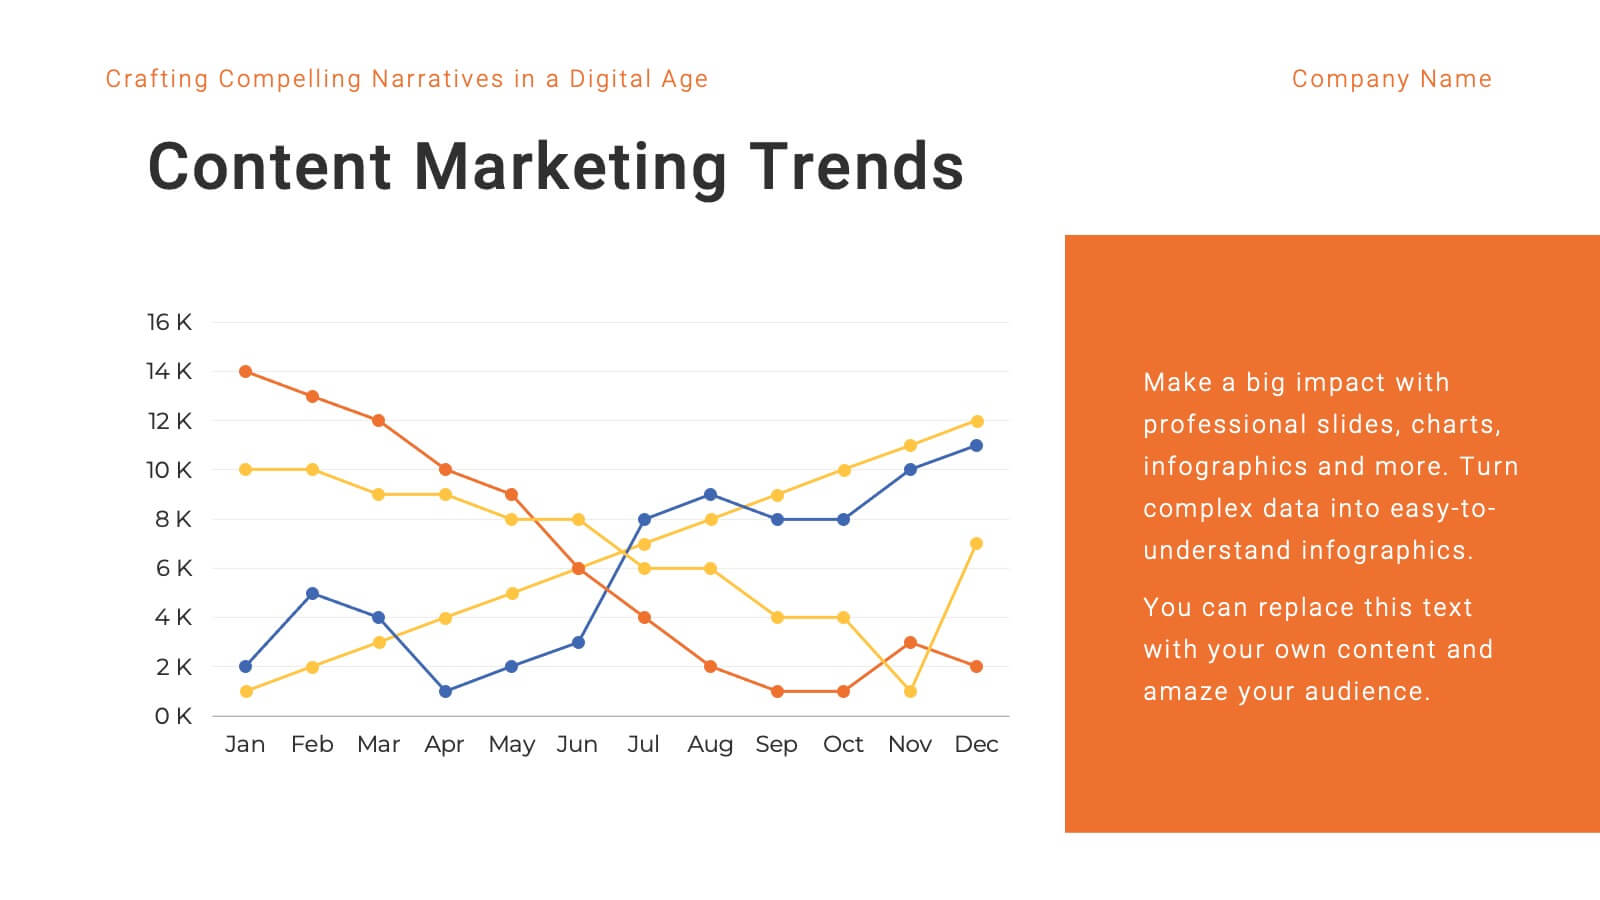
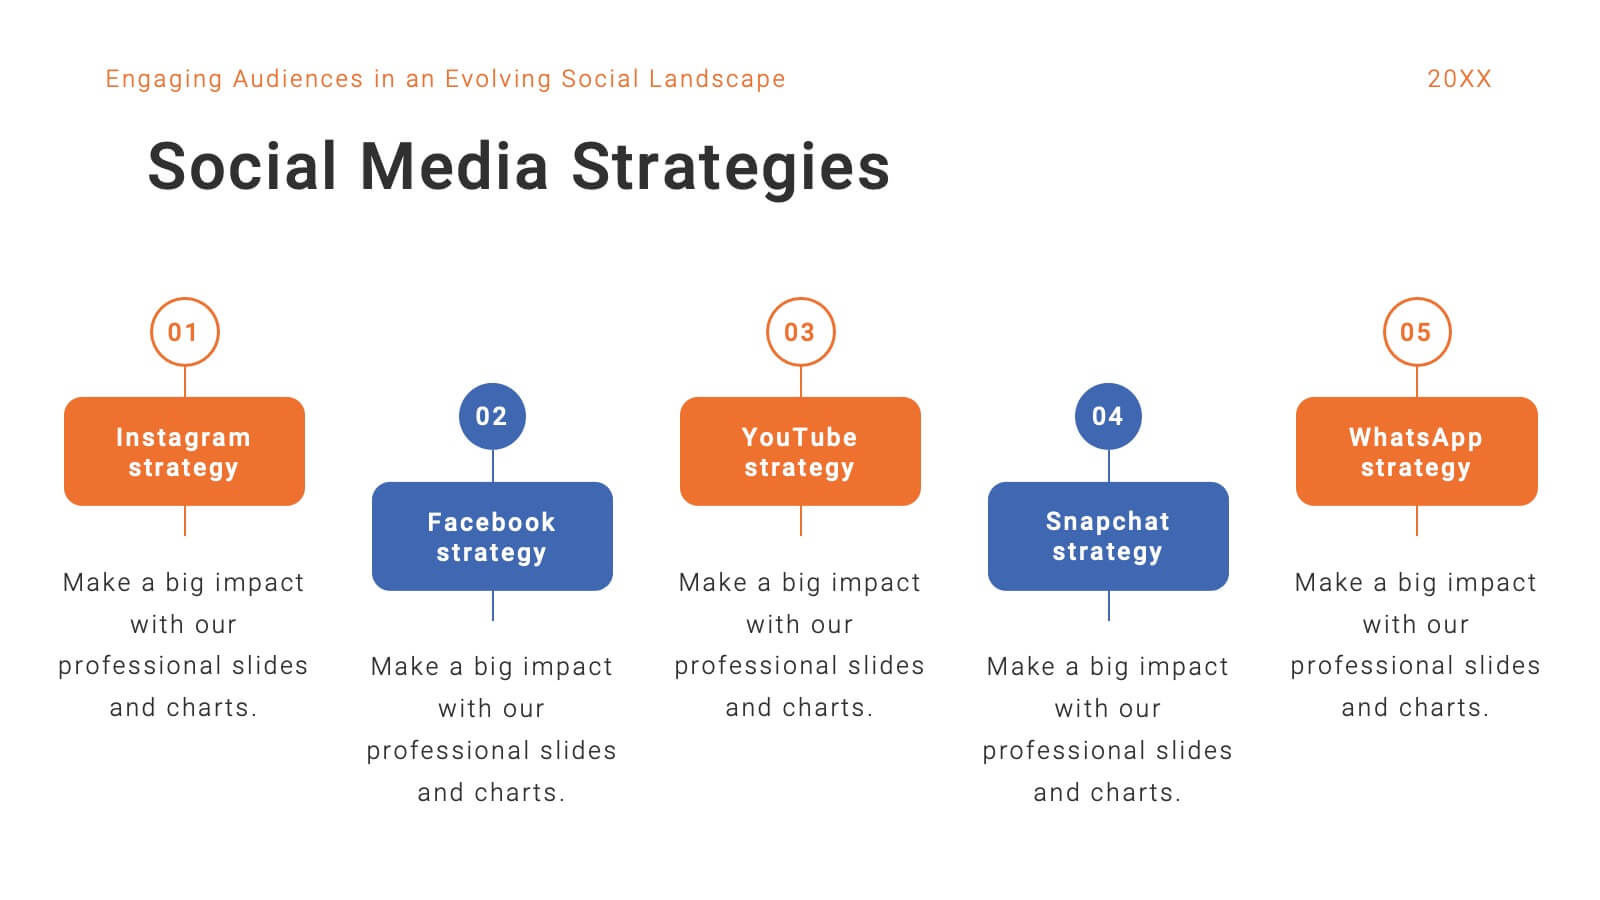
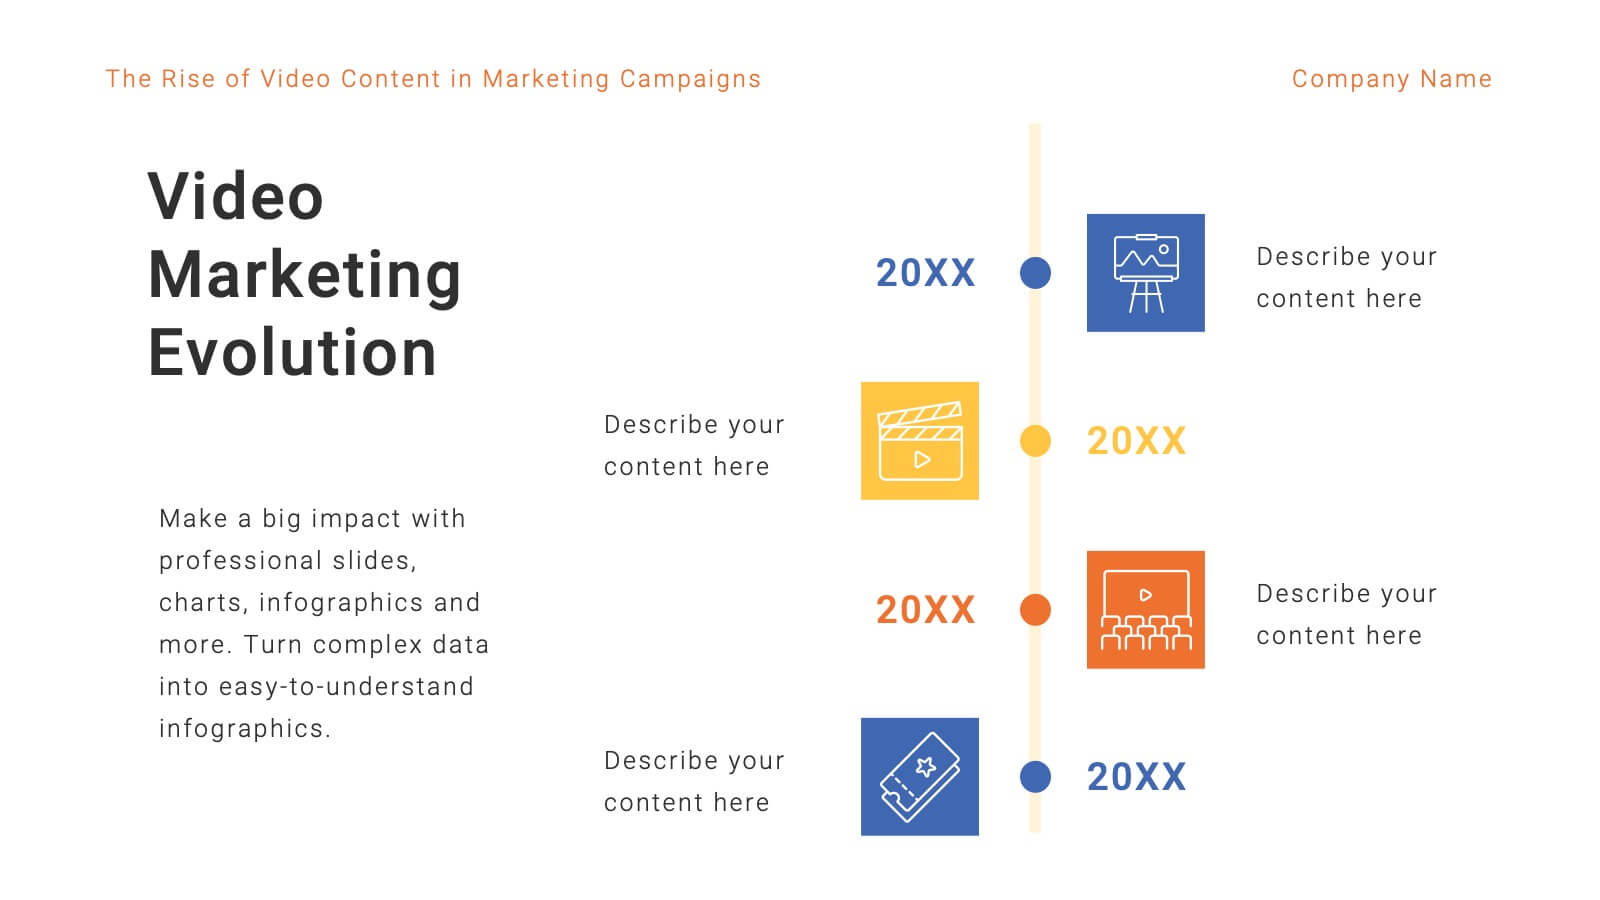
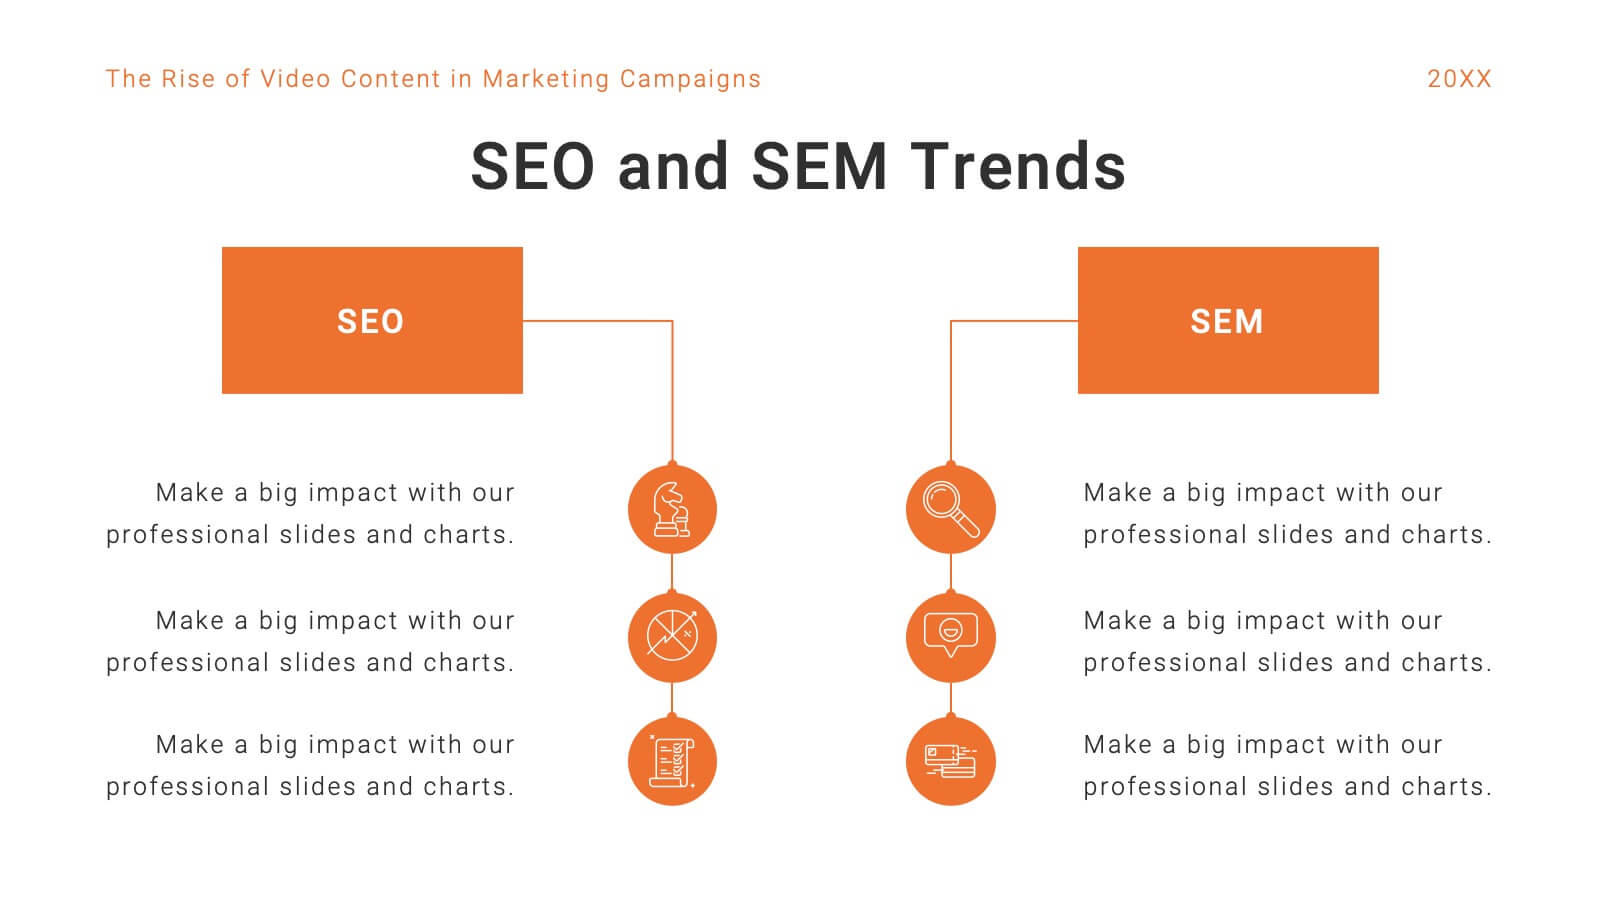
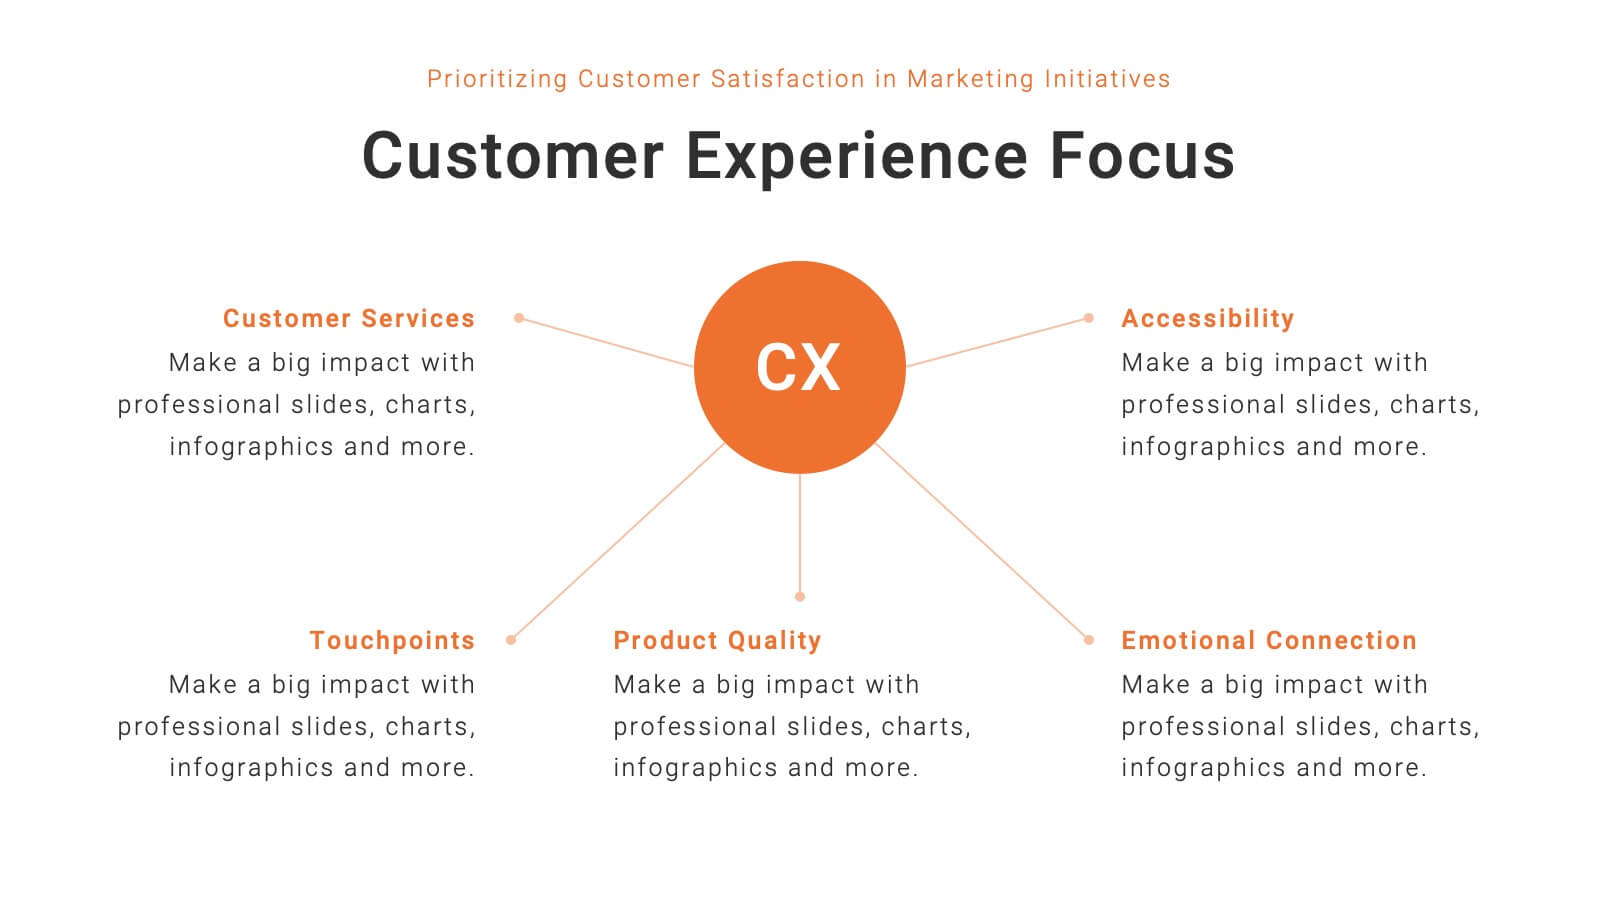
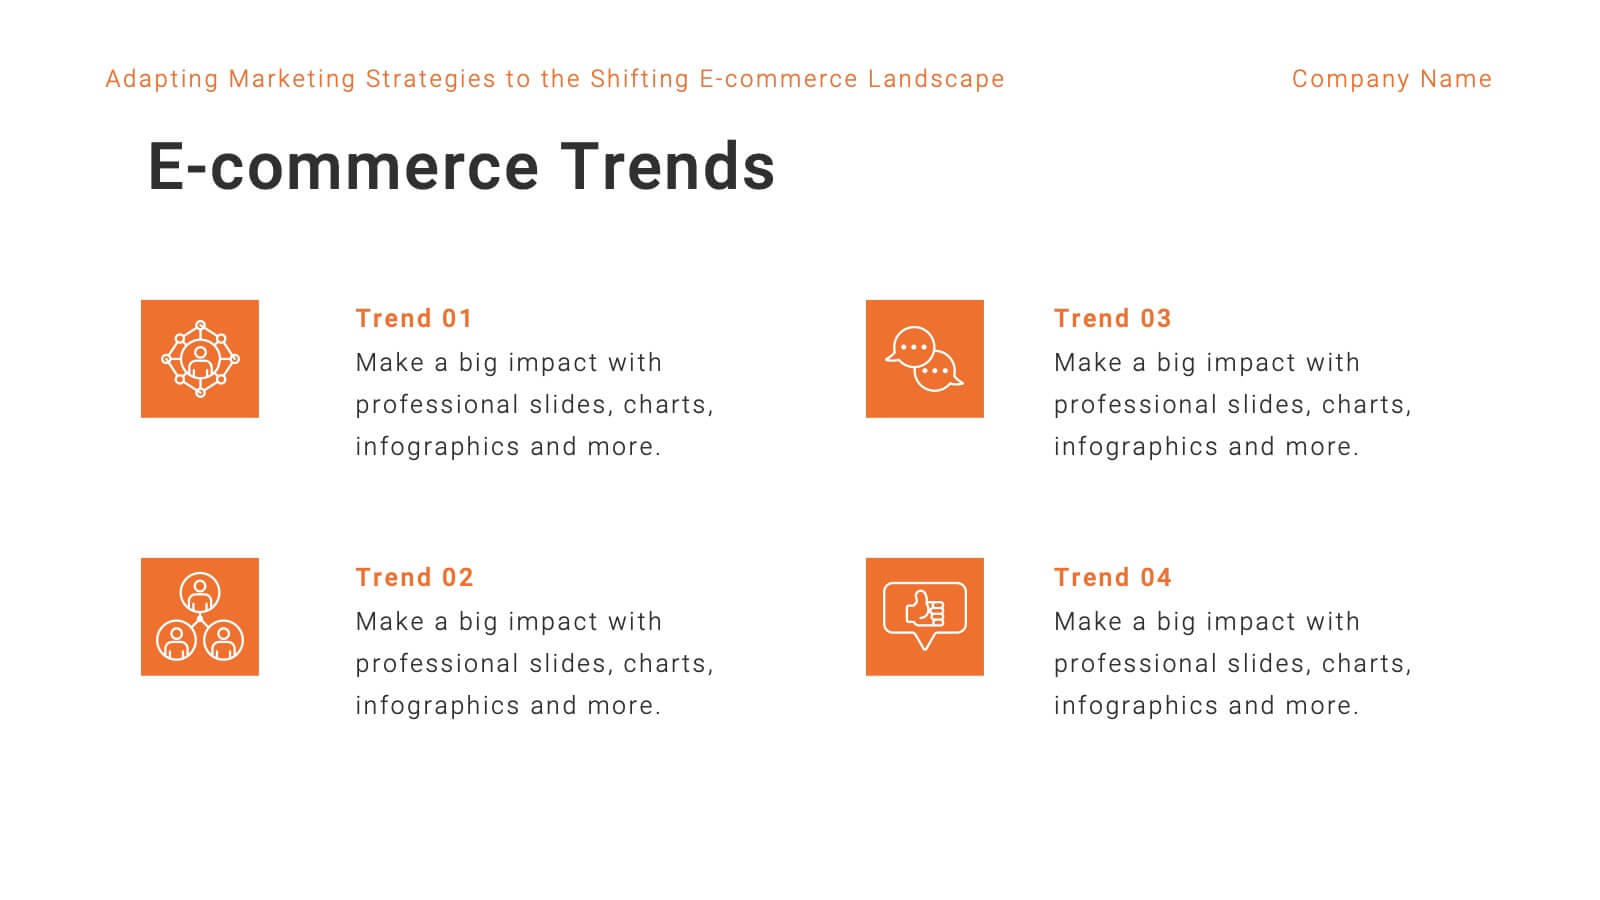
Mercury Marketing Research Report Presentation
Elevate your marketing strategy with this insightful and data-driven presentation template! Perfect for analyzing trends, consumer behavior, and emerging technologies, this template provides a thorough overview of today’s marketing landscape. From social media strategies to e-commerce trends, it covers all key areas. Fully customizable and compatible with PowerPoint, Keynote, and Google Slides for easy use.


5 slides
Scalability and Sustainable Growth Model Presentation
Communicate long-term vision with the Scalability and Sustainable Growth Model Presentation. This layered mountain-style design is ideal for visualizing strategic phases, scaling challenges, or sustainable development milestones. Perfect for roadmap pitches, growth models, or financial projections—fully editable in PowerPoint, Keynote, and Google Slides.


6 slides
Construction Project Timeline and Stages Presentation
Map out your project from groundbreaking to completion with the Construction Project Timeline and Stages Presentation. This visual timeline uses illustrated trucks to represent key construction phases—ideal for progress reports, planning reviews, or contractor briefings. Fully editable in PowerPoint, Keynote, and Google Slides.


5 slides
Business Organizational Structure Presentation
Showcase your Business Organizational Structure with this modern and professional infographic template. Designed to visually represent company hierarchy, this slide enhances clarity in roles, team relationships, and reporting structures. Fully customizable in PowerPoint, Keynote, and Google Slides, making it perfect for corporate strategy presentations, HR reports, and leadership meetings.


2 slides
Startup Company Profile Introduction Presentation
Make a bold first impression with the Startup Company Profile Introduction Presentation. This modern, vibrant layout is perfect for introducing your startup’s mission, values, and services. With eye-catching visuals and clean structure, it’s fully customizable in Canva, PowerPoint, or Google Slides—making it easy to tailor for pitches or internal use.


4 slides
KPI and Business Performance Dashboard
Drive strategic insights with this sleek KPI and business dashboard template. Highlight key metrics, trends, and performance results using easy-to-read graphs and organized data sections. Perfect for management reports, executive summaries, and project tracking. Fully editable in PowerPoint, Keynote, and Google Slides.


3 slides
Remote Work Culture and Guidelines Presentation
Bring remote teamwork to life with visuals that speak your culture. This presentation template simplifies how you communicate expectations, structure, and values for virtual teams. Perfect for onboarding, policy updates, or outlining collaboration tools, it’s designed to keep your message clear and consistent. Fully compatible with PowerPoint, Keynote, and Google Slides.


2 slides
Detailed Buyer Profile Analysis Layout Presentation
Showcase a clear snapshot of your customer insights with this Detailed Buyer Profile Analysis Layout. This modern slide helps you outline bios, goals, and key traits using labeled icons, progress bars, and a visual profile section. Ideal for marketing teams, persona development, and product targeting. Fully editable in PowerPoint, Keynote, and Google Slides.


3 slides
Business Self-Introduction
Make a memorable first impression with this clean, skill-focused introduction slide. Ideal for presenting professional backgrounds, role highlights, and expertise levels. Great for resumes, team intros, or portfolio decks. Fully editable in PowerPoint, Keynote, and Google Slides.


5 slides
Business Process Cycle Presentation
Energize your message with a clean, visual journey that turns complex workflows into an easy-to-follow cycle. This presentation helps you explain stages, roles, and transitions with clarity while keeping your audience focused on what matters. Designed for business process overviews and strategy talks, it works seamlessly in PowerPoint, Keynote, and Google Slides.


5 slides
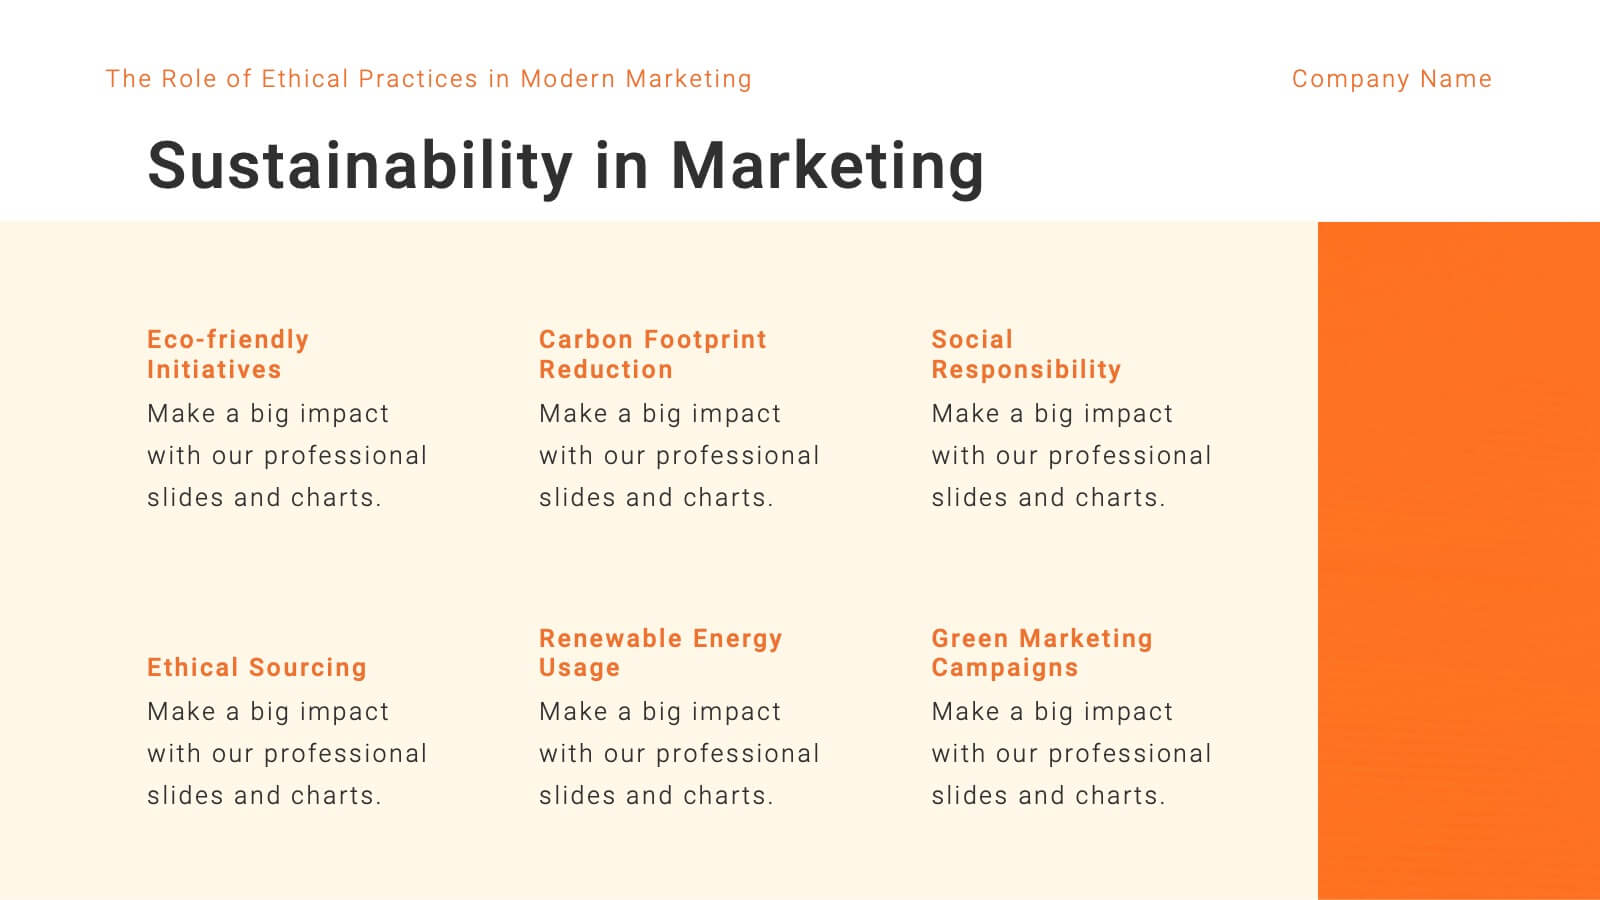
Sustainable Growth and Green Policy Presentation
Showcase your eco-initiatives with the Sustainable Growth and Green Policy Presentation. This unique leaf-shaped diagram highlights four key environmental pillars—ideal for presenting climate strategies, energy policies, or green development goals. With a sleek and modern design, it’s perfect for NGOs, government briefings, or corporate sustainability reports. Editable in Canva, PowerPoint, Keynote, and Google Slides.


21 slides
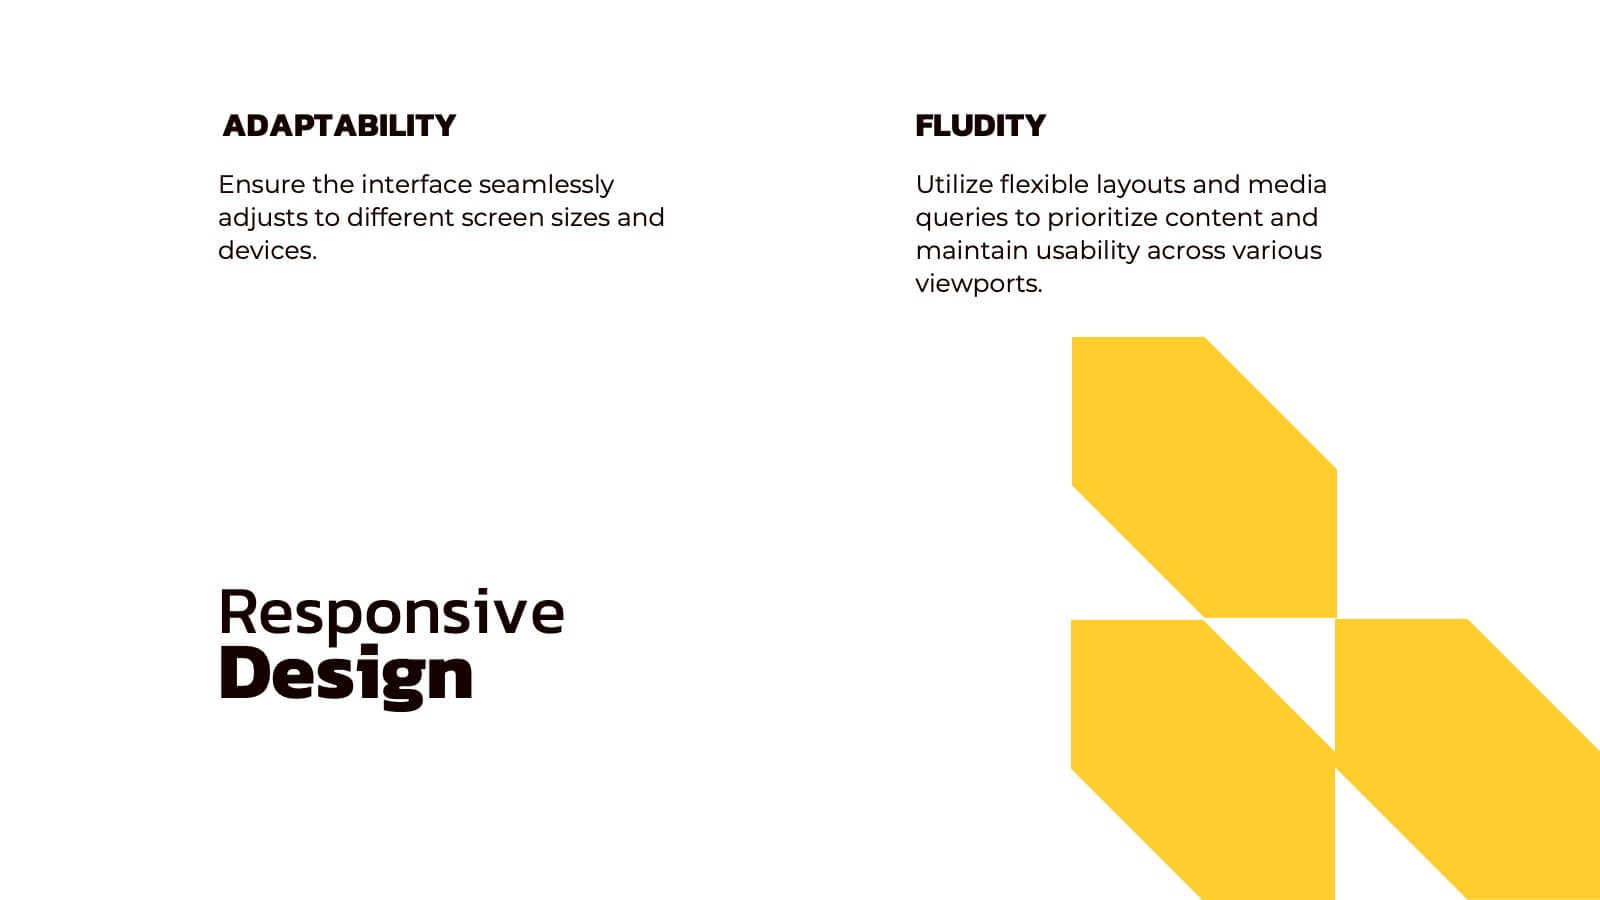
Crystalhearth UX Design Presentation
This professional template simplifies UX/UI design presentations, covering user research, personas, journey mapping, wireframes, and usability guidelines. Showcase visual elements, branding, accessibility, and responsive design. Ideal for illustrating the iterative process, testing insights, and project showcases. Fully customizable and compatible with PowerPoint, Keynote, and Google Slides.