


Features
- 7 Unique slides
- Fully editable and easy to edit in Microsoft Powerpoint, Keynote and Google Slides
- 16:9 widescreen layout
- Clean and professional designs
- Export to JPG, PDF or send by email


Do you have any questions?
Recommend


4 slides
Decision Analysis Framework Presentation
Make every choice smarter with this structured and visually balanced template designed to showcase options, outcomes, and key insights. Ideal for strategy meetings or data-driven reports, it helps you present decisions with confidence and clarity. Fully editable and compatible with PowerPoint, Keynote, and Google Slides for seamless customization.


4 slides
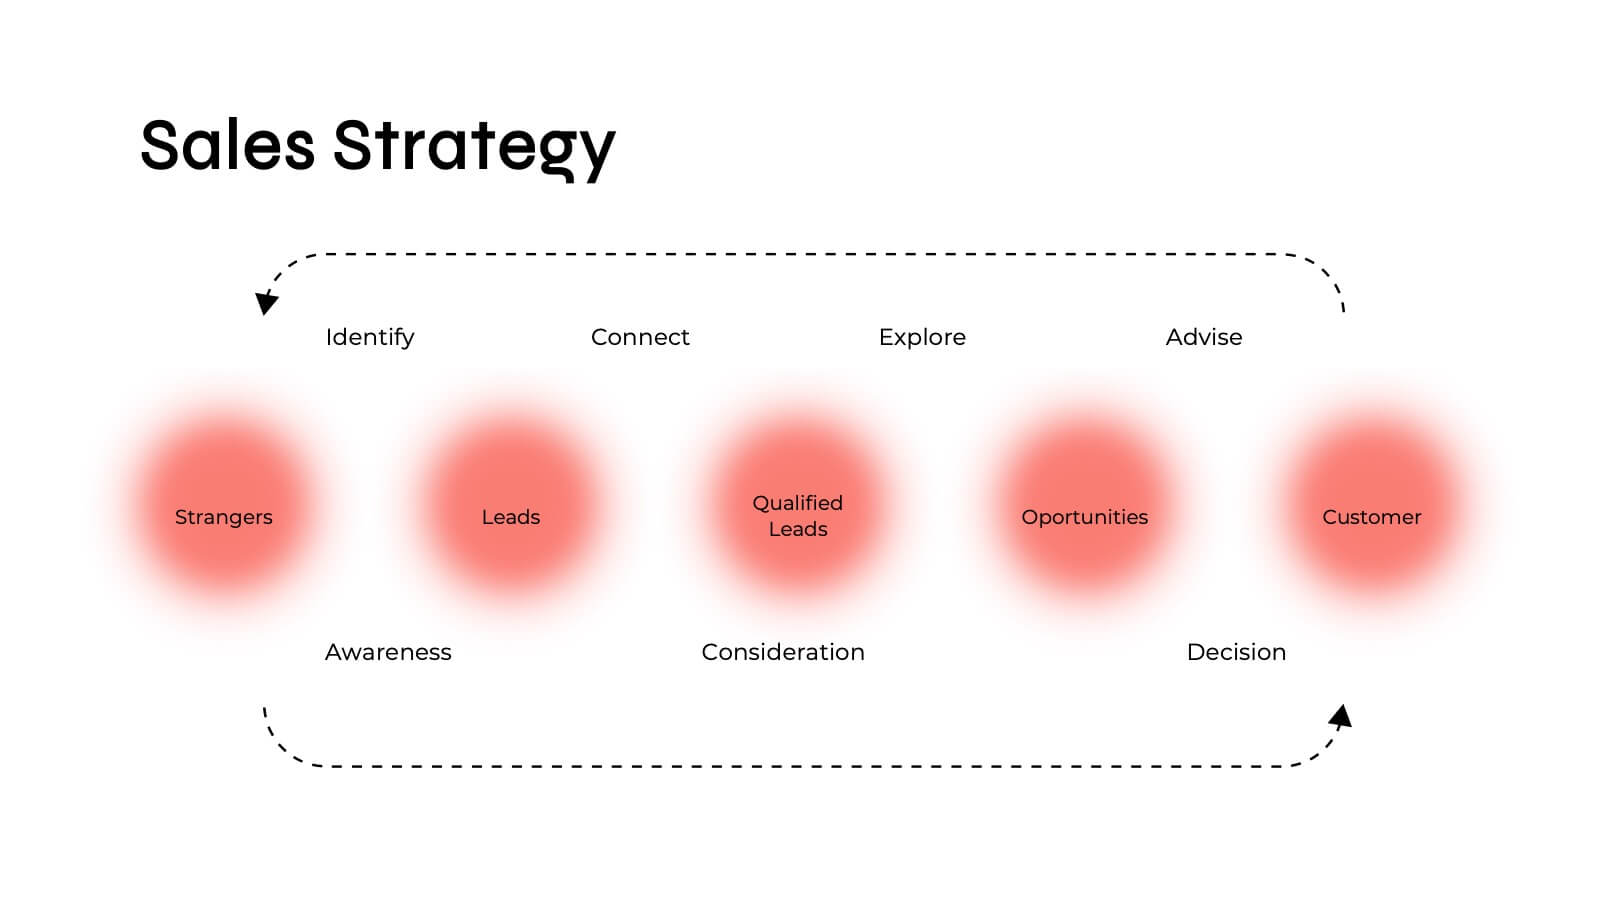
Networking Strategy Plan Presentation
Make every connection count with this clean and modern presentation design. Perfect for outlining relationship-building strategies, collaboration methods, or communication plans, it presents ideas clearly using a structured circular layout. Fully customizable and compatible with PowerPoint, Keynote, and Google Slides for a seamless and professional presentation experience.


23 slides
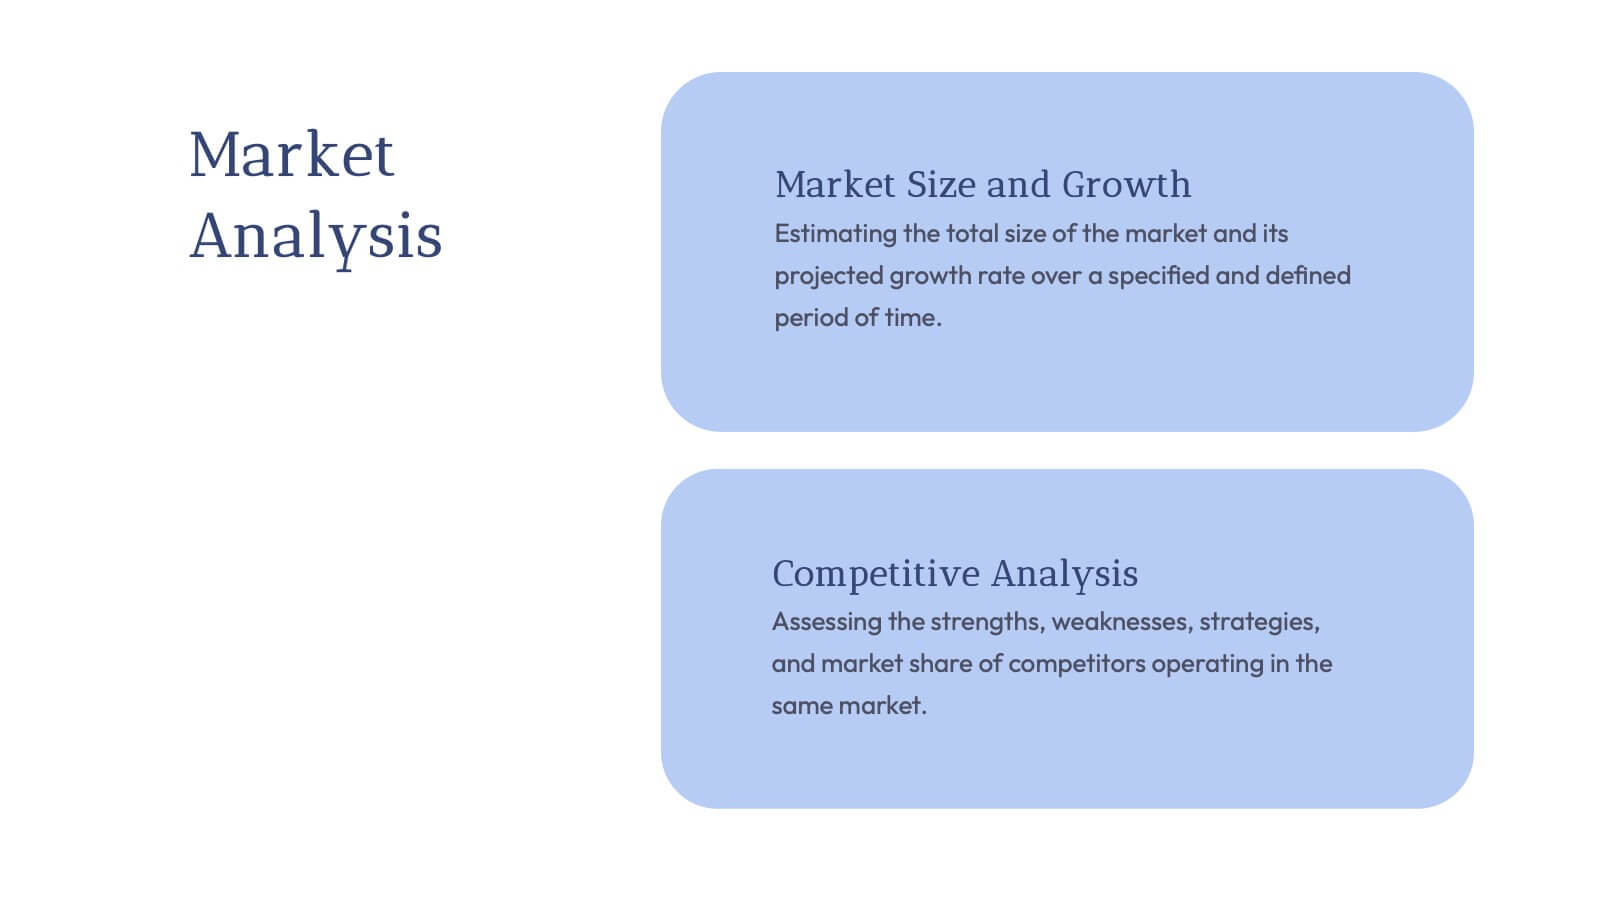
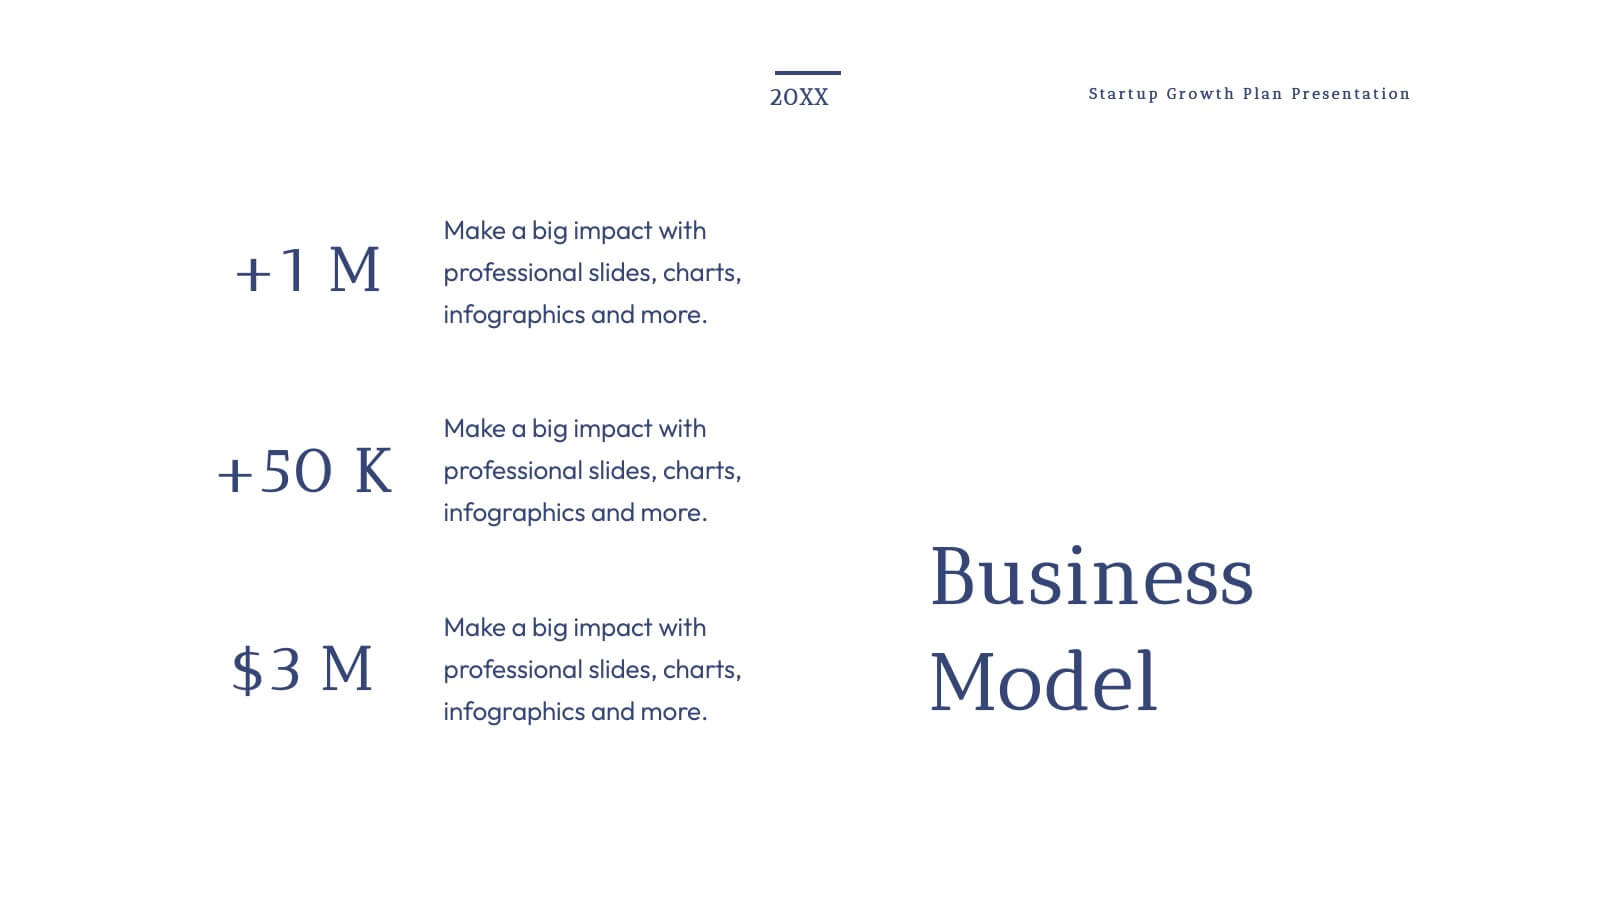
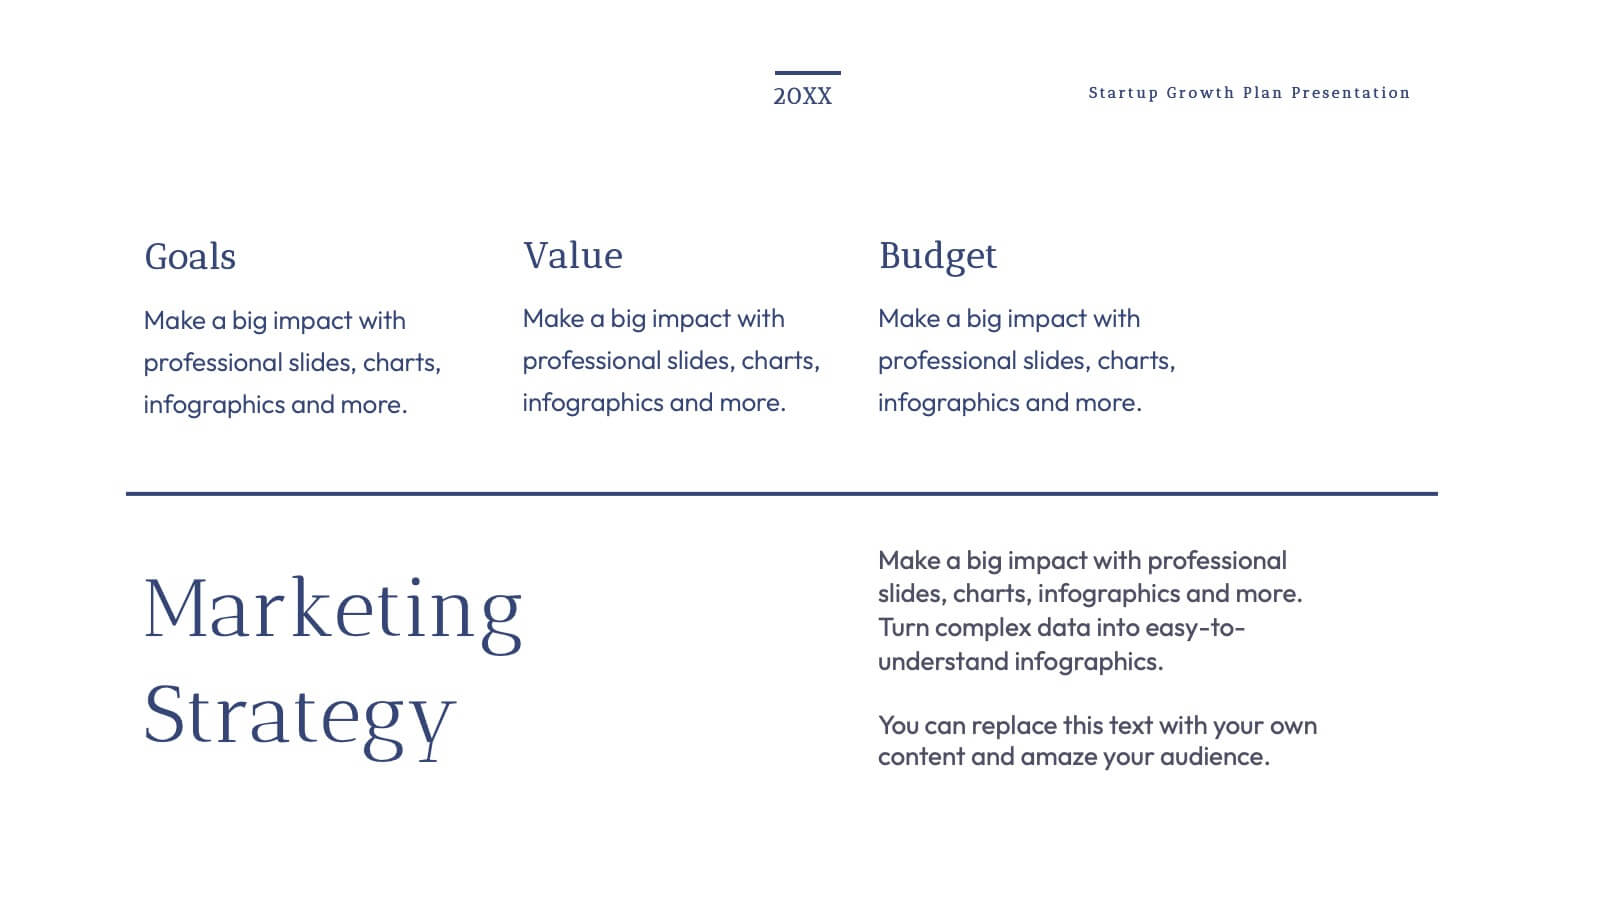
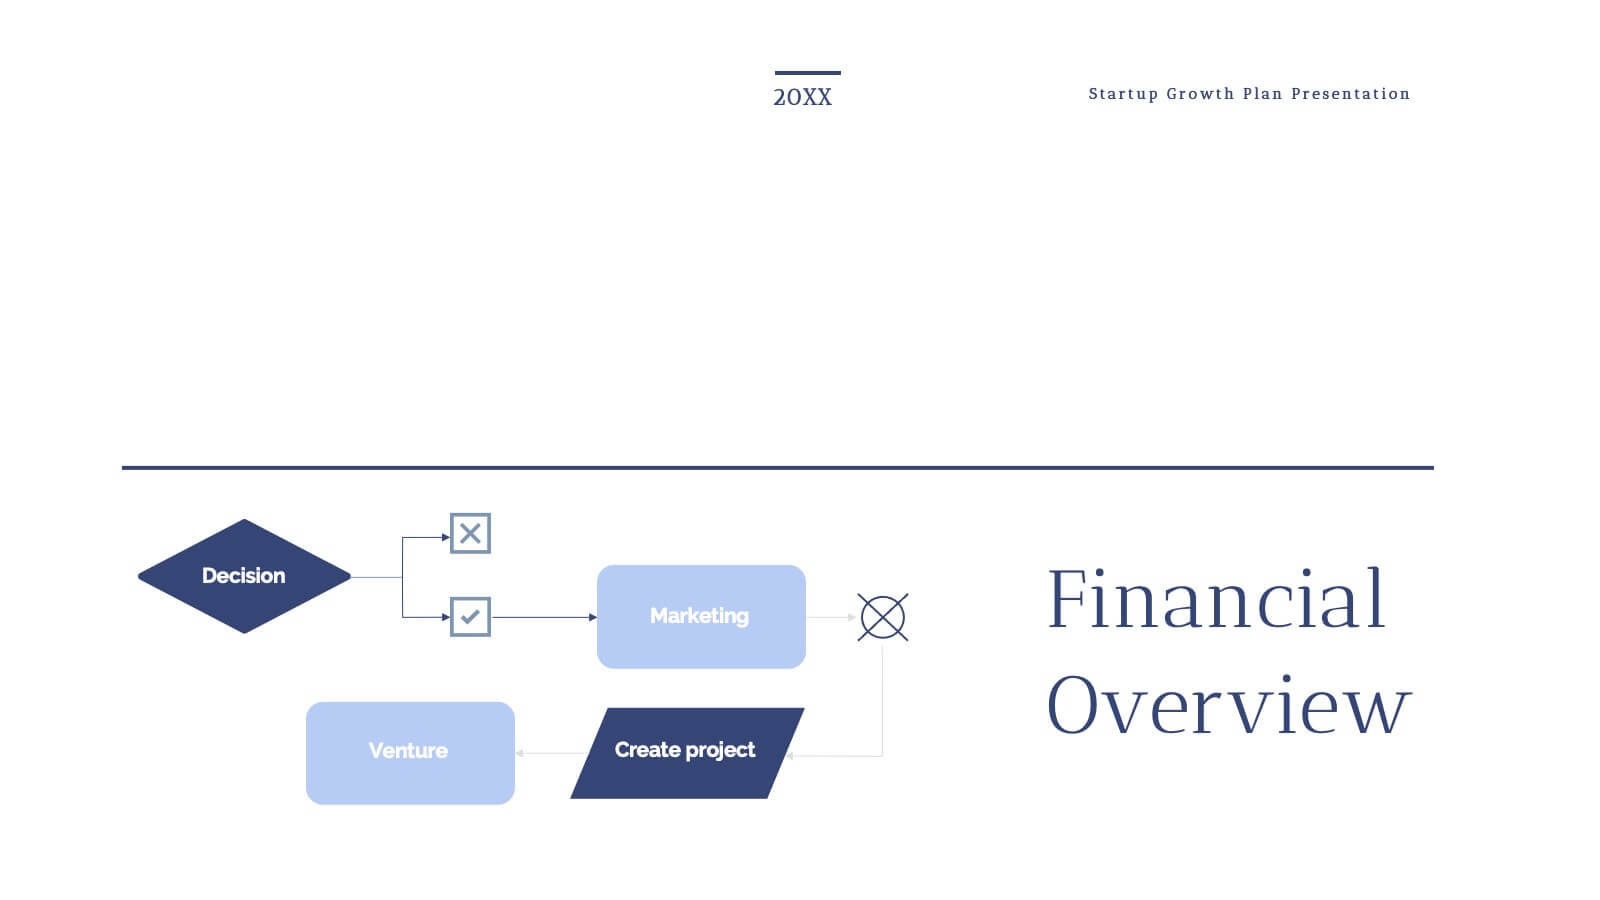
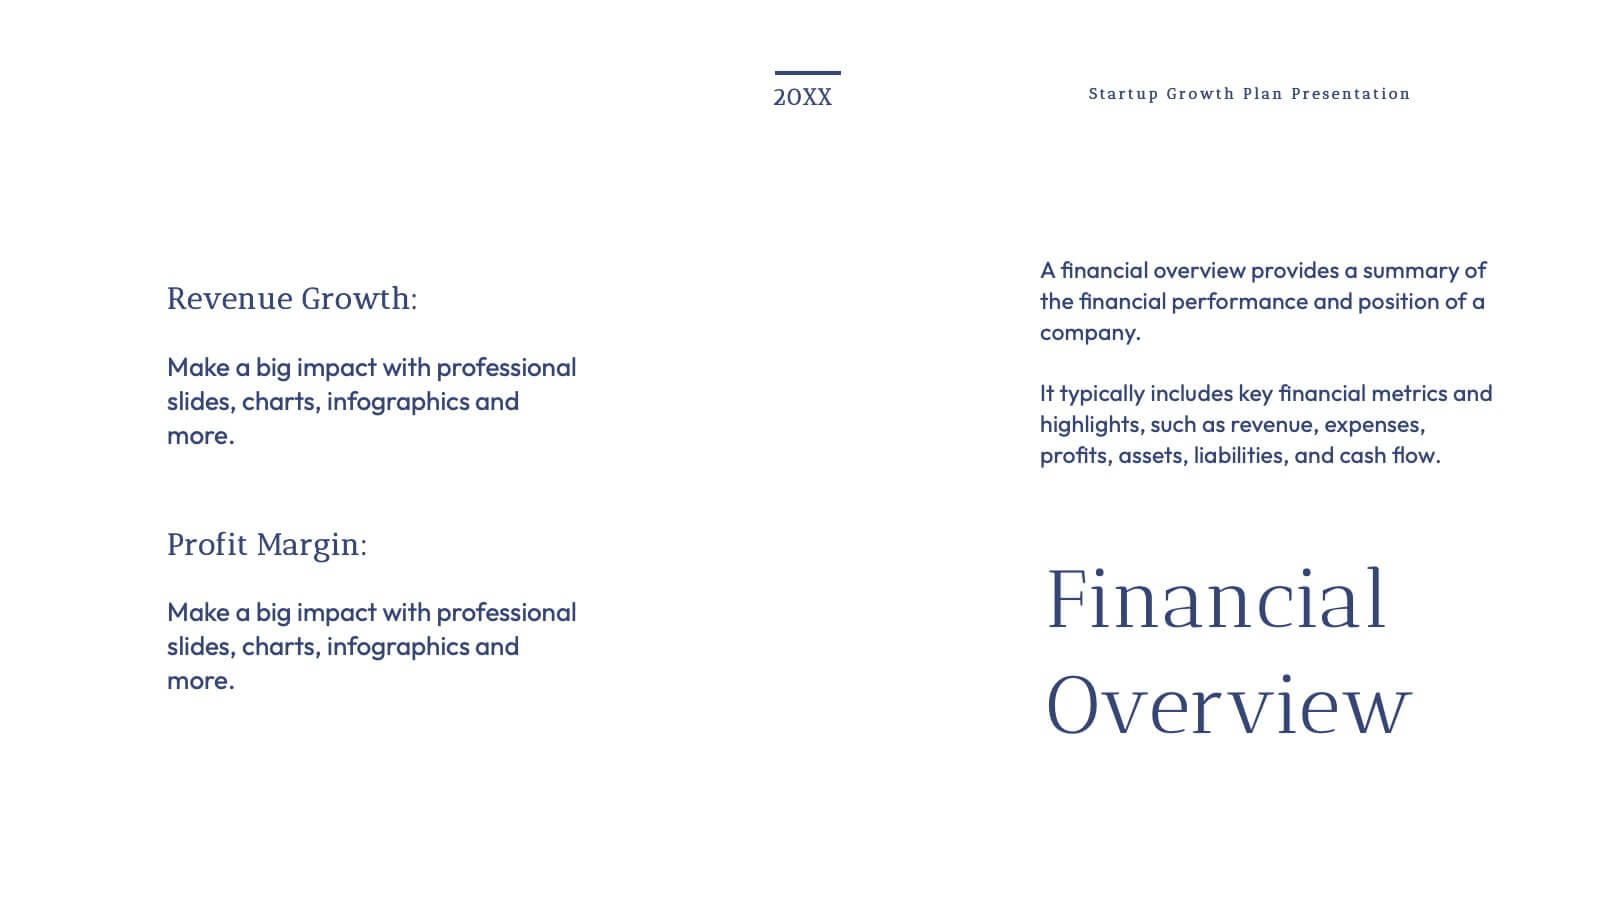
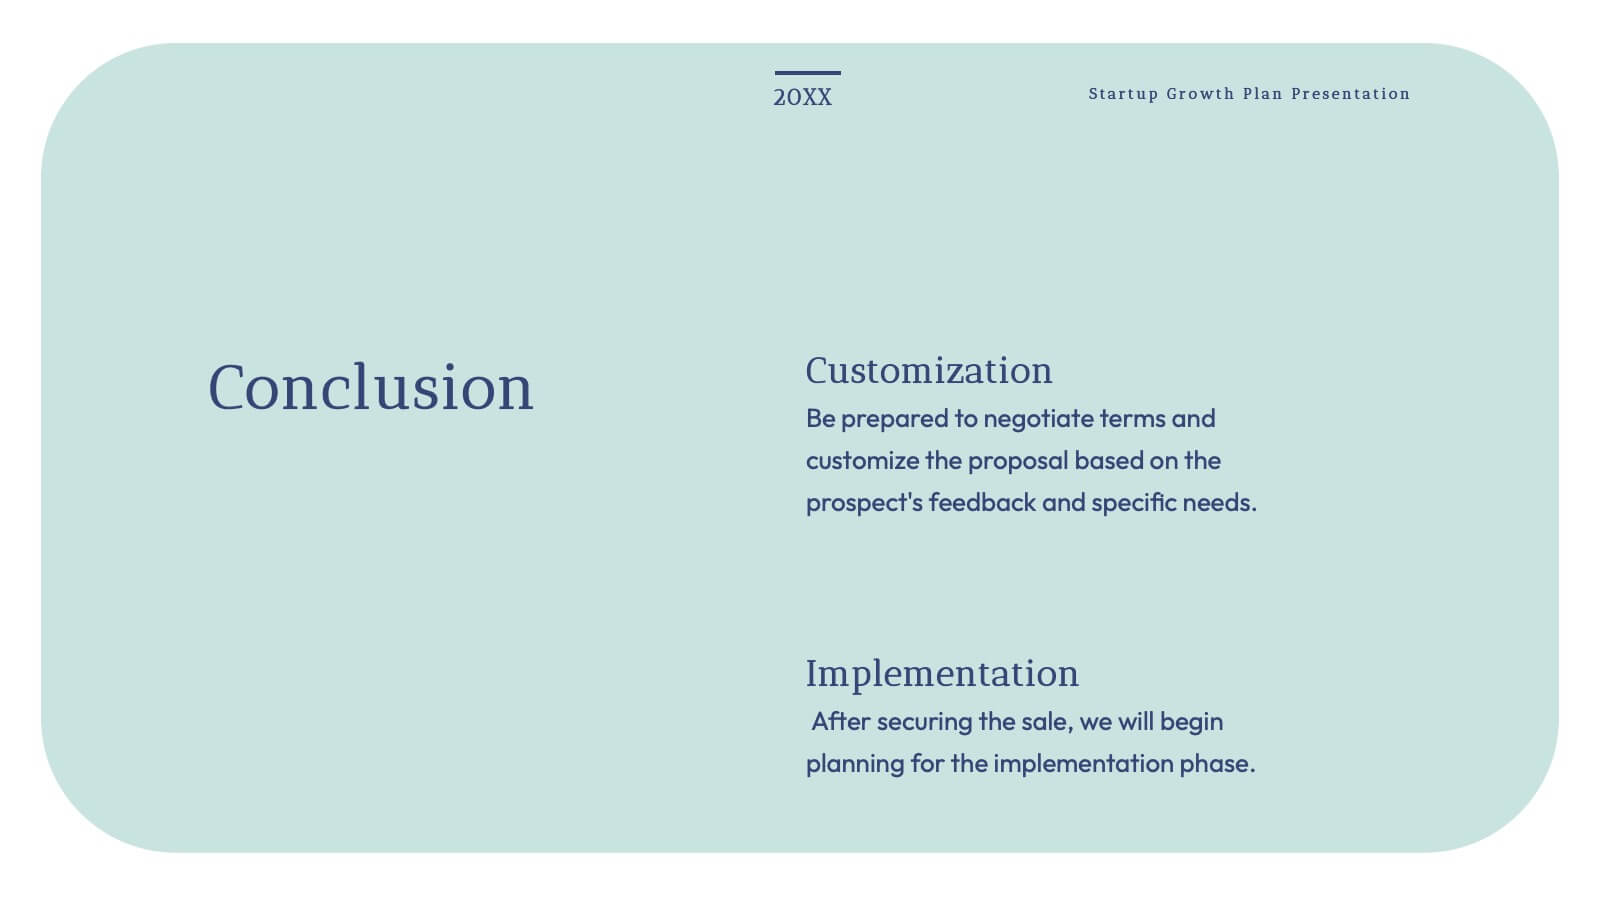
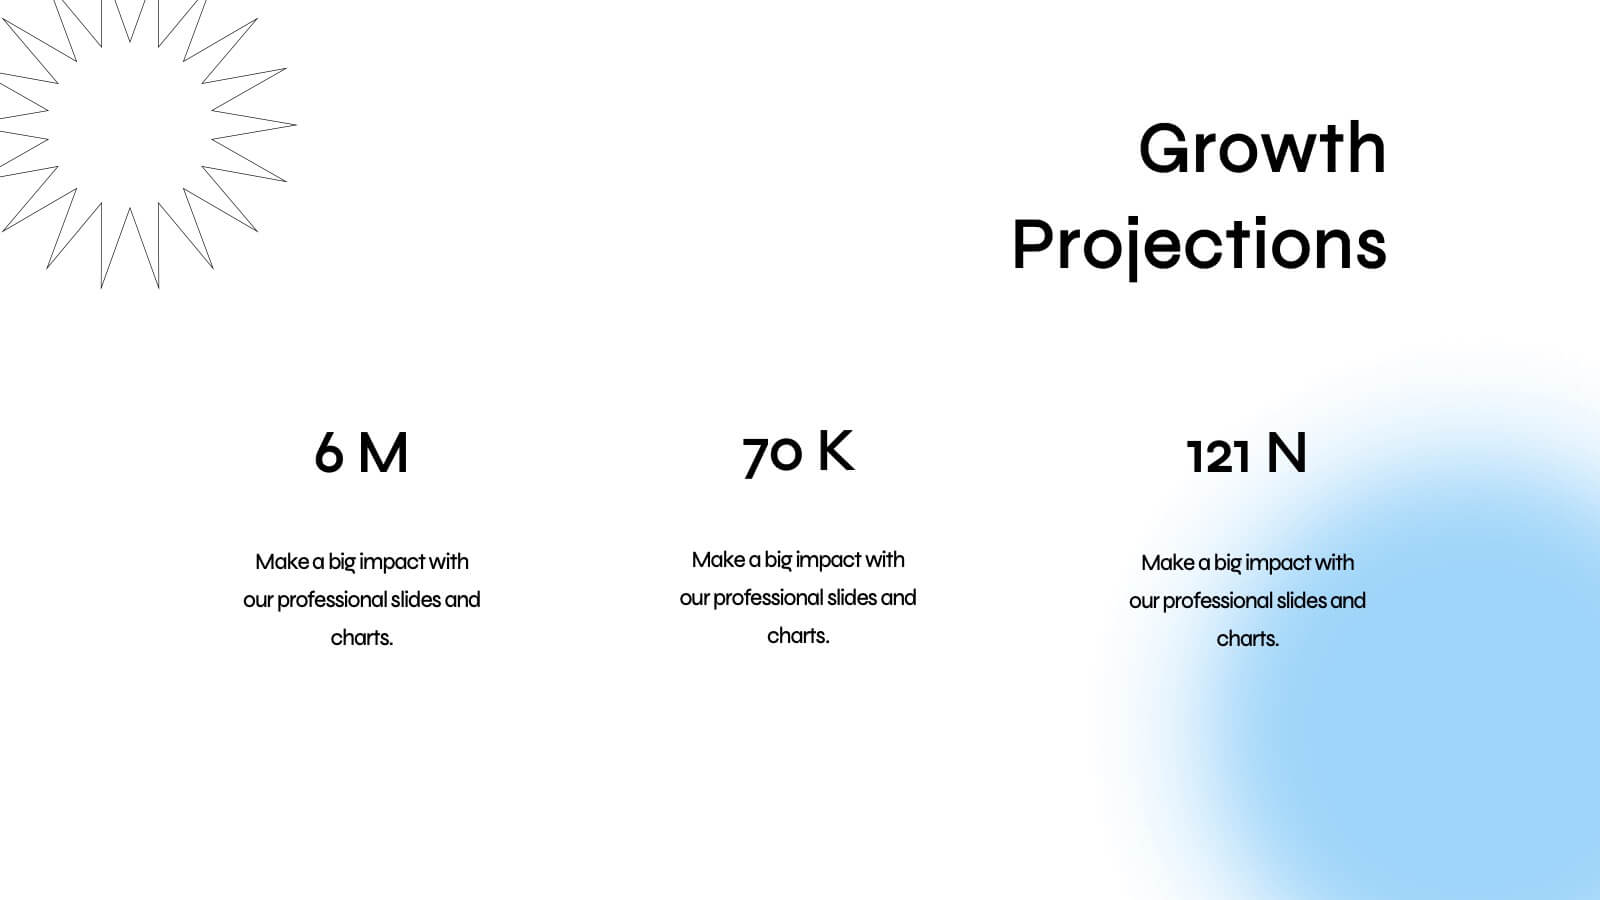
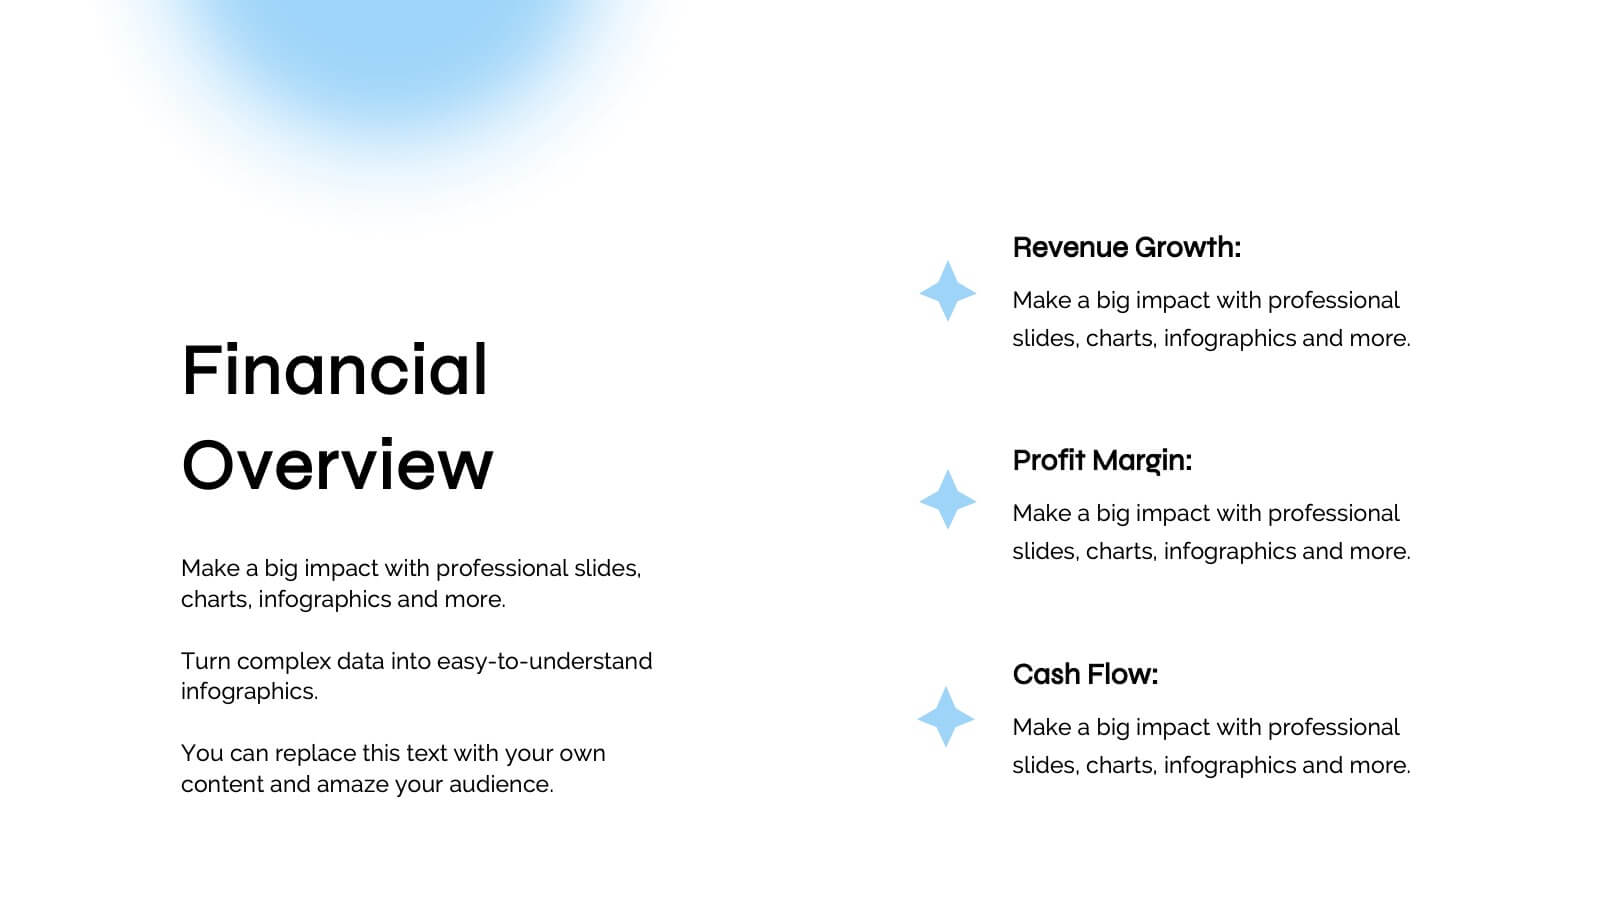
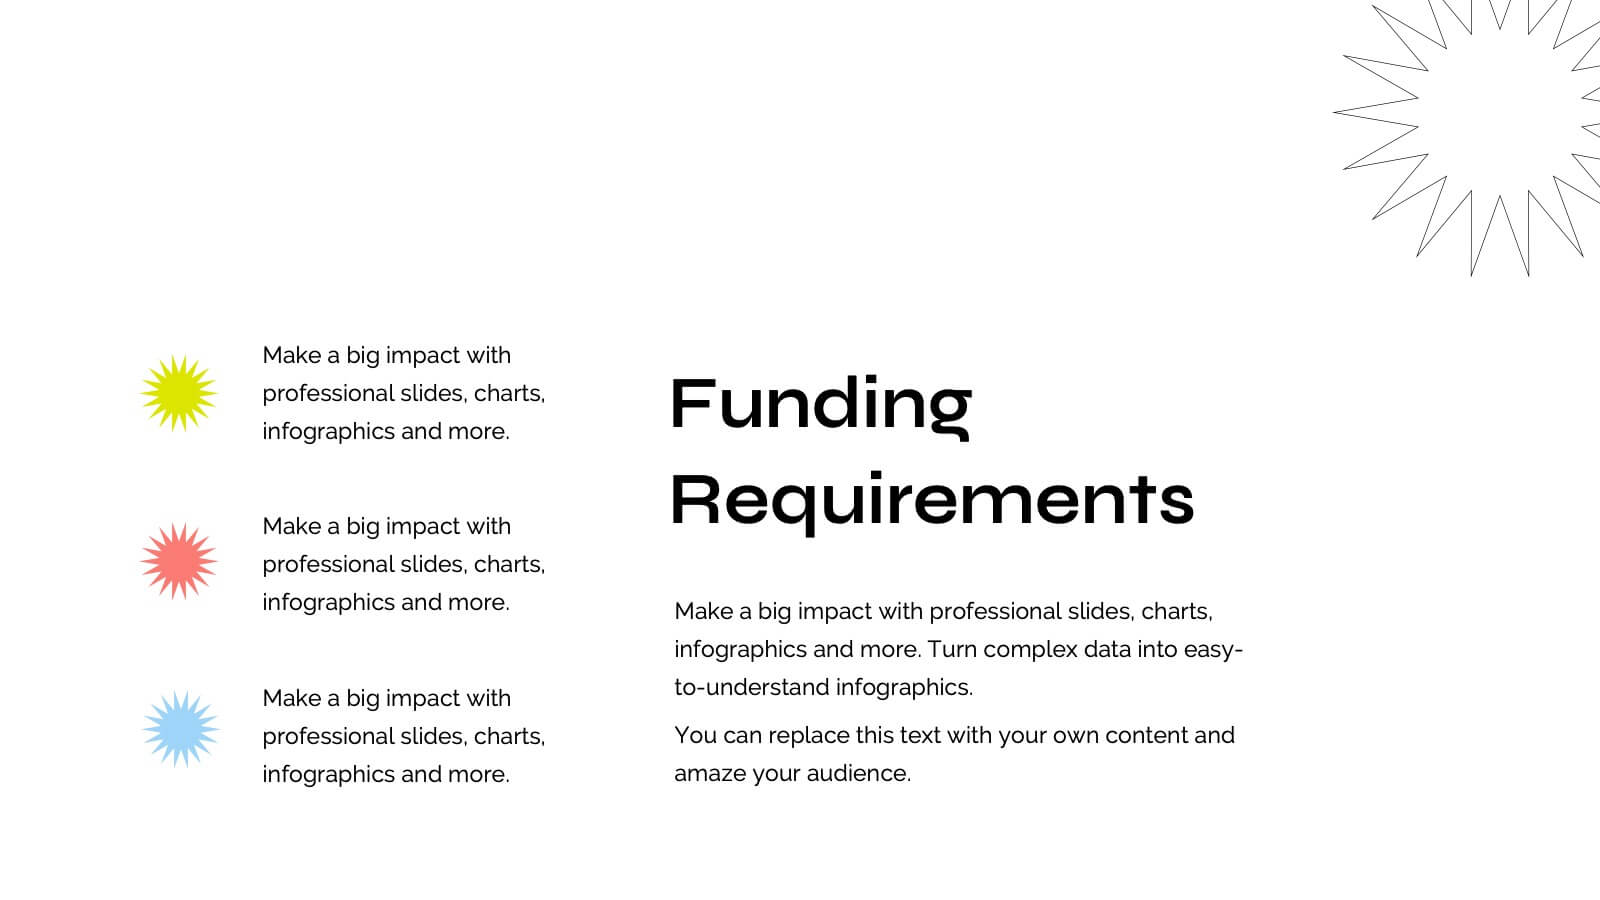
Grecian Startup Growth Plan Presentation
Elevate your pitch with this stunning Grecian-inspired presentation template, perfect for outlining your startup's growth plan! Showcase your business strategy, revenue projections, and scaling opportunities with a clean, elegant design that grabs attention. Impress investors and stakeholders with every slide. Compatible with PowerPoint, Keynote, and Google Slides for seamless customization.


5 slides
Banking Benefits Infographics
Banking offers several benefits that contribute to the efficient functioning of the economy and the financial well-being of individuals and businesses. These vertical infographics highlight the advantages and benefits of banking services. They are designed to help you communicate the value of banking to your audience in a clear and engaging manner. With these templates you can effectively communicate the value of banking services to your audience. The infographics are compatible with Powerpoint, Keynote, and Google slides, making them easily customizable to match your brand and data.


5 slides
Property Investment Analysis
Visualize property performance, investment comparisons, or growth strategies using this colorful building-height layout. Ideal for real estate agents, financial consultants, and property developers seeking to present tiered data clearly. Fully customizable in PowerPoint, Keynote, and Google Slides.


7 slides
Social Media Infographic Presentation Template
Social media is an important business tool due to the fact that it allows you to reach, nurture, and engage with customers no matter where they are located. Additionally, it allows you to target new audiences, create brand awareness, and grow your following. This template features a clean, fun design that is easy to read. With a variety of slides and infographics, it makes it simple to create. This template will inform you how social media can be a powerful tool. This template is a great way to keep your information organized and includes tips that can be added at the bottom of each section.


7 slides
Customer Service Profile Infographic Presentation
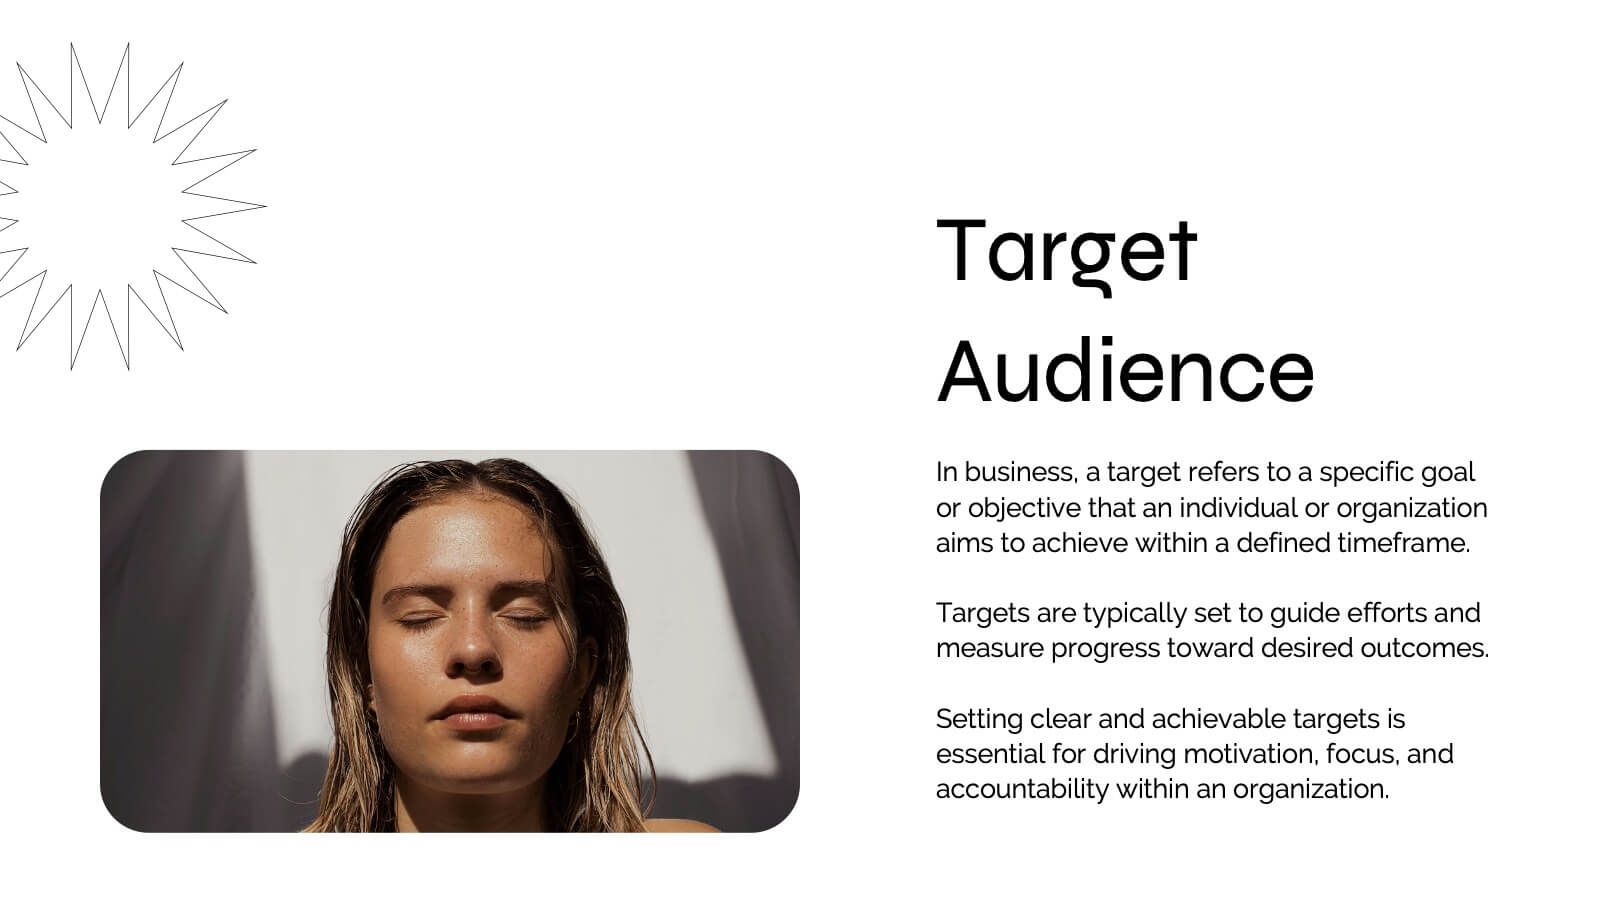
A Customer Profile infographic is a visual representation of a target customer or customer segment that provides important information about their demographics, behavior, preferences, and needs. This template can help businesses and organizations understand their customers better, tailor their products or services to meet their needs, and develop effective marketing strategies. This template can be used for various purposes, such as to guide product development, to inform marketing campaigns, or to improve customer service. This template is compatible with Powerpoint, keynote and google slides.


10 slides
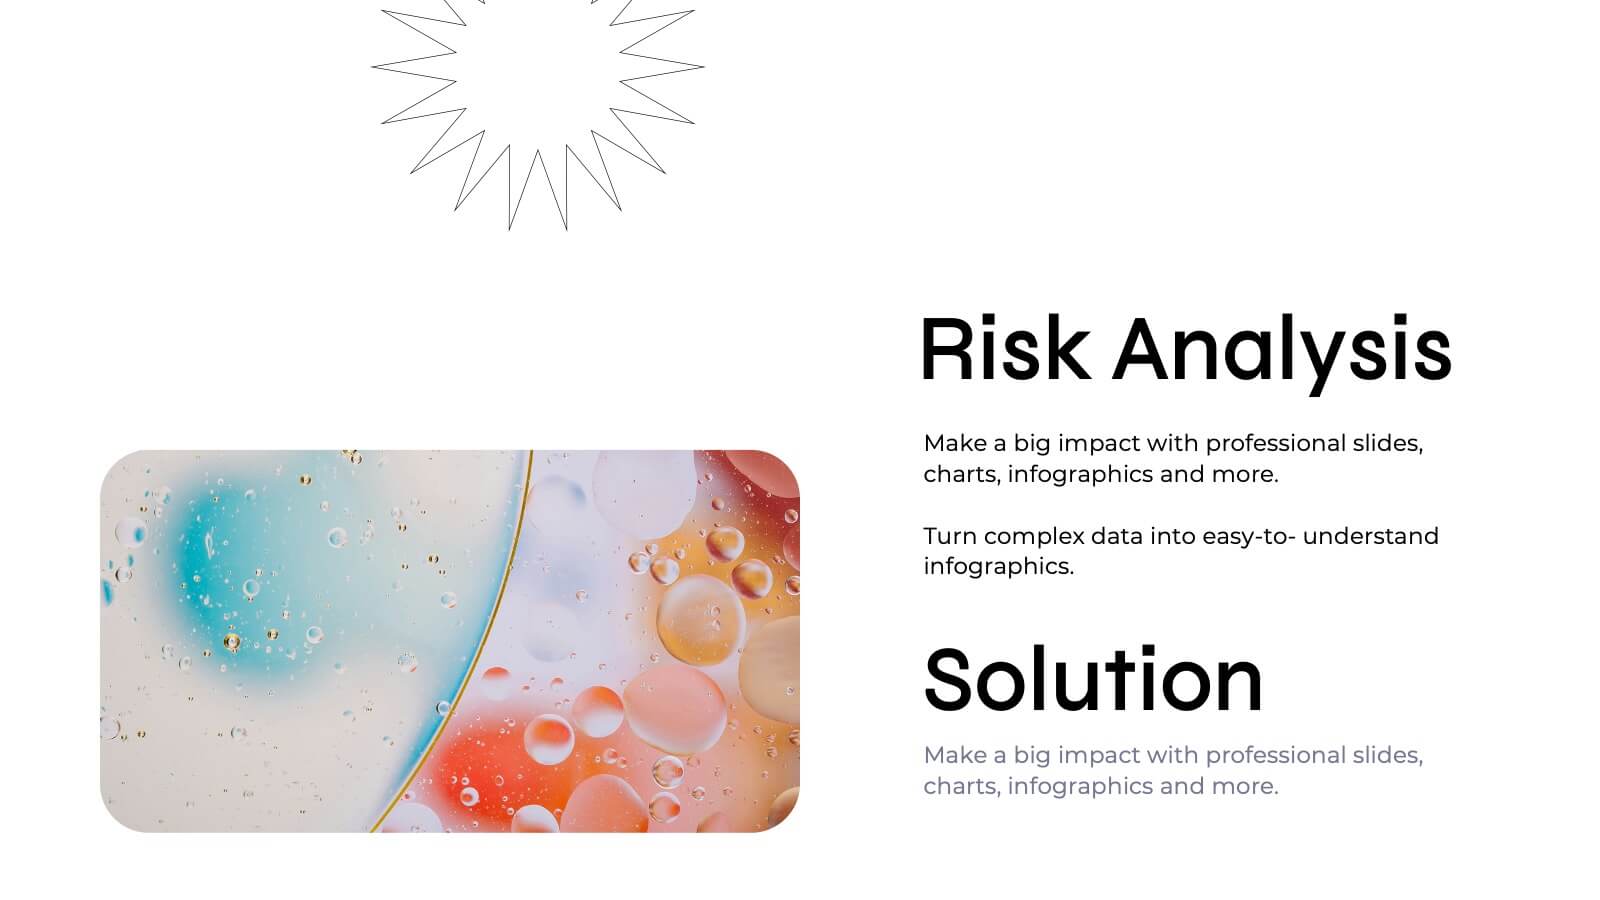
Business Risk Management Framework Presentation
Elevate your risk analysis with the "Business Risk Management Framework" template, offering a dynamic and customizable approach to effectively present and evaluate risk data. It features various risk gauges and icons for visual representation, ensuring key insights are easily understandable. This template facilitates comprehensive risk analysis presentations and is compatible with PowerPoint, Keynote, and Google Slides.


7 slides
Brain Infographic Presentation Template
Brain infographics can be used to communicate your business ideas in a unique way. The images provide a visual explanation of the project breakdown and how every step is important for a successful project execution. This brain infographic template is the perfect visual to show off your critical thinking skills, with a clear focus on planning and execution. Use this infographics template to illustrate the planning of your project, its control and monitoring, as well as its targets and execution. This template is a fun way to shed light on how our brains react to visuals in content.


4 slides
Annual Report Summary Slide
Present key performance metrics with confidence using this Annual Report Summary Slide. Designed with bold percentage visuals and clear titles, it helps break down quarterly or category results in a clean, professional format. Ideal for financial overviews, sales performance, or strategic summaries. Fully editable in PowerPoint, Keynote, and Google Slides.


5 slides
Financial Budget Infographics
Financial goals refer to specific objectives and targets that individuals or businesses set to manage their finances effectively and achieve financial success. These vertical infographics are designed to help individuals and businesses effectively present their financial budgets and plans. Whether you're a financial analyst or a business owner, this template is perfect for conveying complex financial information in a clear and concise manner. These infographics provide an overview of the budget, showcasing key financial goals, total income, and total expenses. This features visuals to help users set and track financial goals.


6 slides
Iceberg Business Infographic
Delve beneath the surface with our Iceberg Business Infographic, perfect for Powerpoint, Google Slides, and Keynote. This infographic is designed to illustrate the underlying factors that impact an organization's success. The iceberg metaphor visually represents the concept that only a small part of a company's situation is visible above the surface, while much more is hidden below. The customizable segments can be used to detail various aspects of business operations, risks, and opportunities that are not immediately apparent. By employing this Iceberg Business infographic, you can effectively communicate the complexities of business strategies.


5 slides
Training Needs Through Skills Gap Analysis Presentation
Clearly identify training gaps and skill development priorities with the Training Needs Through Skills Gap Analysis Presentation. This structured layout helps HR teams and managers map out competency levels, prioritize development, and align learning paths with business goals. Fully editable in PowerPoint, Keynote, Canva, and Google Slides.


22 slides
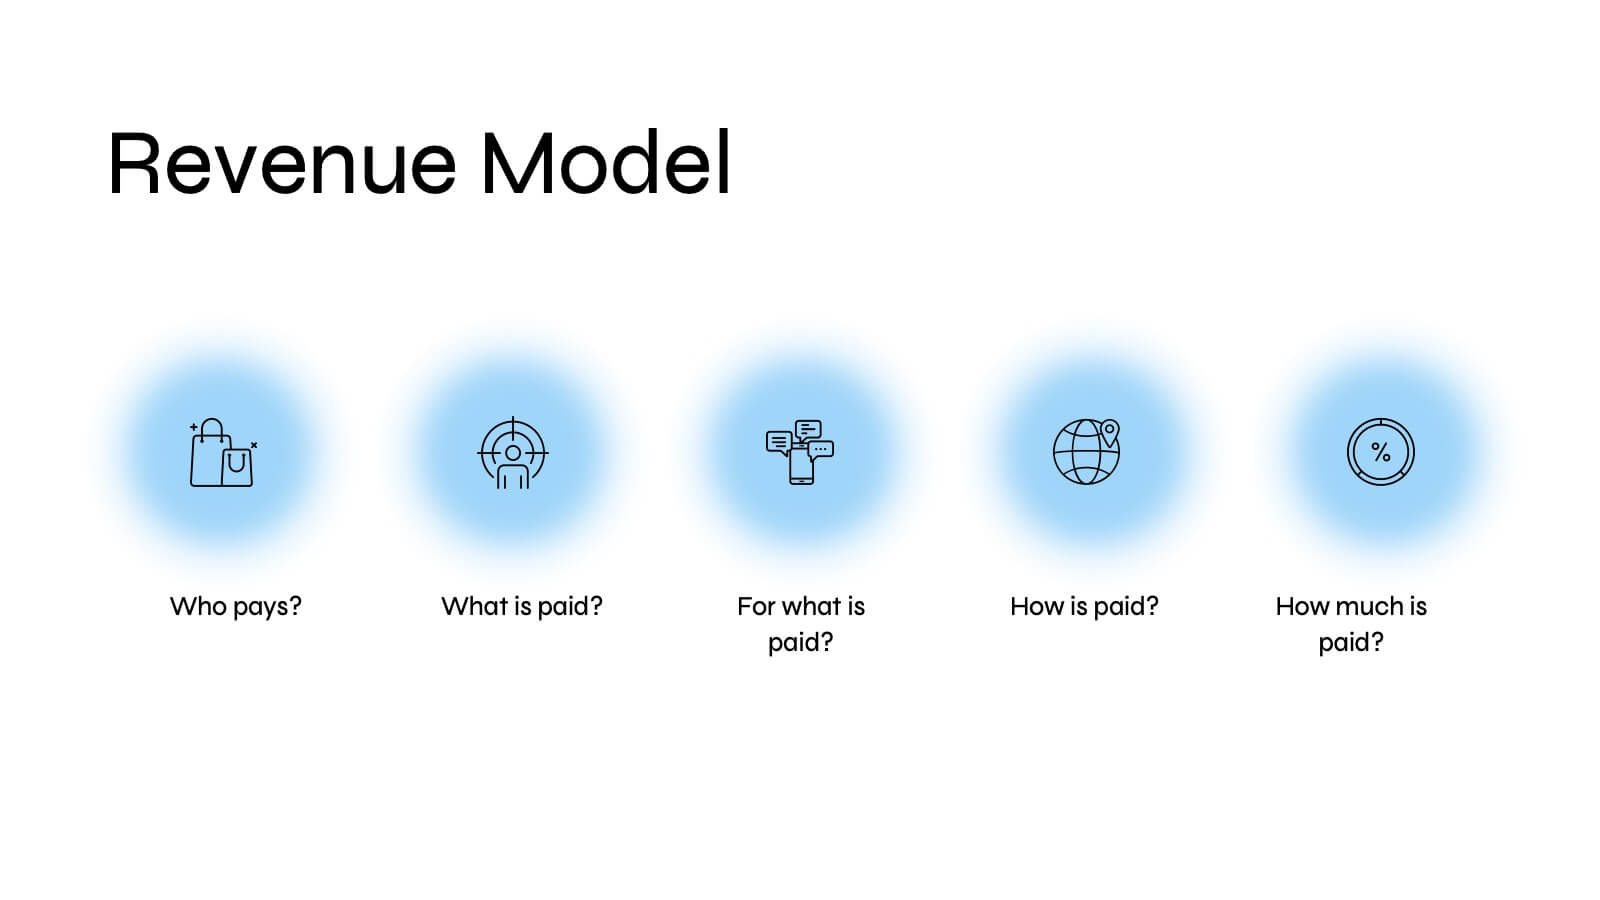
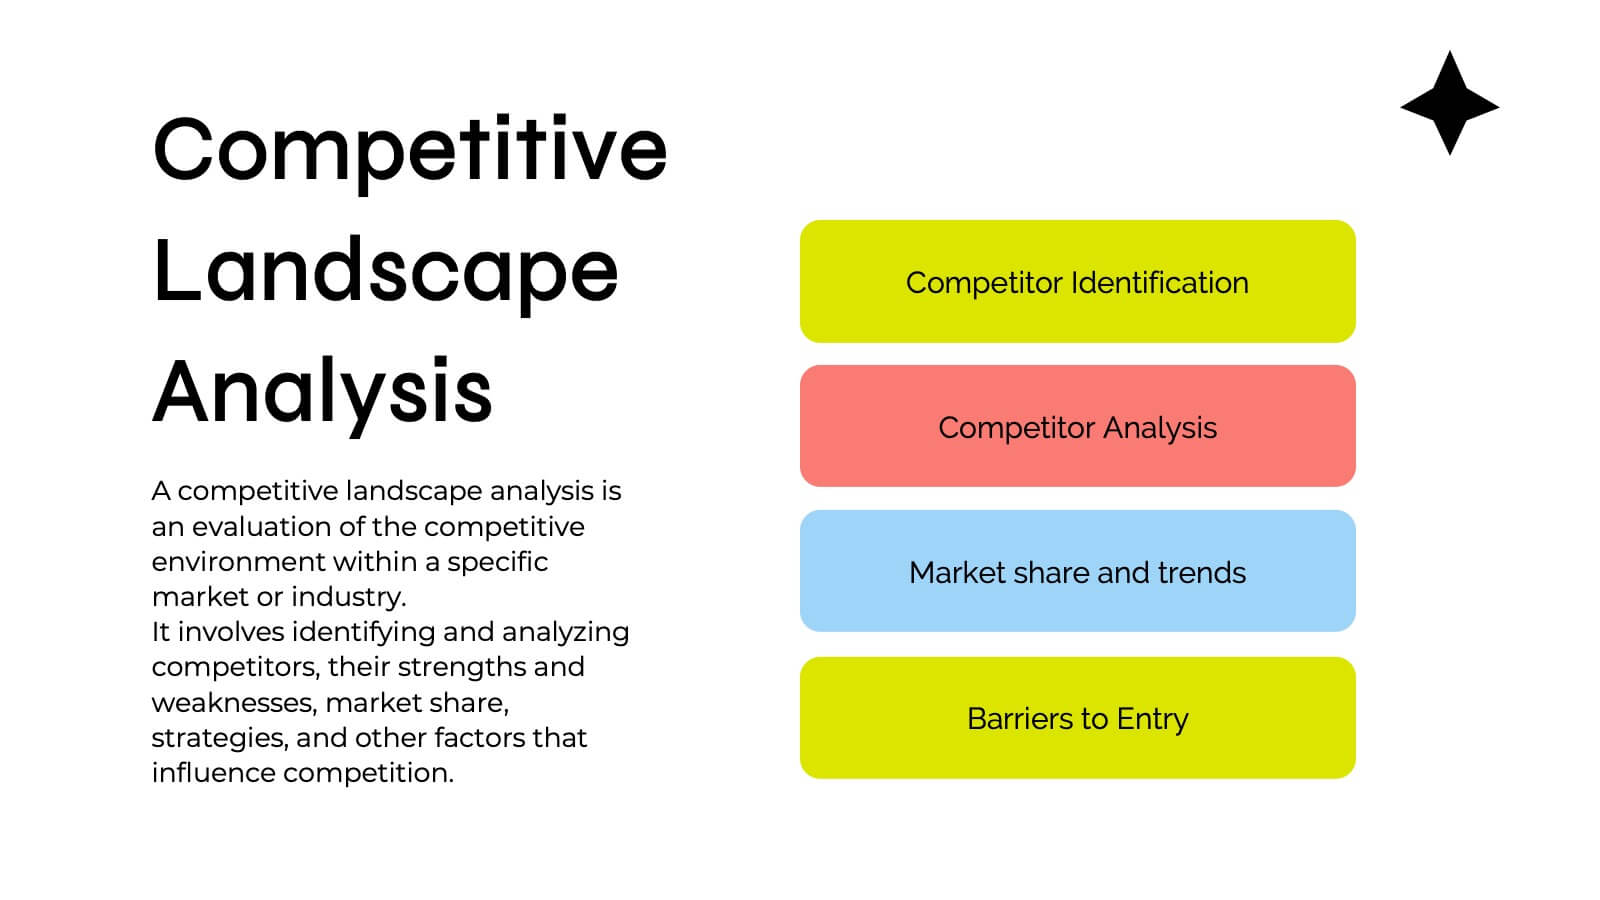
Quirinus Investor Pitch Presentation
Ready to impress investors and stakeholders? This sleek and modern pitch deck template covers all the essentials, from problem statements and market opportunities to revenue models and growth projections. Each slide is designed to convey clear and compelling information for maximum impact. Fully compatible with PowerPoint, Keynote, and Google Slides, making it the perfect tool for your next product launch!


10 slides
Workforce Learning & Training Module Presentation
Visualize your team’s learning journey with the Workforce Learning & Training Module Presentation. This hexagonal layout clearly maps training pillars or module stages, helping you present development plans in a structured, engaging way. Ideal for HR professionals, corporate trainers, and consultants. Fully editable in PowerPoint, Keynote, Google Slides, and Canva.


6 slides
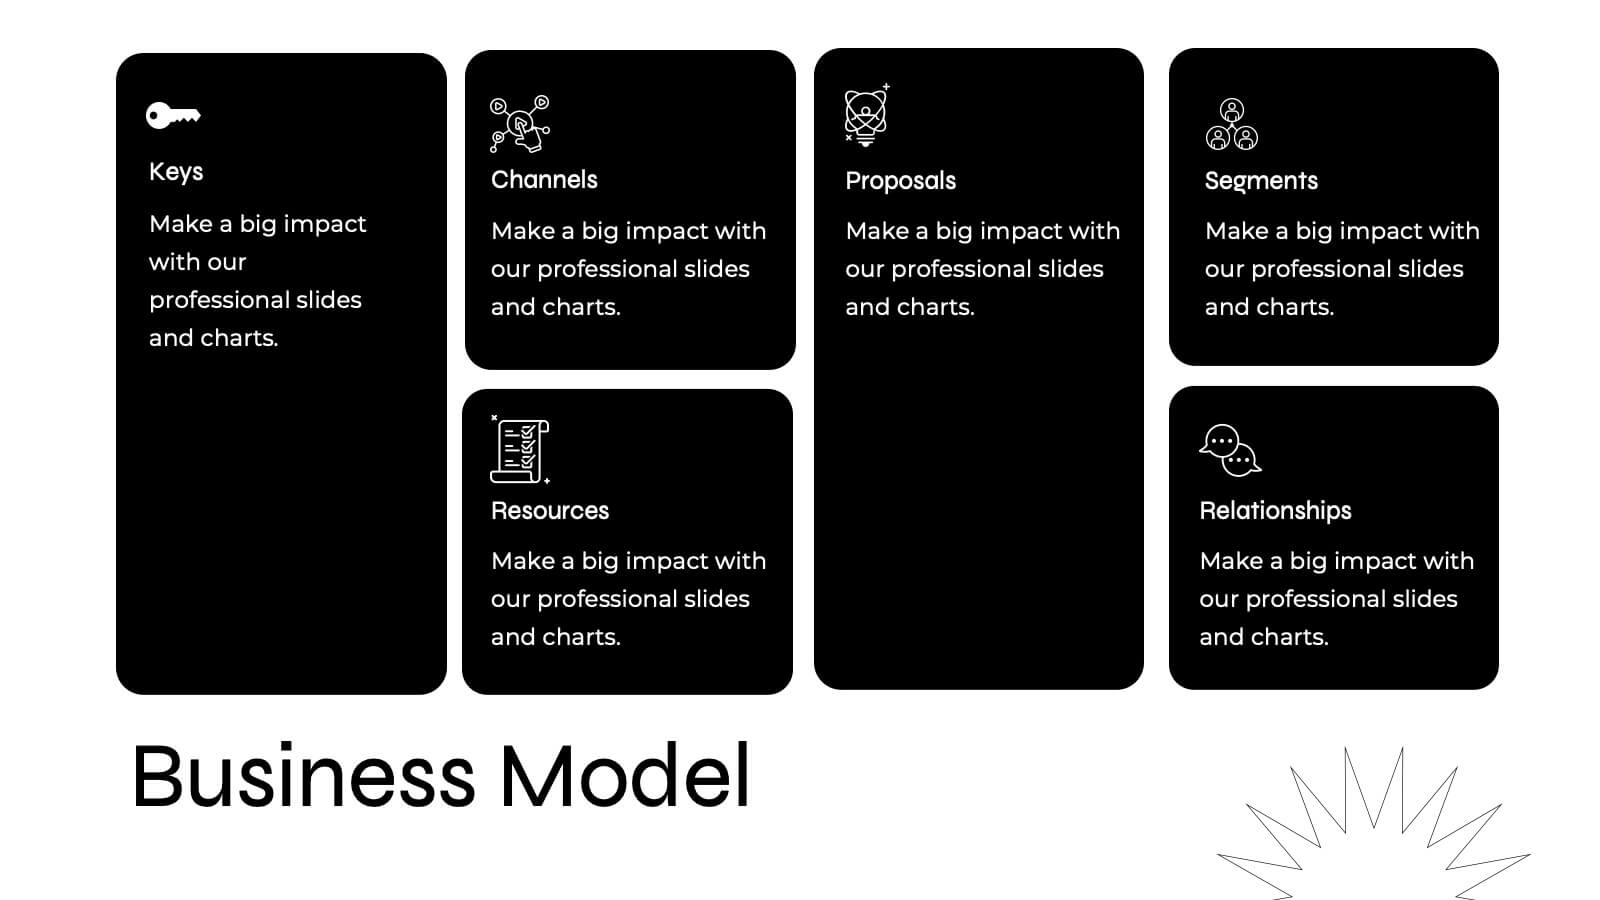
Business Structure Outline Presentation
Visualize your company’s framework with this modern business structure slide. Perfect for showcasing team roles, departments, or organizational functions, it helps simplify complex relationships into a clear overview. Easily editable in Canva, PowerPoint, and Google Slides—ideal for presentations, planning sessions, or onboarding new employees with a professional, easy-to-follow design.


3 slides
Risk Assessment Spider Chart
Evaluate risks across key criteria with the Risk Assessment Spider Chart Presentation. This template showcases a multi-dimensional radar chart, ideal for comparing variables like probability, impact, and preparedness. Use this to present security assessments, project vulnerabilities, or business exposure insights. Fully editable in PowerPoint, Keynote, and Google Slides.