


Features
- 2 Unique Slides
- Fully editable and easy to edit in Microsoft Powerpoint, Keynote and Google Slides
- 16:9 widescreen layout
- Clean and professional designs
- Export to JPG, PDF or send by email


Do you have any questions?
Recommend


7 slides
Science Infographic Presentation Template
A science infographic is a visual representation of scientific information or knowledge that aims to simplify and communicate complex scientific concepts in a clear and concise way. This template uses charts, images, and other elements to convey information, making it easier for your audience to understand and retain scientific information. Use this Science infographic to cover a wide range of scientific topics, from biology and physics to climate change and space exploration. This can be used in various settings, such as in educational settings, scientific publications, and popular media.


6 slides
Domestic Statistics Infographic
Domestic statistics typically refers to numerical data and information related to a specific country's internal affairs, activities, and demographics. This infographics can be an effective way to present important data and trends related to a specific country or region. This template is designed with a balance between design aesthetics and data accuracy. By presenting the information in a visually engaging manner, you can effectively communicate key insights to your target audience. Compatible with Powerpoint, Keynote, and Google Slides. This ensures that your infographic is accessible by providing alternative text for images and using high-contrast colors.


4 slides
Strategic Business Plan Presentation
Bring your long-term vision to life with a clean, modern presentation that turns complex planning into an easy-to-follow growth path. This layout helps you explain goals, strategies, and key steps with clarity and confidence. Fully editable and compatible with PowerPoint, Keynote, and Google Slides.


20 slides
Silverleaf Graphic Design Project Plan Presentation
This Graphic Design Project Plan Presentation Template offers a vibrant and modern design to showcase your creative process, key elements, and strategic goals. It includes sections for design brief, target audience, moodboard, prototypes, and implementation. Ideal for agencies and designers, fully customizable in PowerPoint, Keynote, and Google Slides.


5 slides
Alcohol Effects Infographics
Alcohol can have various effects on the body and mind, depending on the amount consumed, the individual's tolerance, and other factors. These unique vertical Infographics provide information about the physical, psychological, and social effects of alcohol use. They are designed to educate people about the risks of drinking too much and the consequences of alcohol abuse. To help you present your data these include statistics, illustrations, and other visual aids to help your audience understand the impact of alcohol on their health. By providing information about the effects of alcohol, this helps people make informed decisions about alcohol use.


8 slides
Business Gap Analysis Framework Presentation
Identify key business gaps with this Business Gap Analysis Framework presentation template! Featuring a structured layout that highlights the current state, desired state, and actionable steps to bridge the gap, this template is perfect for strategic planning, performance reviews, and business growth discussions. Fully customizable and compatible with PowerPoint, Keynote, and Google Slides.


20 slides
Fusion Product Roadmap Presentation
Elevate your product roadmap presentations with this sleek and modern template! Perfect for detailing product features, target market, and competitive analysis. Ideal for product managers and teams aiming to align strategy and execution. Compatible with PowerPoint, Keynote, and Google Slides, it’s an essential tool for showcasing your product journey effectively.


2 slides
Thank You Message and Contact Info Presentation
End your presentation on a polished note with the Thank You Message and Contact Info Presentation slide. This clean, professional layout features space for your name, company details, and contact information—plus a photo to humanize your brand. Includes light and dark theme options. Fully editable in Canva, PowerPoint, Keynote, and Google Slides.


5 slides
Core to Outer Ring Concentric Planning Presentation
Present your strategy from the inside out with the Core to Outer Ring Concentric Planning Presentation. This layered, radial design guides viewers through a central concept outward into supporting elements—ideal for planning, process modeling, or decision frameworks. Fully customizable in PowerPoint, Keynote, and Google Slides.


5 slides
Responsibility Assignment Matrix Slide
Make project accountability crystal clear with this smart and structured matrix designed for assigning responsibilities across roles. Ideal for outlining who's doing what in multi-team environments, this slide keeps everyone on the same page using the classic RACI method. Fully compatible with PowerPoint, Keynote, and Google Slides.
22 slides
Tanzanite Full-Service Agency Project Plan Presentation
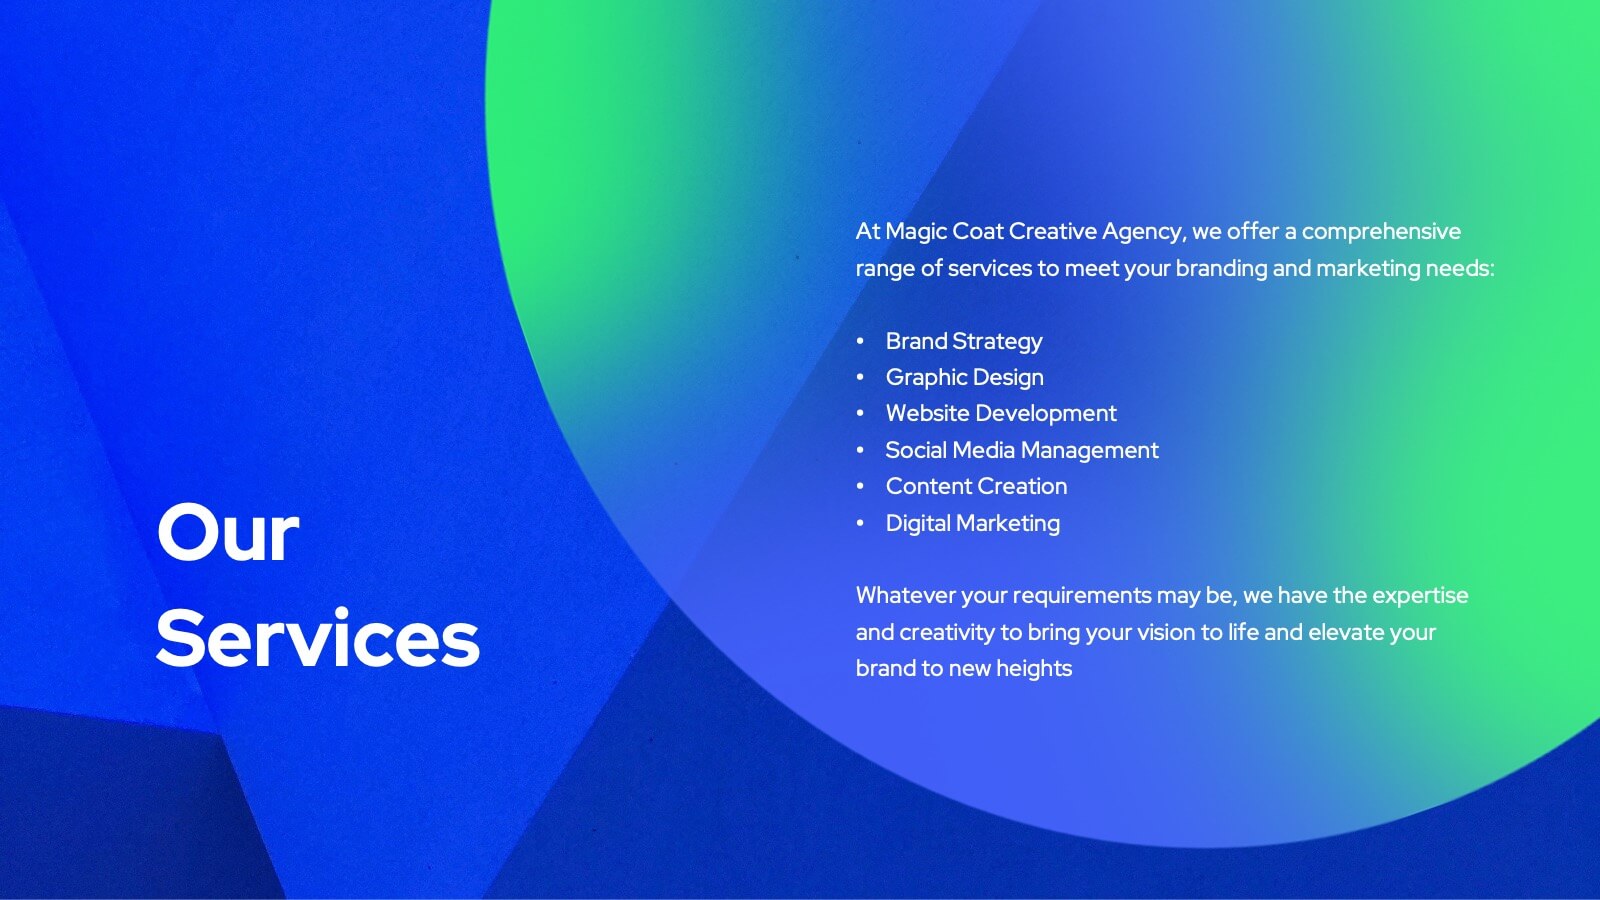
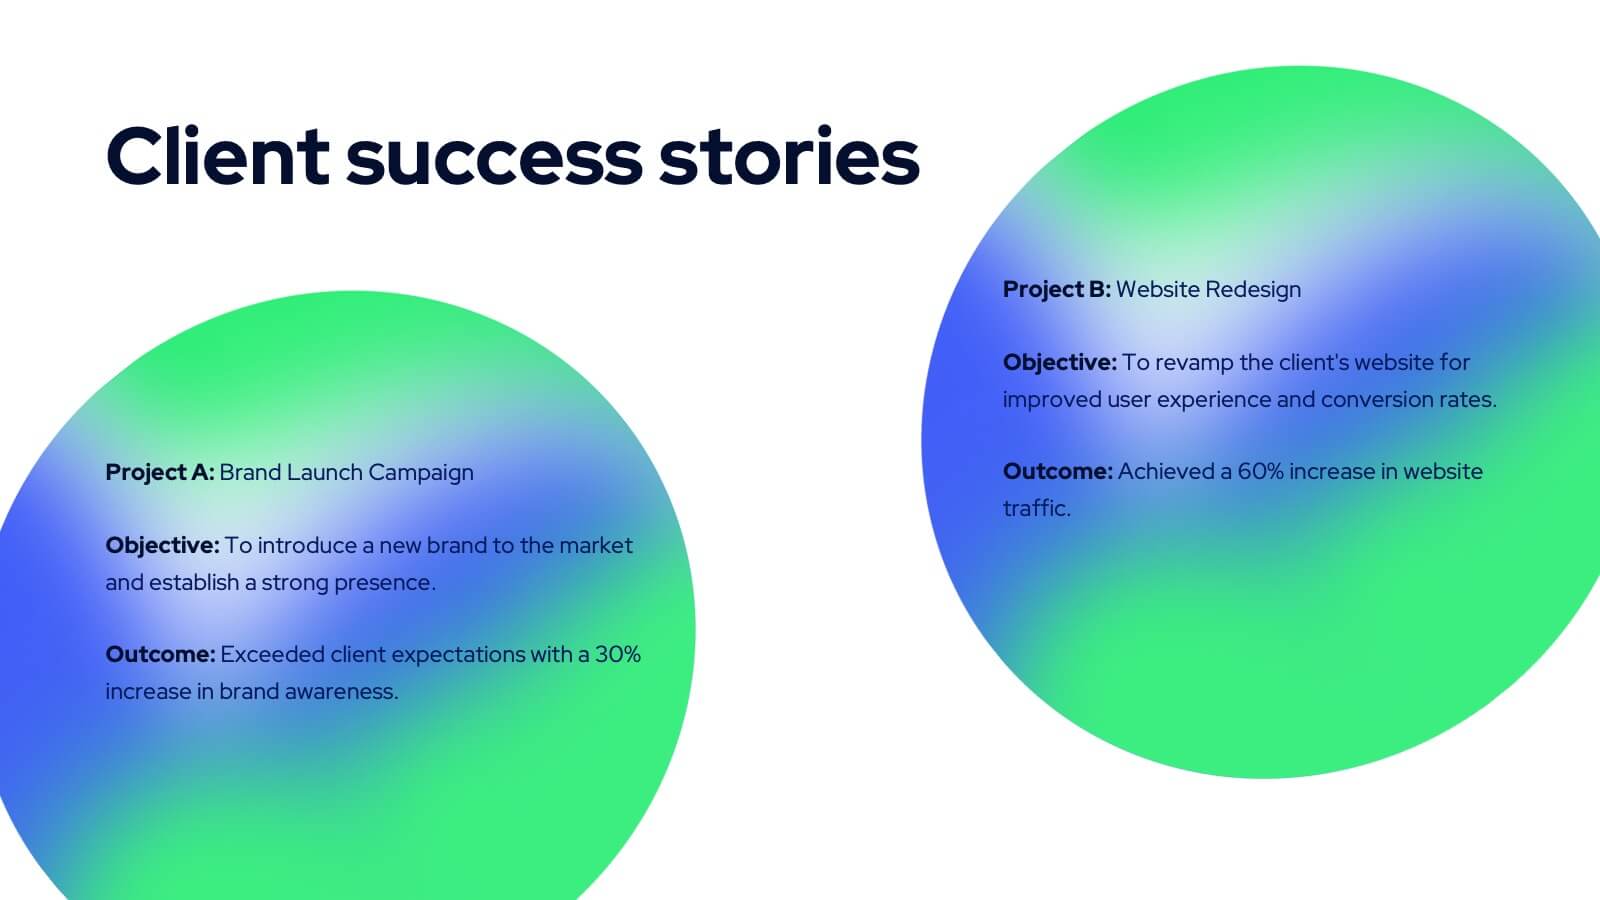
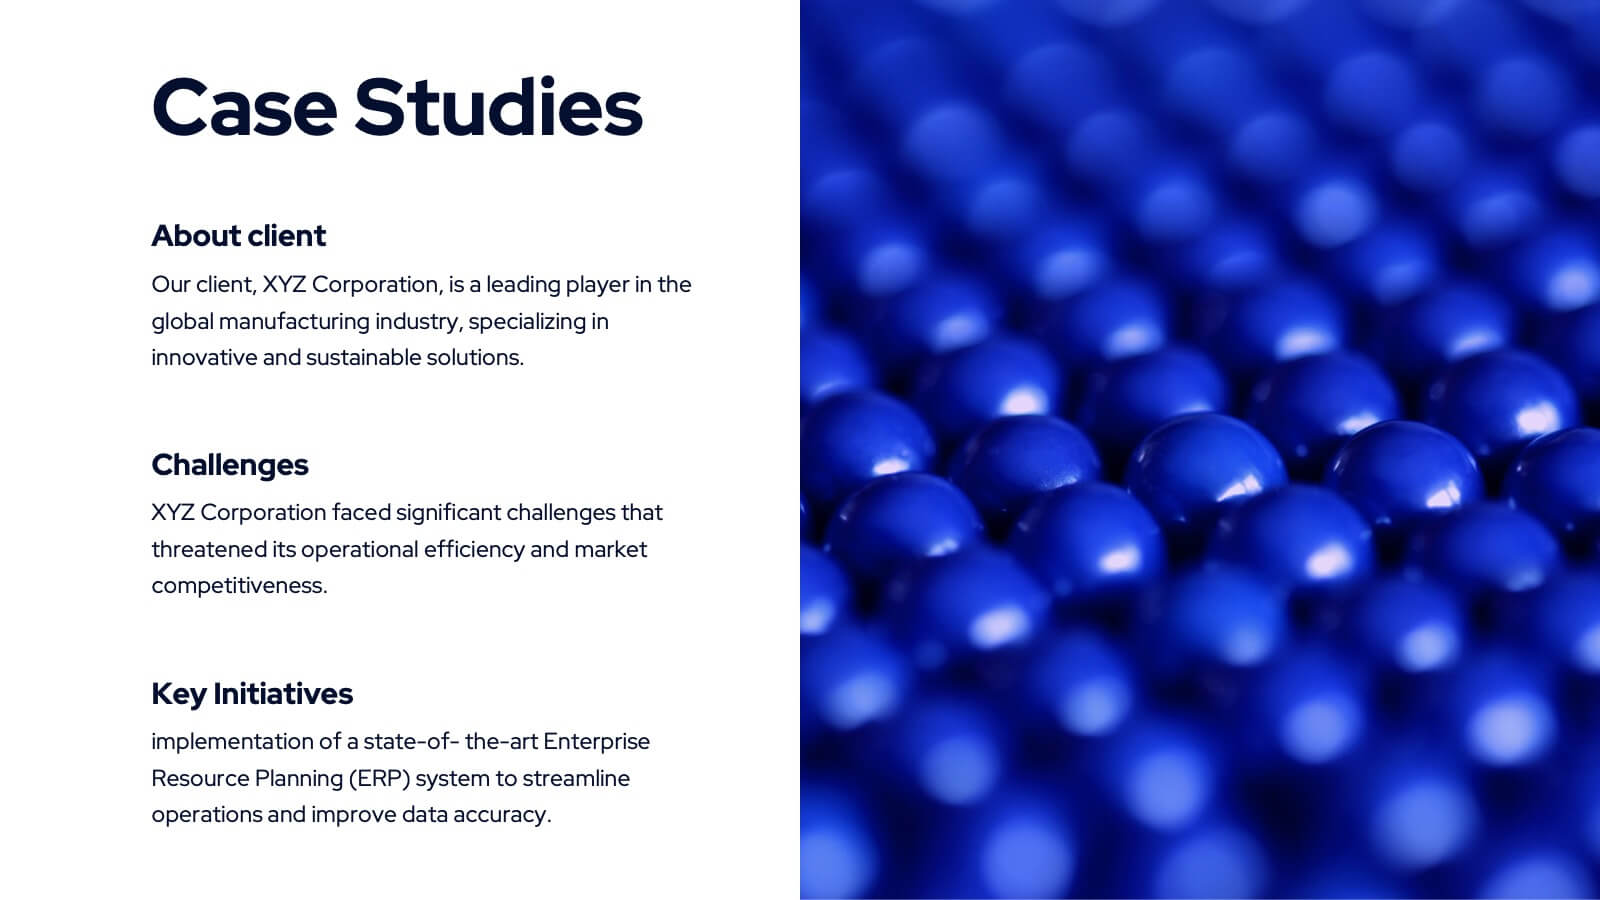
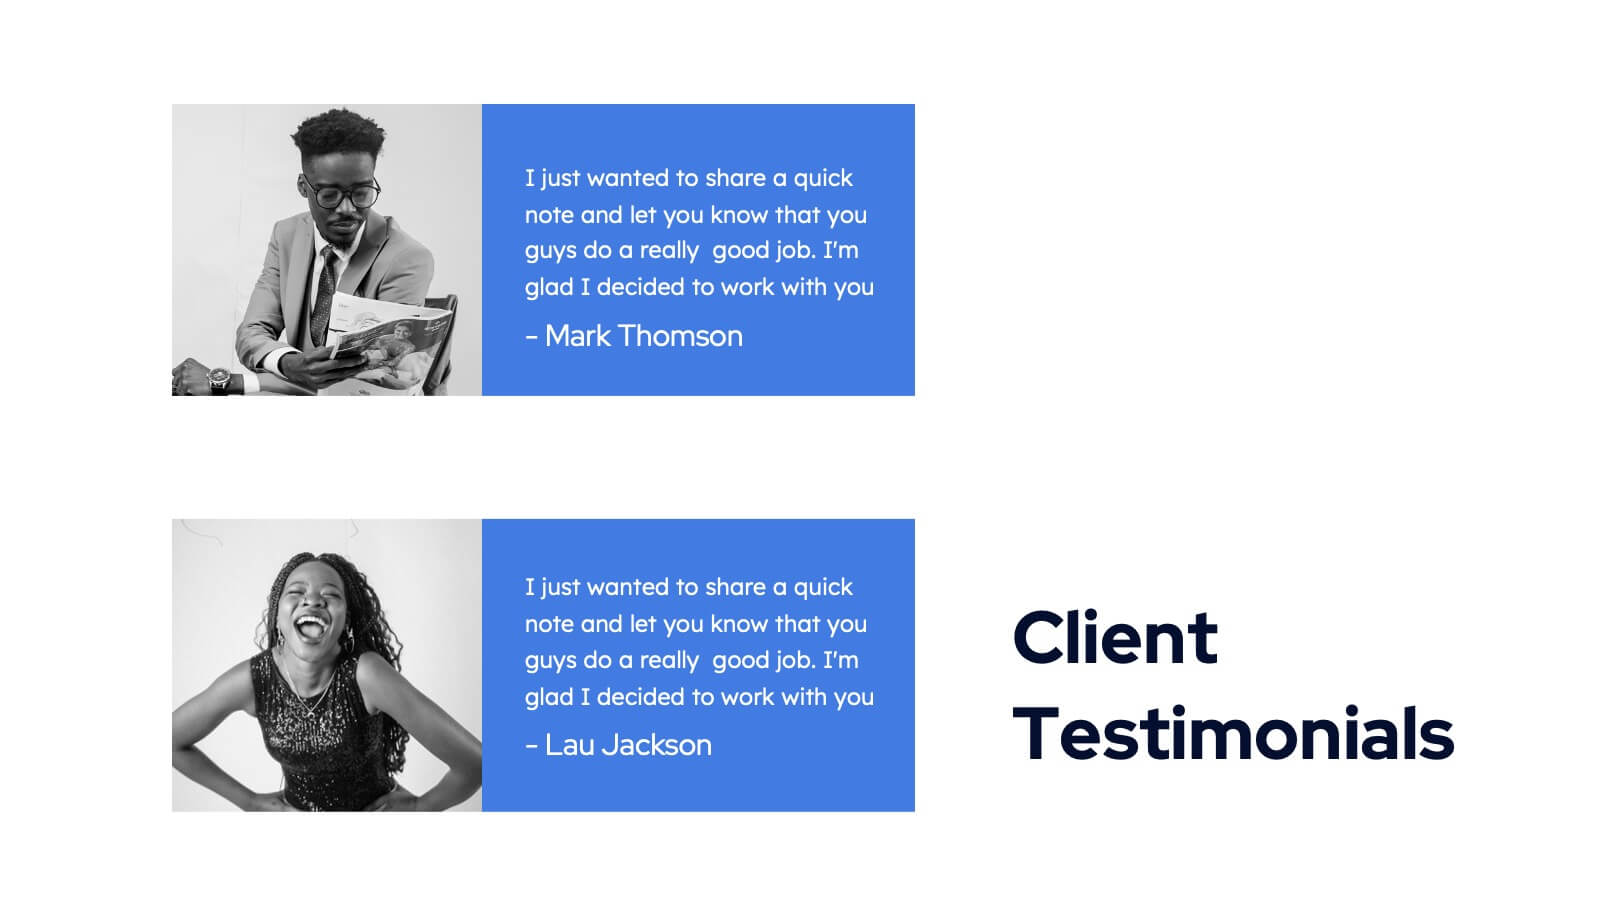
Showcase your agency's strengths with this bold and modern portfolio presentation template! From client success stories and case studies to market analysis and strategy development, this template highlights your expertise and approach. Perfect for agencies looking to present their services, creative processes, and partnerships. Compatible with PowerPoint, Keynote, and Google Slides, making it easy to impress any audience.


5 slides
Agriculture in The United States Infographics
Agriculture has been a crucial sector in the United States since its founding, with a rich history of innovation and productivity. These Infographics are visual representation of the agricultural industry in the US, covering statistics, trends, and insights about the sector. Use these to include information about the top crops grown in the country as well as the states with the highest agricultural output. The design incorporates nature-inspired icons and a customizable color palette that reflects the natural elements associated with agriculture such as green and brown hues. The vertical layout also allows for easy scrolling and viewing on digital platforms.


6 slides
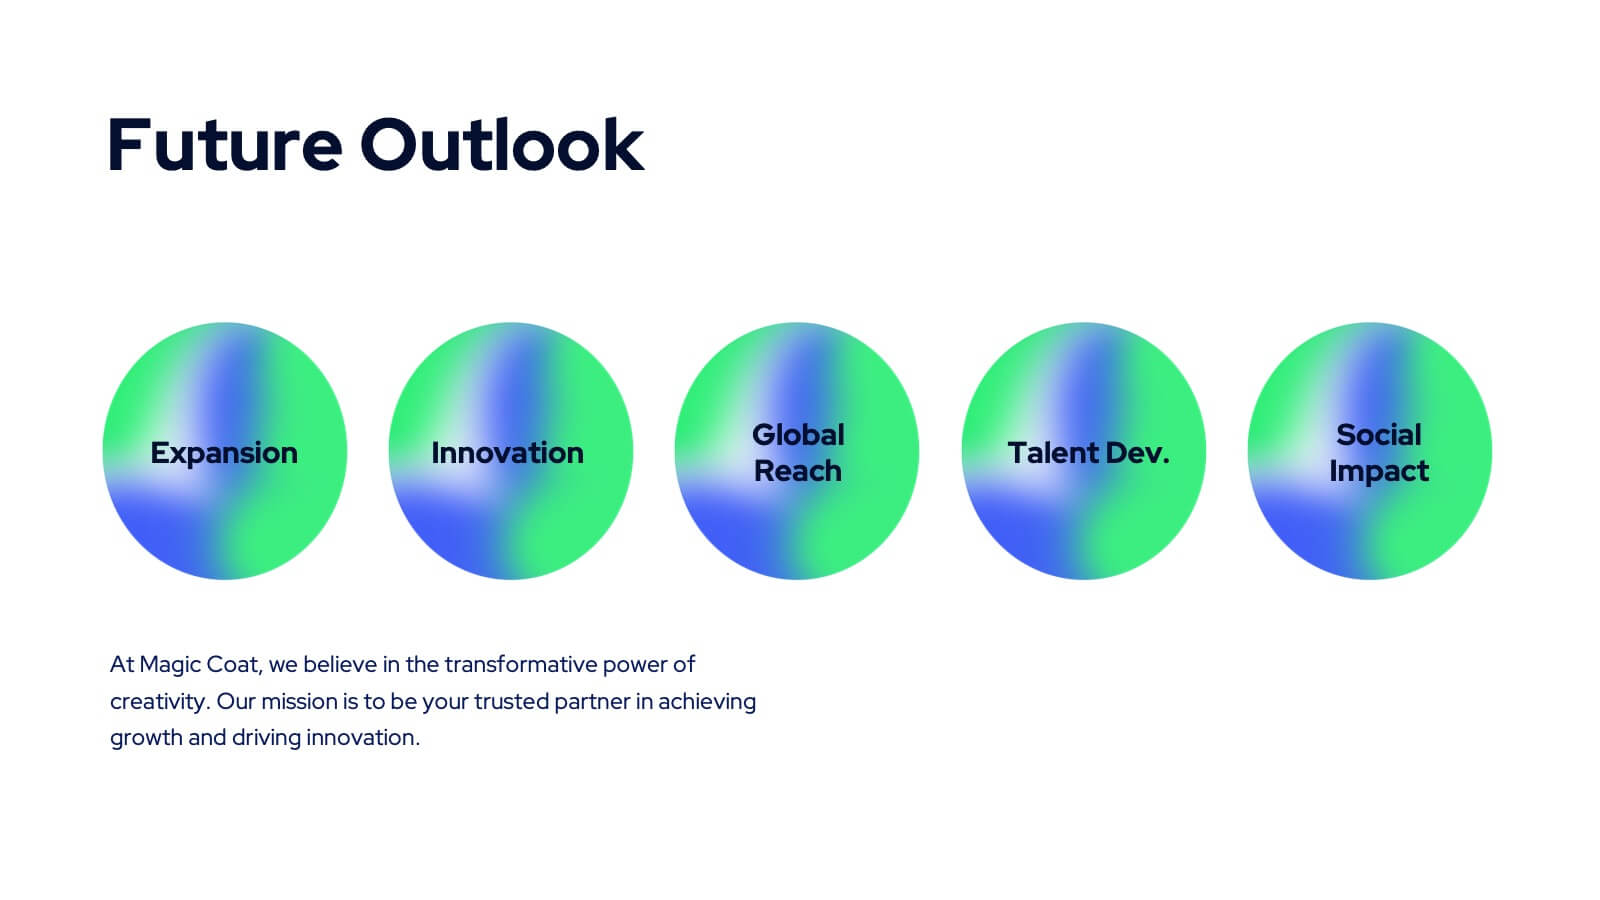
Geometric Shape Design Slides
Present your process or flow clearly using the Geometric Shape Design Slides Presentation. This layout uses connected circular icons to visually represent sequential steps, ideal for workflows, timelines, or strategic roadmaps. Each stage is color-coded and paired with editable titles and descriptions for clarity. Fully customizable in PowerPoint, Keynote, and Google Slides.


6 slides
Business Funnel Breakdown Visualization
Break down your entire sales or operational funnel with clarity using the Business Funnel Breakdown Visualization Presentation. This clean, 3D-styled funnel graphic divides your process into five editable layers, making it ideal for showcasing lead flow, process stages, or customer lifecycle phases. Fully customizable in PowerPoint, Keynote, and Google Slides.


5 slides
Compete-Free Market Space Creation Presentation
The Compete-Free Market Space Creation Presentation is designed to help illustrate a strategic shift toward innovation-led market growth. This circular diagram layout allows you to highlight four essential focus areas—each with customizable icons, titles, and supporting text. Ideal for presenting frameworks based on Blue Ocean Strategy, business differentiation, or uncontested market exploration. The clean, professional design supports storytelling with clarity and flow, making it perfect for consultants, business strategists, and executive teams. Fully editable in PowerPoint, Keynote, and Google Slides for maximum flexibility.


6 slides
Office Scenes Season Infographic
"Office Scenes" typically refer to the environments and activities that take place within an office setting. This Infographic template is a visual representation that showcases different scenarios and activities that commonly take place in an office environment. This type of infographic can be used to illustrate various aspects of office life, work culture, and interactions. This template provide insights into the day-to-day activities and culture of your workplace. Fully customizable and compatible with Powerpoint, Keynote, and Google Slides. Include your company logo or branding elements in the infographic.


4 slides
Creative Watercolor Presentation Theme Pack Presentation
Bring color and clarity to your data with this Creative Watercolor Presentation Theme Pack. Designed with bold watercolor arrows and clean typography, it's ideal for showcasing percentages, metrics, or milestones. Fully editable in PowerPoint, Keynote, and Google Slides—perfect for creative reports, marketing visuals, or strategic presentations with artistic flair.