


Features
- 5 Unique slides
- Fully editable and easy to edit in Microsoft Powerpoint, Keynote and Google Slides
- 16:9 widescreen layout
- Clean and professional designs
- Export to JPG, PDF or send by email


Do you have any questions?
Recommend


5 slides
Editable Circular Flow Presentation
Streamline your presentations with this Editable Circular Flow template. Ideal for processes, workflows, and strategic planning, this diagram visually represents key steps in a structured format. Fully customizable and compatible with PowerPoint, Keynote, and Google Slides, it ensures clarity and professionalism for engaging, data-driven presentations.


7 slides
Gap Analysis Skills Infographic
Gap analysis in a skills context is a process of evaluating the difference or "gap" between the current skills and competencies of an individual or a team and the desired or required skills for a particular role, project, or goal. This infographic template is a crucial tool for personal and professional development, talent management, and strategic planning within organizations. This captivating visual is designed to help individuals and organizations bridge the skills gap effectively. This infographic serves as a compass, guiding you through the essential steps needed to identify, analyze, and close the skills gaps within your organization.


4 slides
IT Infrastructure and Architecture Presentation
Enhance your IT Infrastructure and Architecture presentations with this structured infographic. Featuring a layered, circular design, this template is ideal for illustrating network systems, data management, cloud computing, and cybersecurity strategies. Fully editable and compatible with PowerPoint, Keynote, and Google Slides.


21 slides
Runewood Marketing Proposal Template Presentation
The Marketing Proposal Presentation Template provides 21 slides covering core aspects like market presence, growth strategies, and financial highlights. Perfect for agencies and businesses to showcase their marketing strategies effectively. Fully customizable and compatible with PowerPoint, Keynote, and Google Slides.


5 slides
Topic Web Mind Mapping
Visualize your ideas with clarity and structure using the Topic Web Mind Mapping Presentation. Perfect for brainstorming, educational planning, or strategic thinking, this layout helps you centralize a core concept and expand with five supporting branches. Customize easily in PowerPoint, Keynote, or Google Slides to fit any topic or audience.


6 slides
Post Office Scenes Infographics
The "Post Office Scenes" infographic template, designed for PowerPoint, Keynote, and Google Slides, is an ideal tool for postal services, logistics companies, and educational settings. This engaging template provides a detailed overview of everyday activities in a post office, making it perfect for a range of presentations. This template showcases key aspects of post office operations, including mail sorting, customer service interactions, and package handling. Its design is structured to convey the intricacies of postal services in an easy-to-understand and visually appealing manner. This makes it highly effective for training purposes, educational presentations, or explaining postal logistics in corporate environments. Adopting a professional color scheme that reflects the atmosphere of a postal service, the design is both thematic and informative. It captures the essence of a post office environment, enhancing the educational impact of the presentation. Whether used for staff training, classroom teaching, or corporate presentations, this template ensures a comprehensive and clear understanding of post office scenes and operations.


5 slides
Employee Training Needs Skills Gap Presentation
Optimize Workforce Training with a Skills Gap Analysis! The Employee Training Needs Skills Gap template helps HR teams, trainers, and managers visualize skill gaps, assess employee competencies, and align training programs with business goals. Featuring an interactive dot matrix layout, this template enables clear comparisons across skill areas, ensuring targeted and efficient upskilling strategies. Fully customizable in PowerPoint, Keynote, and Google Slides, it streamlines workforce development planning for maximum impact and growth.


6 slides
OKR Goal-Setting Framework Presentation
Achieve clarity and focus with the OKR Goal-Setting Framework. This structured layout helps visualize objectives and key results using hexagonal elements for a clear strategic overview. Perfect for business planning, performance tracking, and team alignment. Fully editable and compatible with PowerPoint, Keynote, and Google Slides for effortless customization.


5 slides
Environment Preservation Infographics
Environment preservation refers to the protection, conservation, and sustainable management of natural resources and ecosystems to maintain their integrity and ensure their long-term viability. These vertical infographics are designed to raise awareness about the current environmental challenges and inspire individuals and communities to take action to protect and conserve the environment. It can be used in presentations, workshops, educational campaigns, and sustainability initiatives to inspire individuals, organizations, and communities to take steps towards a more sustainable and resilient future. Compatible with Powerpoint, Keynote, and google Slides.


26 slides
Fashion Brand Shop Aesthetic Presentation
A fashion brand shop is a retail store that exclusively sells products from a particular fashion brand. This presentation template has a stylish design that perfectly reflects the essence of a high-end fashion brand. Whether you're launching a new collection, presenting your brand's story, or showcasing your latest fashion products, this template will captivate your audience. The presentation boasts sleek and elegant slides, featuring a blend of colors and images that will resonate with your brand's aesthetic. With its customizable elements, you can easily tailor the presentation to align with your brand's unique identity and aesthetics.


6 slides
Regional Finance Infographic
Regional finance plays a vital role in fostering economic growth, attracting investments, and improving the overall well-being of communities within a specific region. This infographic template focuses on financial trends, insights, and data related to specific regions or countries. It is designed to help businesses, organizations, or financial professionals analyze and understand the financial landscape of a particular region. The data-driven content in this template is suitable for businesses or individuals seeking insights to make informed decisions regarding investments, market entry, or financial planning in a specific region.


23 slides
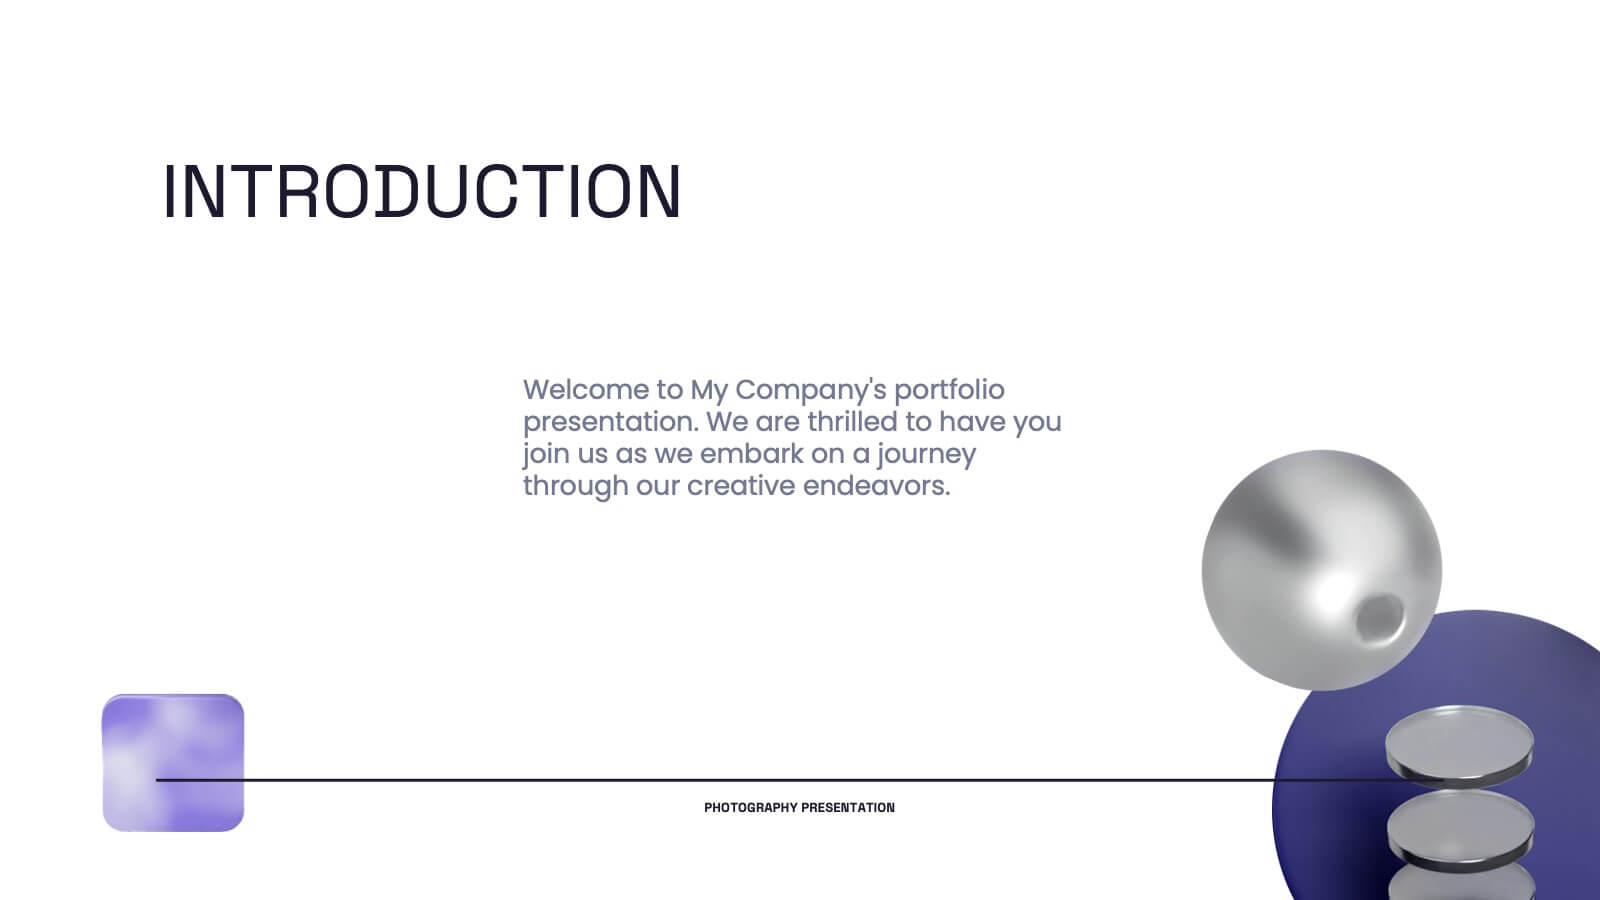
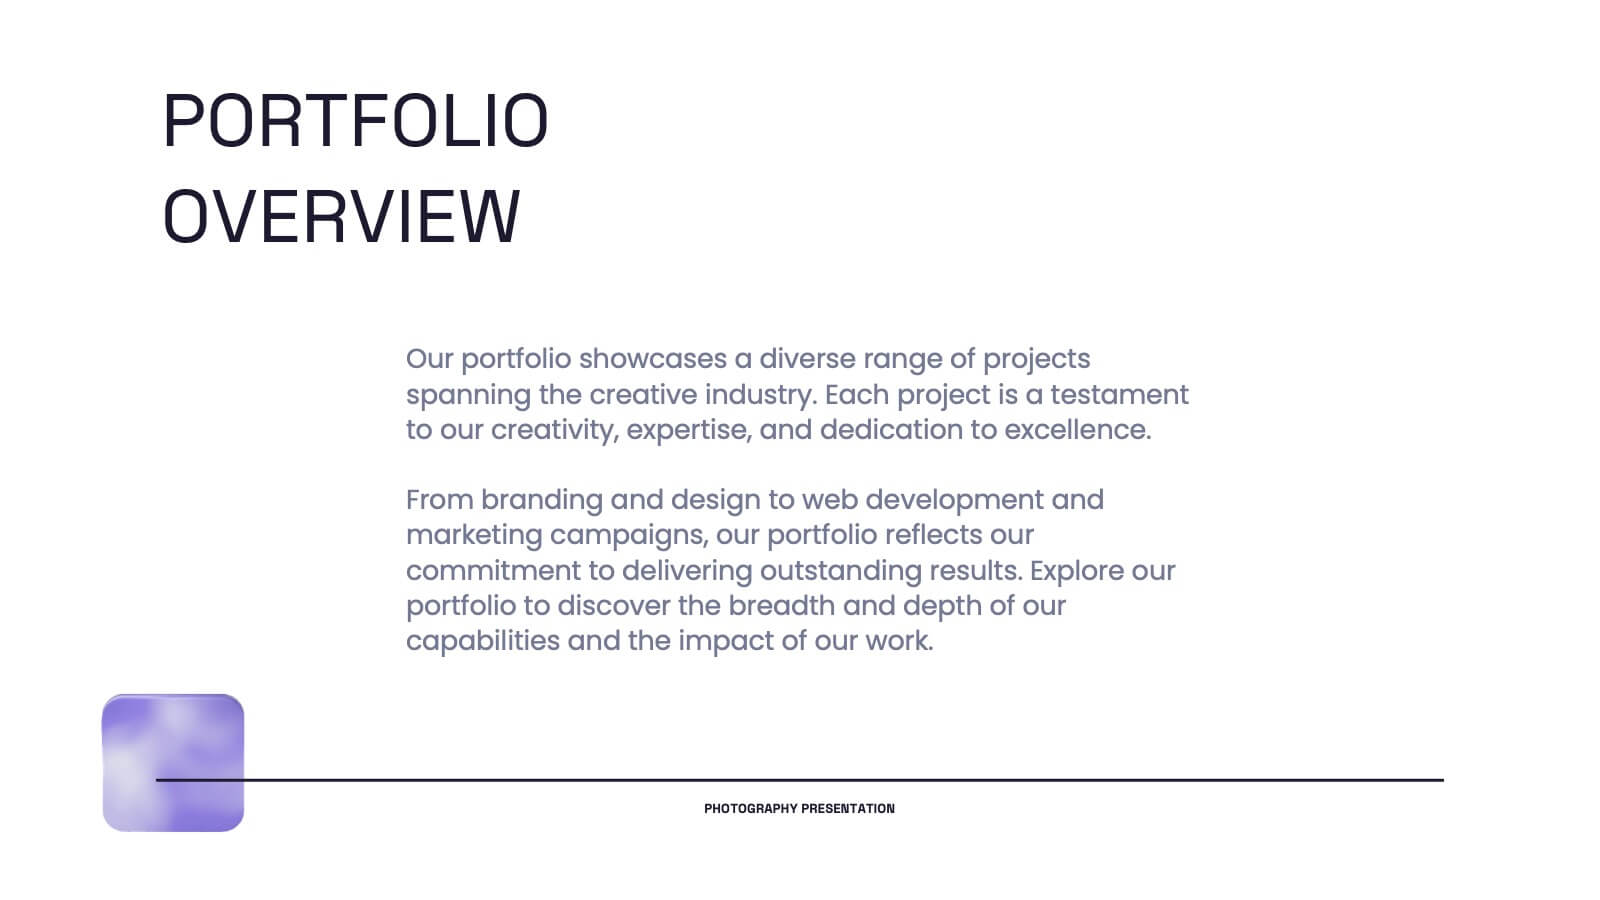
Pyroverse Photography Portfolio Presentation
Showcase your creative work effortlessly with this meticulously designed photography portfolio template. Tailored for photographers, this presentation highlights your style, achievements, and projects in a visually compelling format that speaks to your audience. This portfolio template includes dedicated slides for introducing your philosophy, showcasing your creative process, and presenting your best projects with high-impact layouts. Highlight client testimonials, collaborations, and awards to establish credibility and attract new clients. Additional slides for services, contact information, and social media links make it easier to connect with your audience. Compatible with PowerPoint, Google Slides, and Keynote, this template is fully customizable, allowing you to tailor it to your branding needs. Perfect for professional photographers, freelancers, and studios, this template ensures your portfolio stands out in a competitive market. Present your work with confidence and make a lasting impression with this professional design.


22 slides
Lucidia Market Research Presentation
Deliver insightful market research findings with this modern and structured template. It covers key areas such as data analysis, consumer insights, research methodologies, and future directions. Ideal for presenting to stakeholders or clients. Fully customizable for PowerPoint, Keynote, and Google Slides.


7 slides
Money Value Infographic
The value of money refers to its purchasing power or what it can buy in goods, services, or investments. Creating an infographic about the value of money can help people understand various aspects of finance, investment, and wealth. This template is compatible with Powerpoint, Keynote, and Google Slides. Customize the content, design, and visuals to create an engaging and informative infographic that helps people better understand the value of money and how to manage it wisely. Financial literacy is a valuable skill, and your infographic can empower individuals to make sound financial decisions.


5 slides
Strengths, Weaknesses, Opportunities & Threats Presentation
Visualize your SWOT analysis with clarity using the Strengths, Weaknesses, Opportunities & Threats Presentation. This editable puzzle-style slide makes it easy to present key insights and strategic positioning in a visually engaging format. Compatible with PowerPoint, Canva, and Google Slides for seamless customization and professional business planning.


7 slides
Social Media Report Infographic
A Social Media Report is a comprehensive document that provides an in-depth analysis and summary of a brand or individual's performance on various social media platforms. This template is designed to transform your digital statistics and strategies into a captivating visual story. Just like a well-crafted social media post, this template blends creativity with analytics, enabling you to present your online endeavors in an engaging and informative manner. Compatible with Powerpoint, Keynote, and Google Slides. This is a testament to your brand's digital journey, illustrating the vibrant and diverse landscape of your online presence.


5 slides
Easy Homemade Recipes Infographics
Introducing our Easy Homemade Recipes Infographics, these are graphic representations of simple and delicious recipes that can be made at home. These vibrant vertical infographics provide a step-by-step guide to creating tasty meals and snacks using ingredients that are readily available. This template includes detailed instructions for preparing the dishes, as well as the ingredients needed and the cooking time required. They are designed to be visually appealing, with colorful illustrations and fully editable easy-to-read text. These are perfect for anyone looking to learn new recipes or expand their culinary skills!