


Features
- 4 Unique slides
- Fully editable and easy to edit in Microsoft Powerpoint, Keynote and Google Slides
- 16:9 widescreen layout
- Clean and professional designs
- Export to JPG, PDF or send by email


Do you have any questions?
Recommend


6 slides
Modern Agriculture Trends Presentation
Bring innovation to the forefront with this visually engaging presentation design. Perfect for highlighting sustainability practices, agri-tech developments, and market evolution, it helps communicate key insights with clarity and style. Fully customizable and compatible with PowerPoint, Keynote, and Google Slides for a polished, professional presentation experience.


23 slides
Meteor New Product Proposal Presentation
The Meteor New Product Proposal template is the perfect tool for presenting your innovative ideas in a bold and professional manner. With its striking yellow and black color scheme, this template grabs attention while maintaining a clean and modern aesthetic. It’s designed to help you effectively communicate your product’s potential, covering key aspects such as problem statement, solution, market opportunity, competitive landscape, and unique selling proposition. The template also includes sections for financials, growth projections, and risk analysis, ensuring that every critical detail is covered. Ideal for startups, product managers, and marketers, this template is fully compatible with PowerPoint, Keynote, and Google Slides, making it easy to customize and present on any platform. Impress investors, stakeholders, or team members with a comprehensive and visually compelling proposal that highlights the strengths and opportunities of your new product.

21 slides
Luster Product Roadmap Presentation
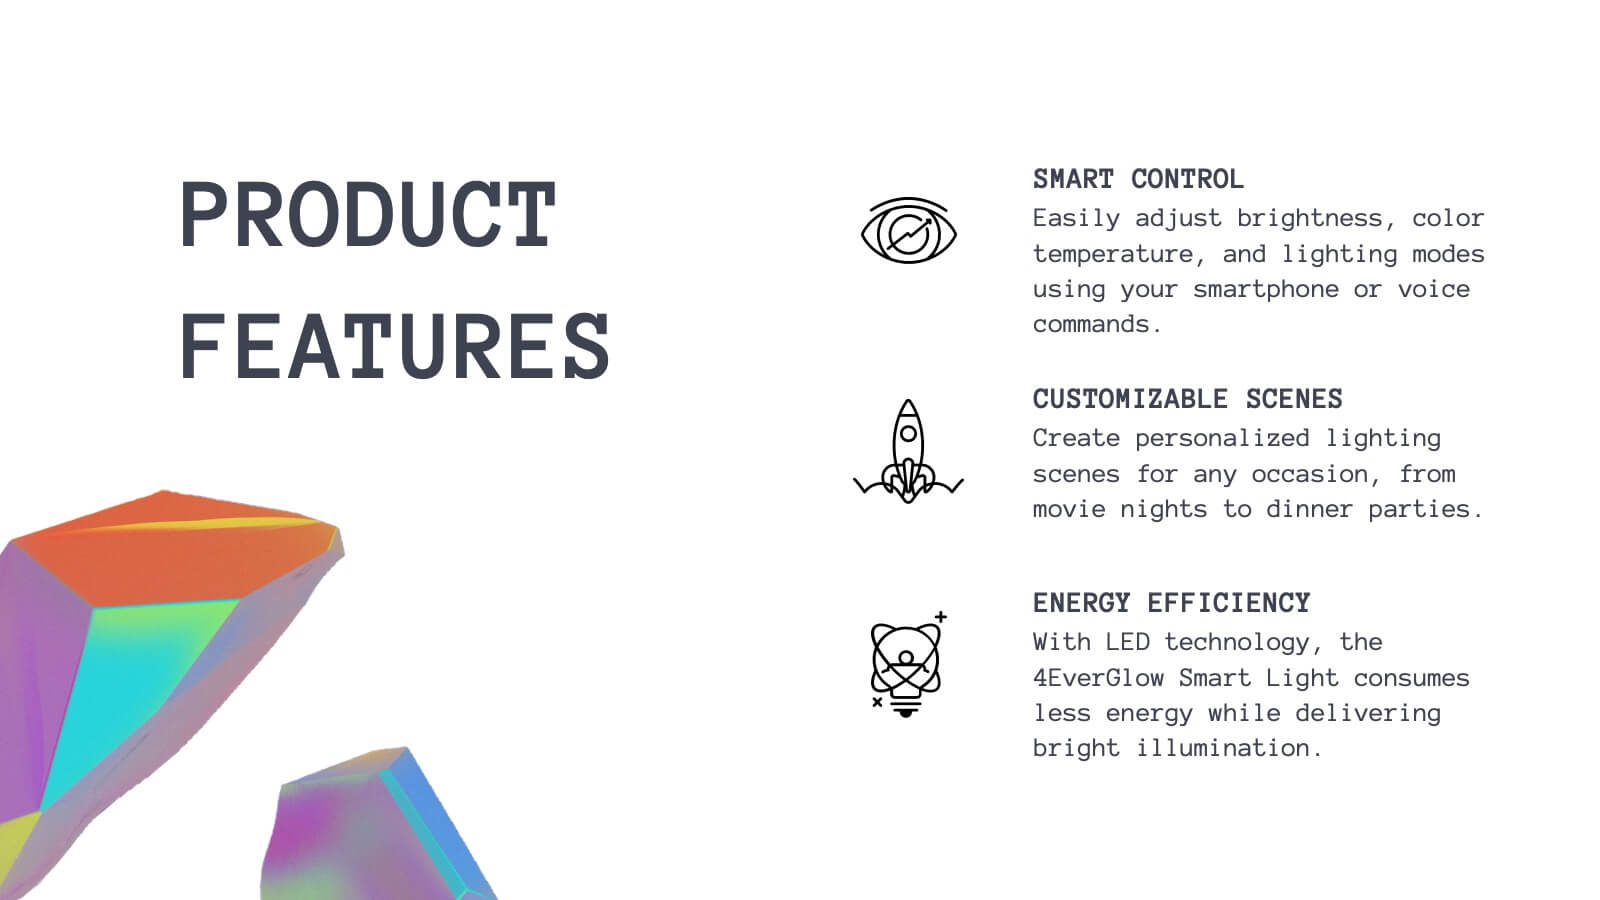
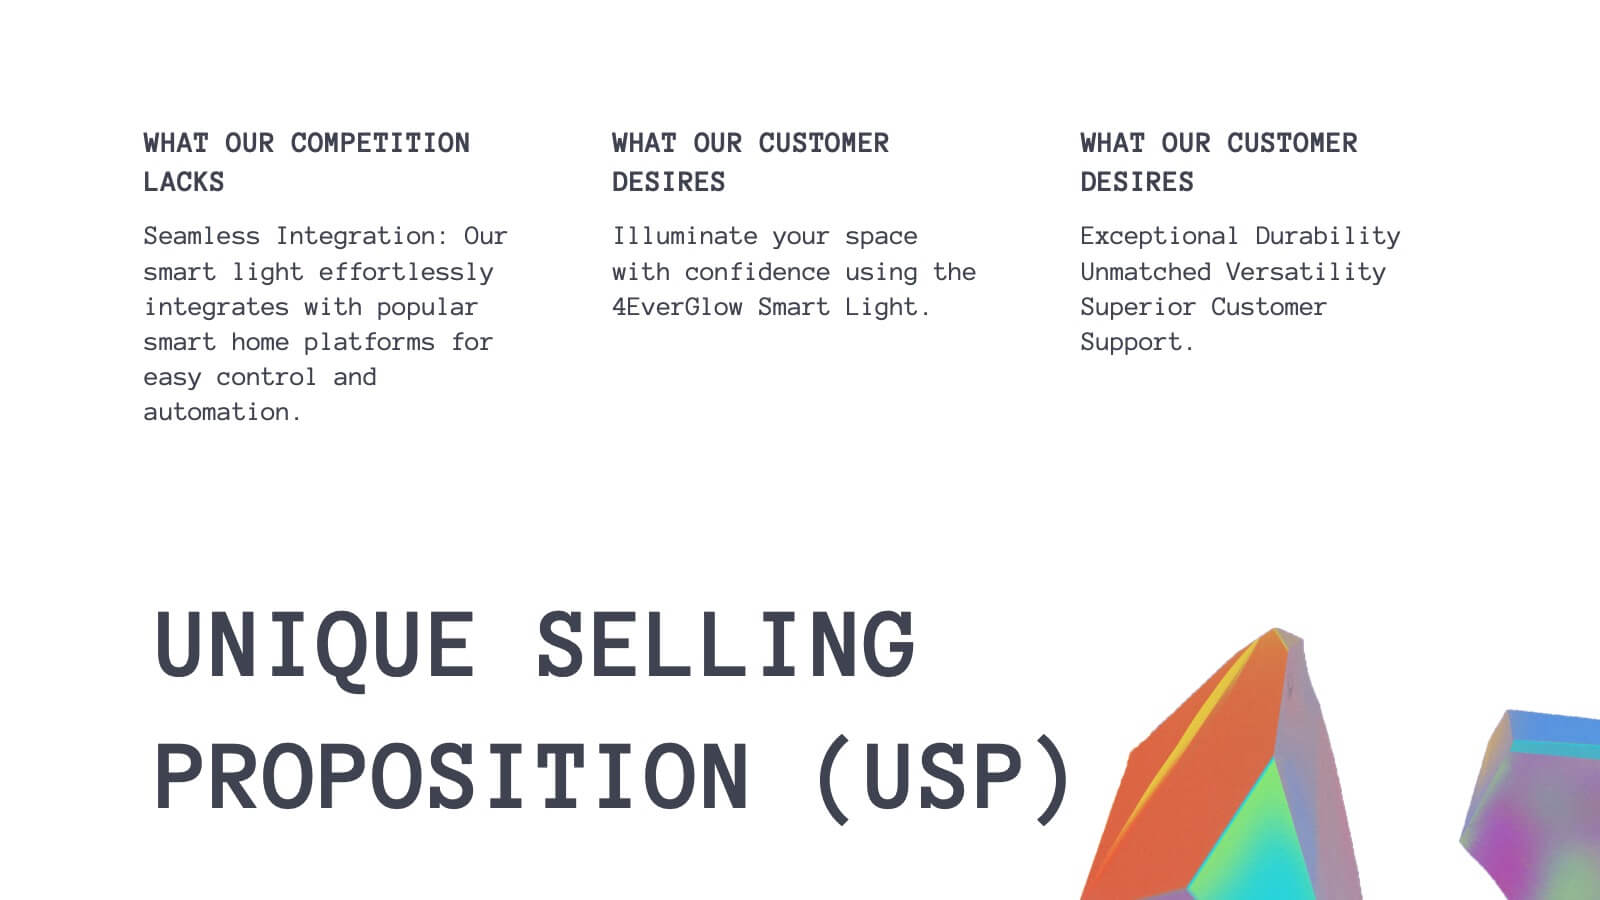
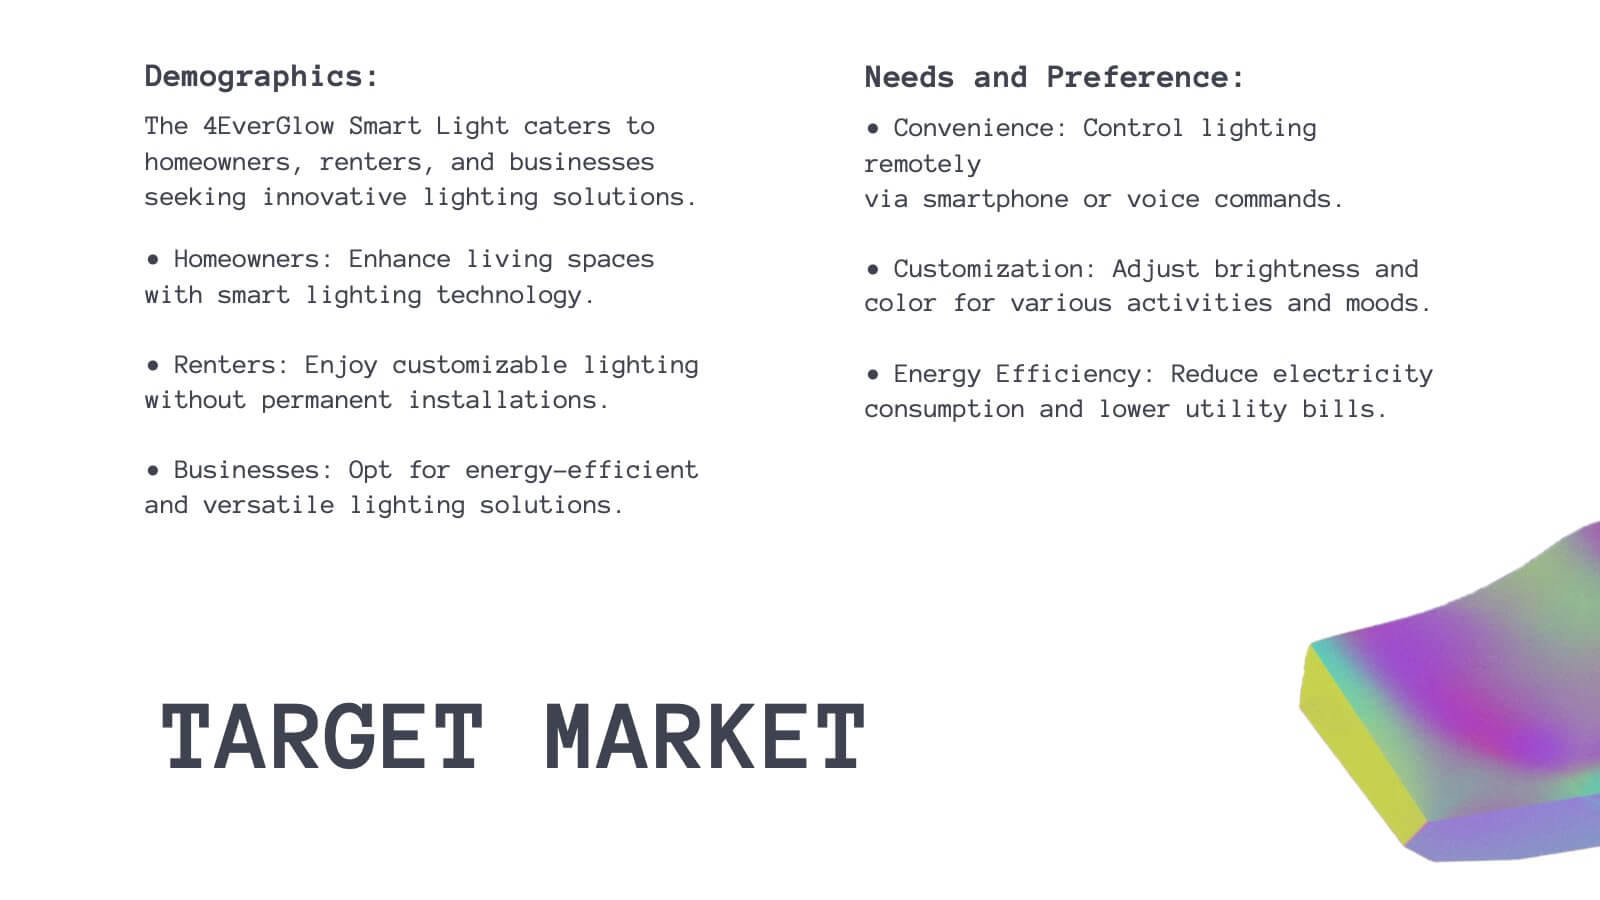
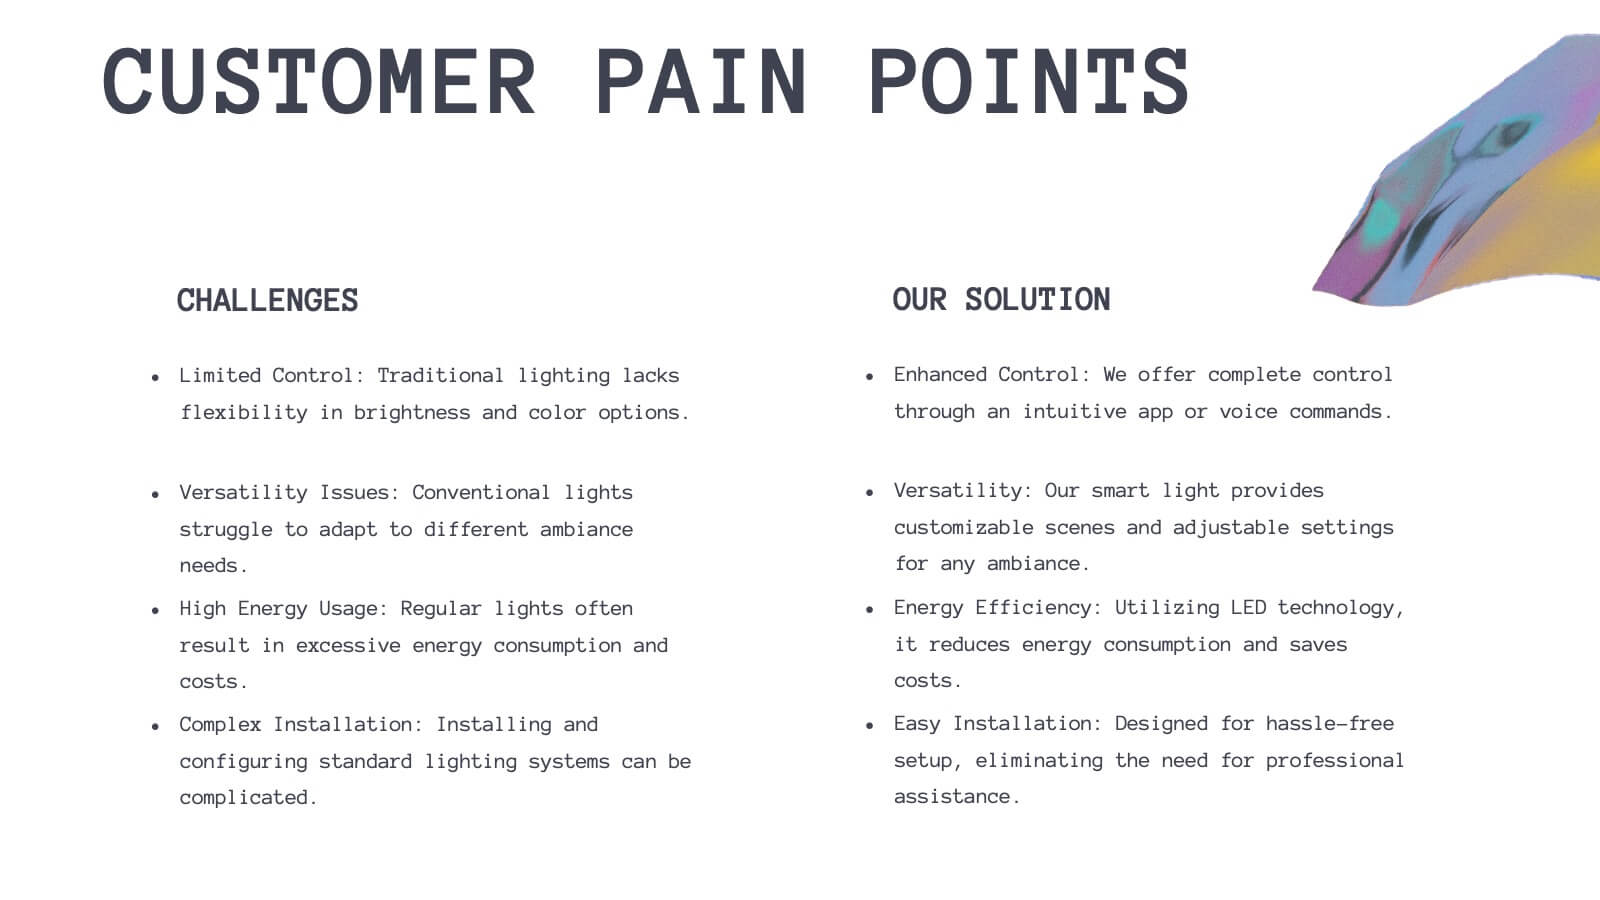
Bring your product journey to life with this vibrant, modern presentation template! Perfect for guiding your audience through product features, customer pain points, and competitive analysis, it’s designed for maximum clarity and engagement. Whether you’re showcasing technical specs or marketing strategies, this template fits all your needs. Compatible with PowerPoint, Keynote, and Google Slides.


20 slides
Oracle Startup Strategy Presentation
Launch your startup strategy with this sleek template! Perfect for detailing your mission, vision, business model, and market analysis. Ideal for entrepreneurs aiming to impress investors and stakeholders. Compatible with PowerPoint, Keynote, and Google Slides, this template ensures your startup strategy is professional, clear, and compelling. Secure your path to success!


4 slides
4-Quadrant Empathy Map Presentation
Dive into your audience’s mindset with a clean, structured layout that brings clarity to what they see, feel, hear, and do. This presentation helps teams understand user behavior and motivations with simple quadrant-based insights. Fully compatible with PowerPoint, Keynote, and Google Slides.


5 slides
Natural Disasters in the World Infographics
Natural Disasters are catastrophic events that occur as a result of natural processes or phenomena, and they can have severe impacts on human life, property, and the environment. These infographics are visually striking presentation templates that highlight various types of natural disasters that occur worldwide. It provides an overview of the most common natural disasters, their causes, and their impact on the environment and human lives. It is suitable for educational presentations, environmental discussions, disaster preparedness campaigns, and any other context where understanding natural disasters is essential.


4 slides
E-Learning Module Structure Presentation
Turn your lesson flow into a visual journey your audience can actually follow. This presentation template maps out the structure of an e-learning module with step-by-step clarity—ideal for course creators, instructional designers, or trainers. Easily customize each stage. Fully editable in PowerPoint, Keynote, and Google Slides for flexible use.


6 slides
Creative Alphabetic Infographic
Bring your message to life with a bright, alphabet-inspired layout that turns simple letters into eye-catching storytelling elements. This presentation is perfect for organizing steps, categories, or key ideas in a memorable way while keeping everything clear and structured. Fully editable and compatible with PowerPoint, Keynote, and Google Slides.


6 slides
Eco-Initiatives and Sustainability Efforts Presentation
Highlight your green strategy with the Eco-Initiatives and Sustainability Efforts Presentation. This template features a clean, icon-based layout to showcase up to six key eco-friendly actions or goals. Ideal for CSR reports, environmental planning, or internal sustainability updates. Fully editable in PowerPoint, Google Slides, and Canva.


20 slides
Quasar Design Strategy Proposal Presentation
Elevate your design strategy presentations with this modern, engaging template. Perfect for showcasing design briefs, concept development, and project timelines, it features a sleek layout with a cohesive color scheme. Highlight key elements like typography, textures, and feedback processes to captivate your audience. Compatible with PowerPoint, Keynote, and Google Slides, it ensures seamless presentations on any platform.


7 slides
Business Continuity Plan Infographic Presentation
A well-written business plan helps entrepreneurs focus on their next steps, anticipate challenges and overcome them before they occur. This template will guide you through the process of writing a professional, successful and effective business plan. This template design is highly visual, vibrant and engaging with neutral colors. It uses the best parts of a business plan, such as graphs and charts, to visualize your ideas. This business plan infographic is a sharp visual aid for investors, partners, board members and anyone else who needs to know more about what you do and how you plan to grow.


7 slides
Cyber Security Infographic Presentation Template
Cybersecurity helps protect your business from cybercrime and unauthorized access to data. It is a crucial step to safeguard your business from malicious attacks that can lead to confidential data being stolen, as well as loss of revenue through fraudulent transactions. With this template you can ensure that you and your business are well informed on the importance of cybersecurity. This template will provide you with a good starting point to create a cybersecurity strategy. This template includes illustrations on goals, benefits, limitations and recommendations based on your audience's needs.


12 slides
Market Research Data Insights Presentation
Gain Valuable Market Insights! The Market Research Data Insights Presentation is designed to help businesses analyze trends, customer behavior, and competitive landscapes. Featuring a structured circular layout, this template ensures data is easy to interpret and present. Fully customizable and compatible with PowerPoint, Keynote, and Google Slides for seamless editing.


6 slides
Organizational Goals and SMART Objectives Presentation
Align your business vision with clarity using this Organizational Goals and SMART Objectives slide. Designed to visually represent each SMART component—Specific, Measurable, Achievable, Relevant, and Time-bound—it helps communicate strategic goals in a simple and effective format. Fully editable in Canva, PowerPoint, and Google Slides for maximum flexibility.


7 slides
Oceania Map Infographic Presentation Template
The Oceania Map is a geographical region comprising Australasia, Melanesia, Micronesia and Polynesia. The largest landmass of Oceania is Australia. Oceania's borders differ slightly from country to country, but its boundaries are mostly defined by the waters surrounding its many islands. This Oceania map template is the first step to creating an engaging and informative map. It features the entire continent, surrounding islands, and sub-regions. The white background makes it easy to fill out with your colorful content. This template is suitable for school projects or business presentations.


4 slides
Strategic Idea Pitch Presentation
Present your strategic ideas with clarity using this structured Strategic Idea Pitch template. Designed for business professionals and entrepreneurs, it simplifies complex ideas with a visual roadmap. Fully customizable and compatible with PowerPoint, Keynote, and Google Slides, it ensures a polished, persuasive presentation for pitching strategies and innovations effectively.


6 slides
Agile Development Methodology Infographic
Discover a visually engaging way to present the Agile Development Methodology with our versatile infographic template. Perfect for Powerpoint, Google Slides, and Keynote users, this template breaks down complex Agile concepts into easy-to-understand visuals. Whether you're illustrating the cycle of sprints, the importance of daily scrums, or the process of backlog refinement and reviews, our infographic makes it simple. It’s ideal for project managers, agile coaches, scrum masters, and team members looking to communicate the flexibility and dynamics of Agile workflows. Adopt a clear, concise approach to explaining iterative development and foster a better understanding in your audience with this user-friendly template.