


Features
- 8 Unique slides
- Fully editable and easy to edit in Microsoft Powerpoint, Keynote and Google Slides
- 16:9 widescreen layout
- Clean and professional designs
- Export to JPG, PDF or send by email


Do you have any questions?
Recommend


6 slides
Innovation-Driven Culture and Vision
Present your strategy with clarity using the Innovation-Driven Culture and Vision Presentation. This clean, modern layout features five vertical icon markers to highlight key pillars of innovation. Ideal for leadership talks or team strategy meetings. Fully customizable in PowerPoint, Keynote, and Google Slides for easy edits and branding.


22 slides
Gale Gust Financial Report Presentation
Unleash the power of your financial presentations with the Gale Gust Financial Report template! This sleek, modern design features a captivating black theme that radiates professionalism and confidence. The layout is meticulously structured to guide your audience through key highlights, performance metrics, sales performance, and financial summaries with ease. Each slide is designed to keep the focus on your data, with clean lines and a minimalist aesthetic that enhances readability and impact. Whether you're showcasing operational updates, market trends, or strategic initiatives, this template ensures that your content shines. Ideal for corporate meetings, investor updates, and financial reviews, this template is fully compatible with PowerPoint, Keynote, and Google Slides. The Gale Gust template is your perfect companion for delivering financial reports that command attention and leave a lasting impression. Get ready to make your numbers speak volumes!


7 slides
Structure Diagram Infographics
Structure is important because it provides a framework for organization and order, which helps to facilitate efficiency, productivity, and success in many different areas of life. This template is a powerful tool that can help you organize, visualize, and present your data in a compelling way. This infographic template is designed to illustrate the structure and workings of a company or organization. It includes a variety of customizable photo layouts and charts so you can edit the look to suit your needs. This presentation is designed for use in Powerpoint, Keynote and Google Slides.

23 slides
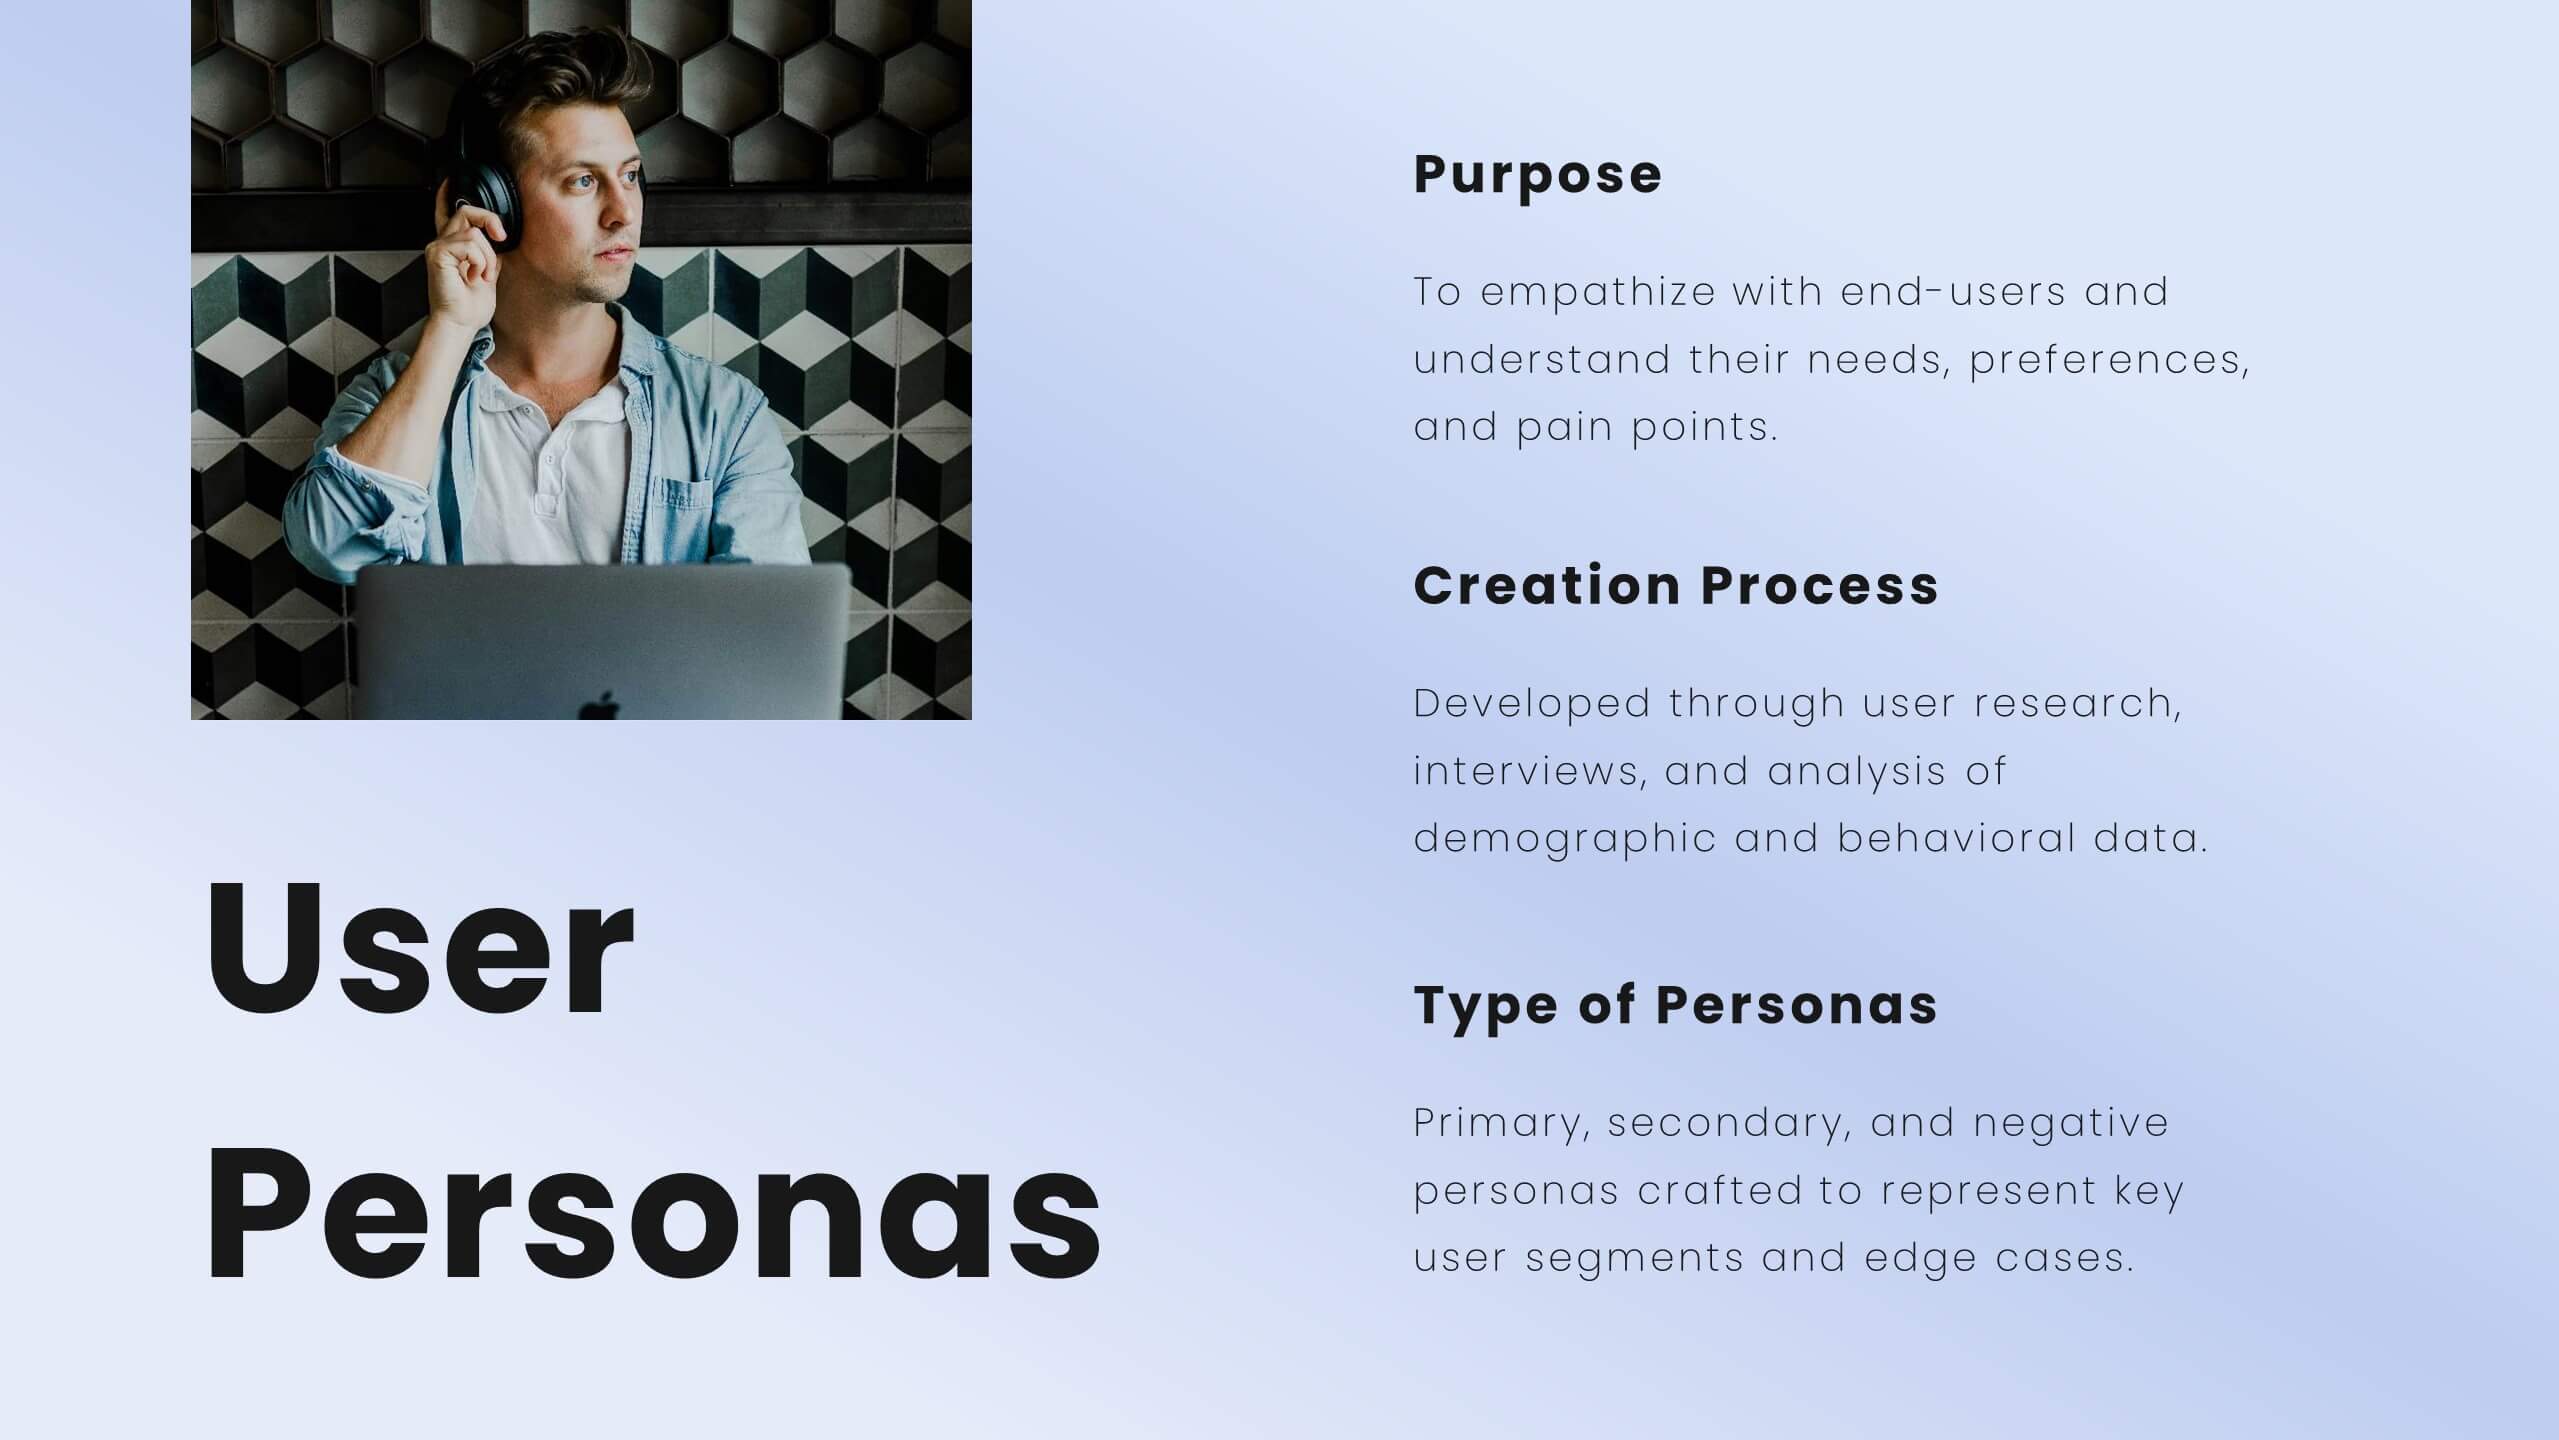
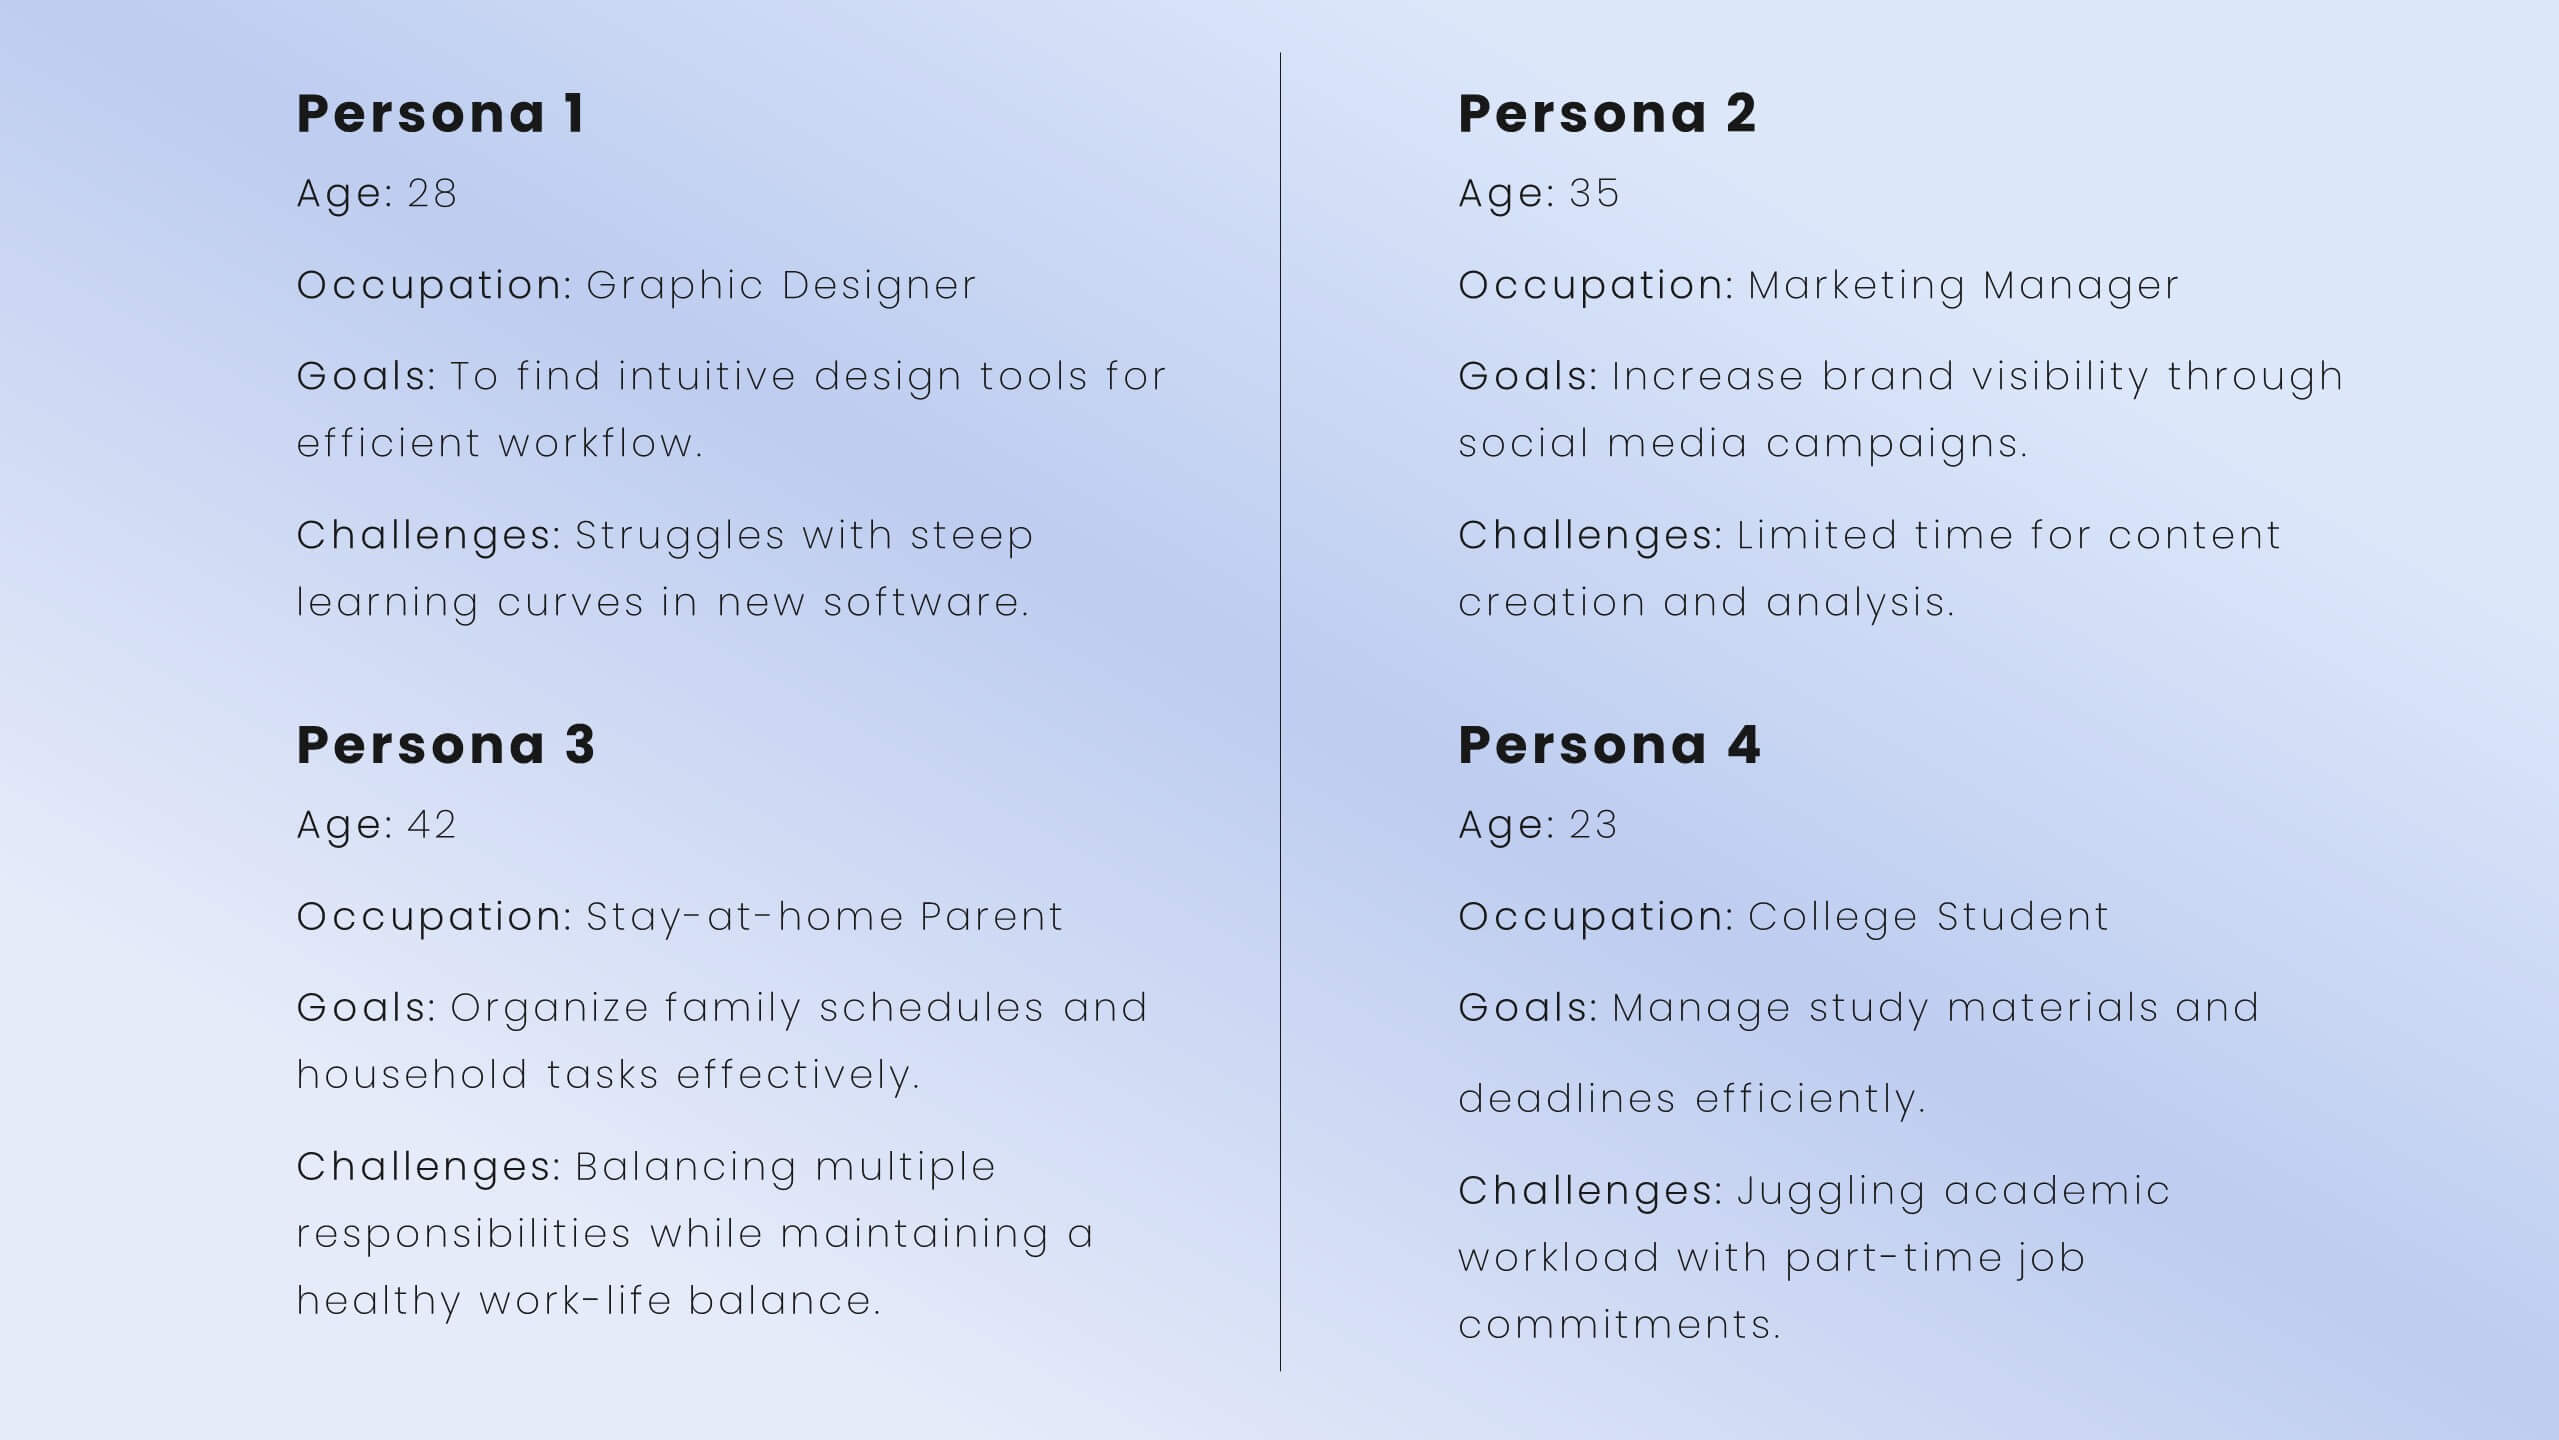
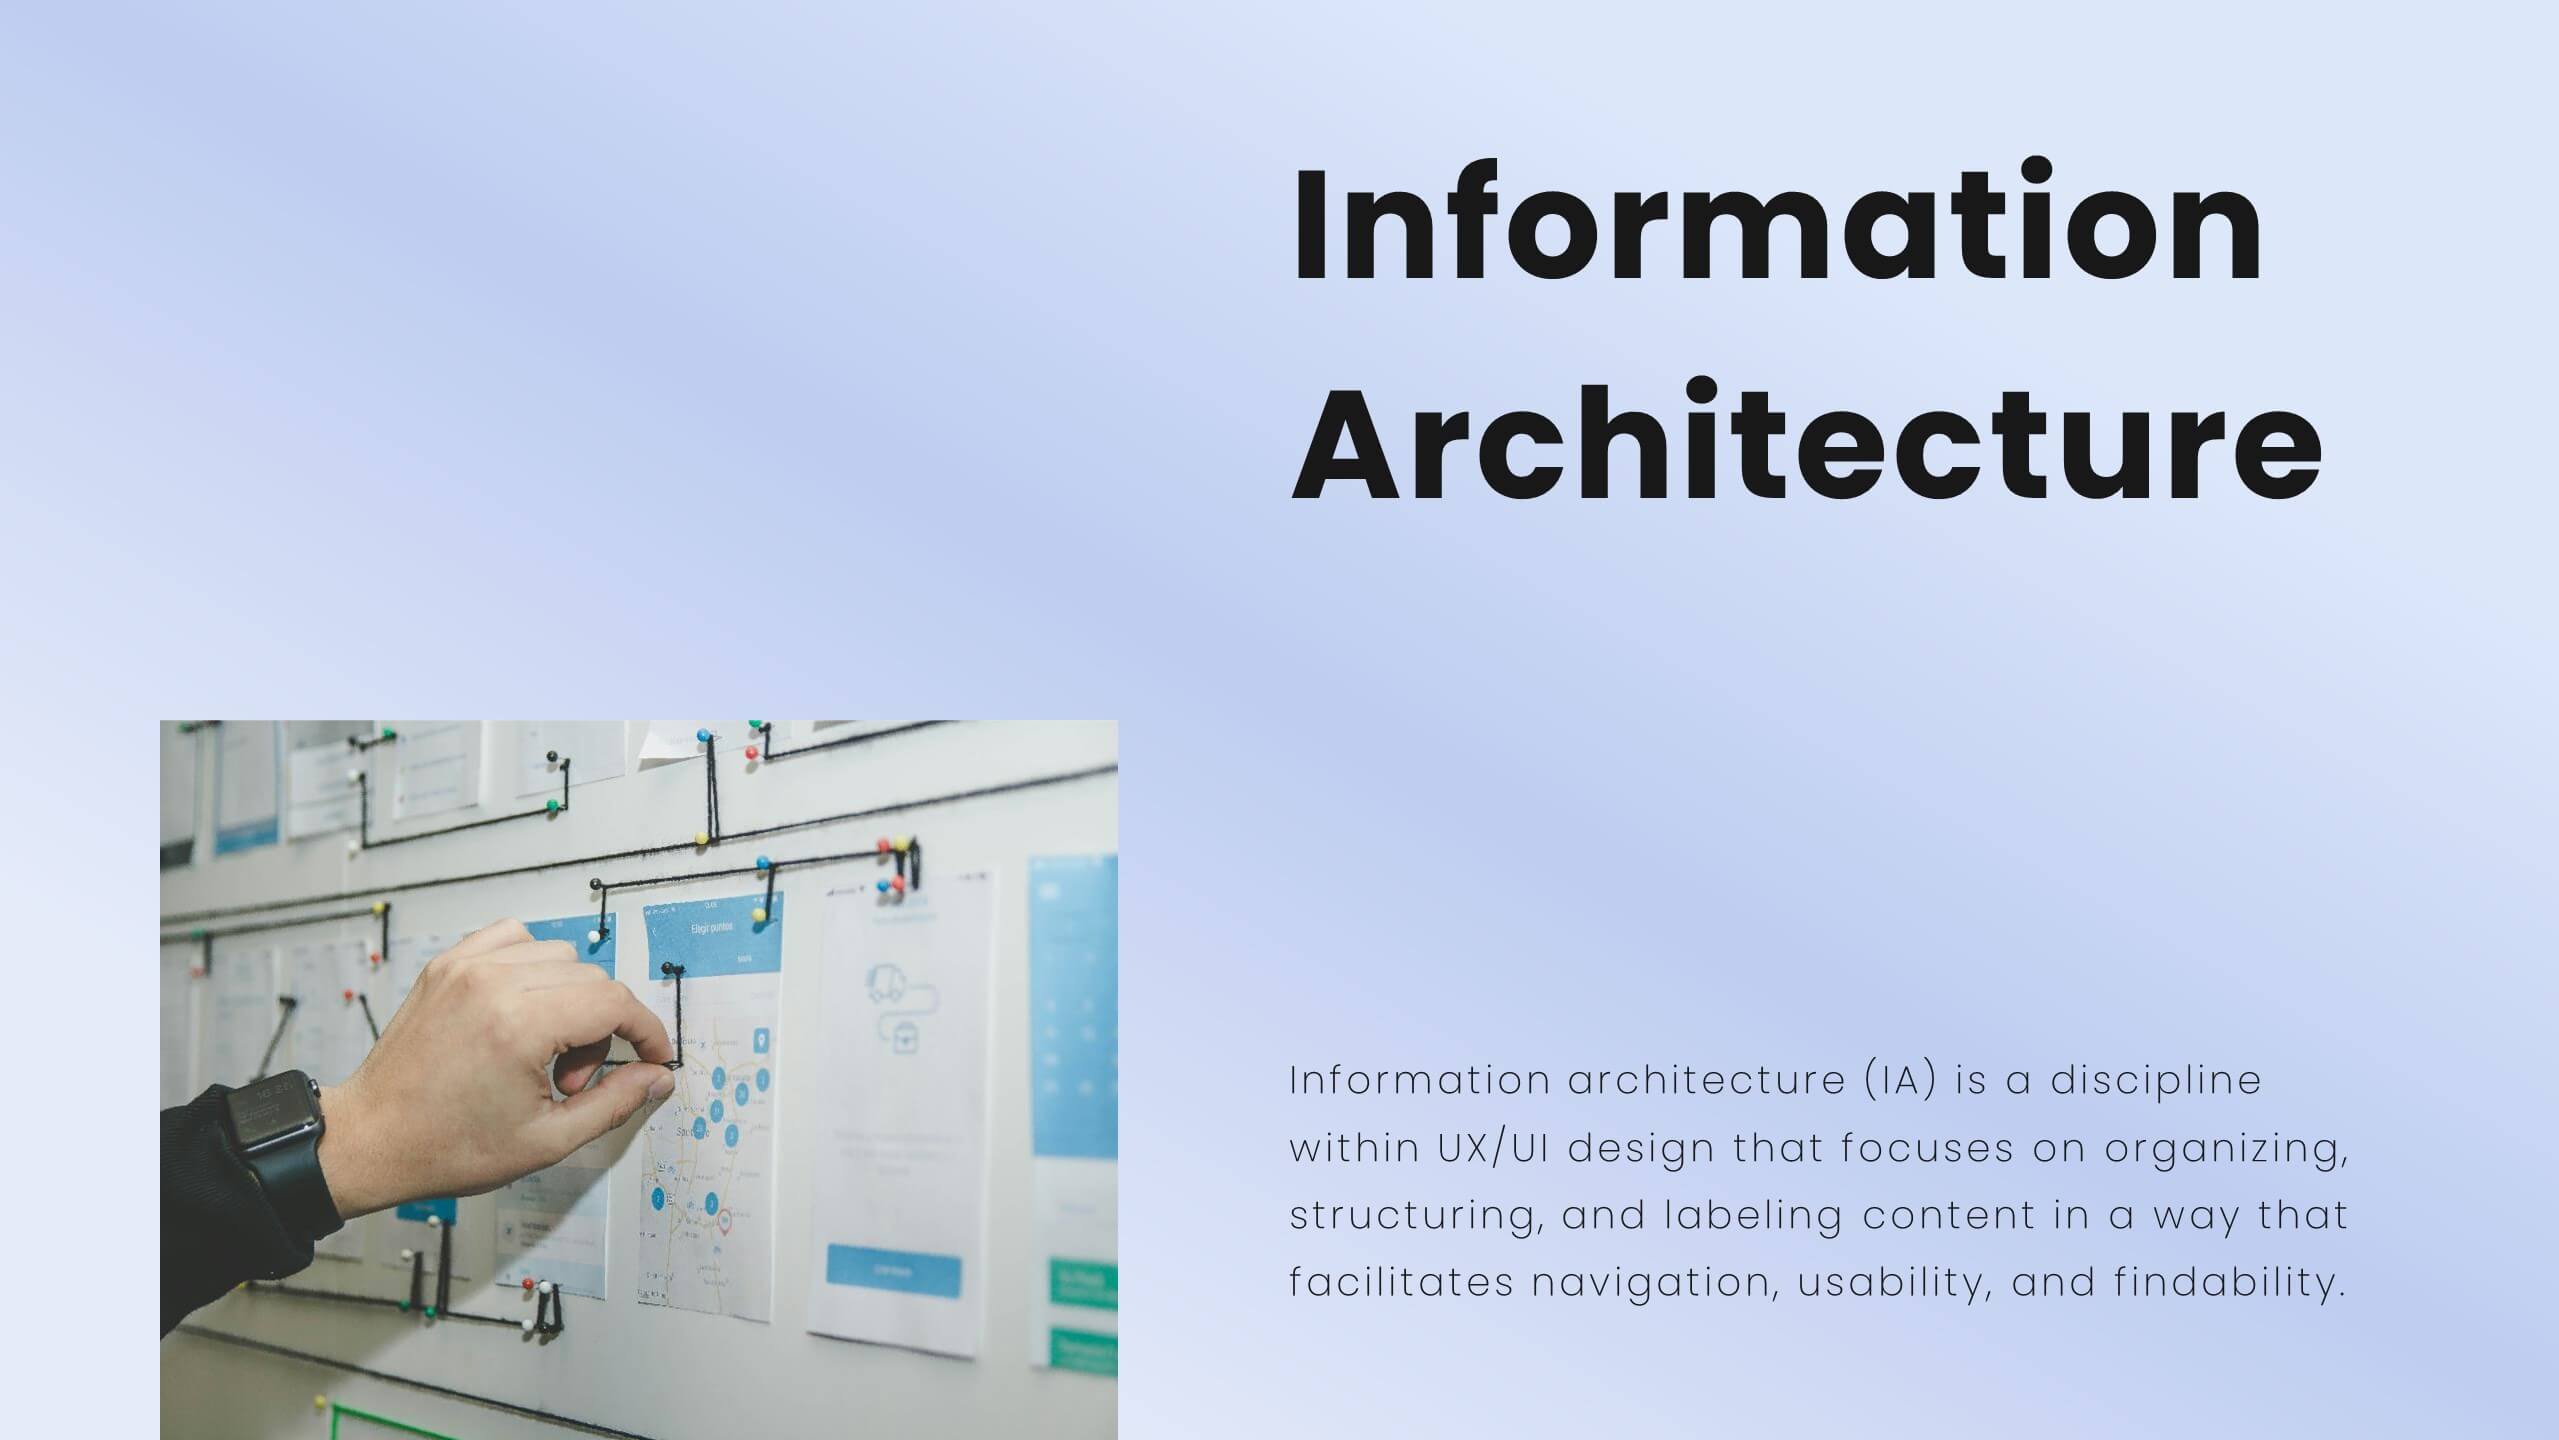
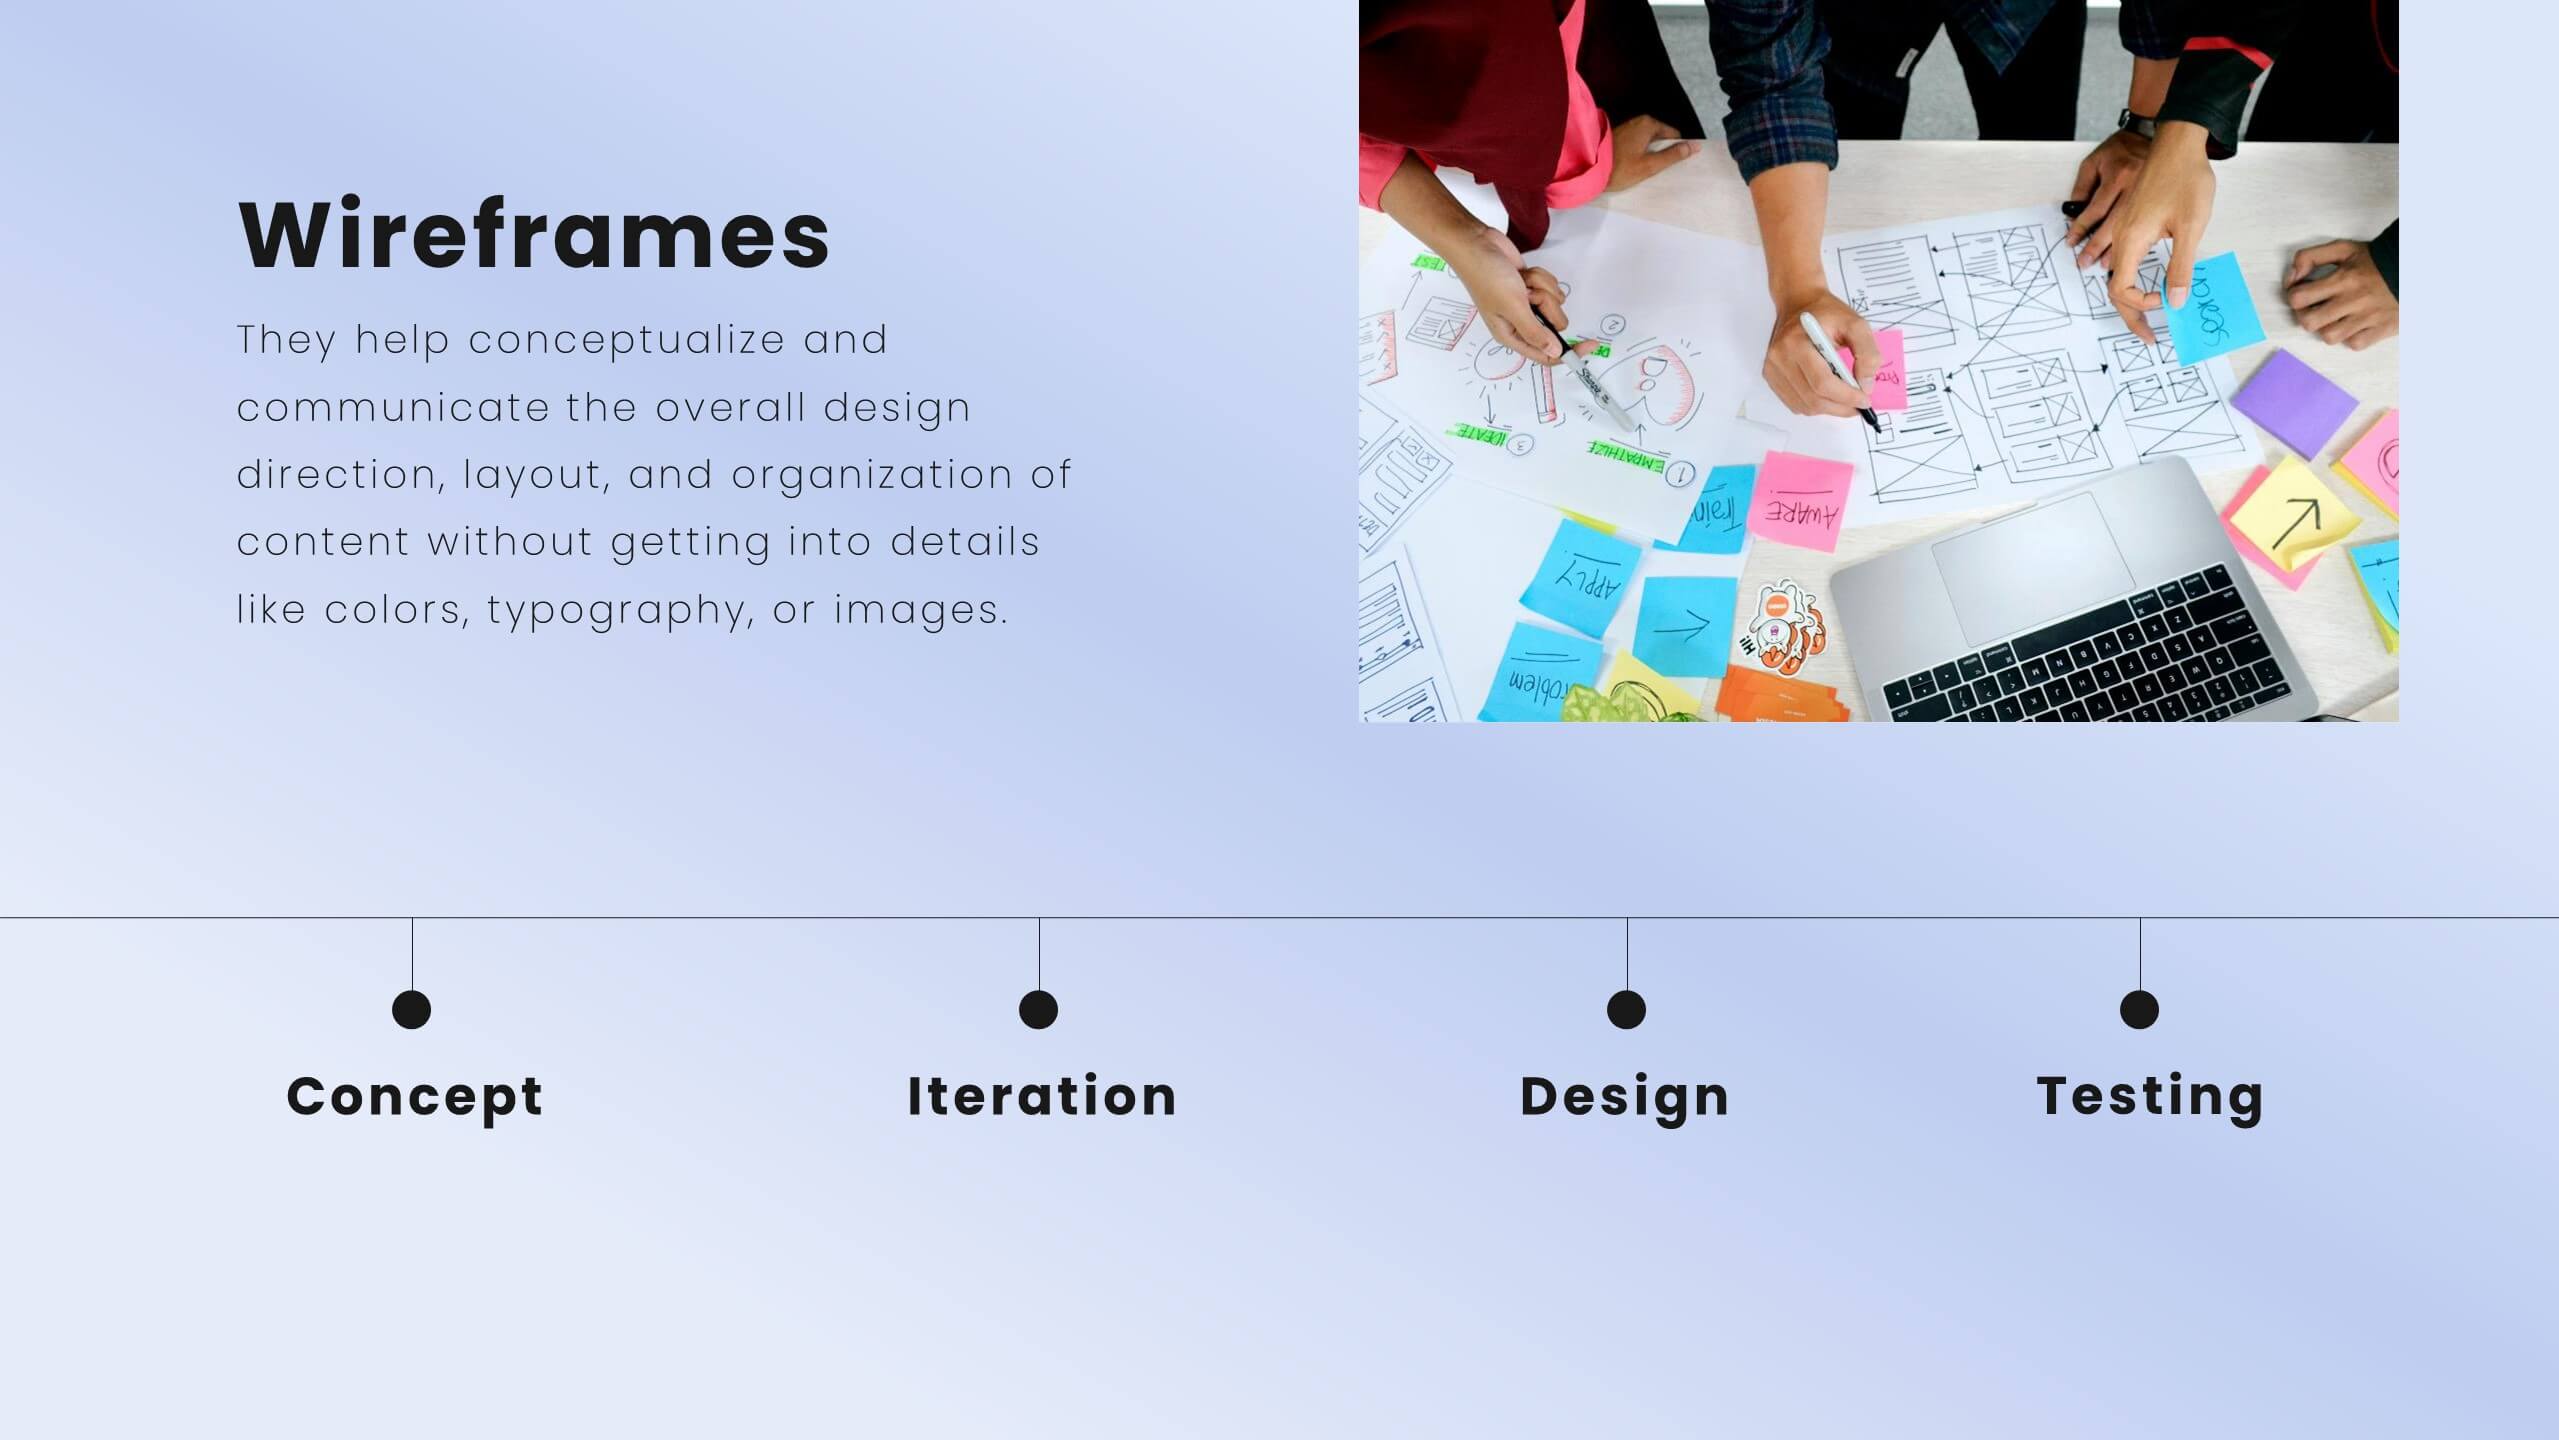
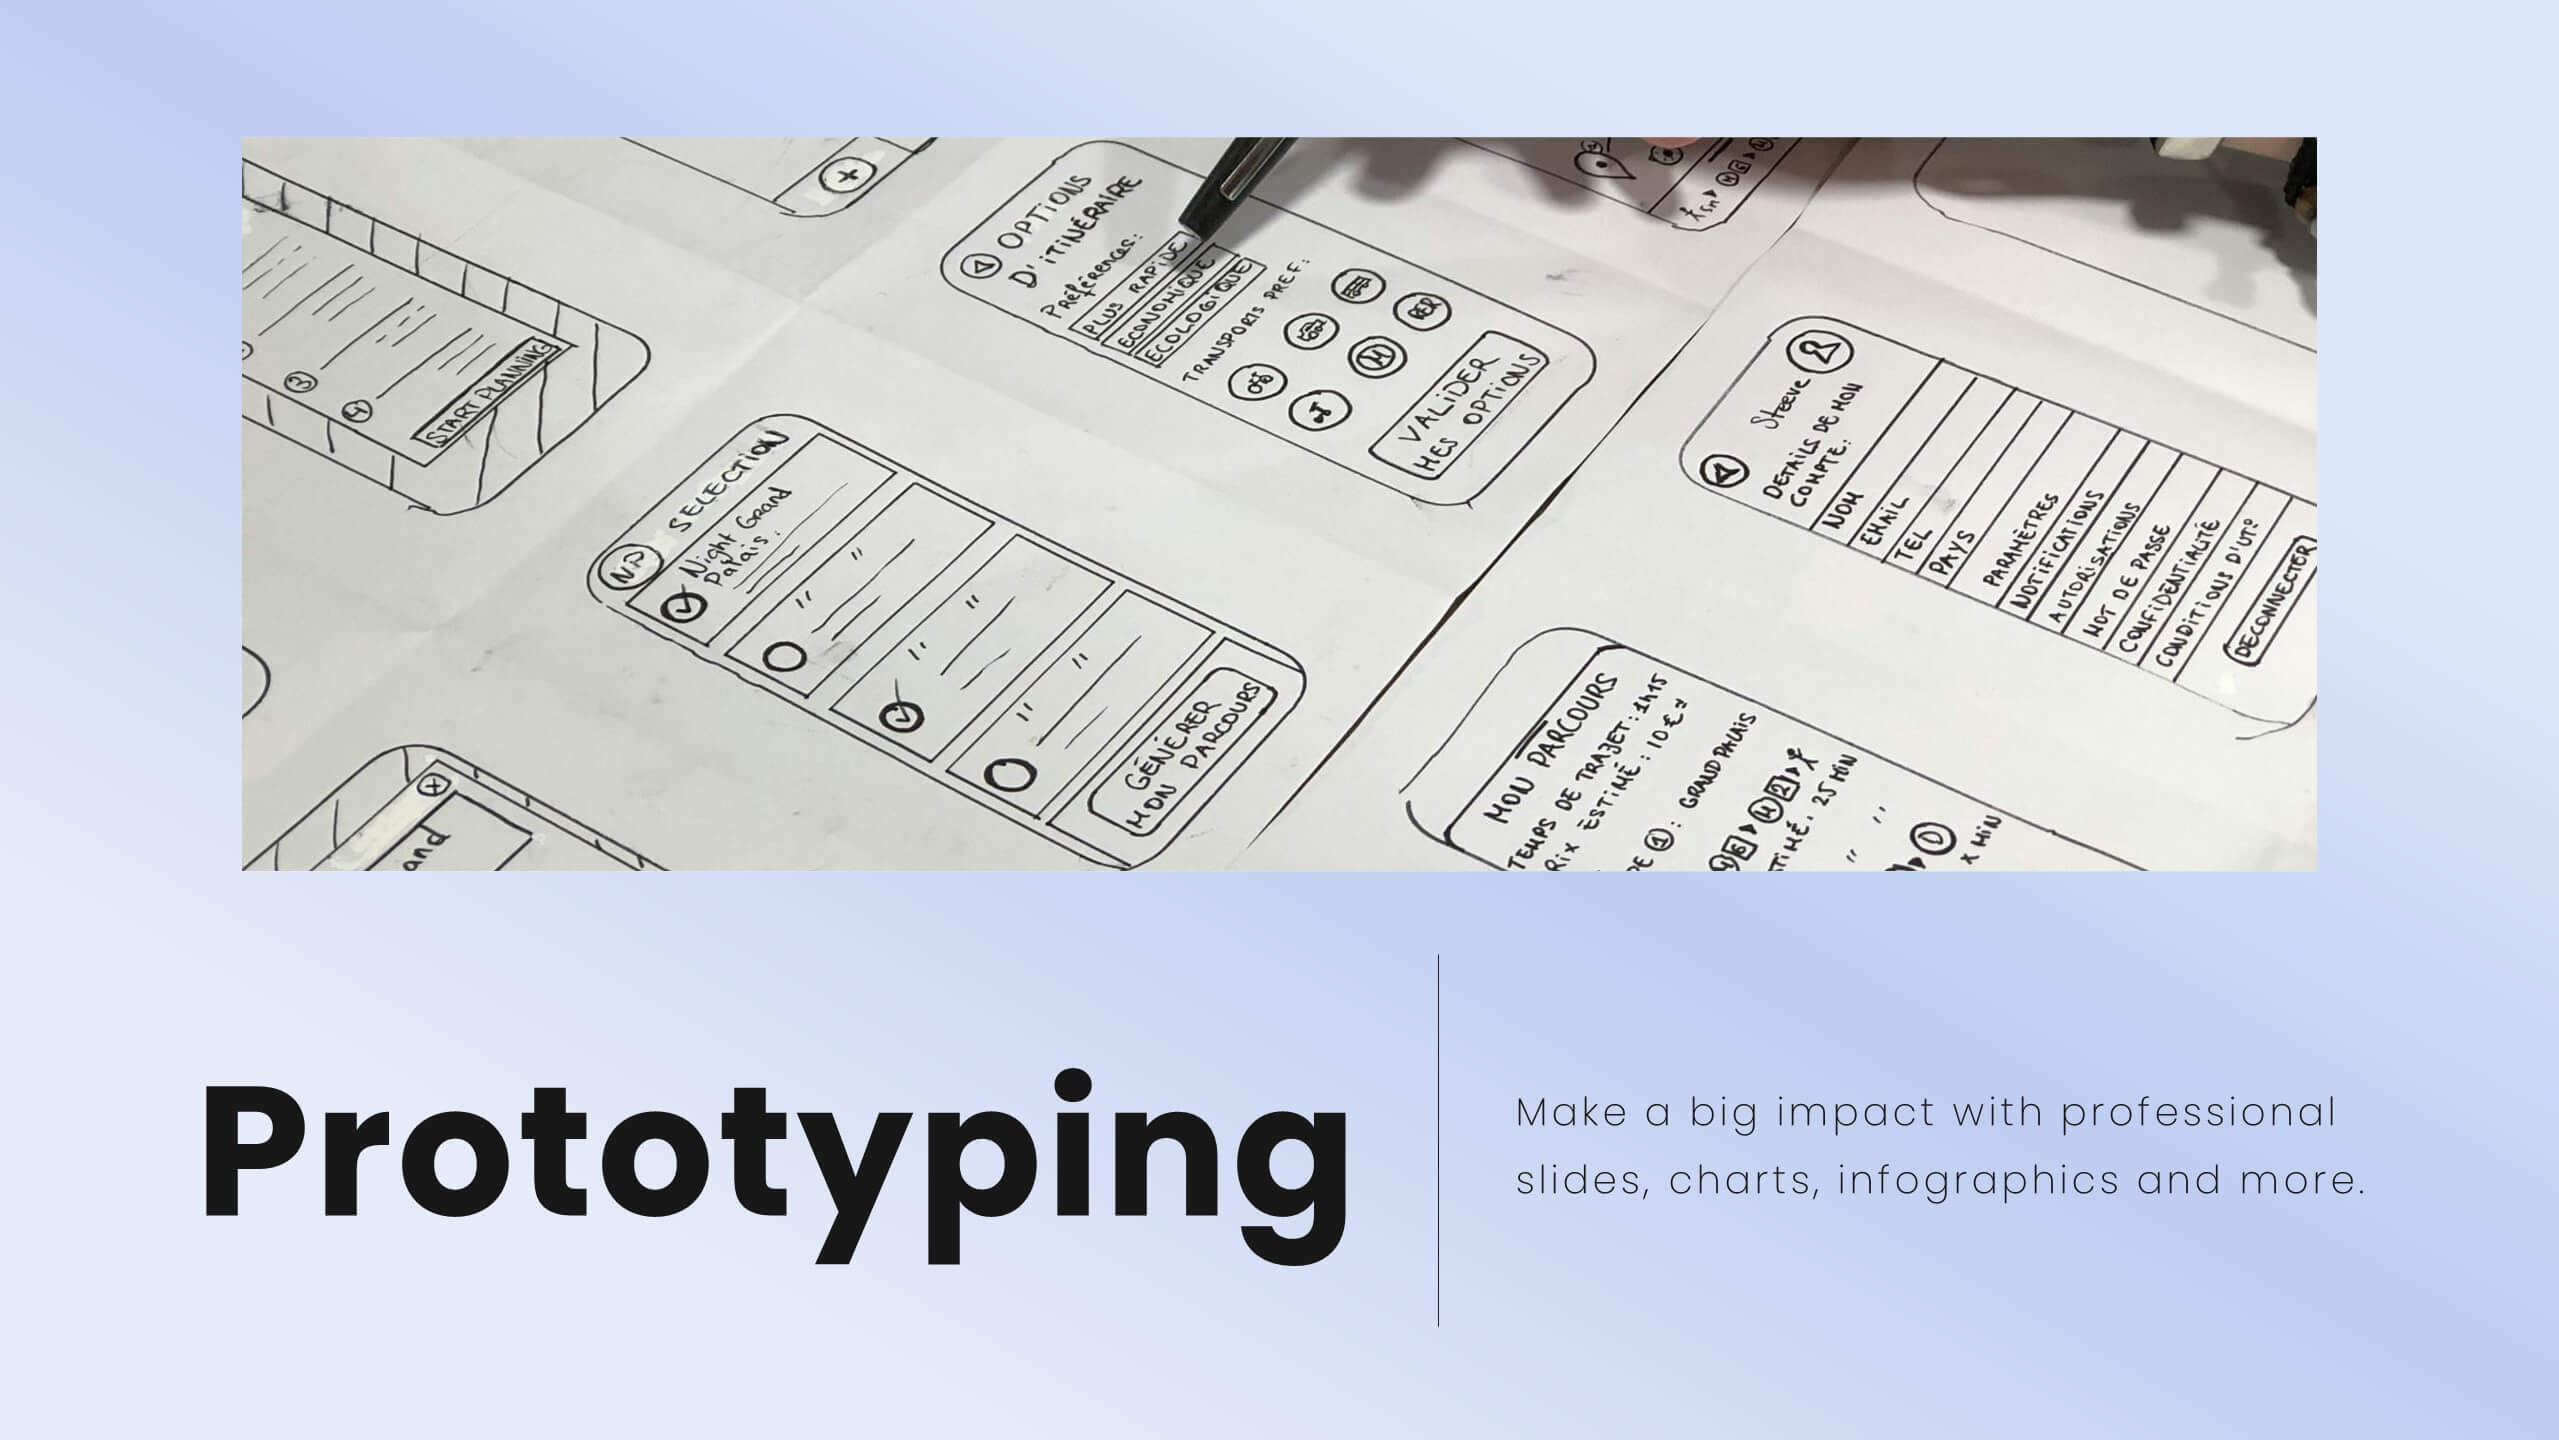
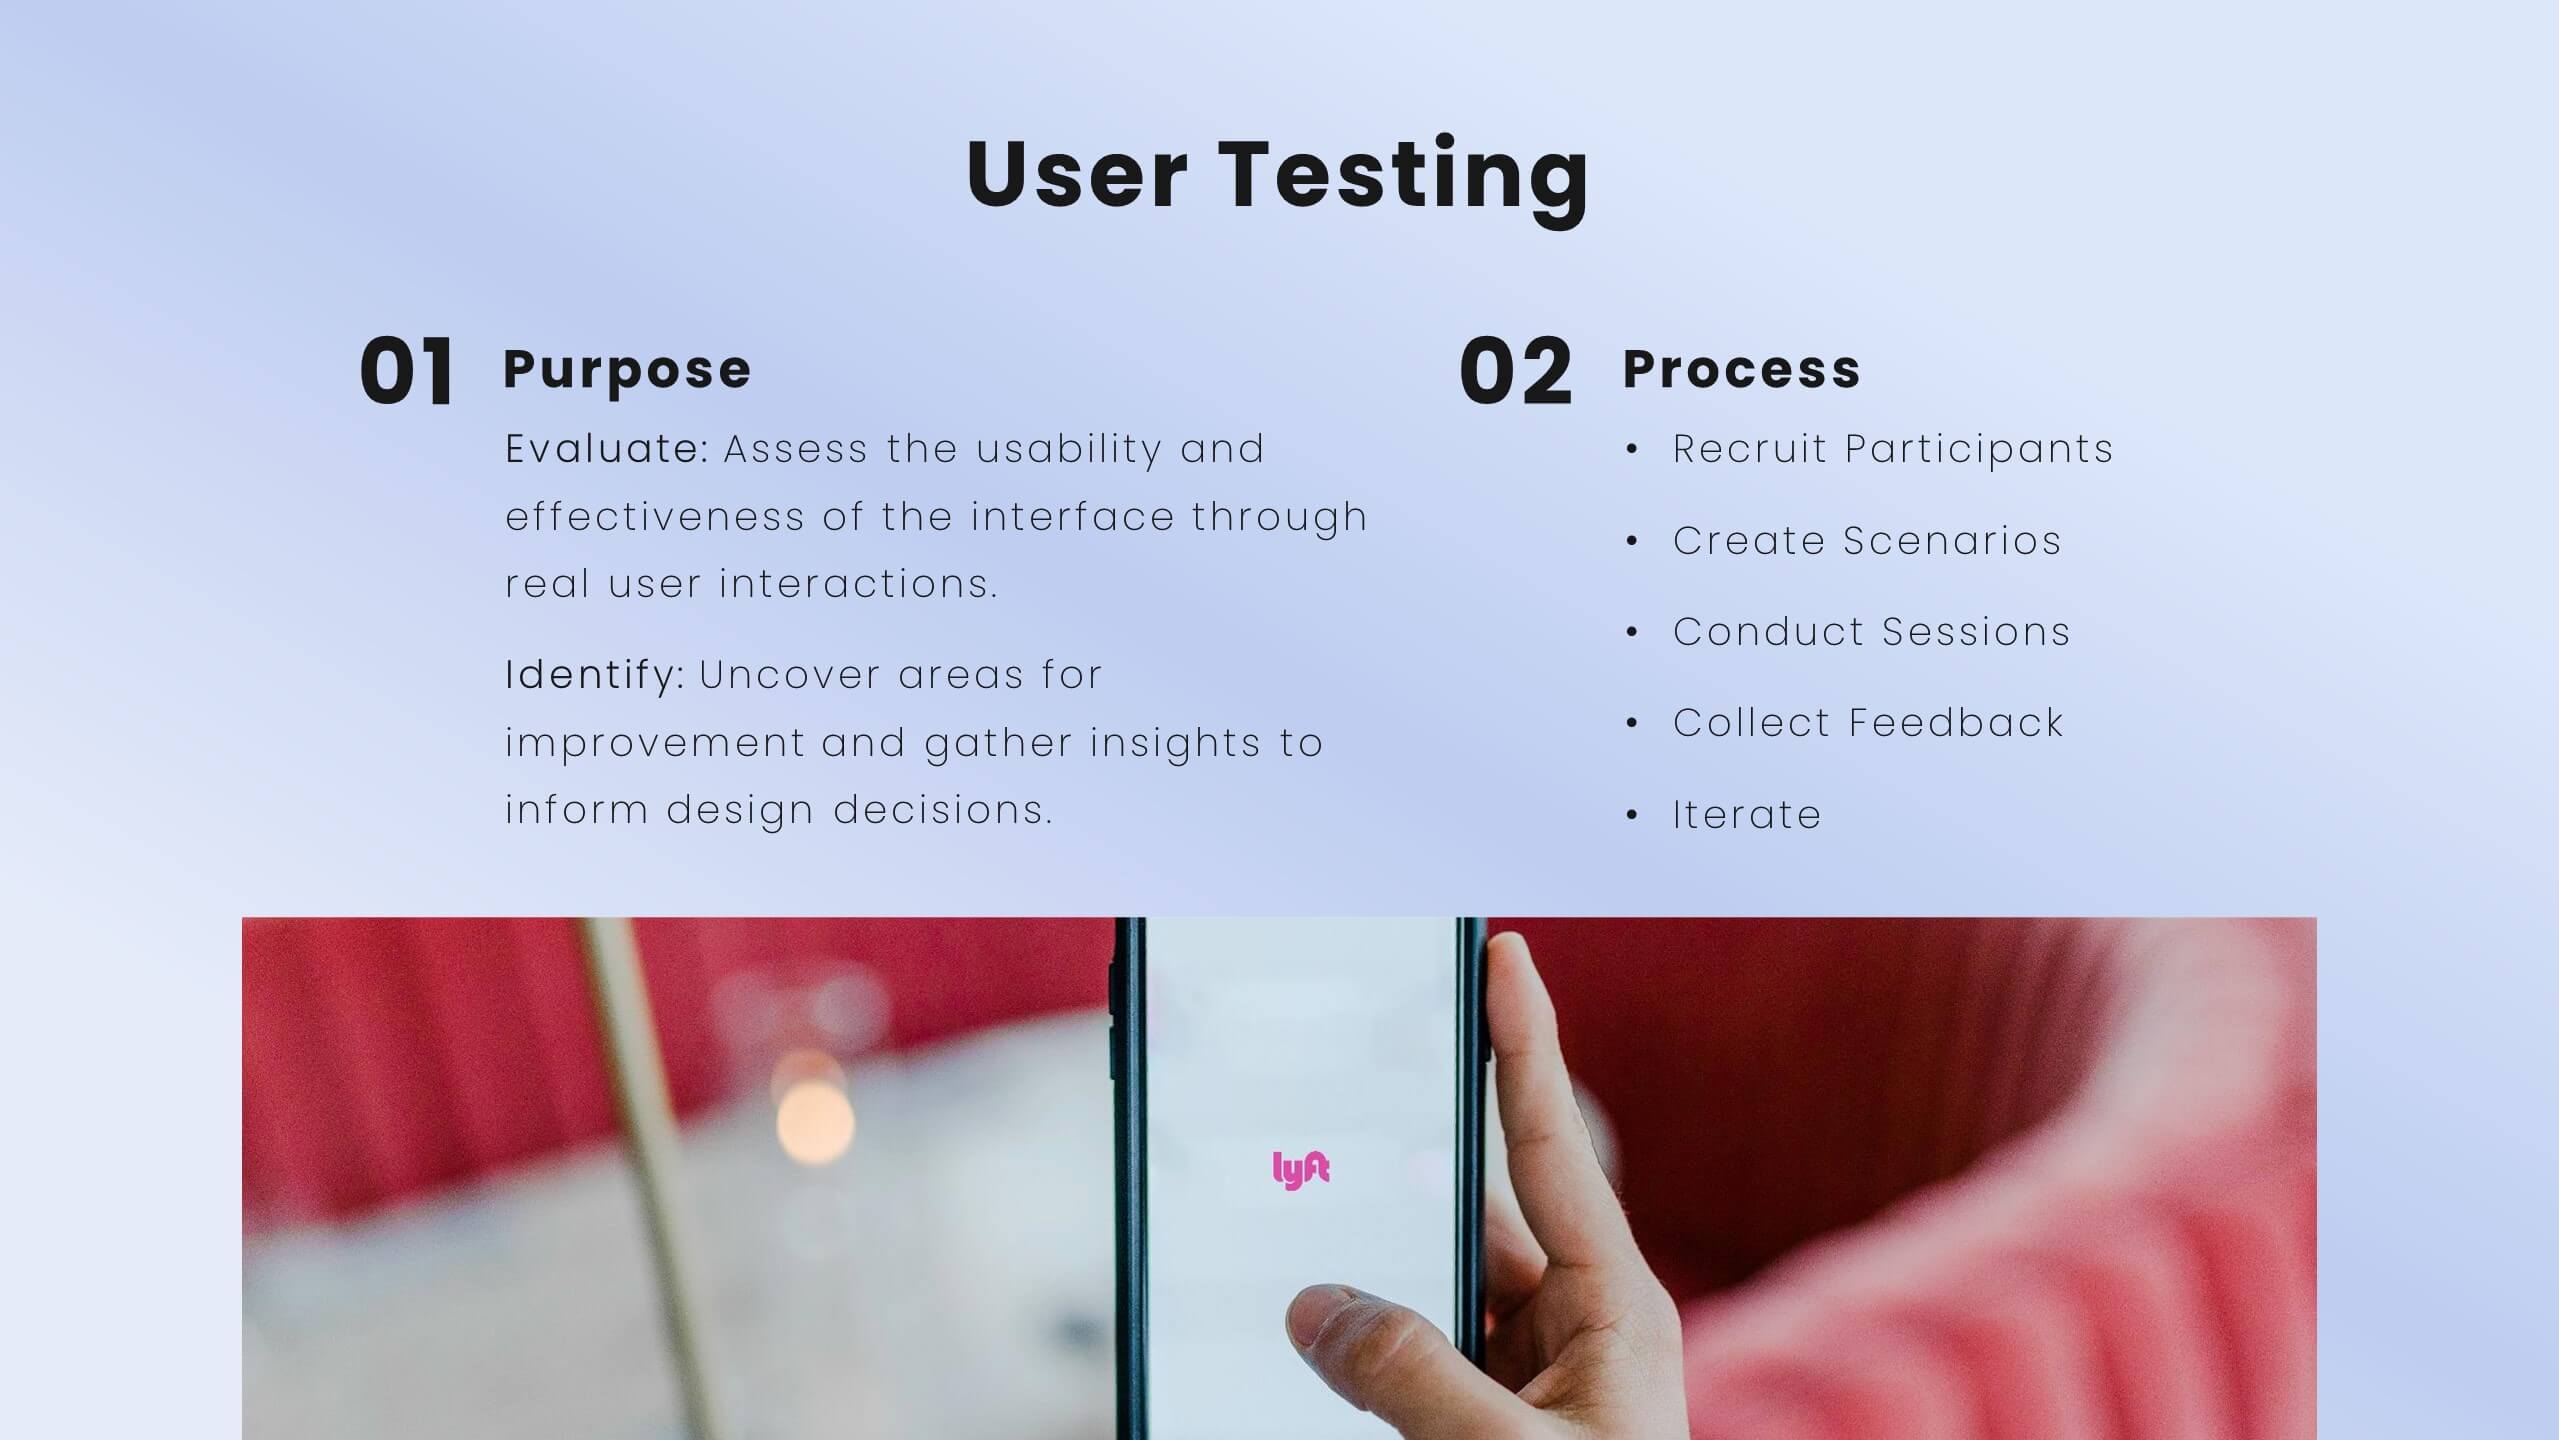
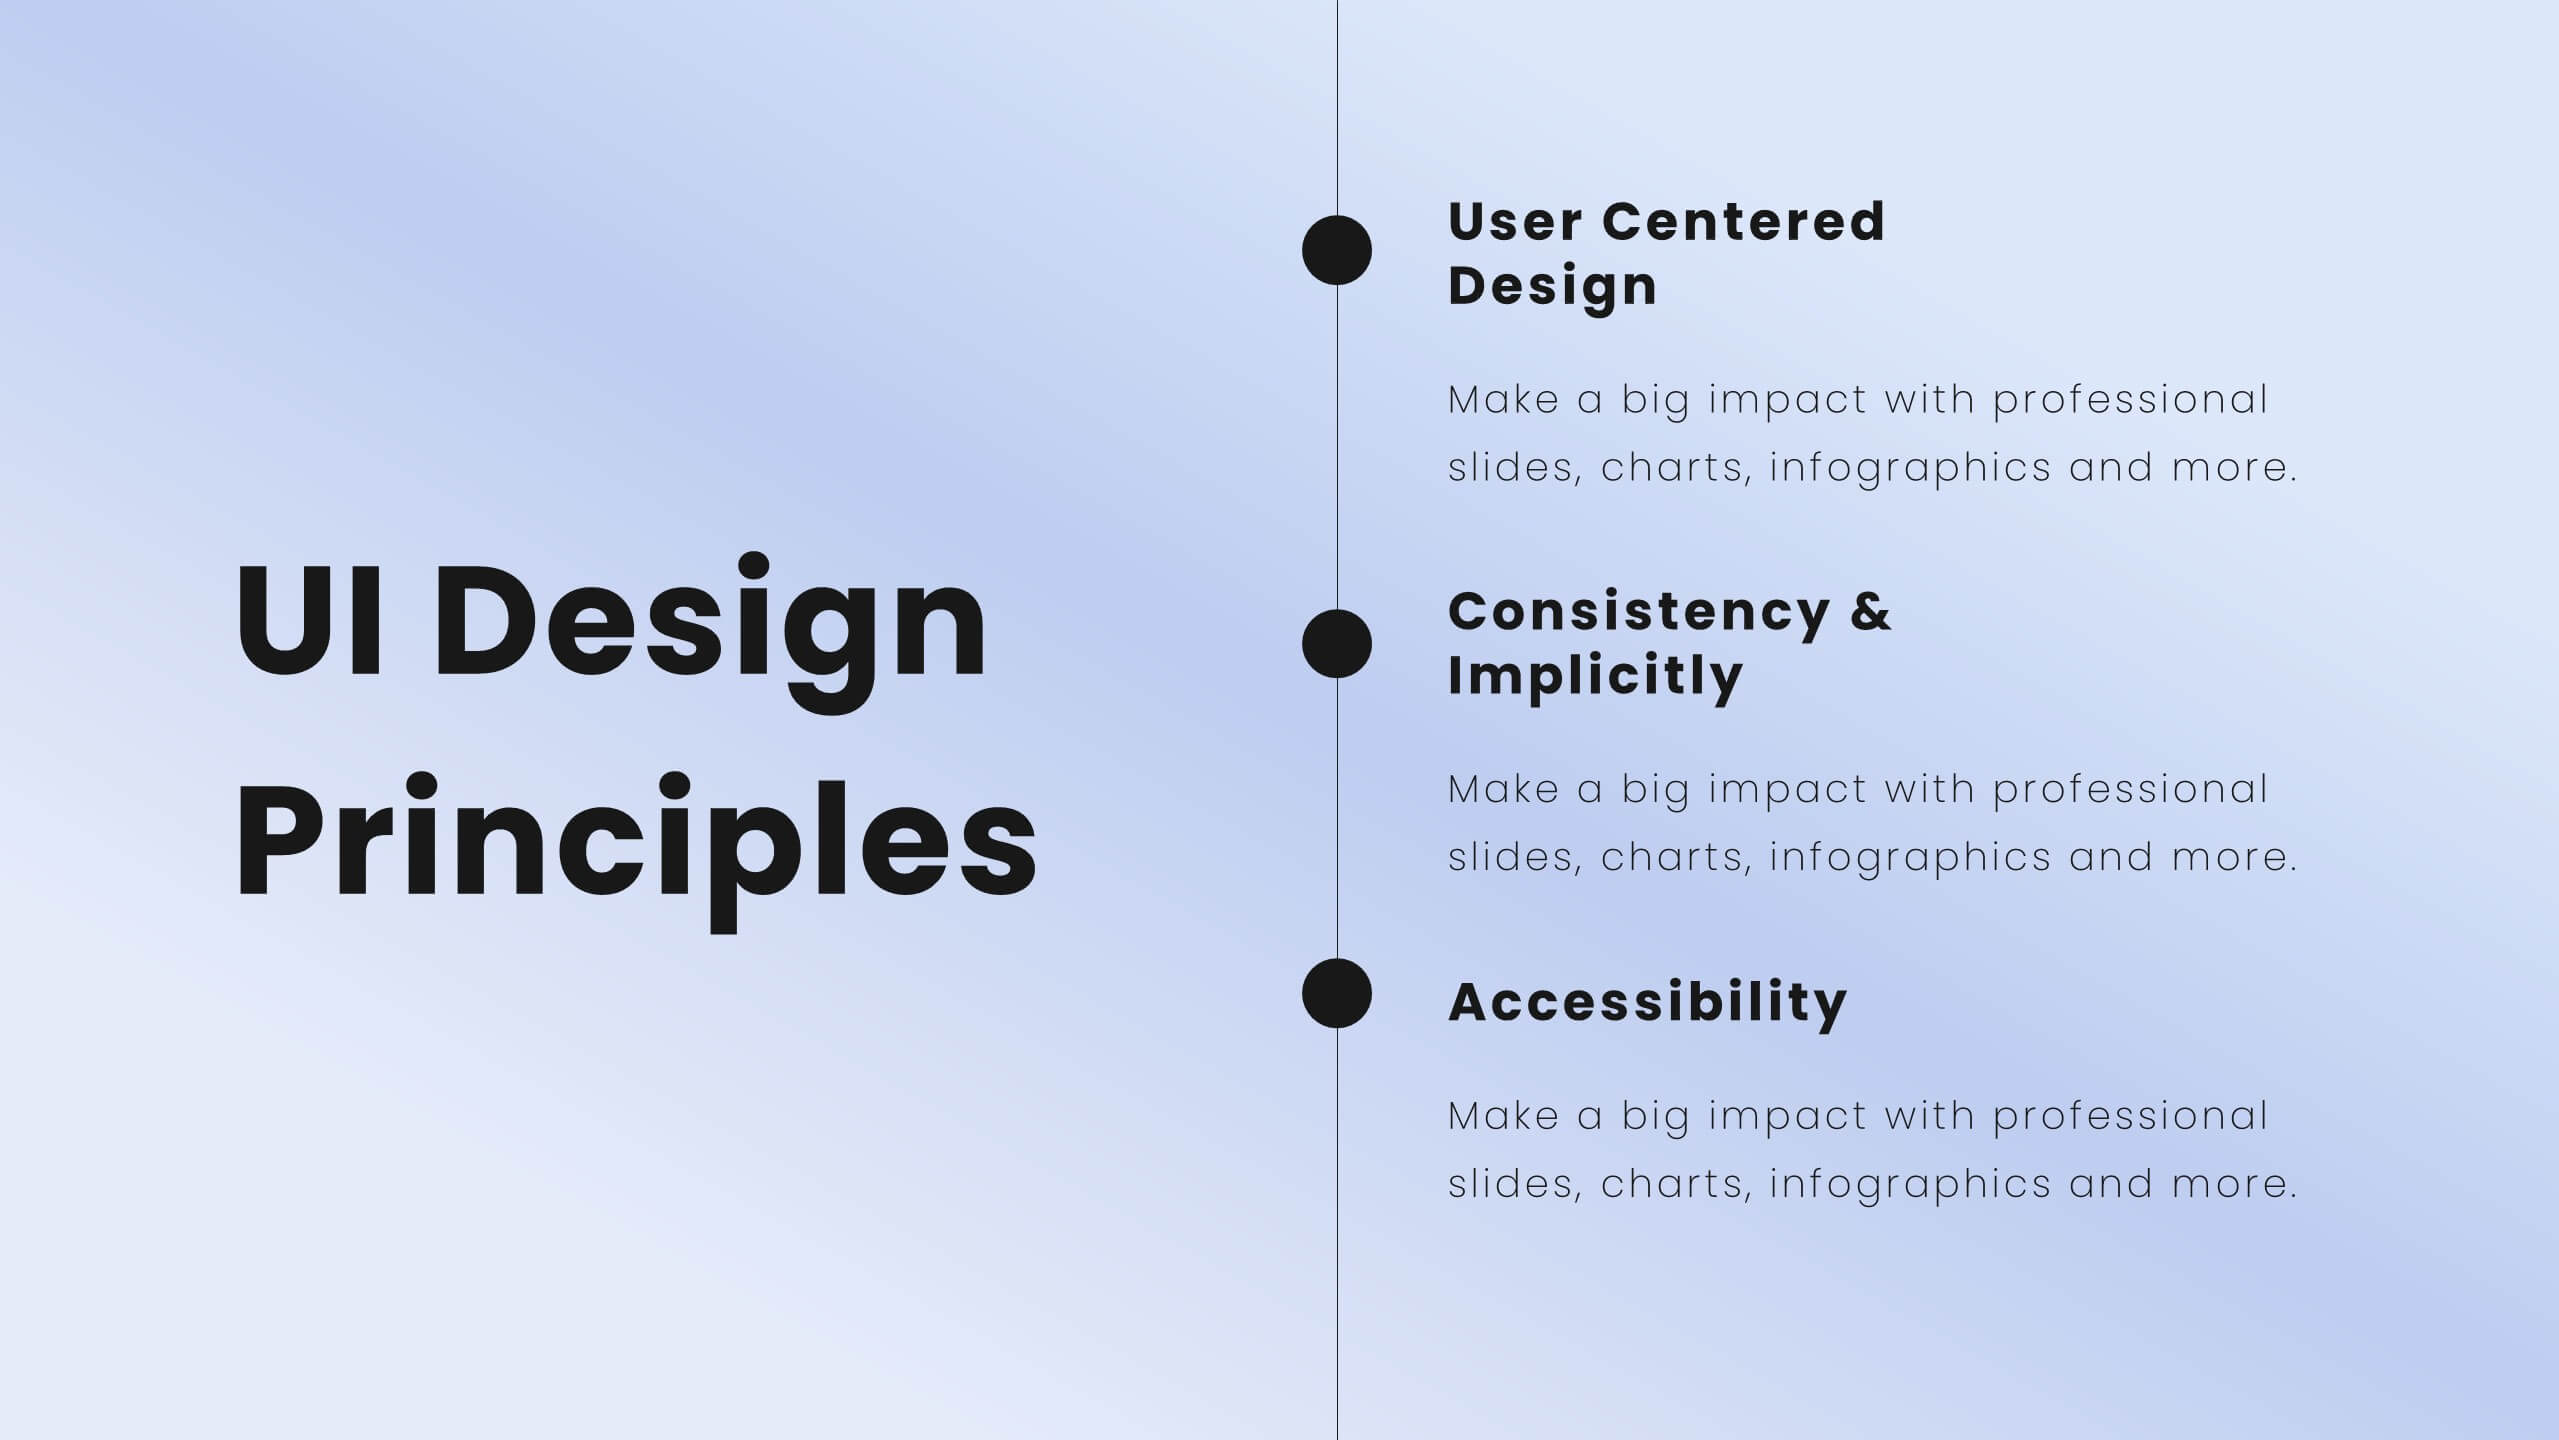
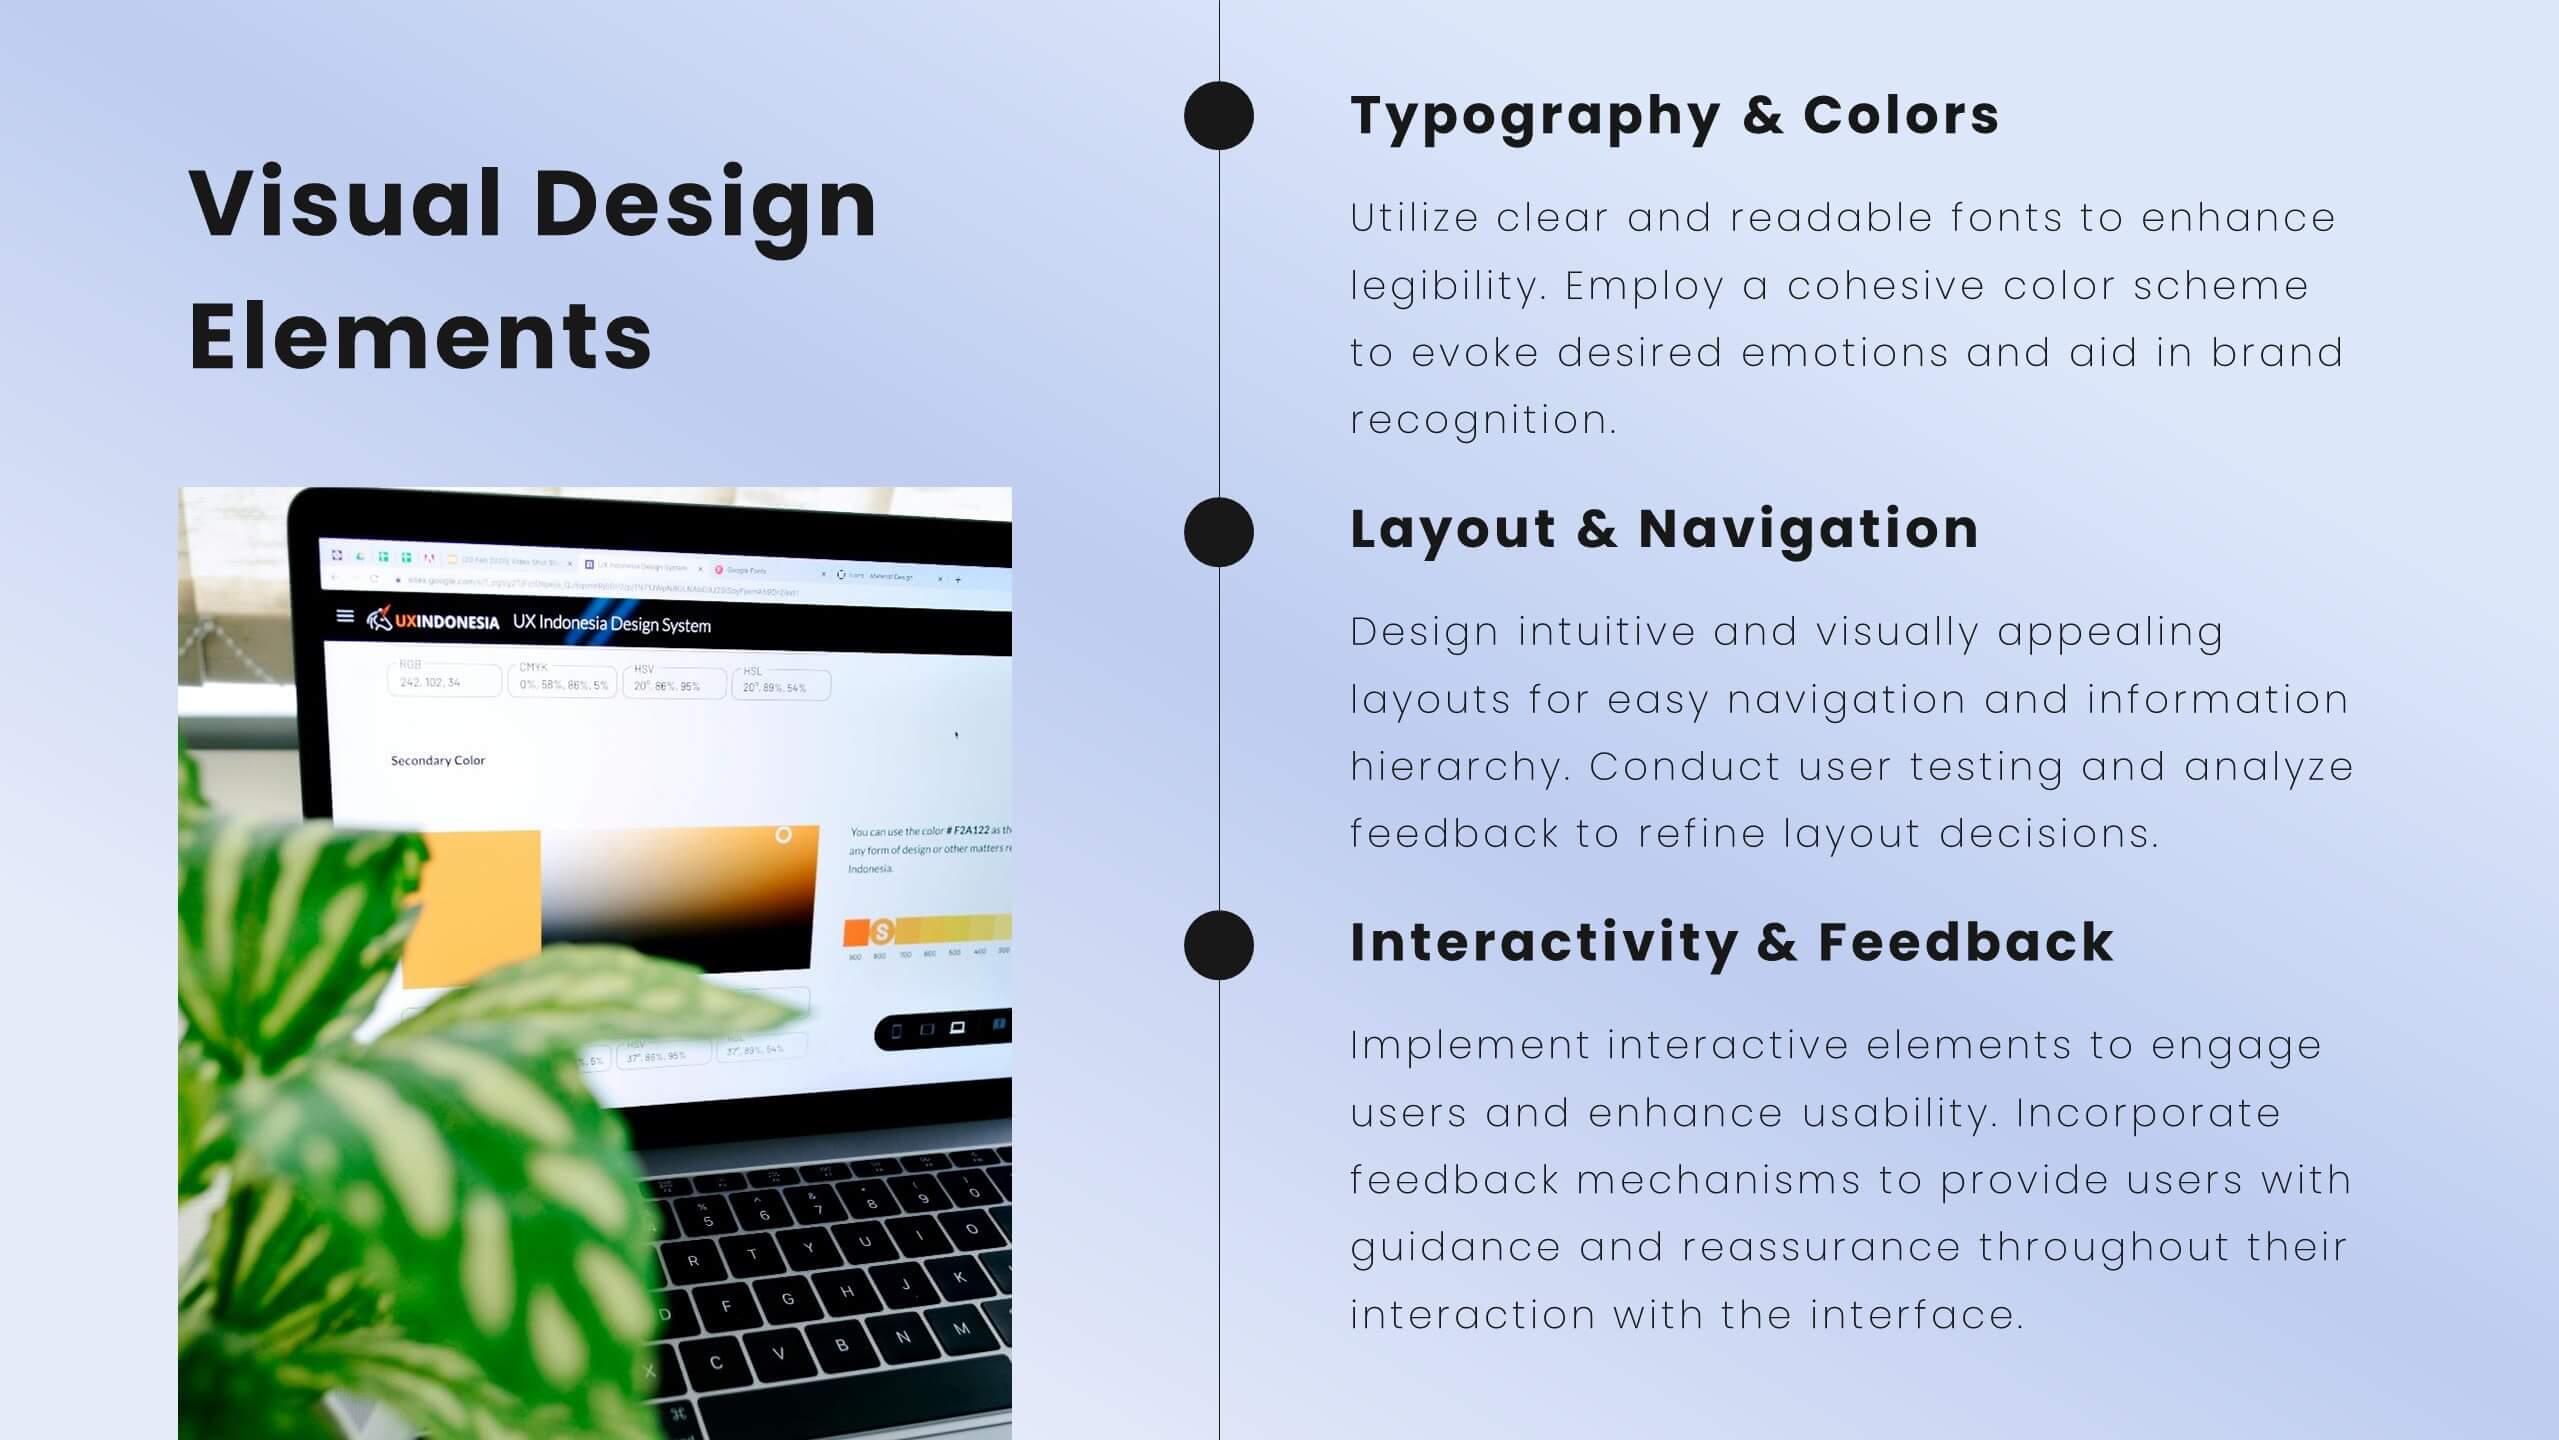
Jigsaw User Experience Proposal Presentation
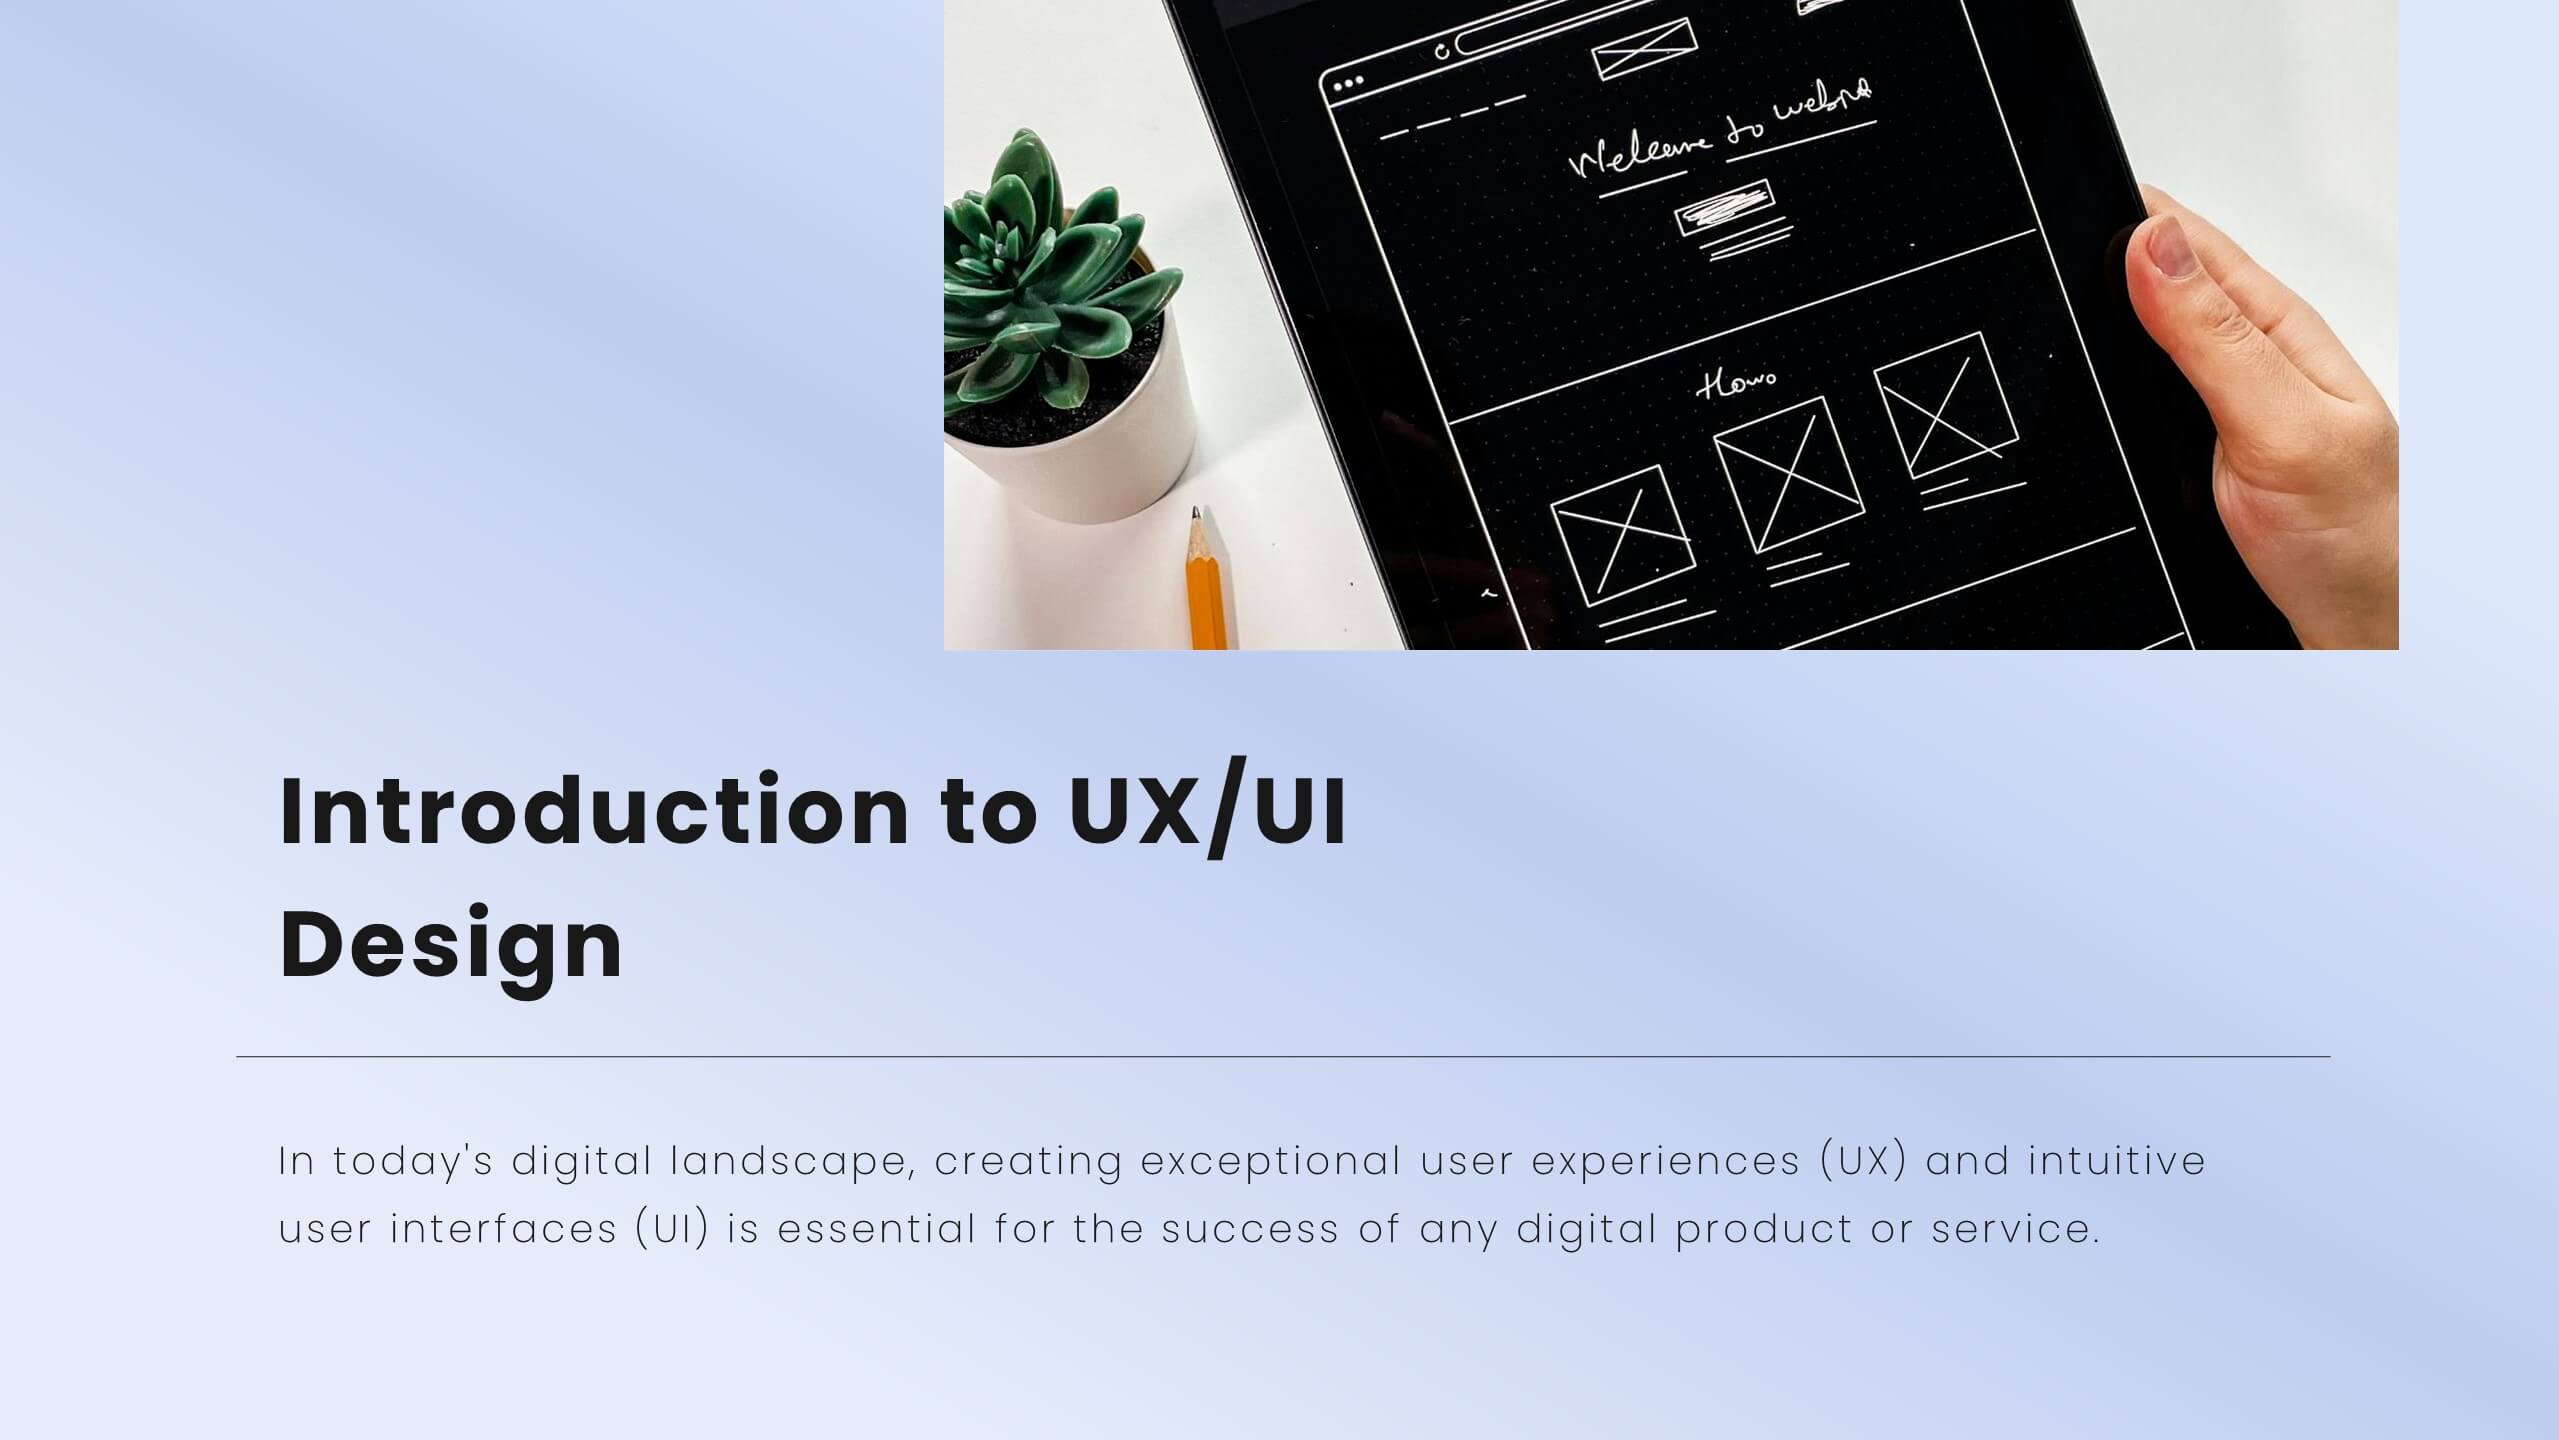
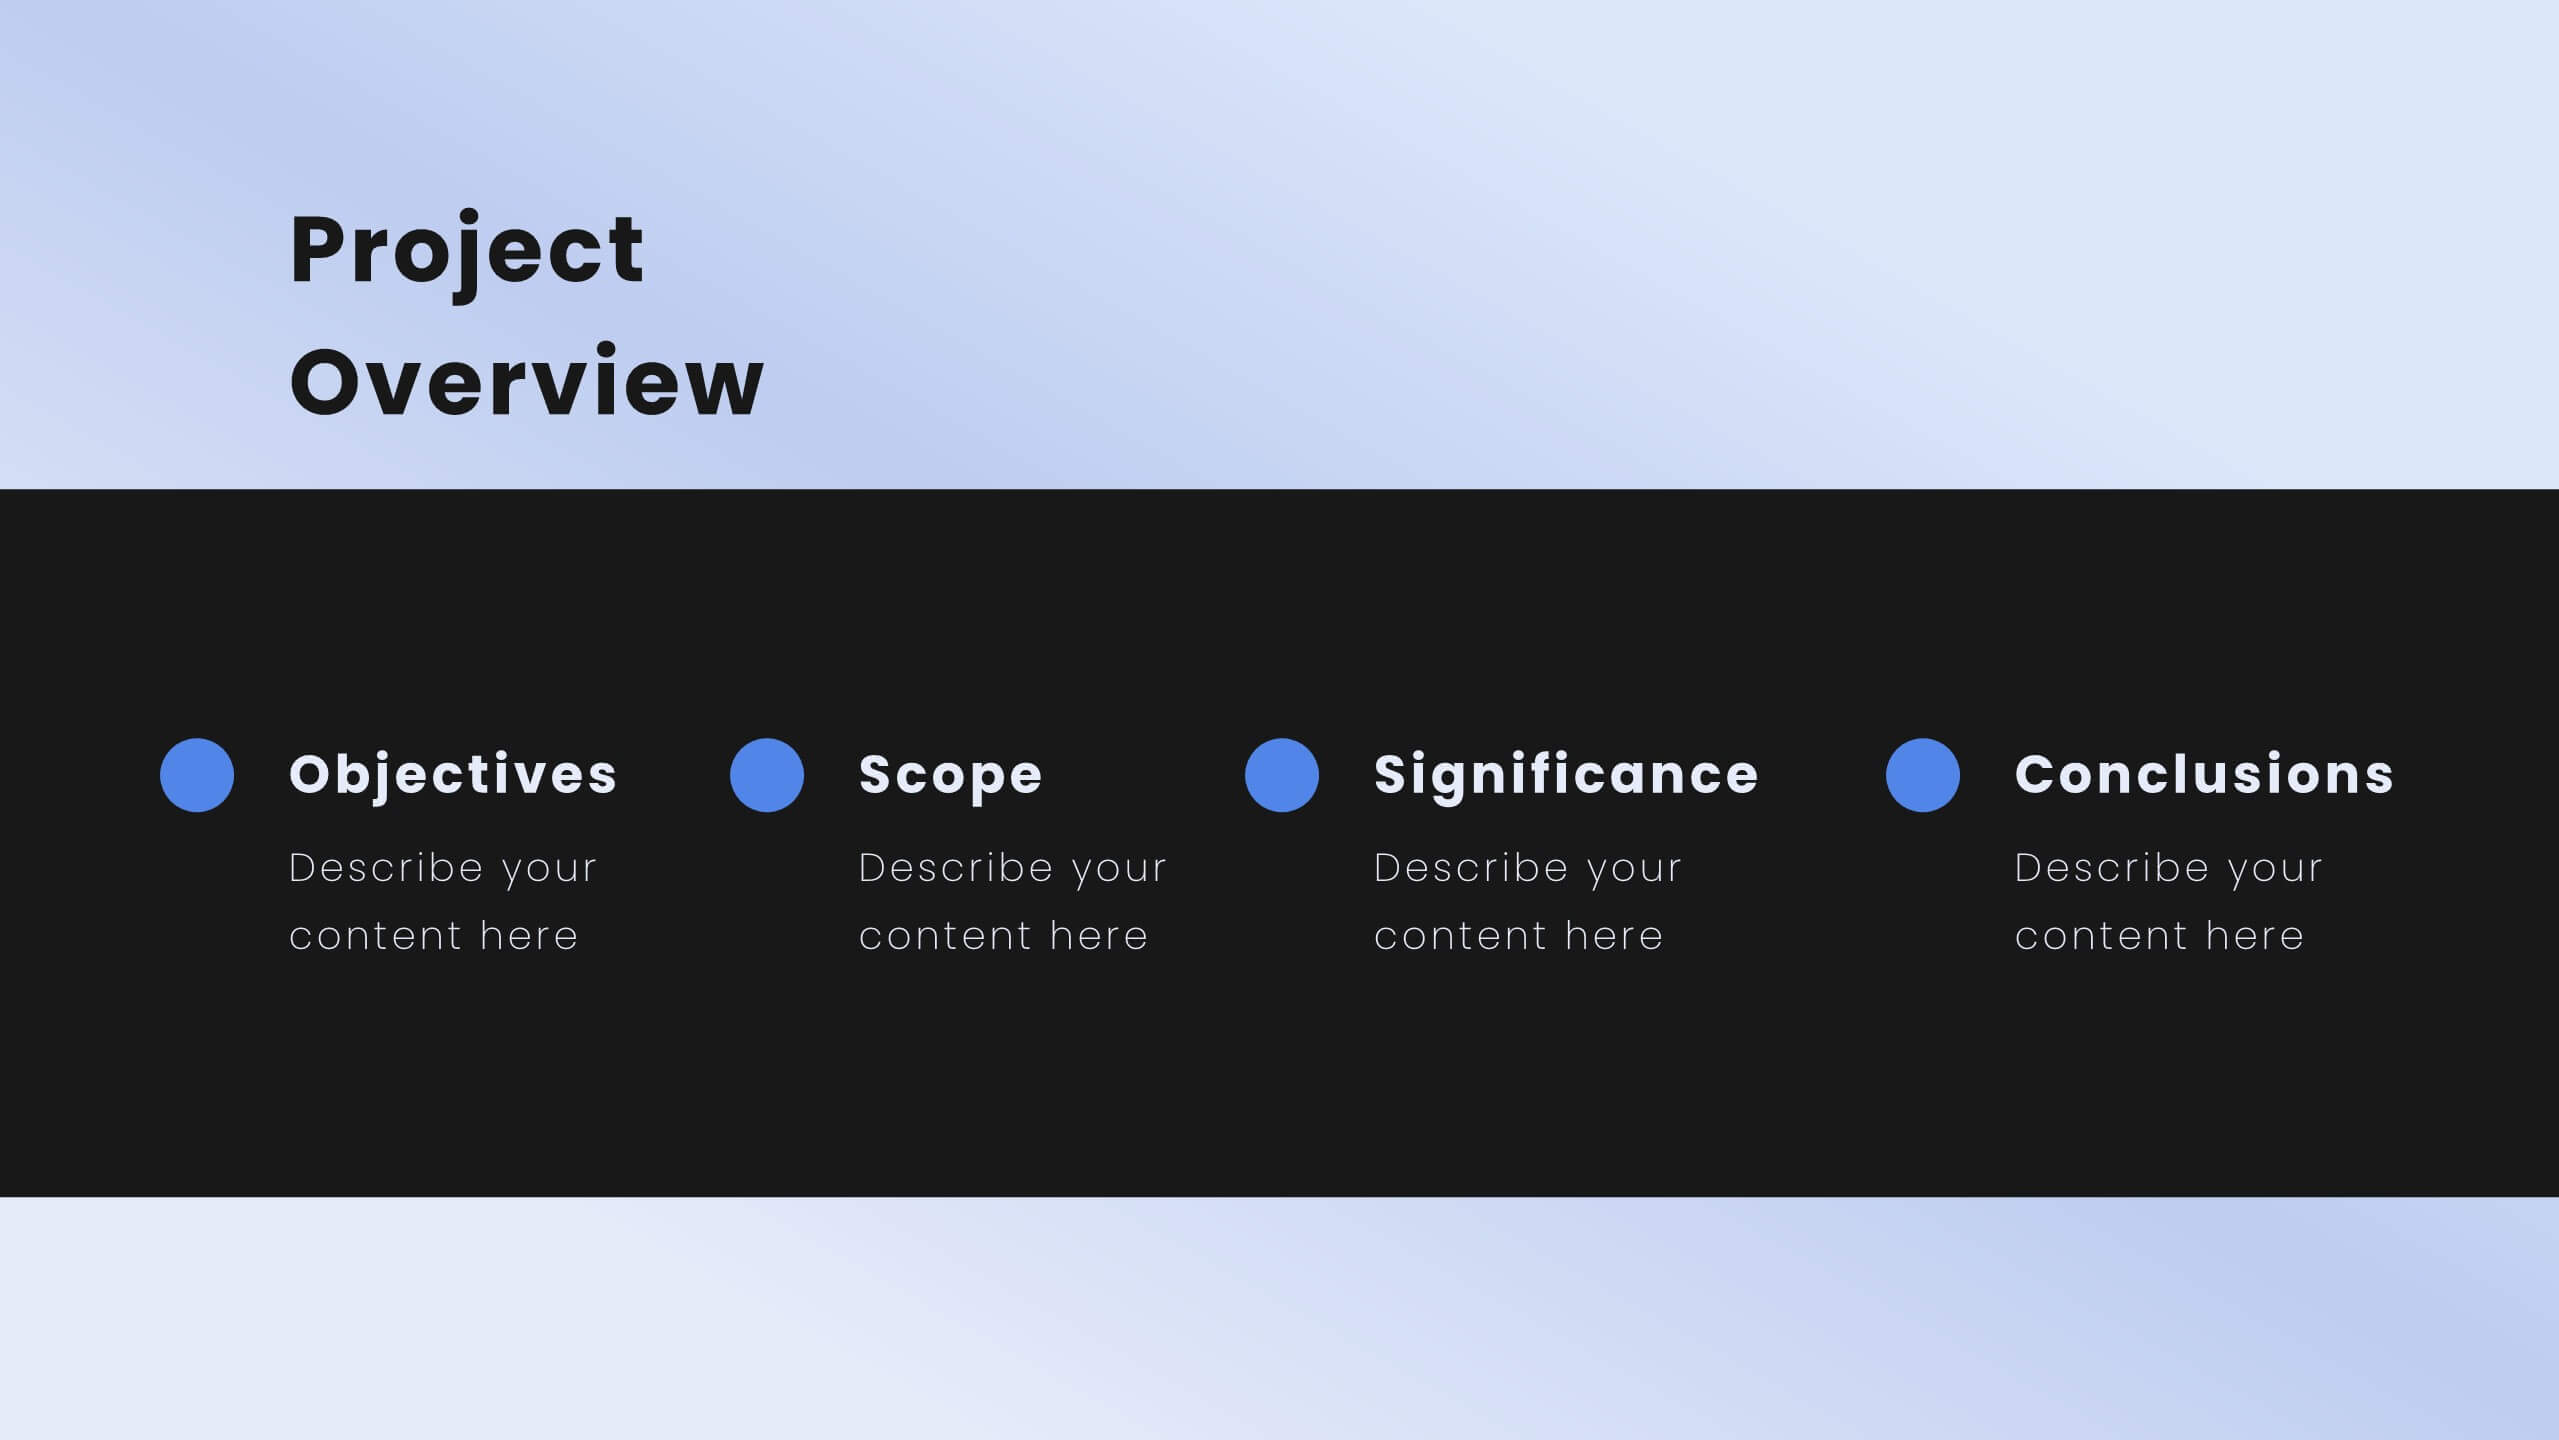
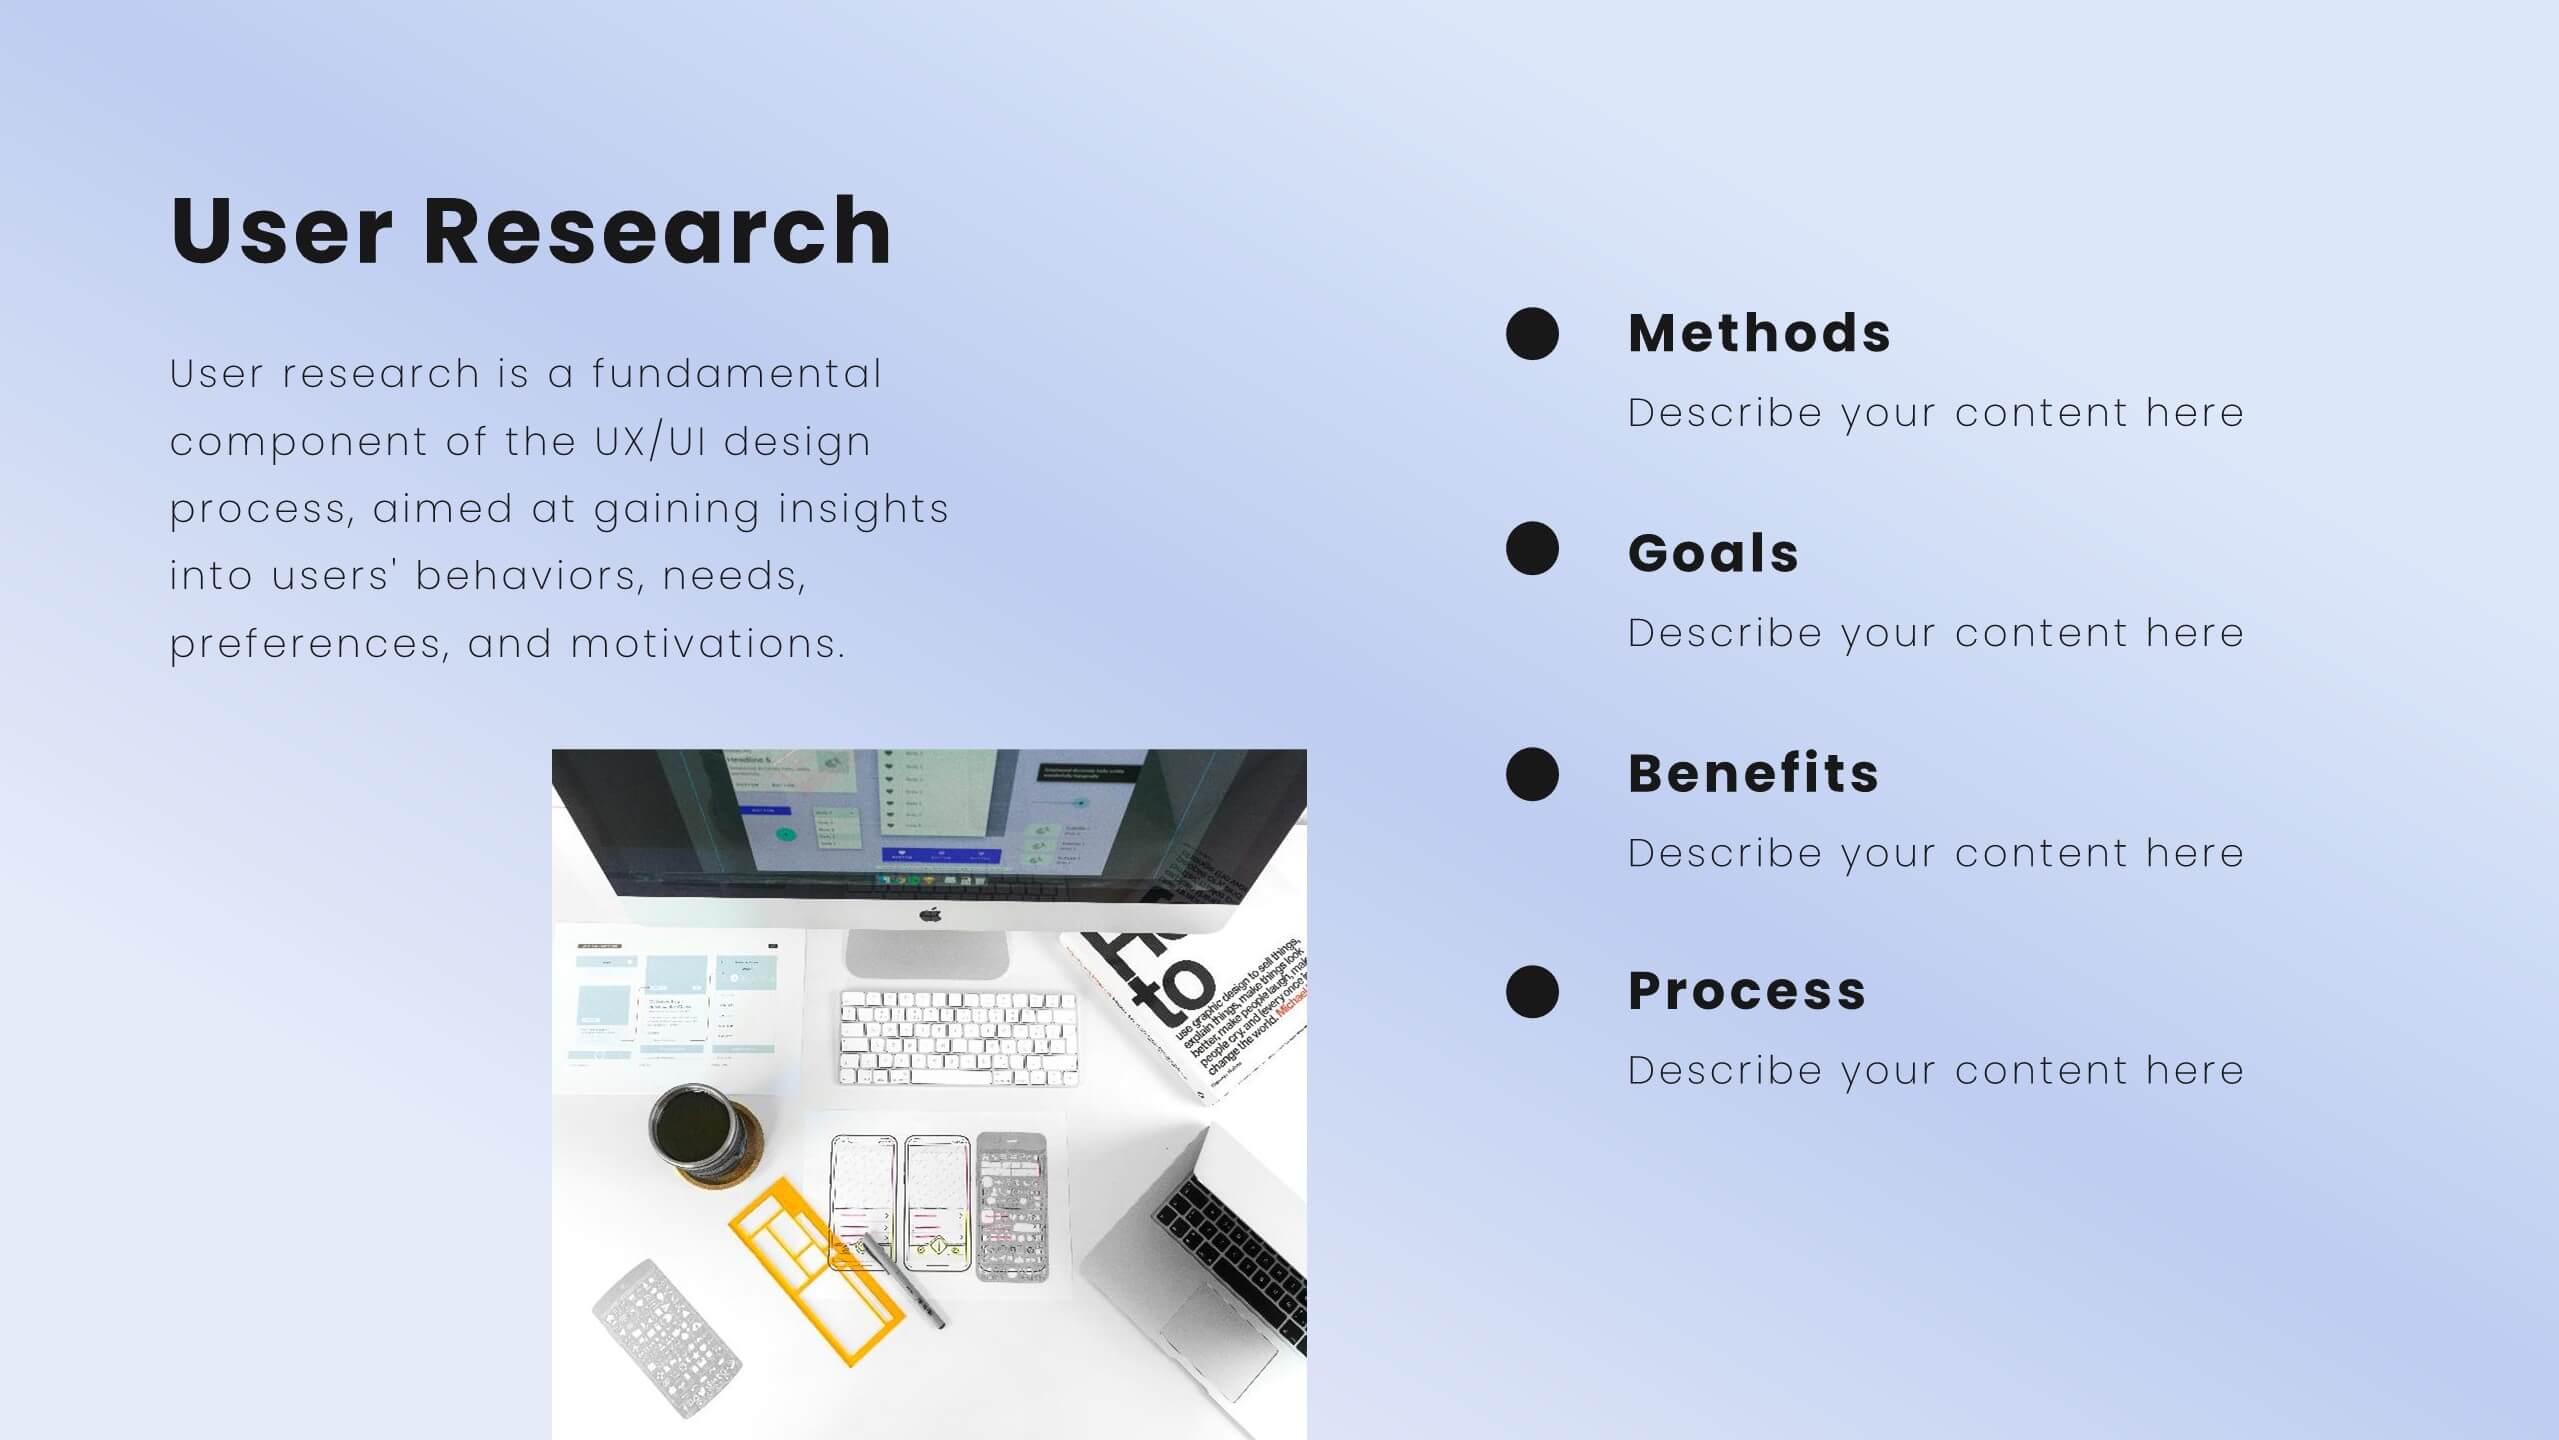
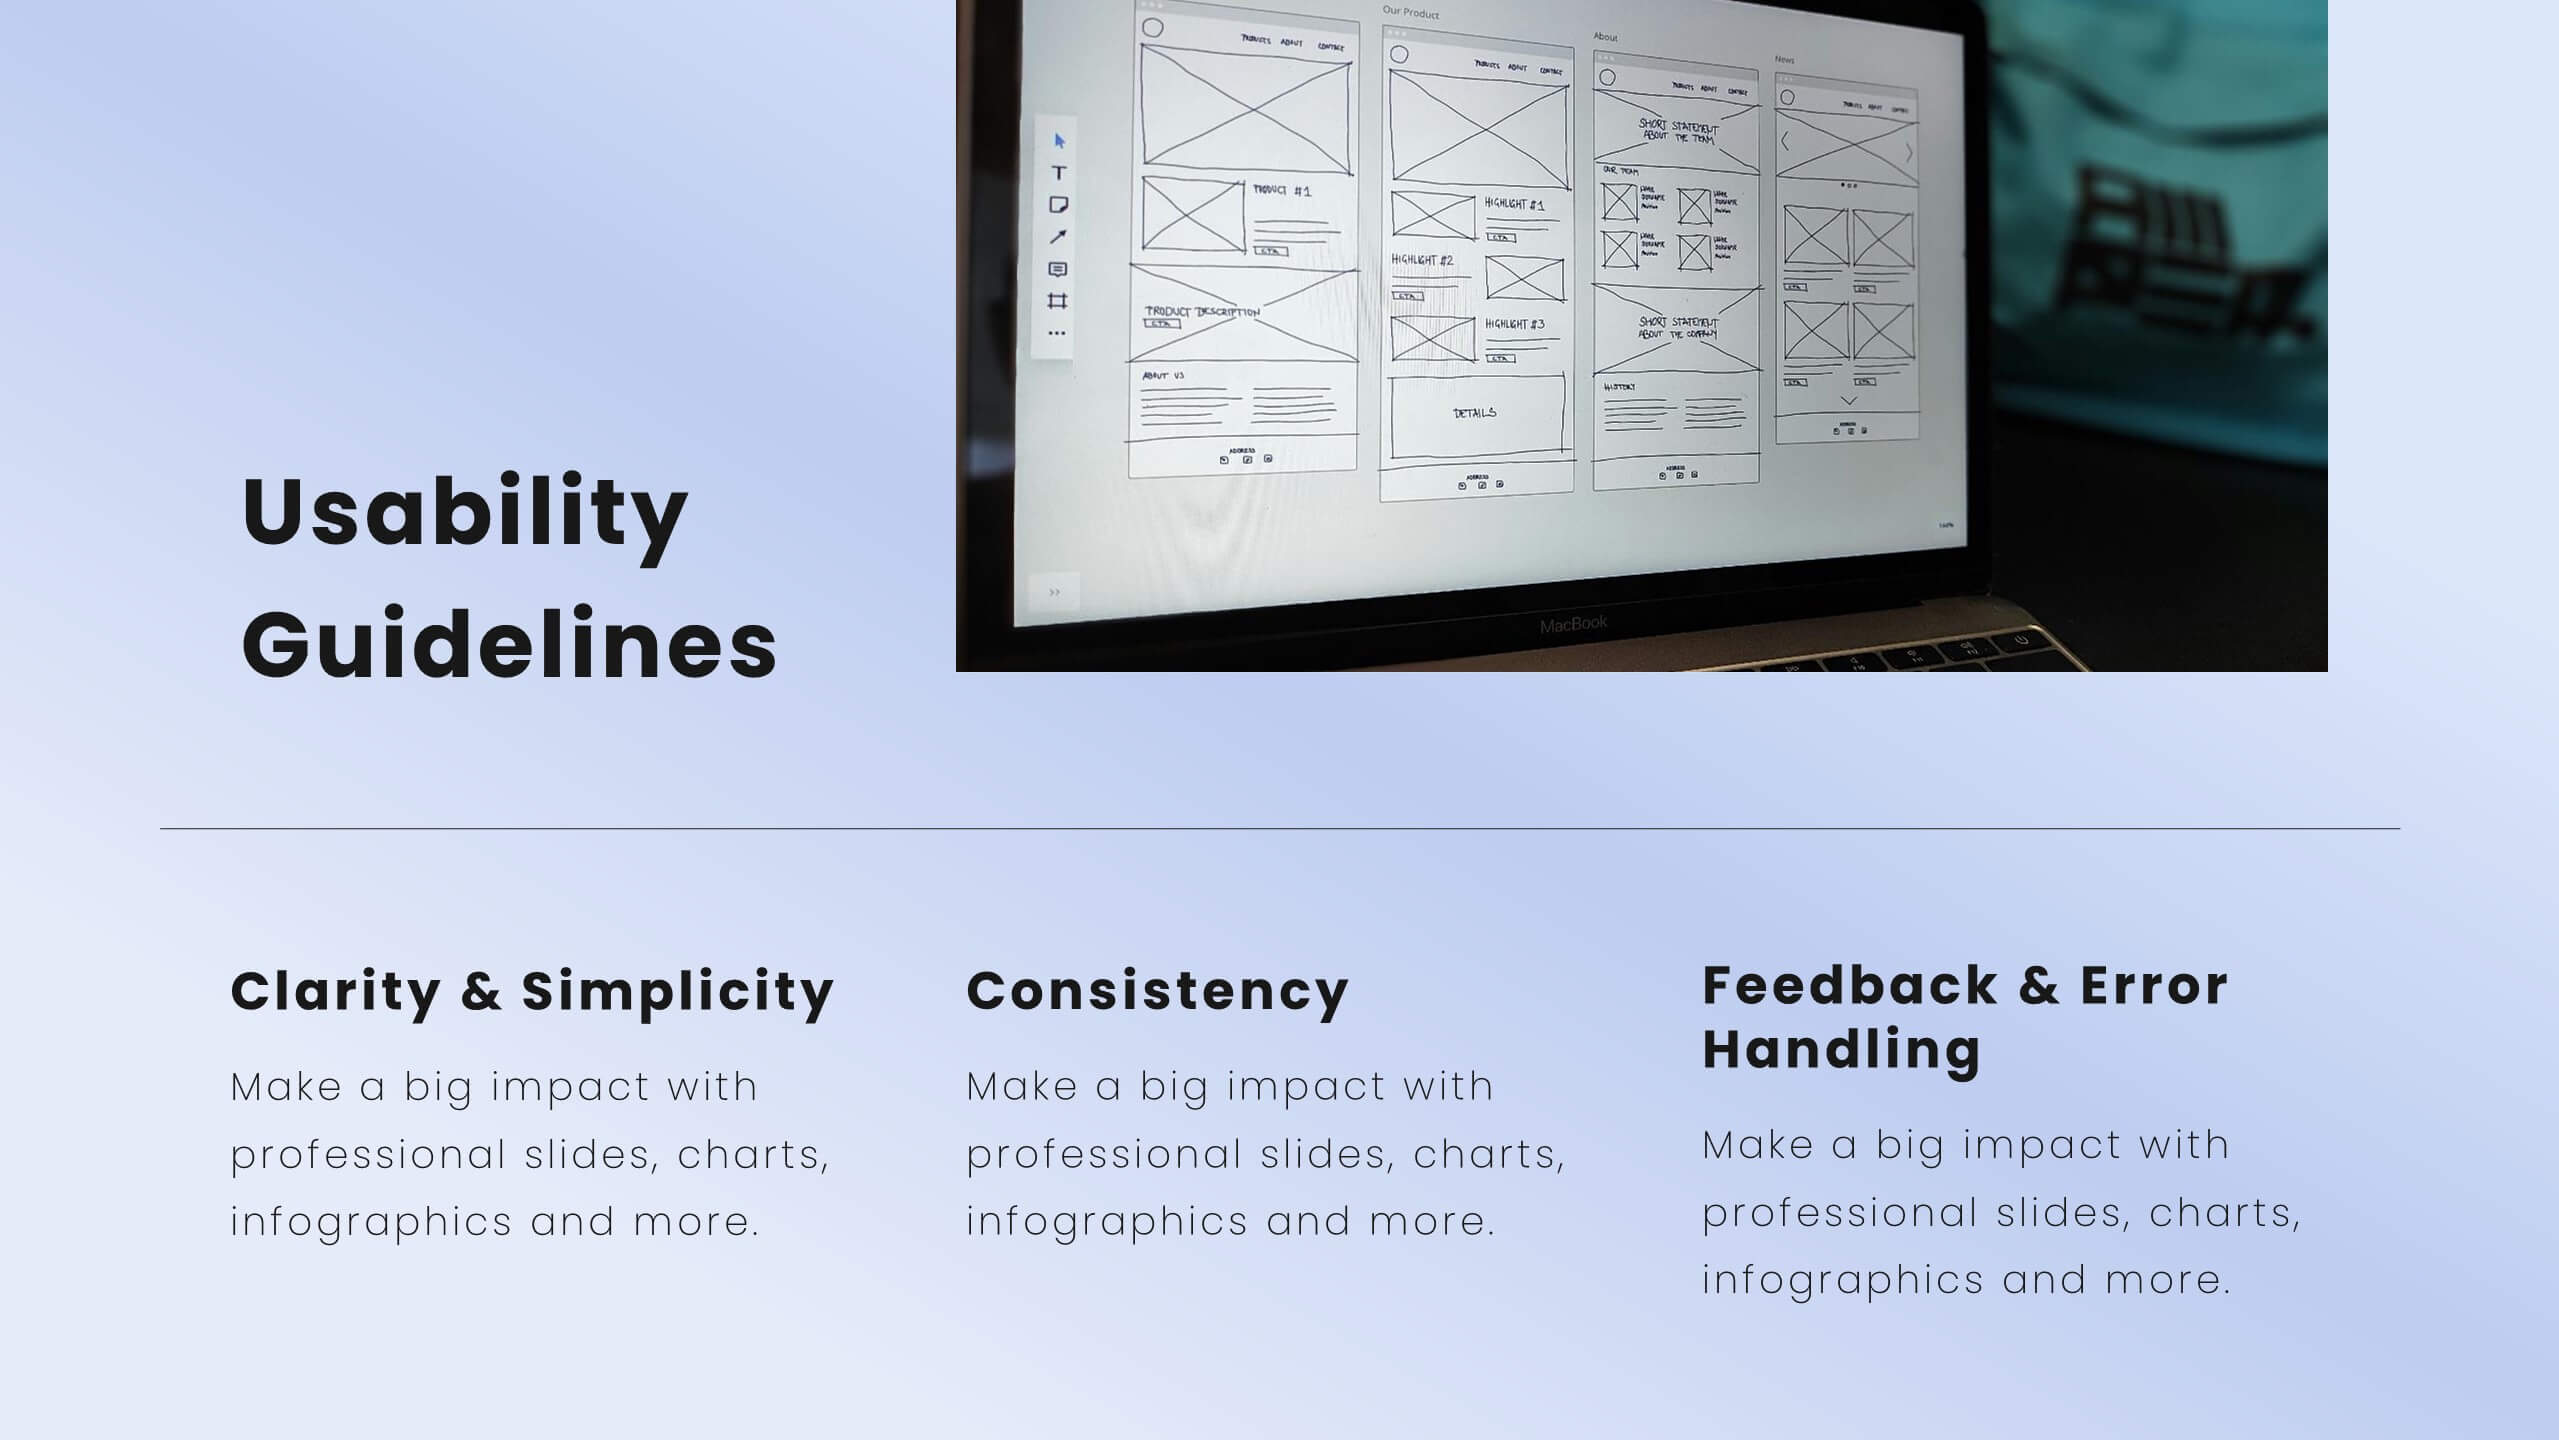
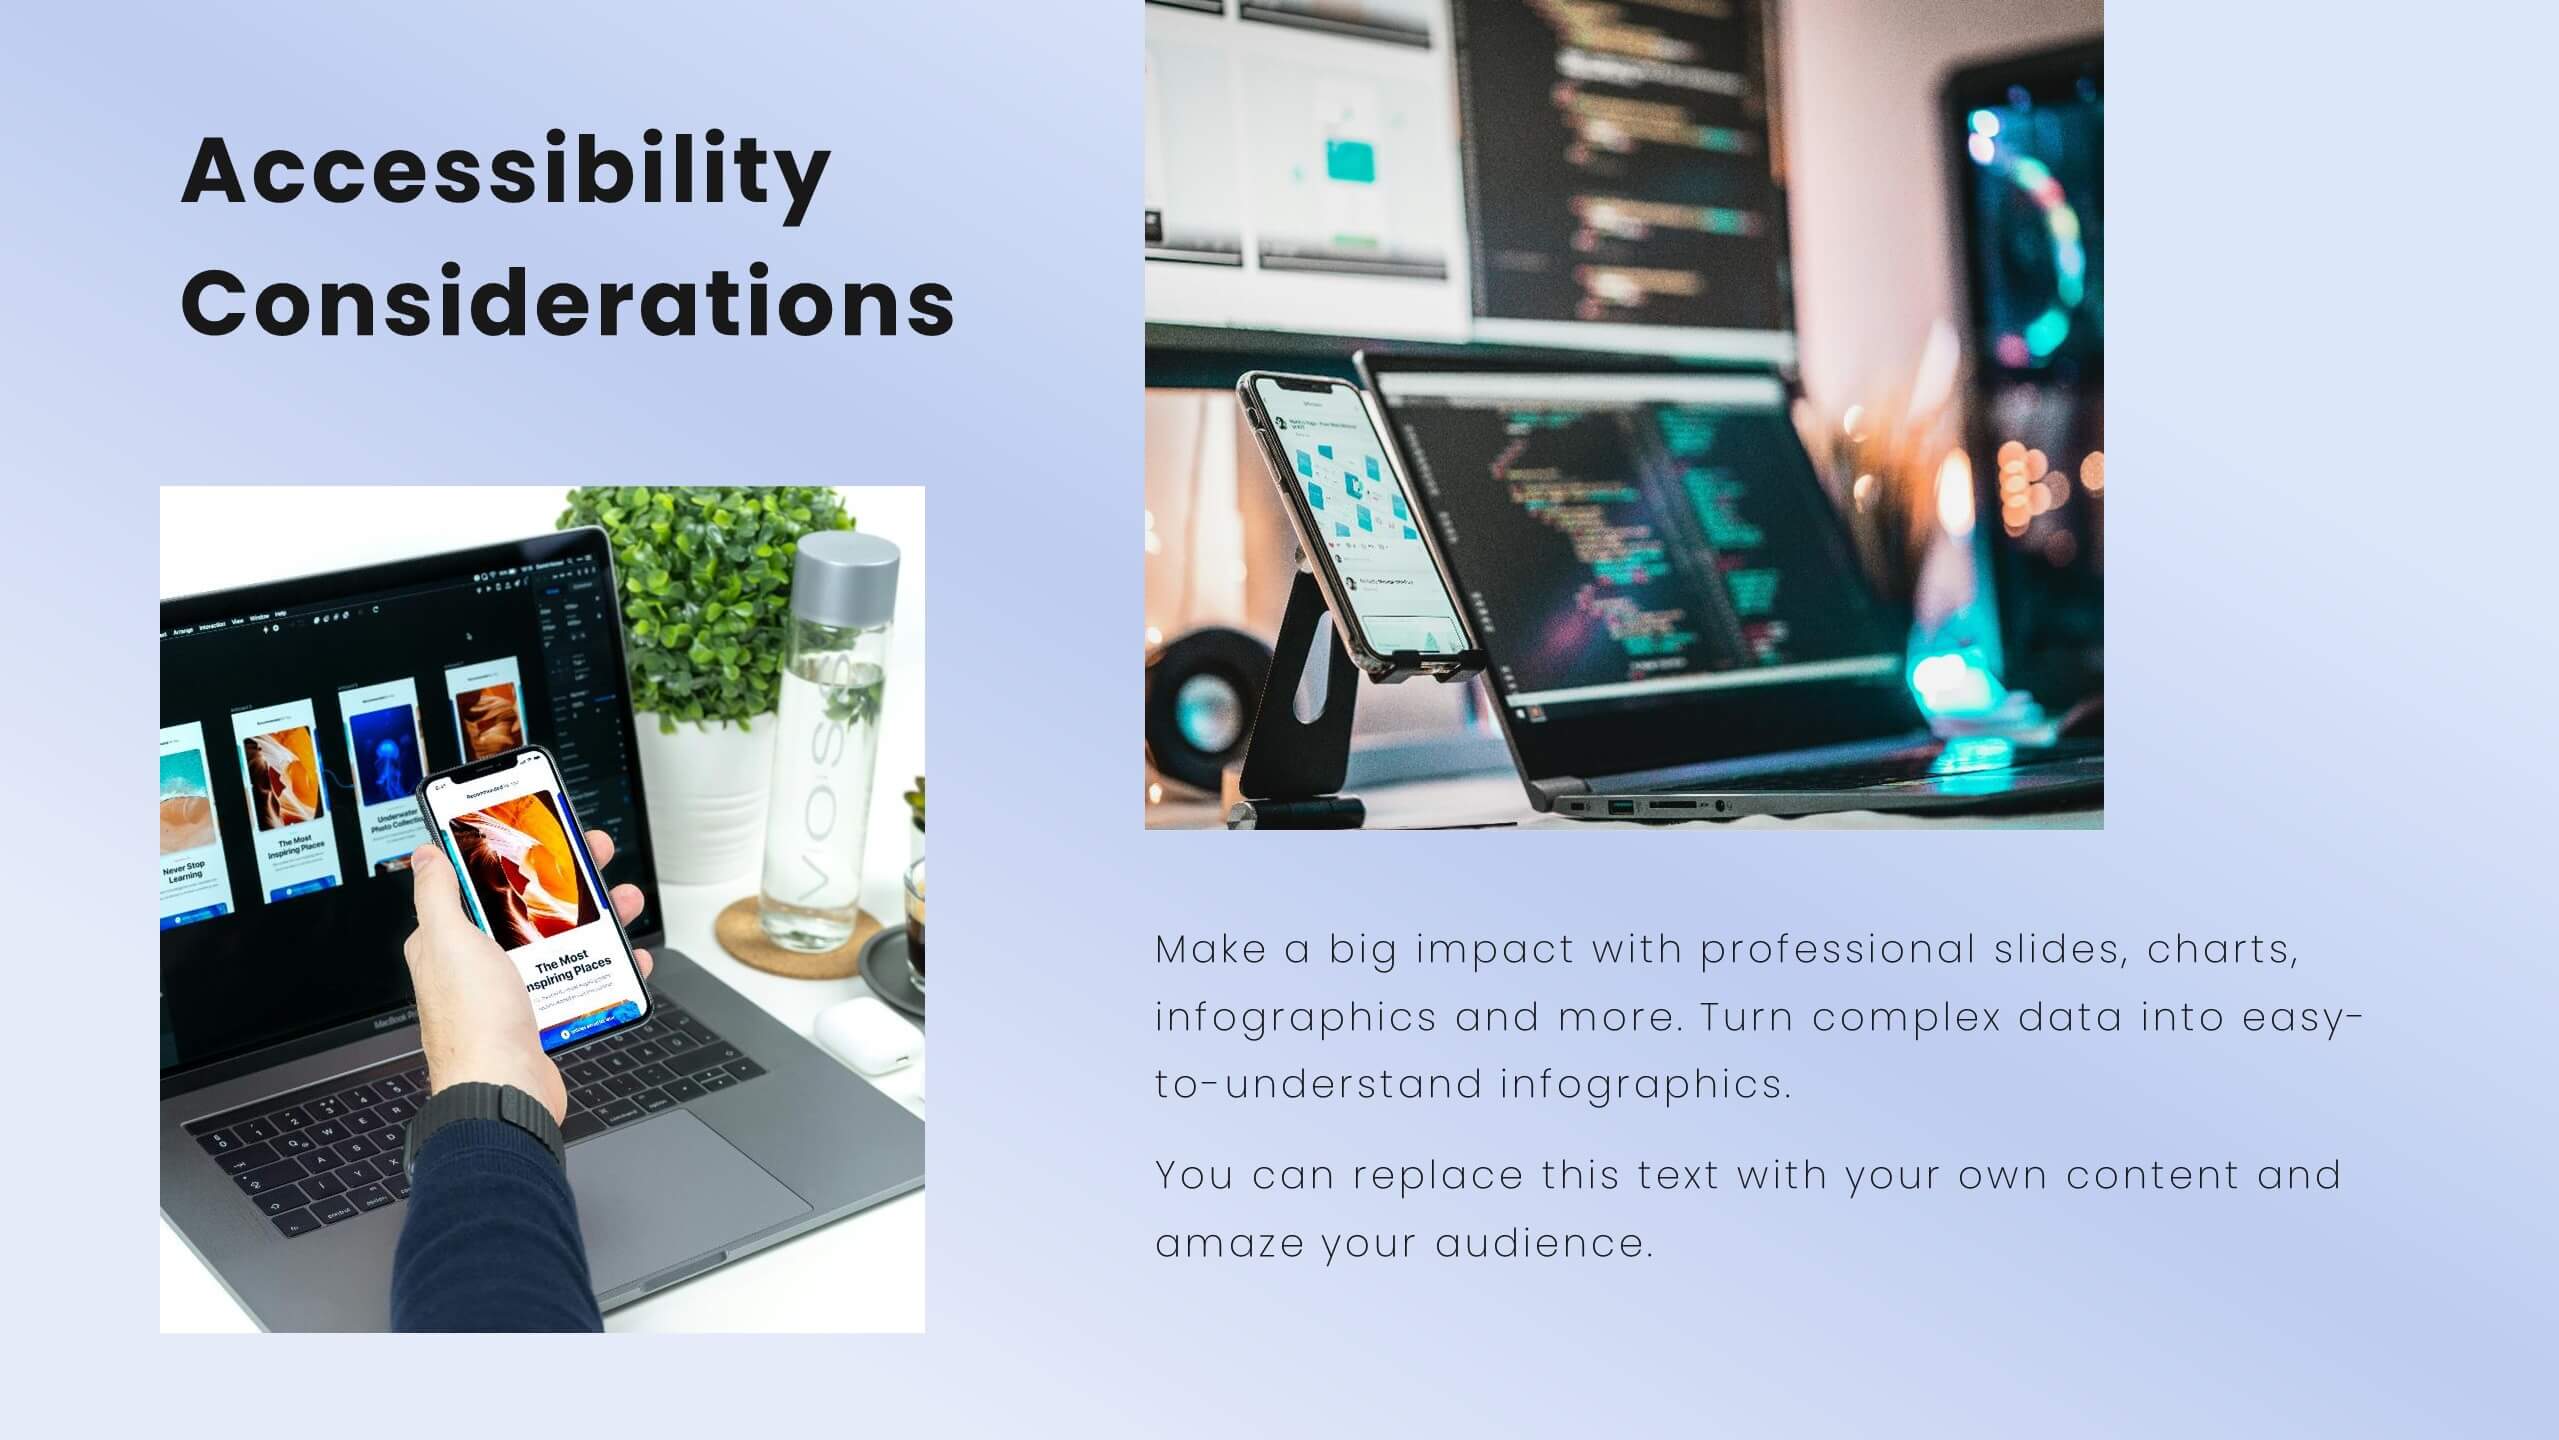
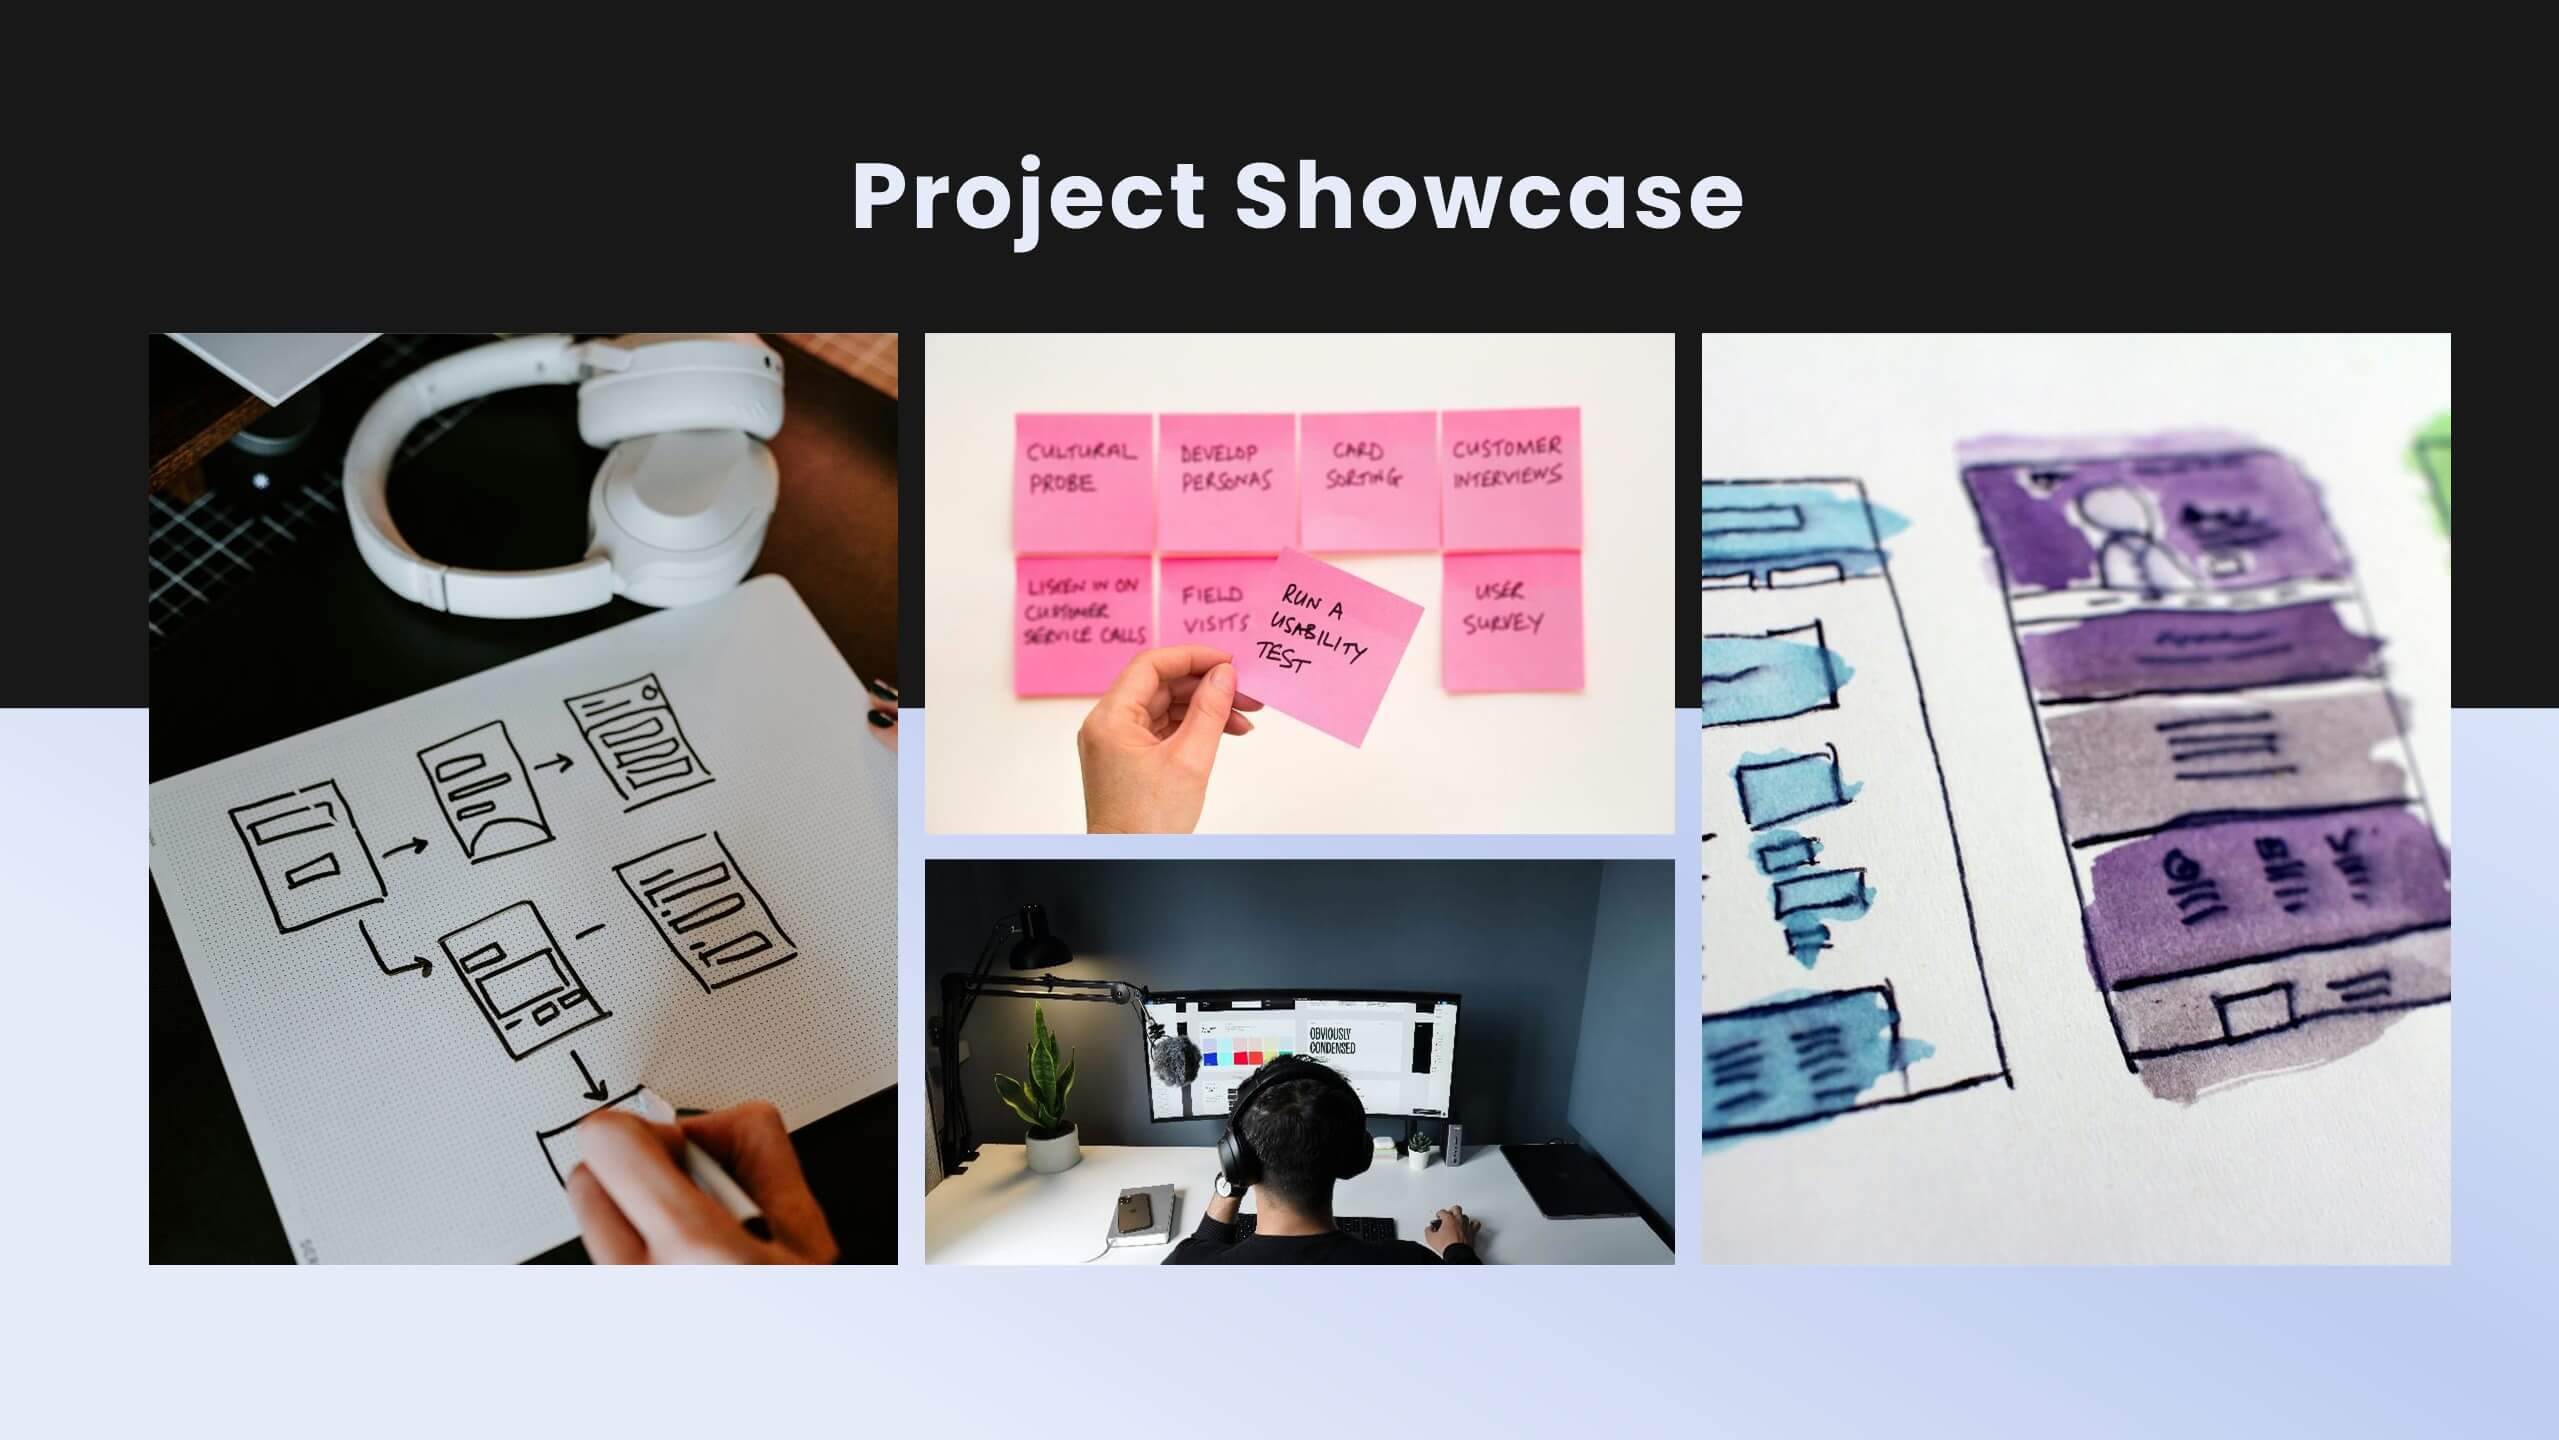
Enhance user experience with this comprehensive UX proposal template! Perfect for outlining user research, personas, and design principles. Ideal for UX/UI designers aiming to present their strategies and solutions. Compatible with PowerPoint, Keynote, and Google Slides, this template ensures your UX proposals are clear, professional, and impactful. Create exceptional user experiences today!


5 slides
IT Technology Revolution Infographics
Navigate the digital wave with our IT technology revolution infographics. Crafted in a sleek blue and white palette, this template is a nod to the informational era's sophistication. It's an essential tool for IT professionals, educators, tech enthusiasts, or students stepping into the world of informational technology. Compatible with Powerpoint, Keynote, and Google Slides. With a design that speaks innovation, it features cutting-edge graphics, icons, and image placeholders, tailored to dissect complex tech jargons into digestible visuals. Engage your audience with data and trends that encapsulate the IT landscape's ever-evolving nature.


6 slides
Tree Diagram for Process Mapping
Visualize workflows with clarity using this Tree Diagram slide. Designed to map six key process steps branching from a central trunk, it's ideal for illustrating strategic plans, organizational flows, or project lifecycles. Fully editable in PowerPoint, Keynote, and Google Slides for cross-platform flexibility.


3 slides
Breakthroughs in Biology and Chemistry Presentation
Highlight your scientific discoveries with this Breakthroughs in Biology and Chemistry Presentation Template. Featuring illustrated lab elements like microscopes, DNA, and petri dishes, it's perfect for researchers and educators. Easily editable in PowerPoint, Keynote, or Google Slides, this template helps convey key insights with clarity and visual appeal.


6 slides
Funnel Stages Infographic
In marketing and sales, the term "funnel stages" refers to the different stages or steps that a potential customer goes through in their journey from initial awareness of a product or service to making a purchase decision. These infographics visualize and help you understand the customer's progression through these stages. They aim to help businesses and professionals understand the customer journey and optimize their strategies for each stage of the funnel. Whether used in sales presentations, marketing workshops, or educational materials, this template helps businesses build successful sale funnels and maximize their revenue potential.


5 slides
Economic Analysis of North America Map Presentation
The Economic Analysis of North America Map template provides a focused visual tool for displaying economic data across different regions. With dedicated spots for key statistics and trends, this template enhances presentations with clear, data-driven insights. It is designed to be user-friendly and is compatible with PowerPoint, Keynote, and Google Slides.


7 slides
Fishbone Analysis Infographic Presentation
A fishbone Infographic is a technique used to brainstorm the cause of a problem. The unique design helps you understand how one thing can lead to another and is effective at helping you create a solution that reviews all aspects. Start this template off using the head of the fish as a prompt and webbing out from there, draw up to six main causal categories and then sub-categories. Use this infographic to organize your ideas and identify key factors, as well as decide how to prioritize them. This template is compatible and completely editable with Powerpoint, keynote and google slides.


20 slides
Mythion Business Idea Pitch Deck Presentation
Communicate your business vision with clarity and impact using this comprehensive pitch deck presentation template. Perfect for entrepreneurs, startups, and innovators, this template is designed to help you effectively present your idea to investors, stakeholders, or partners. Cover every essential aspect of your business journey with slides dedicated to the problem statement, solutions, market overview, and target audience. Showcase your business model, revenue projections, and unique selling proposition with visually appealing layouts. Highlight your marketing strategy, growth projections, and funding requirements to build a strong, persuasive case. Fully customizable and compatible with PowerPoint, Google Slides, and Keynote, this template allows you to tailor each slide to suit your business identity and goals. Whether you're pitching a new idea or seeking investment, this template ensures you present with professionalism and confidence.


4 slides
To-Do Lists and Task Management Presentation
Stay organized and boost productivity with the To-Do Lists and Task Management Presentation. This sleek layout features vertical note-style columns that are perfect for displaying tasks, priorities, or checklists in a structured format. Ideal for project timelines, personal goals, or team deliverables. Each list area includes customizable titles, checkmarks, and space for key points. Fully editable in PowerPoint, Keynote, and Google Slides—perfect for visual task tracking across presentations.


4 slides
Crypto Investment and Trading Strategies Presentation
Visualize your crypto strategy with clarity using this modern, step-by-step slide. Featuring a rising arrow graph, coin icon, and shopping cart illustration, this layout is ideal for explaining investment phases, trading tactics, or market entry strategies. Editable in PowerPoint, Keynote, and Google Slides for maximum flexibility.


5 slides
Wedding Ceremony Program Infographics
Wedding Ceremony infographics are visual representations that provide essential information and details about a wedding ceremony. These vertical infographics feature eye catching designs that will help you present a unique and memorable wedding ceremony program. This template is perfect for couples, wedding planners, or event organizers looking to present the order of events and important details in a visually engaging way. These infographics are designed using elegant and romantic elements, such as delicate illustrations, floral motifs, and soft color palettes, creating a charming and visually cohesive look.


5 slides
Medical Services Infographics
Navigate the complexities of healthcare information with our medical services infographics. Rendered in a life-affirming palette of blue and red, these infographics elucidate various facets of medical services. The template serves as a lifeline for healthcare professionals, and public health advocates by providing a clear, visual narrative of services, processes, and advancements in the medical field. Compatible with Powerpoint, Keynote, and Google Slides. Its creative yet informative style, enhanced with relevant graphics and icons, ensure that critical information catches the eye, improves understanding, and encourages engagement.


6 slides
Business Decision Venn Diagram Presentation
Make complex decision-making simple and visually impactful with this Business Decision Venn Diagram Presentation. Featuring a bold triangular layout with six segmented areas, this slide is ideal for presenting overlapping factors, interconnected strategies, or priority zones. Perfect for business planning, competitive analysis, or project evaluation. Fully editable in PowerPoint, Keynote, and Google Slides for seamless integration into your presentations.


8 slides
Interactive Digital Learning Experience Presentation
Make your content more engaging with the Interactive Digital Learning Experience Presentation. This layout blends quiz-style visuals and educational icons, helping you present learning modules, assessments, or training checkpoints in a fun and intuitive way. Use it to simplify information, boost audience interaction, or highlight multiple-choice content. Fully editable in Canva, PowerPoint, Keynote, and Google Slides.