


Features
- 10 Unique slides
- Fully editable and easy to edit in Microsoft Powerpoint, Keynote and Google Slides
- 16:9 widescreen layout
- Clean and professional designs
- Export to JPG, PDF or send by email


Do you have any questions?
Recommend


5 slides
Strategic Planning with OKRs Presentation
Optimize goal-setting with the Strategic Planning with OKRs presentation. This visually engaging template uses a trophy-inspired design to highlight key objectives and results, making it perfect for business strategy sessions, team alignment, and performance tracking. Fully customizable and compatible with PowerPoint, Keynote, and Google Slides for seamless use.


6 slides
Project Stakeholder Mapping
Visualize stakeholder relationships with this dynamic swirl-style infographic. Designed to showcase six key entities—Society, Media, Customer, Shareholder, Manager, and Employee—this layout emphasizes the interconnected roles within project environments. Perfect for stakeholder mapping, project planning, or communication strategies. Editable in PowerPoint, Keynote, and Google Slides.


8 slides
Marketing Campaign Performance Presentation
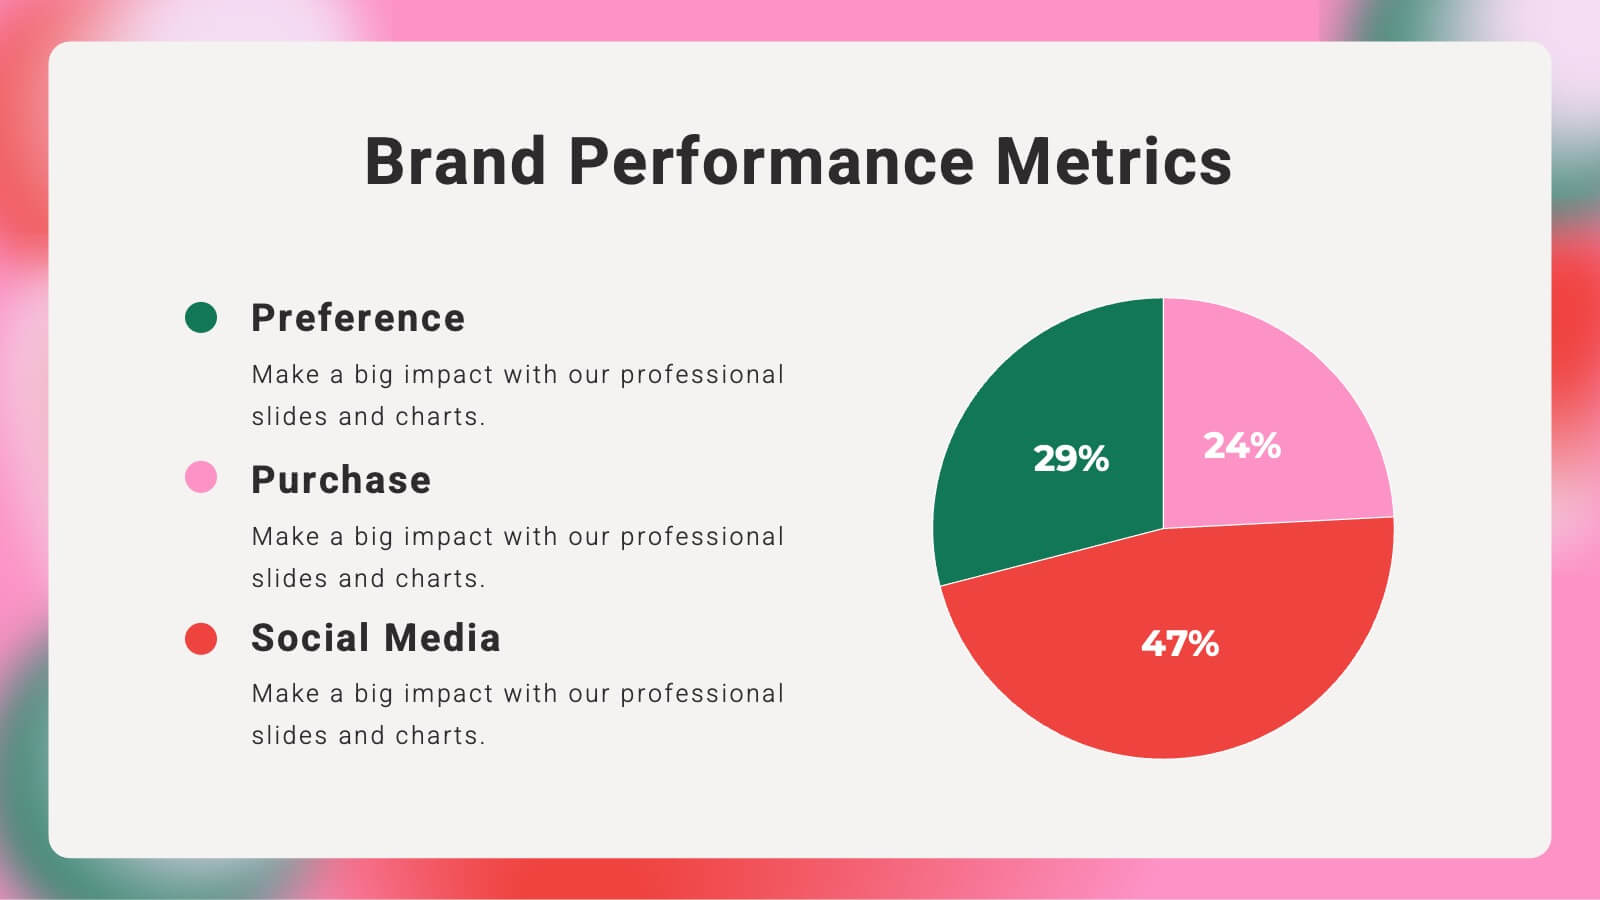
Showcase campaign metrics in style with this Marketing Campaign Performance layout. Featuring four icon-labeled data cards at the top and two integrated charts below (pie and bar), this slide offers a snapshot of performance insights—ideal for comparing reach, engagement, and conversion data across platforms. Fully editable and compatible with PowerPoint, Keynote, and Google Slides.


4 slides
Strategic Growth Next Steps Presentation
Achieve sustainable growth with the Strategic Growth Next Steps Presentation template. This structured, step-by-step layout guides your audience through key phases of business expansion, helping to communicate priorities and action plans effectively. The wavy path design adds a dynamic flow to your strategy, ensuring clarity and engagement. Fully customizable for PowerPoint, Keynote, and Google Slides, making it a versatile tool for strategic planning and business development.


8 slides
Typography Alphabet Grid Concept
Showcase your message with bold clarity using the Typography Alphabet Grid Concept Presentation. Featuring a striking letterform at the center and four customizable sections for key points, this layout is perfect for creative overviews, branding, or idea segmentation. Fully editable in PowerPoint, Keynote, and Google Slides.


6 slides
Internal and External Communication Plan Presentation
Enhance your Internal and External Communication Plan with this professional infographic template. Designed to illustrate key communication strategies, this slide ensures clear and effective collaboration within teams and with external stakeholders. Fully customizable in PowerPoint, Keynote, and Google Slides, making it ideal for corporate meetings, business strategy presentations, and workflow planning.


5 slides
Supply Chain Industry Infographics
The supply chain industry refers to the network of organizations, resources, activities, and technologies involved in the production, distribution, and delivery of goods and services from the point of origin to the point of consumption. These vertical infographics encompasses all the stages and processes involved in the movement of products, including procurement, manufacturing, logistics, and customer service. These are designed to help your audience understand the intricacies of supply chain management and its role in business operations. Compatible with Powerpoint, Keynote, and Google Slides.


6 slides
Competitor Benchmarking and Comparison Presentation
Present a side-by-side snapshot of your competitive landscape with the Competitor Benchmarking and Comparison Presentation. This clear layout lets you compare five key features or metrics between your brand and competitors using a visual central column. Fully editable in Canva, PowerPoint, Keynote, and Google Slides for fast, professional benchmarking.


3 slides
Future of Aviation Technologies Presentation
Soar into the future of flight with this sleek, data-driven layout that visualizes progress and innovation in aviation. Perfect for showcasing new technologies, sustainability efforts, or industry growth trends, it balances clarity and impact. Fully customizable and compatible with PowerPoint, Keynote, and Google Slides for effortless presentation design.


23 slides
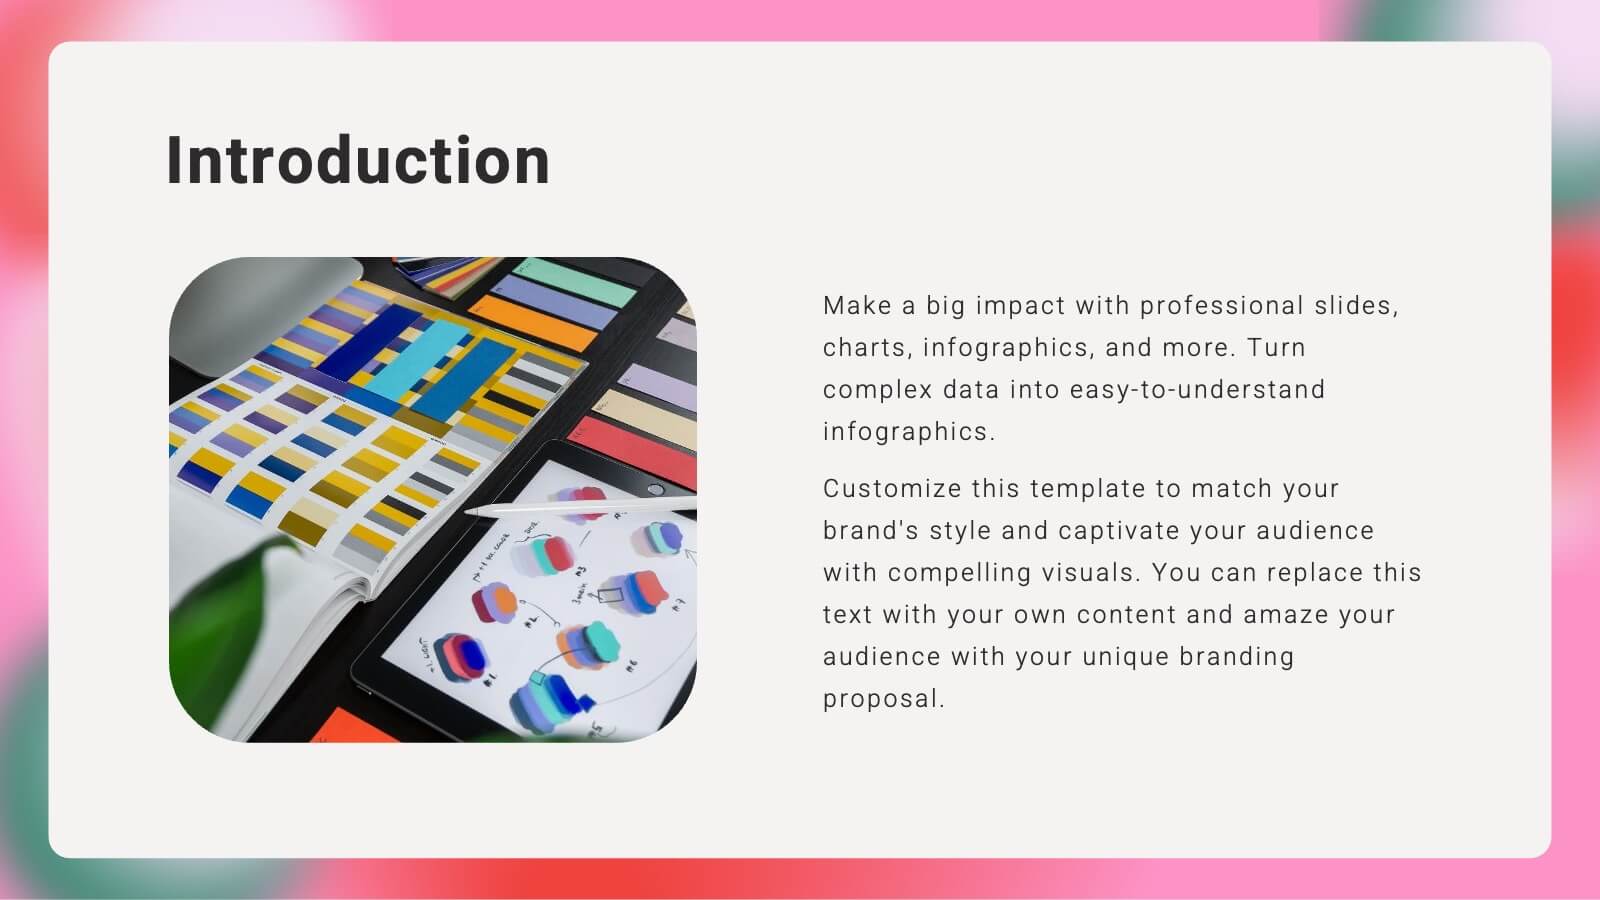
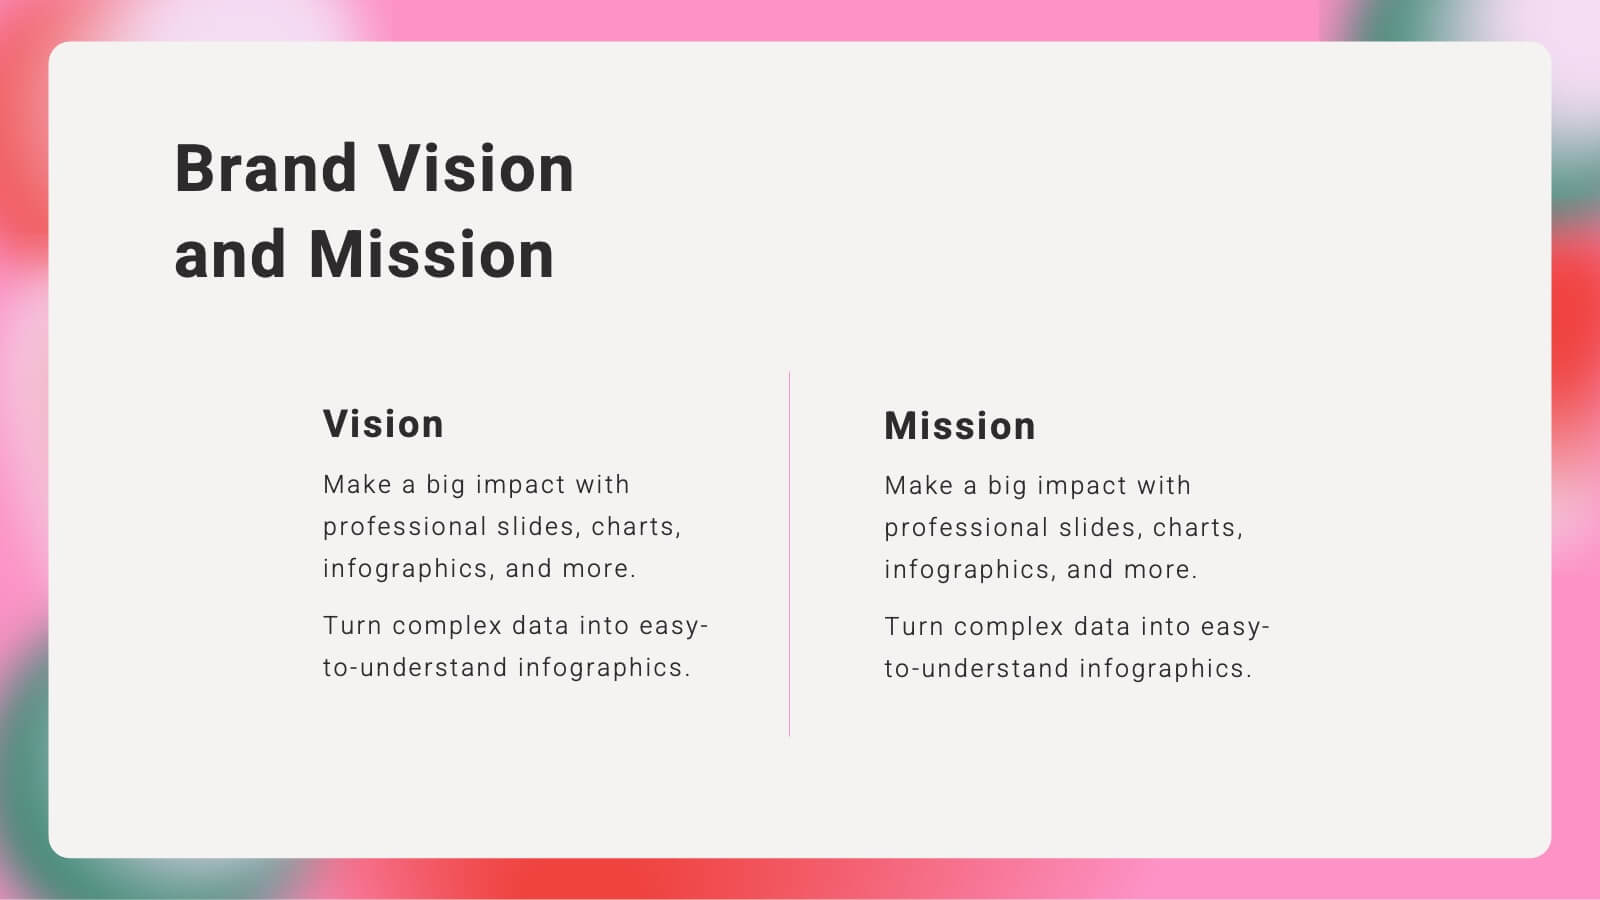
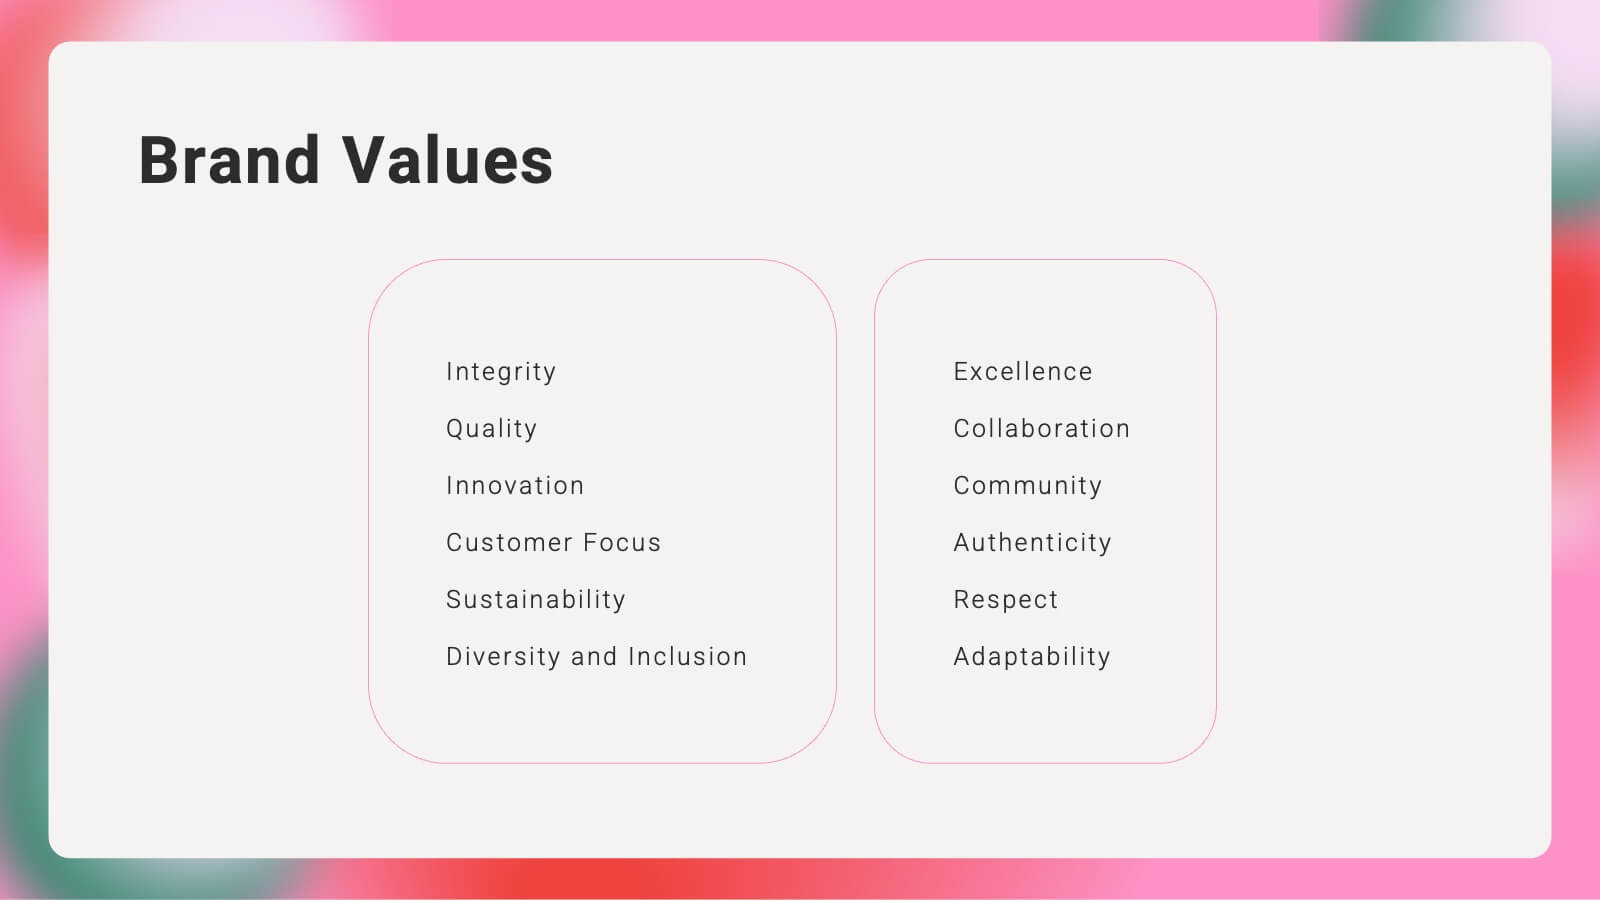
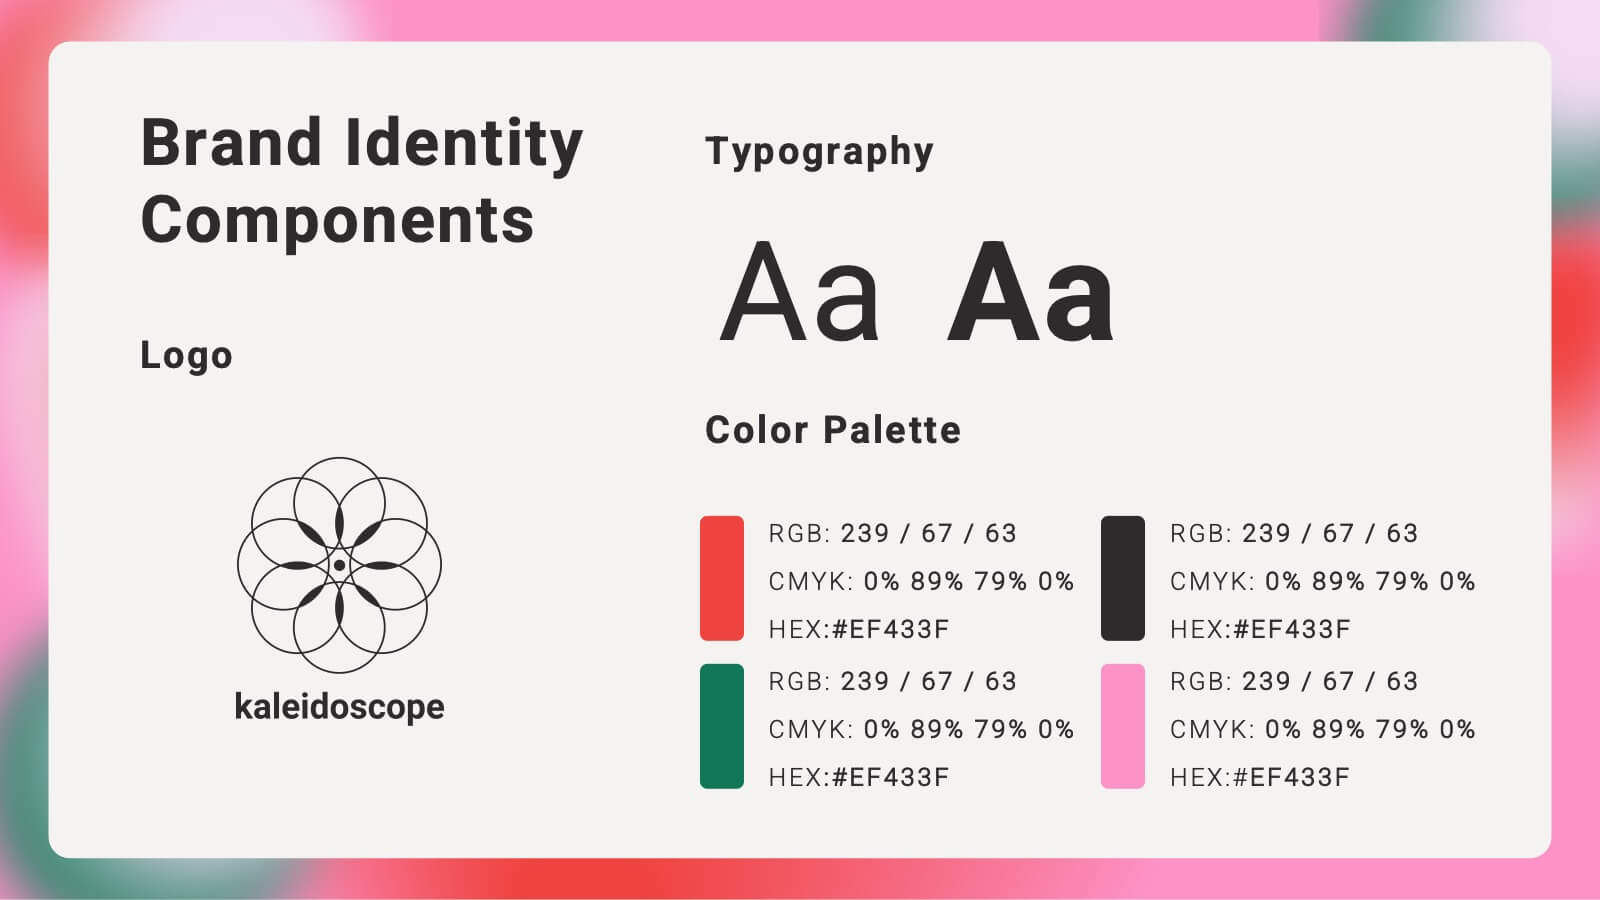
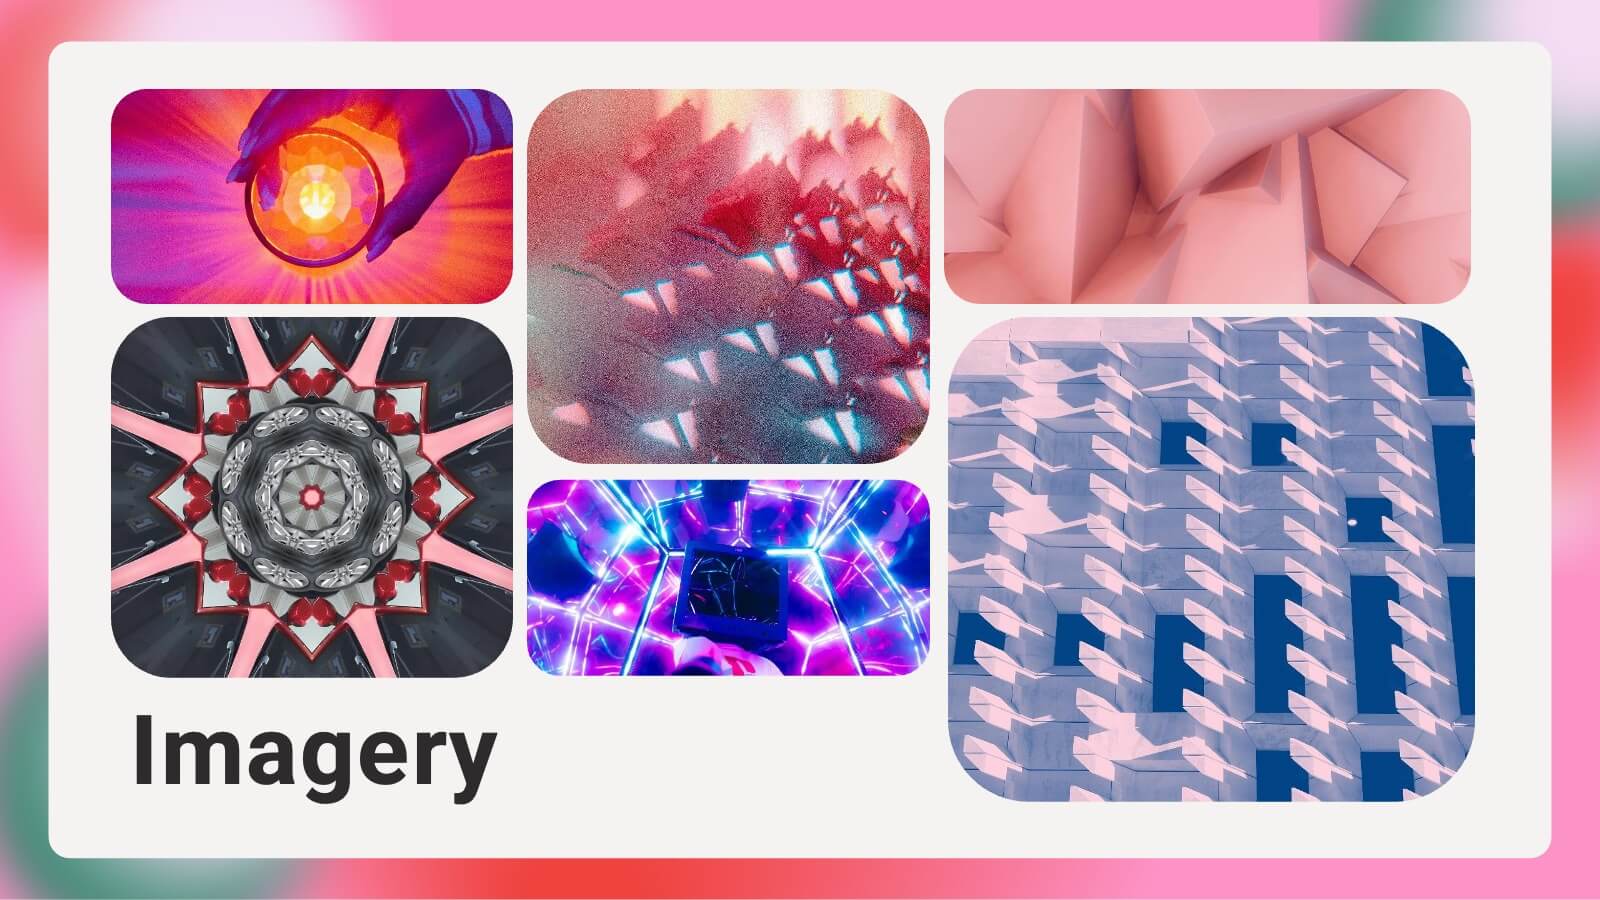
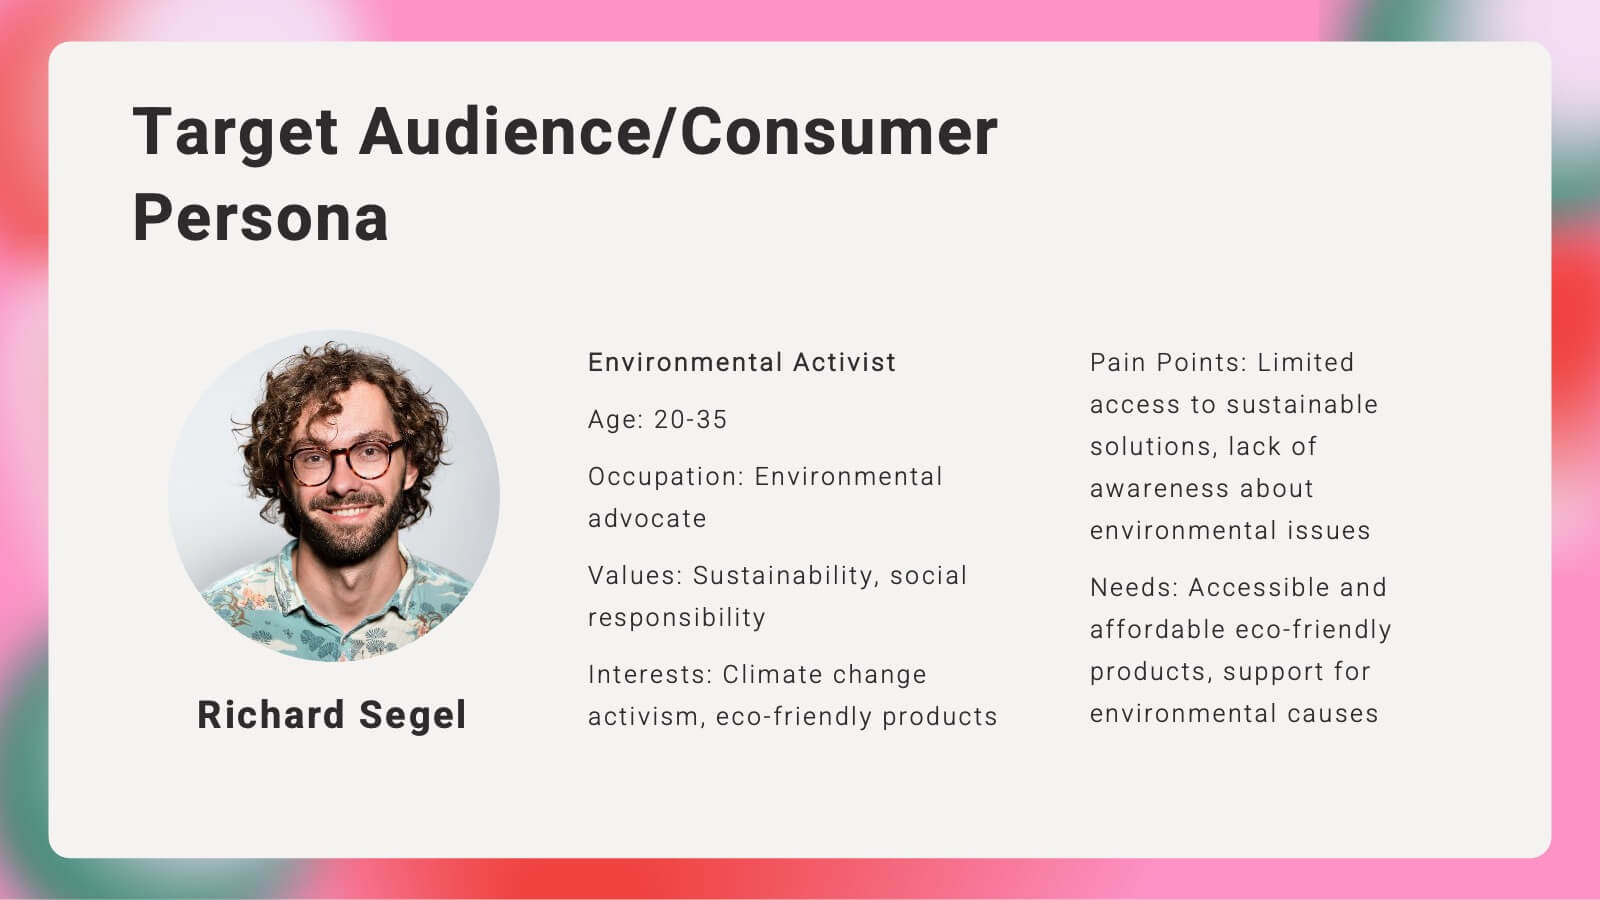
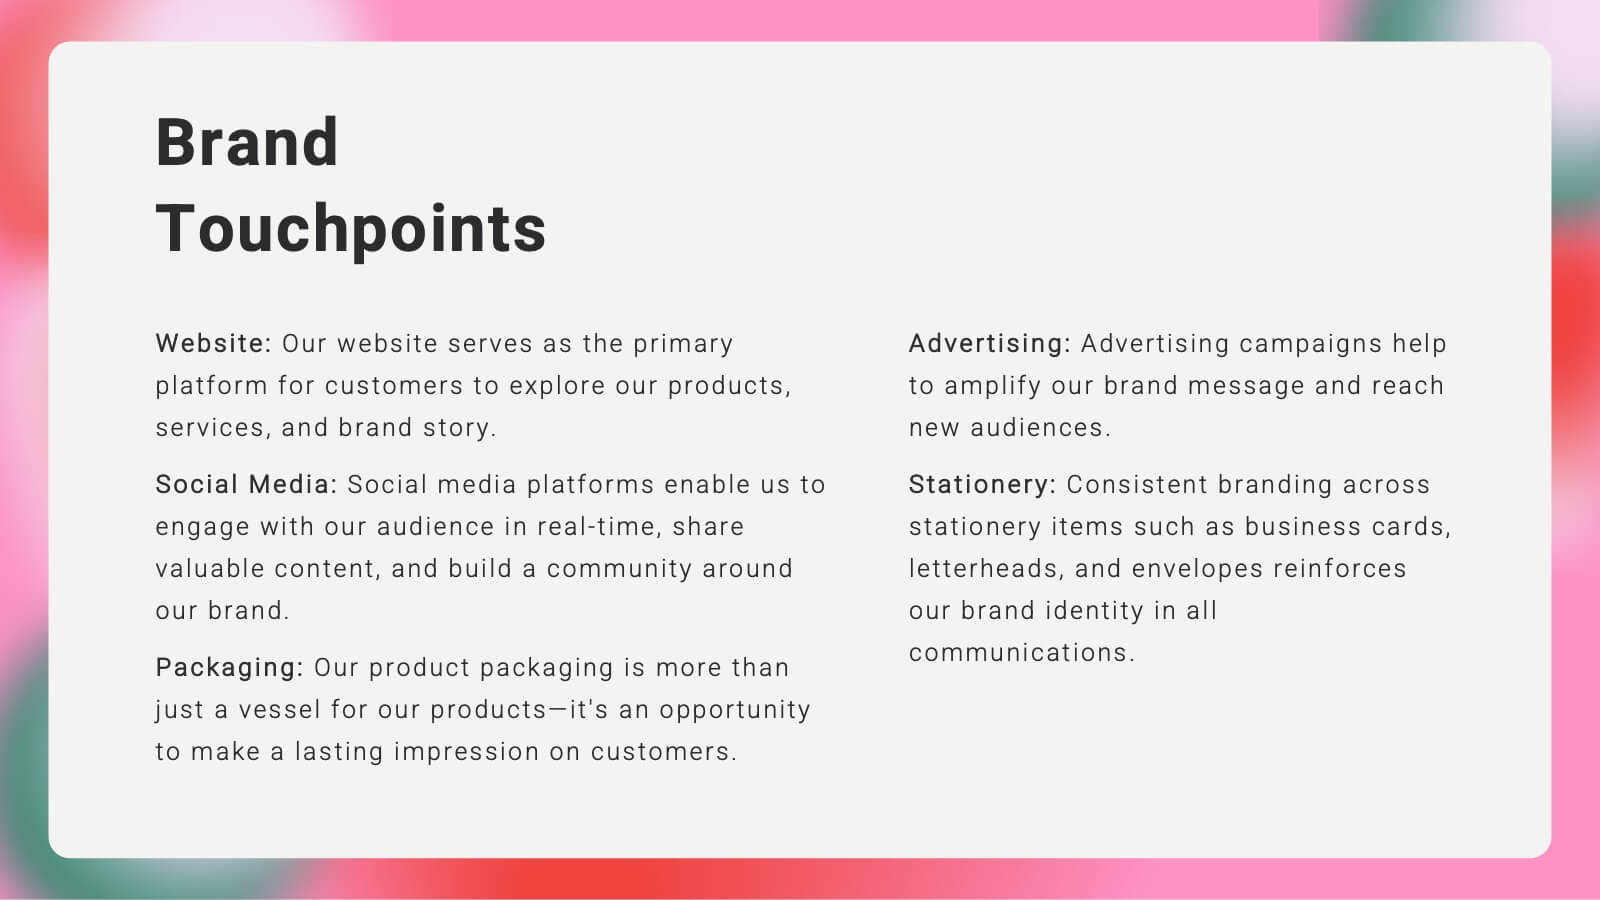
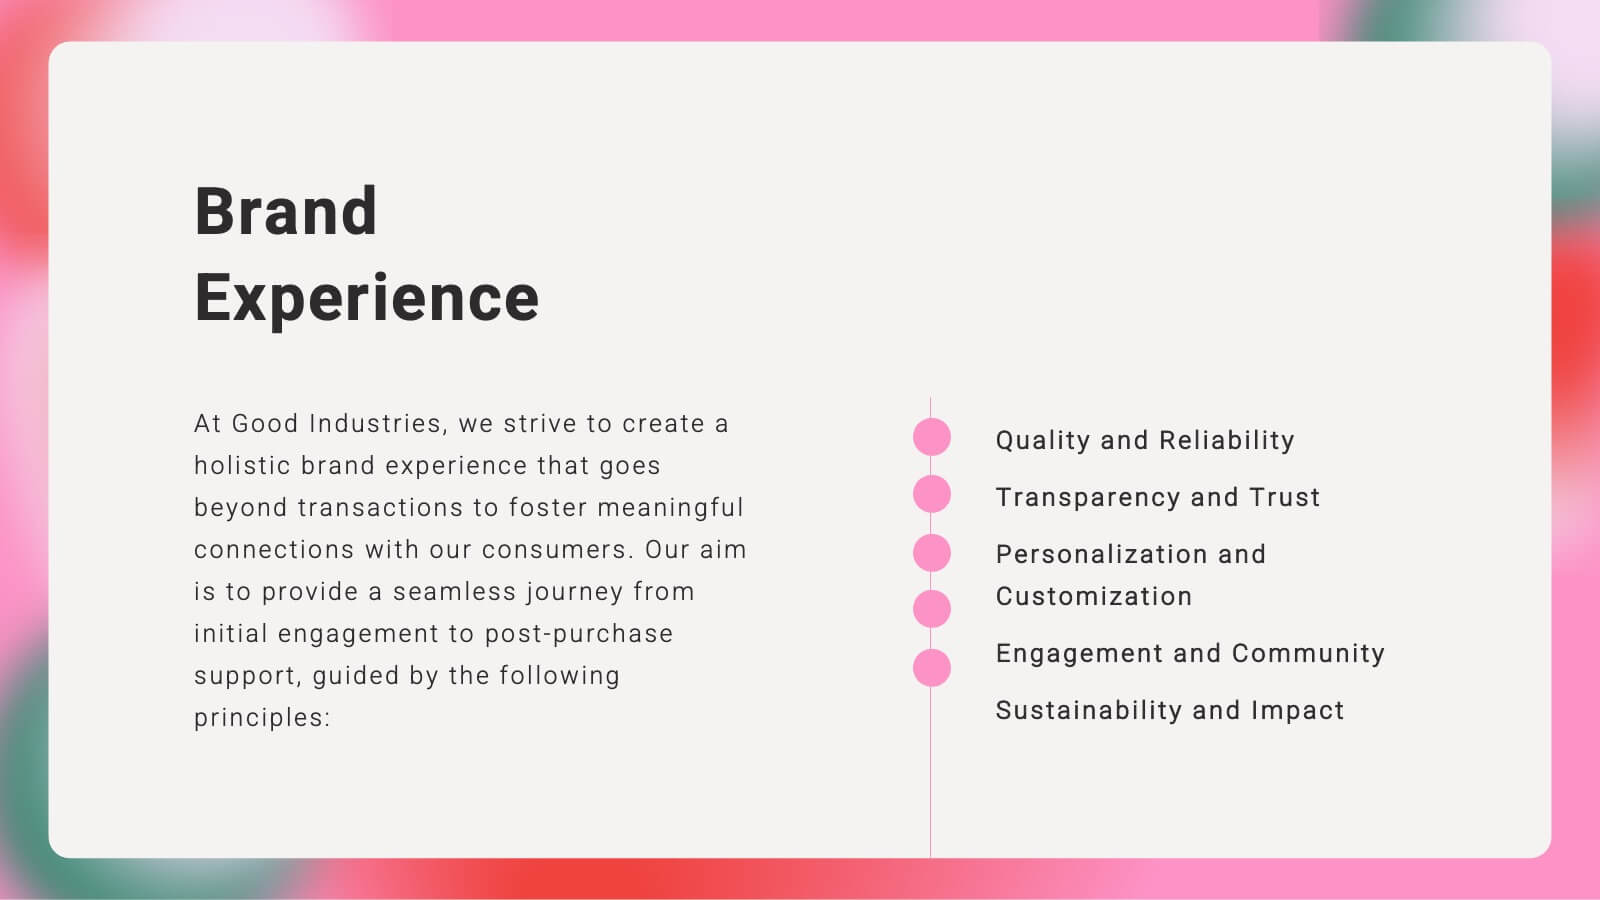
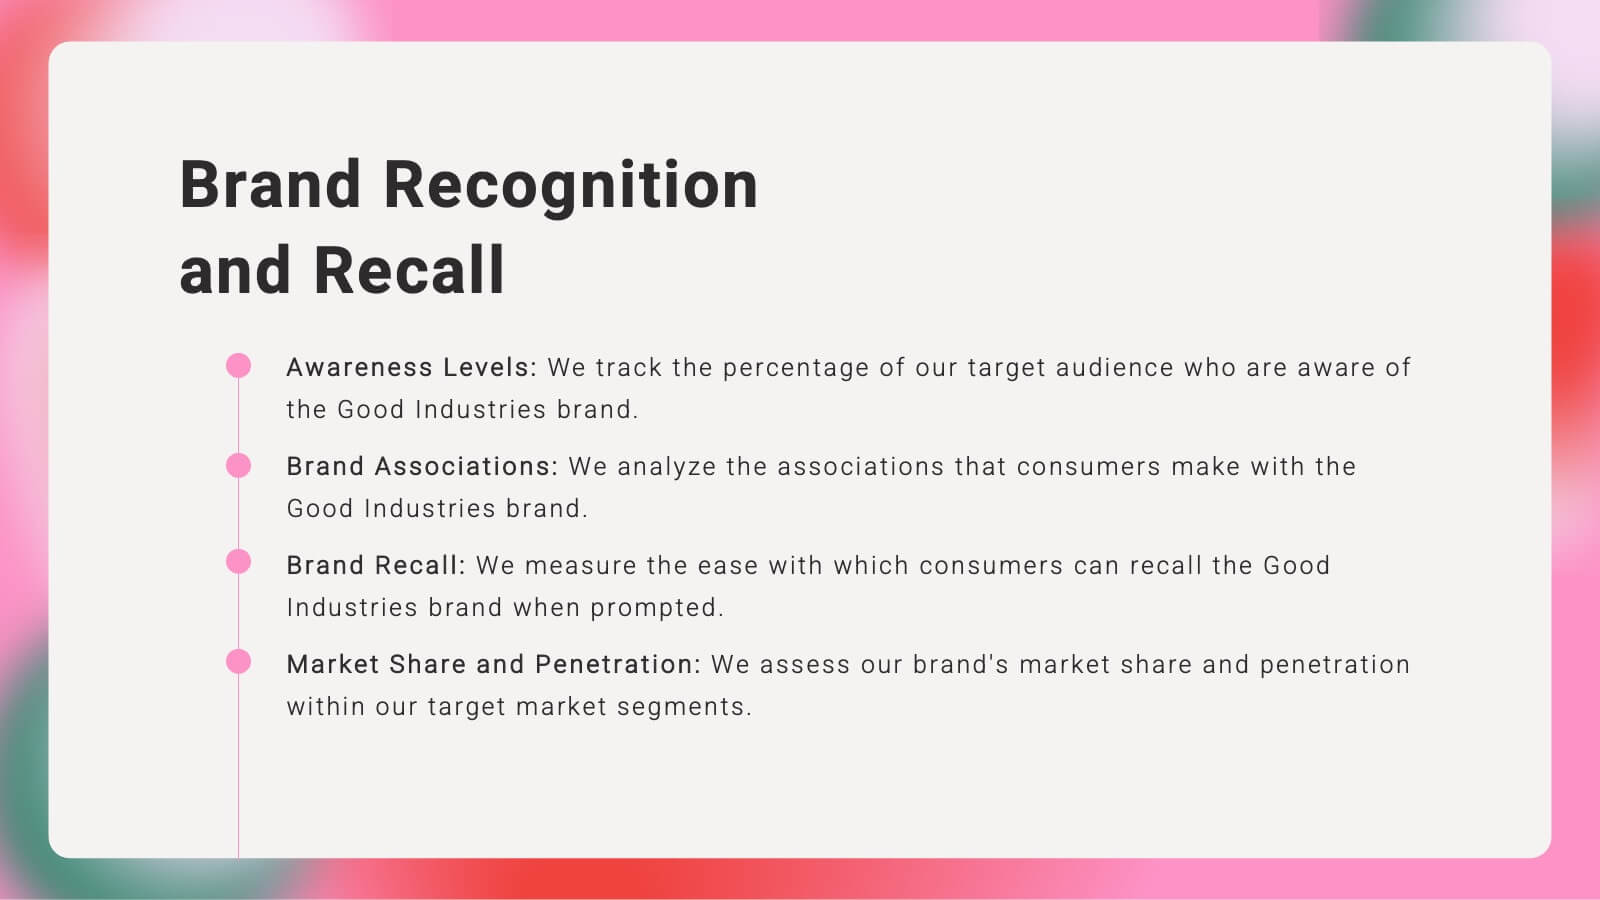
Kaleidoscope Brand Strategy Report Presentation
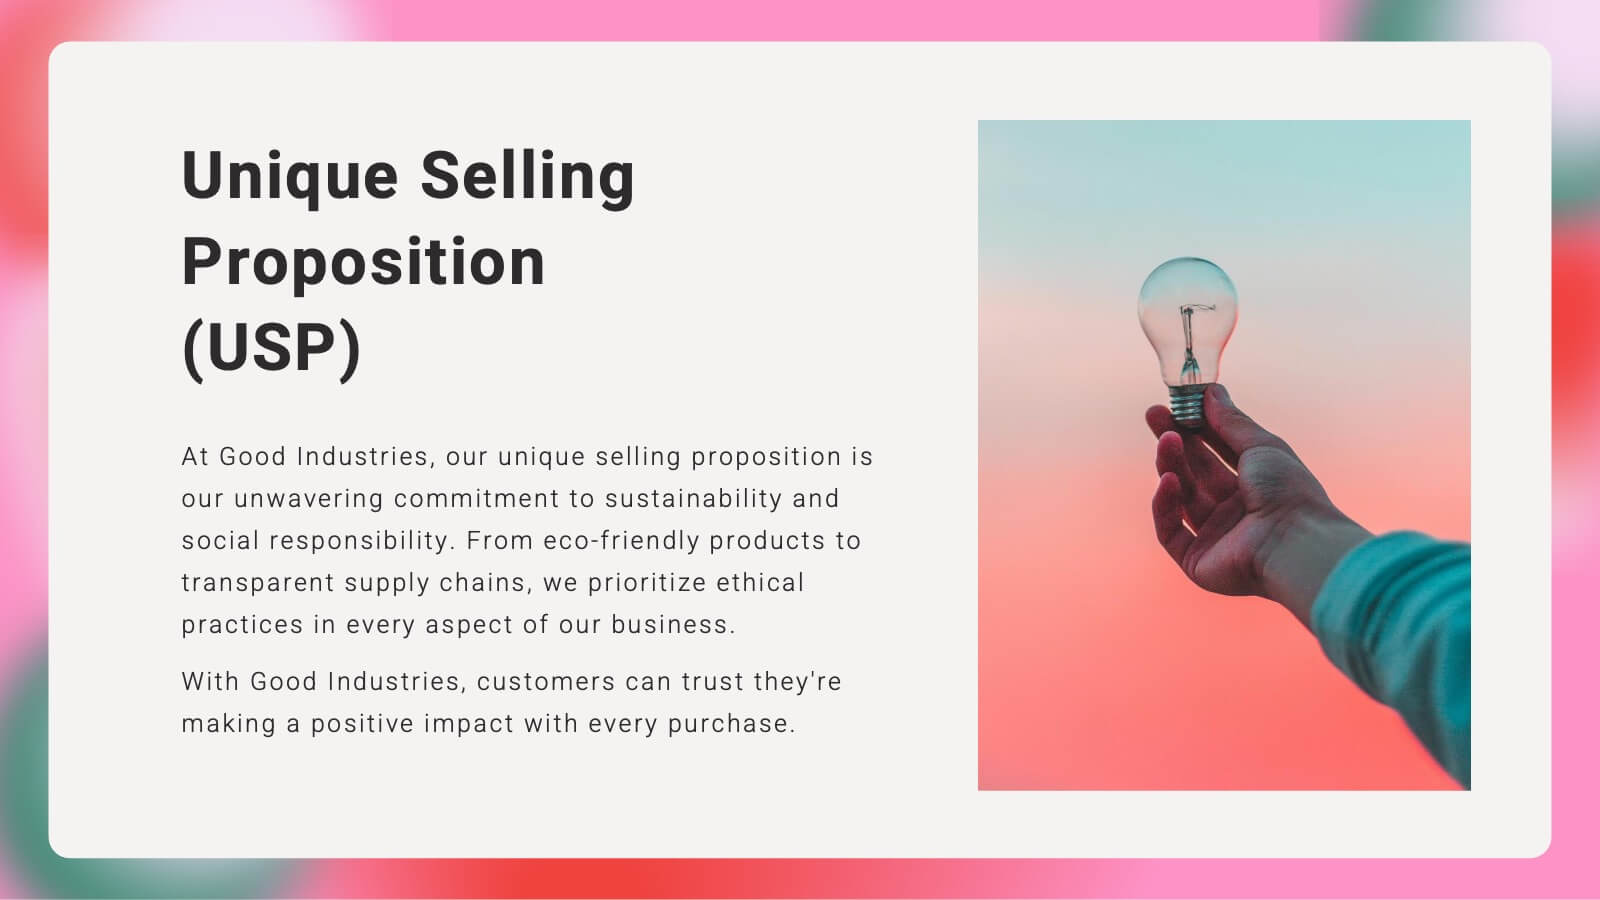
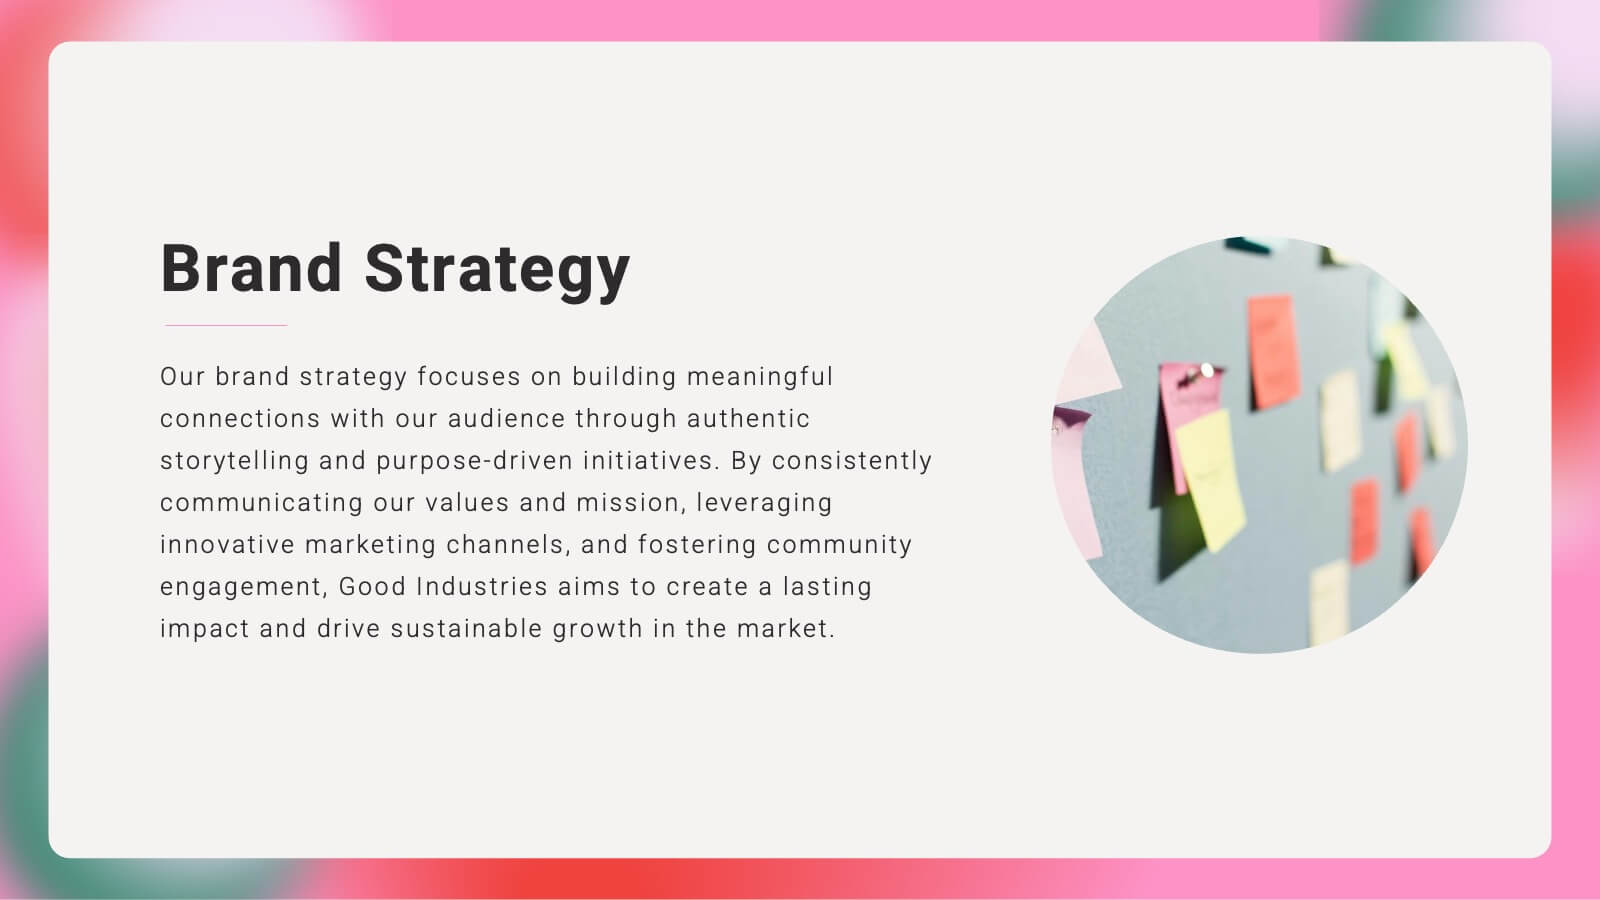
Craft a compelling narrative for your brand with this vibrant brand strategy presentation template. Designed to cover every facet of brand development, from vision and mission to market analysis and consumer personas, this template is an essential tool for businesses looking to establish a strong brand identity. It incorporates visually engaging slides that outline brand voice, values, and touchpoints, facilitating a thorough understanding of strategic branding. Compatible with platforms like PowerPoint, Google Slides, and Keynote, it is accessible across various devices, making it perfect for collaborative planning and presentations.


7 slides
Home Buyer Checklist Infographic
Step into your dream home with confidence using our Home Buyer Checklist Infographic Template. This visually engaging guide is meticulously designed to streamline the home-buying process, making it transparent and manageable for first-time buyers and seasoned investors alike. This template provides a comprehensive checklist that covers every important aspect of home buying, from budgeting and financing to inspecting and closing. Its intuitive layout and vibrant design elements make complex tasks approachable and easy to understand, ensuring you don’t miss a beat on your journey to homeownership. Tailor each slide to your specific needs by customizing colors, text, and graphics to reflect your personal style or brand identity. Ideal for real estate agents, mortgage advisors, and educational workshops, this template empowers users to navigate the maze of real estate transactions with ease and assurance.


5 slides
Product Roadmap Presentation
The "Product Roadmap Infographic" template is ideal for presenting the strategic vision and progressive steps for product development. This template outlines the roadmap through a creative and visually engaging route-style layout, designed to highlight key milestones and stages in the product lifecycle, from conception to launch. Each point on the roadmap is clearly marked for specific goals or achievements, encouraging clarity and understanding among stakeholders about the direction and progress of the product. This layout is perfect for product managers and teams to communicate timelines, prioritize tasks, and align goals during presentations in corporate settings.


7 slides
Stock Market Infographic Presentation Template
The stock market is a global system that operates through electronic communication and trading. It allows buyers and sellers to meet, interact, and transact. This template is perfect if you want to become informed or want to inform someone how the stock market operates. This template comes packed with all the information you need. The market allows for price discovery and serve as a barometer for the overall economy. The stock market is highly transparent, allowing sellers to seek the best price. The illustrations provided are made to help you and your viewer understand the bull and bear market.


21 slides
Argentis UX Strategy Plan Presentation
Craft a seamless user experience with this professional UX strategy plan presentation. Covering key topics like user research, interaction design, wireframes, and accessibility considerations, this template helps you present a structured and insightful design approach. Fully customizable and compatible with PowerPoint, Keynote, and Google Slides for a smooth and impactful presentation.


20 slides
Creative Agency Presentation
Showcase your agency’s capabilities with the Magic Coat Creative Agency template. It features slides detailing team introductions, service overviews, case studies, and more. Ideal for creative agencies aiming to impress potential clients, this template supports PowerPoint, Keynote, and Google Slides, enhancing your presentation's professional appeal.


5 slides
Easy Dinner Recipes Infographics
Easy Dinner Recipes offer a practical solution for busy individuals or those who are new to cooking. These infographic templates offer a practical resource for meal planning and preparation. Its visually appealing design, clear instructions, and organized layout make it easy to follow and implement. Whether for personal use or as a presentation tool in cooking classes this template simplifies the process of discovering and trying out delicious dinner recipes. Use these to provide a collection of quick and delicious dinner recipes. This is designed to make meal planning easier, providing step-by-step instructions, ingredient lists, and visuals.


7 slides
Lifecycle Stages in Customer Experience Presentation
Showcase the full customer journey with this Lifecycle Stages in Customer Experience presentation. Featuring a sleek infinity loop layout, this slide is ideal for visualizing cyclical engagement stages—like acquisition, onboarding, retention, and advocacy. Clean design and labeled touchpoints help convey insights clearly. Fully compatible with PowerPoint, Canva, and Google Slides.