


Features
- 5 Unique Slides
- Fully editable and easy to edit in Microsoft Powerpoint, Keynote and Google Slides
- 16:9 widescreen layout
- Clean and professional designs
- Export to JPG, PDF or send by email


Do you have any questions?
Recommend


6 slides
Porter's Five Forces Market Analysis Presentation
Gain a competitive edge with this Porter's Five Forces market analysis template! Designed to help businesses assess industry dynamics, this structured layout highlights competitive rivalry, supplier power, buyer influence, new market entries, and substitute threats. Perfect for strategists and analysts. Fully customizable and compatible with PowerPoint, Keynote, and Google Slides.


21 slides
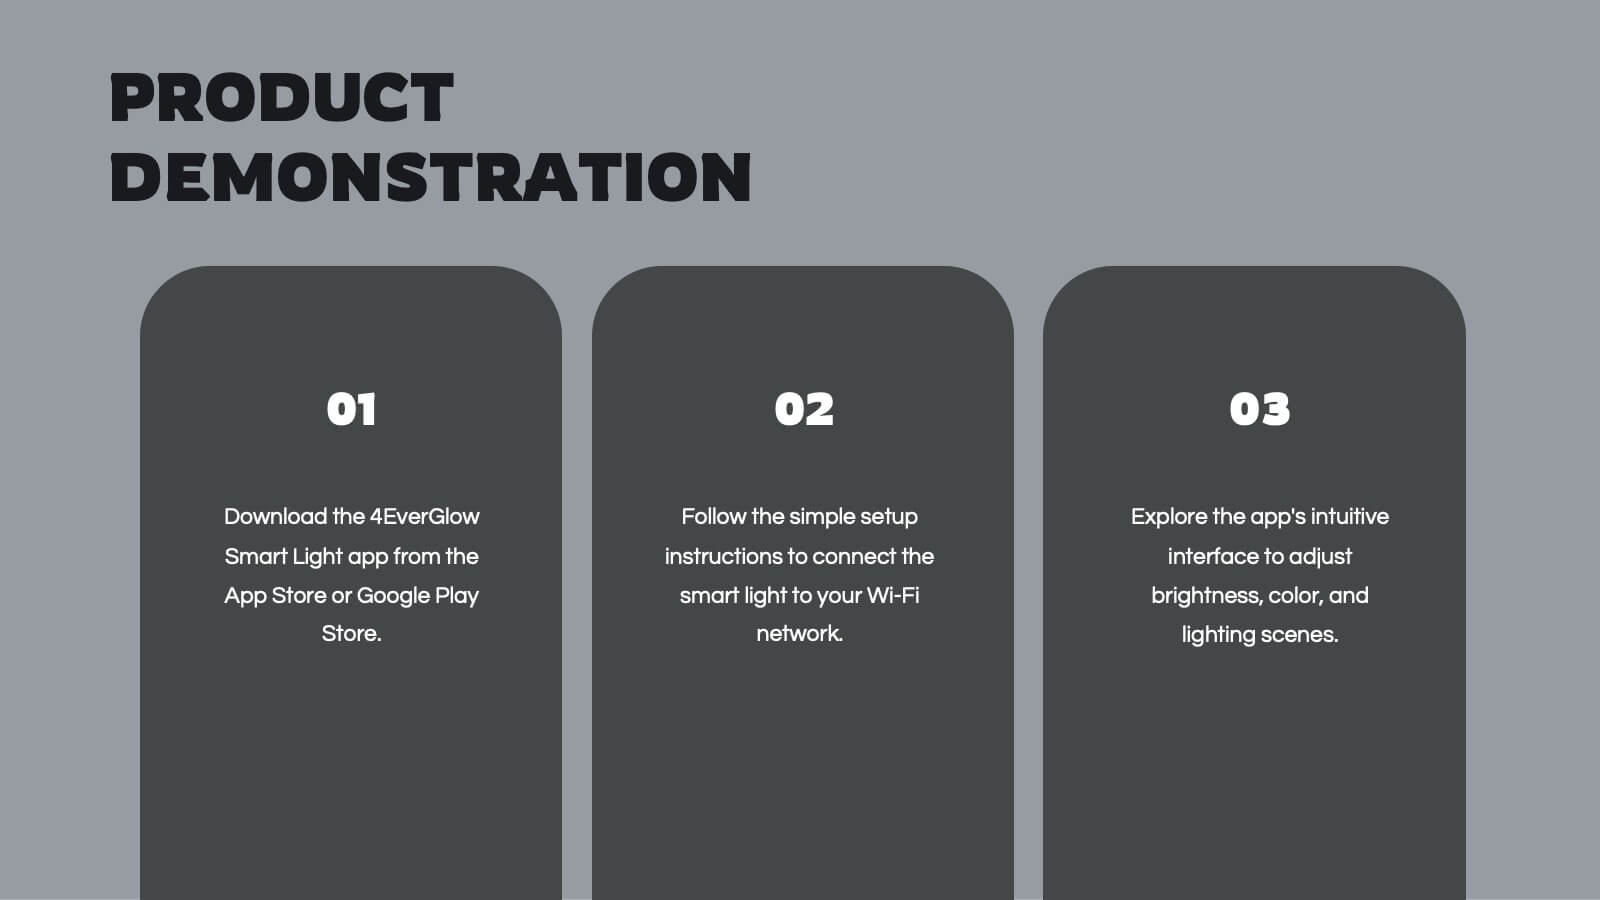
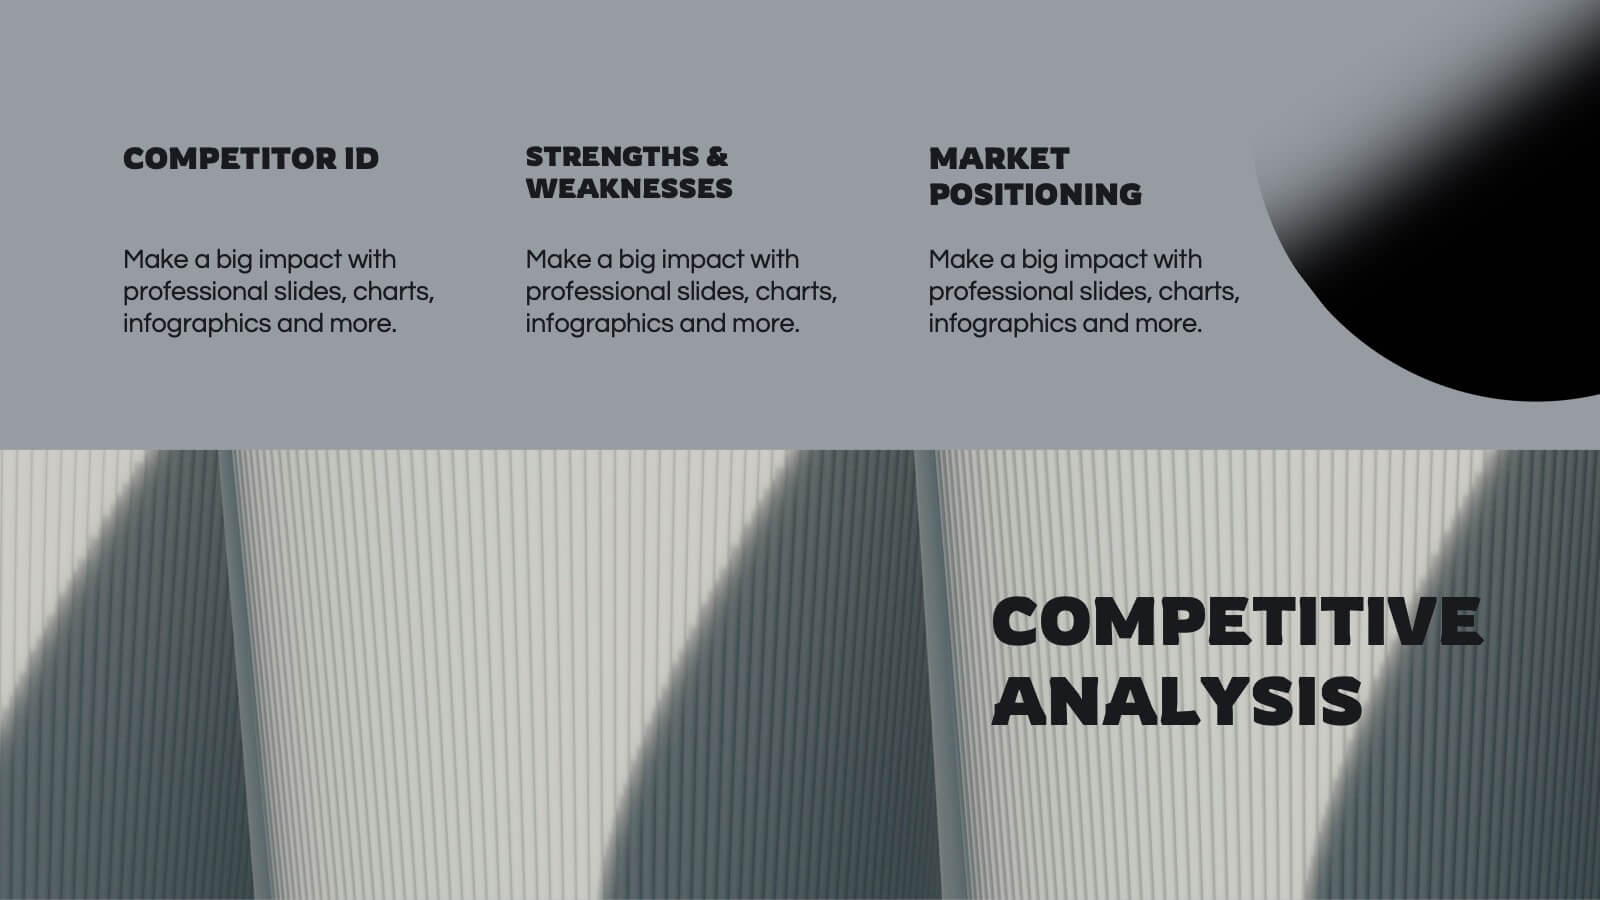
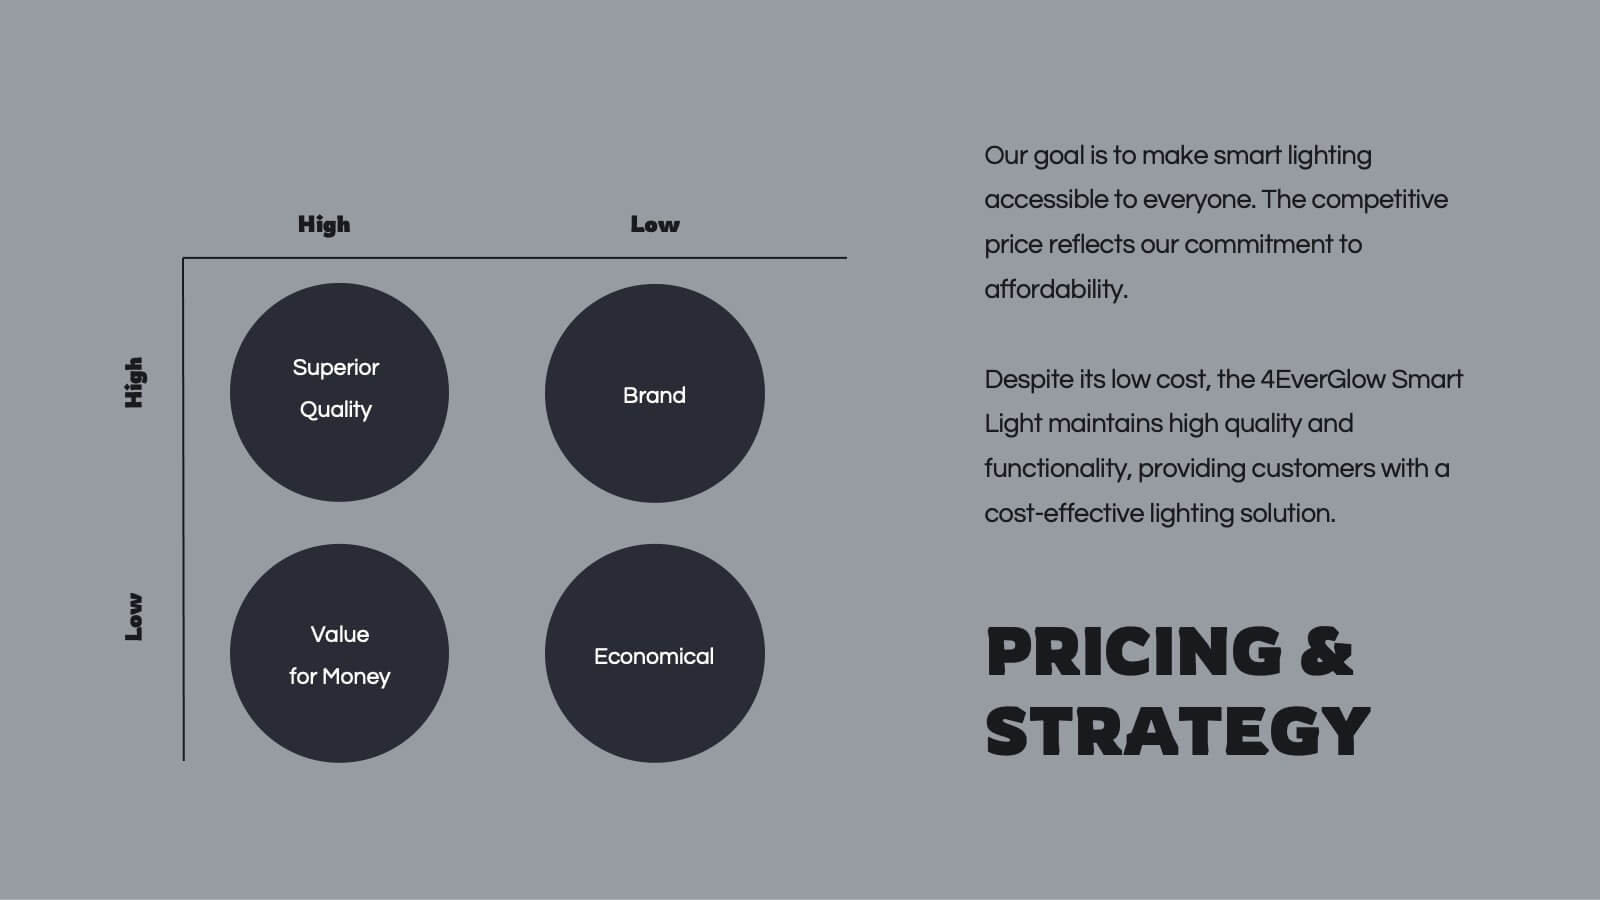
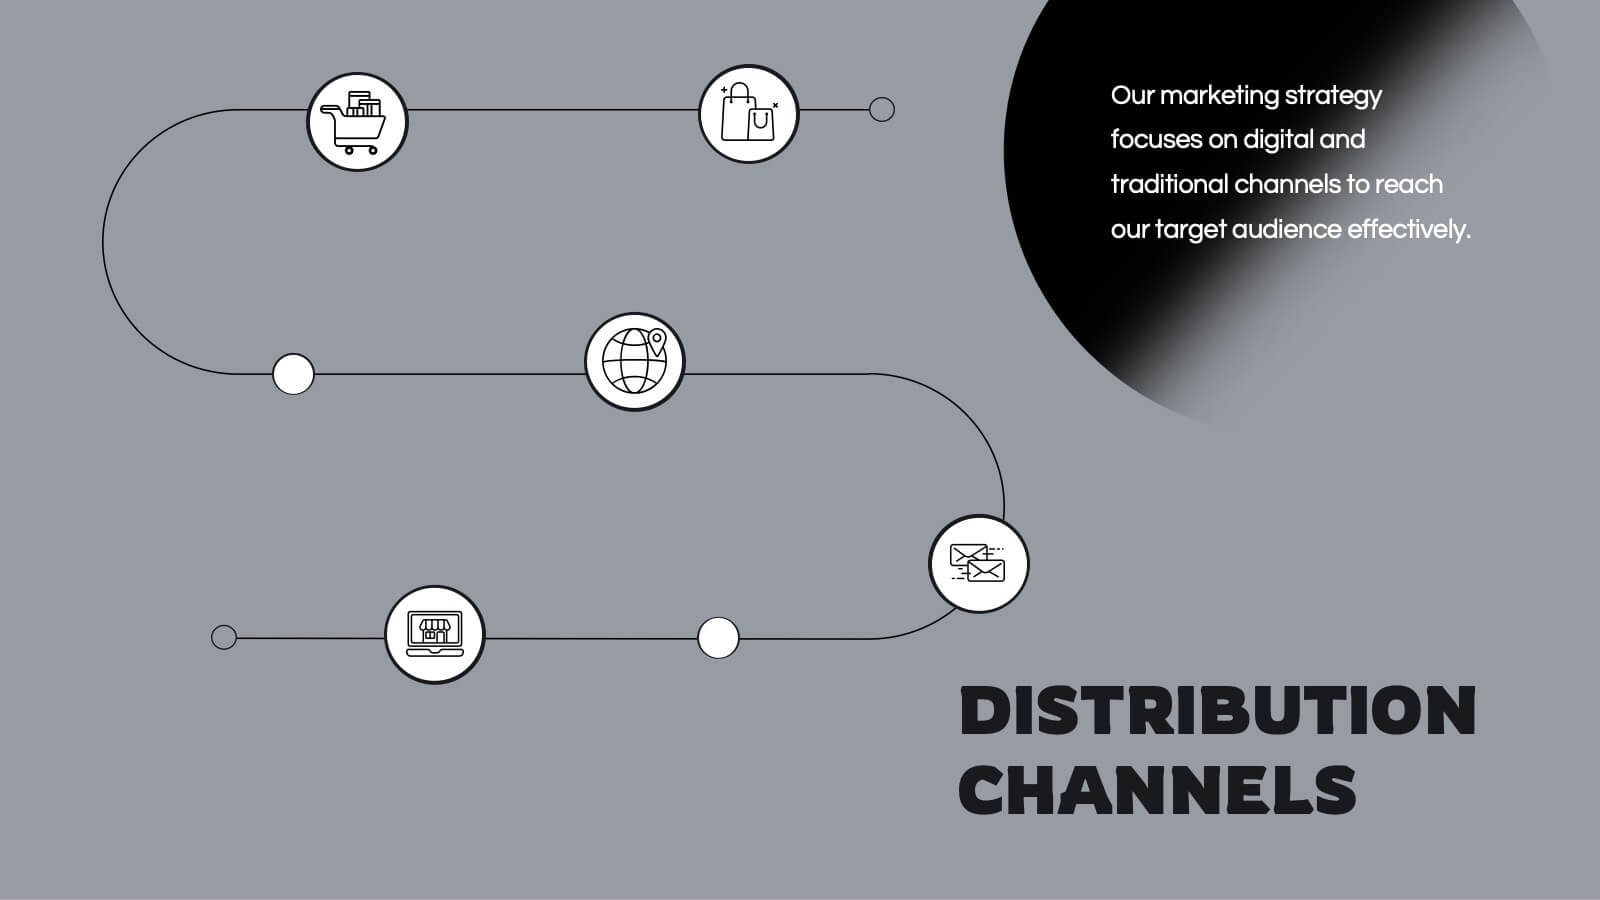
Spinel Product Strategy Report Presentation
Take your product strategy to the next level with this polished, spinel-inspired presentation! Designed to effectively communicate your product's goals, market analysis, and strategy roadmap, this template is both visually striking and easy to navigate. Its sharp design ensures a professional touch. Compatible with PowerPoint, Keynote, and Google Slides.


7 slides
Cloud Infographic Presentation Template
This Cloud infographic, is a versatile and professional template designed for corporate presentations. This is perfect for businesses and organizations in the technology and IT field, as well as any company looking to showcase their data and information in a visually appealing way. This template features a corporate style with a blue theme, which gives it a professional look and feel. The slides are filled with icons, and other visual elements that will help you communicate your message in an effective way. This template has everything you need to create an engaging and informative presentation.


3 slides
Search Engine Optimization Strategy Presentation
Stand out in your next presentation with this dynamic visual breakdown of digital visibility tactics. Perfect for marketers, business owners, or SEO specialists, this colorful circular infographic highlights the key pillars of a search strategy in a way that's both professional and easy to follow. Compatible with PowerPoint, Keynote, and Google Slides.


6 slides
Workflow and Operations Flow Presentation
Optimize your operations with the Workflow and Operations Flow presentation. This structured and visually appealing template helps you map out workflows, streamline processes, and enhance team coordination. Perfect for project managers, business analysts, and operational leaders, these fully editable slides allow you to visualize key steps and dependencies with ease. Compatible with PowerPoint, Keynote, and Google Slides.


6 slides
Sales Team Infographic
The series presented showcases various slide templates tailored for enhancing sales team strategies and communication. Each slide is crafted to assist sales professionals in detailing team structures, sales goals, performance metrics, and strategic initiatives effectively. Utilizing vibrant color blocks and streamlined design elements, these templates make complex sales data approachable and engaging, facilitating clear and impactful presentations. The collection is designed with adaptability in mind, incorporating elements that can be easily customized to fit different team needs and company branding. These include comparative layouts for benchmarking, timeline formats for showcasing sales cycles, and diagrammatic representations for visualizing sales processes and results. Perfect for internal meetings, sales training sessions, and stakeholder presentations, these templates serve as essential tools for sales leaders to convey their team’s progress, celebrate wins, and strategize for future sales endeavors.


29 slides
Shadowglow Brand Guidelines Proposal Presentation
Present a cohesive brand vision with this professional template, designed for crafting detailed and visually compelling brand guidelines. Highlight essential components like brand vision and mission, brand values, and identity elements, including color palettes, typography, and imagery. This template seamlessly incorporates customer personas, tone and voice guidelines, and brand touchpoints to define the essence of your brand's communication. Utilize slides for website, social media, and packaging strategies to establish consistency across all platforms. Customizable and compatible with PowerPoint, Google Slides, and Keynote, this design ensures clarity and professionalism, making it ideal for agencies or teams presenting comprehensive brand proposals.


5 slides
Customer Experience Empathy Map Presentation
Enhance Customer Understanding with the Empathy Map Presentation! This Customer Experience Empathy Map template is designed to help businesses visualize customer needs, thoughts, emotions, and behaviors for improved engagement and strategy. Featuring a clear quadrant-based layout, this template allows you to map out customer insights, pain points, and expectations for more effective decision-making. Ideal for marketers, UX designers, and business strategists, this fully editable template is compatible with PowerPoint, Keynote, and Google Slides, making


5 slides
New Hire Orientation Program
Welcome new employees with confidence using the New Hire Orientation Program Presentation. This step-by-step slide is designed to outline your company’s onboarding journey in five clear, structured stages. With labeled “Step 01” through “Step 05” banners, icon placeholders, and editable text boxes, this template is ideal for HR teams, managers, or team leads introducing company values, processes, or benefits. Available in both full-color and progressive highlight variations, it's fully customizable in PowerPoint, Keynote, and Google Slides.


4 slides
Strategic Planning Business Framework Presentation
Sharpen your strategic vision with the Strategic Planning Business Framework presentation. This modern, radial diagram slide uses a target-and-arrow layout to symbolize precision, focus, and goal alignment across four key business areas. Each quadrant features customizable sections for initiatives, insights, or performance metrics—ideal for planning sessions, quarterly reviews, or executive briefings. The clean design and visual balance make your content easy to understand at a glance. Fully editable and compatible with PowerPoint, Keynote, and Google Slides.


6 slides
Roles and Responsibilities for Teams Presentation
Clearly outline team functions with this roles and responsibilities presentation. Highlight up to five individual positions using intuitive icons and clean visual layouts. Perfect for onboarding, team structuring, or project assignments. Fully editable in PowerPoint, Keynote, and Google Slides—ideal for aligning expectations and improving team collaboration across departments or initiatives.


26 slides
Orion Creative Agency Pitch Deck Presentation
The Orion Creative Agency Portfolio is a visually stunning and comprehensive presentation template designed to showcase your agency's unique strengths and achievements. The first slide sets the tone with a clean and modern design, perfect for capturing your audience's attention. Following the introduction, the template takes you through an impressive journey of client success stories, highlighting the impact and value your agency brings to the table. The industry trend analysis and competitive landscape sections offer a deep dive into the market, positioning your agency as a leader in the field. You'll also find dedicated slides for your approach, creative process, and campaign execution, ensuring every detail of your agency's methodology is presented clearly. Testimonials and partnership opportunities add credibility, while the future outlook and social impact initiatives highlight your agency's forward-thinking and commitment to positive change. This template is fully compatible with PowerPoint, Keynote, and Google Slides, making it an ideal choice for any agency presentation.


6 slides
Six Sigma DMAIC Cycle Overview Presentation
Present each phase of the DMAIC methodology with the Six Sigma DMAIC Cycle Overview Presentation. This clean and professional layout walks through Define, Measure, Analyze, Improve, and Control in a clear, easy-to-follow structure. Perfect for Six Sigma professionals, quality managers, and operational teams. Fully editable in Canva, PowerPoint, Keynote, and Google Slides.


5 slides
Organizational Management Frameworks Overview Presentation
Clarify reporting lines and decision-making roles with the Organizational Management Frameworks Overview Presentation. This clean and color-coded hierarchy chart helps visualize team structure, leadership levels, or departmental breakdowns. Ideal for organizational design, onboarding, or strategic alignment discussions, each placeholder is fully customizable to reflect your company’s framework. Compatible with PowerPoint, Keynote, and Google Slides—perfect for HR professionals, managers, and consultants seeking structure and clarity.


20 slides
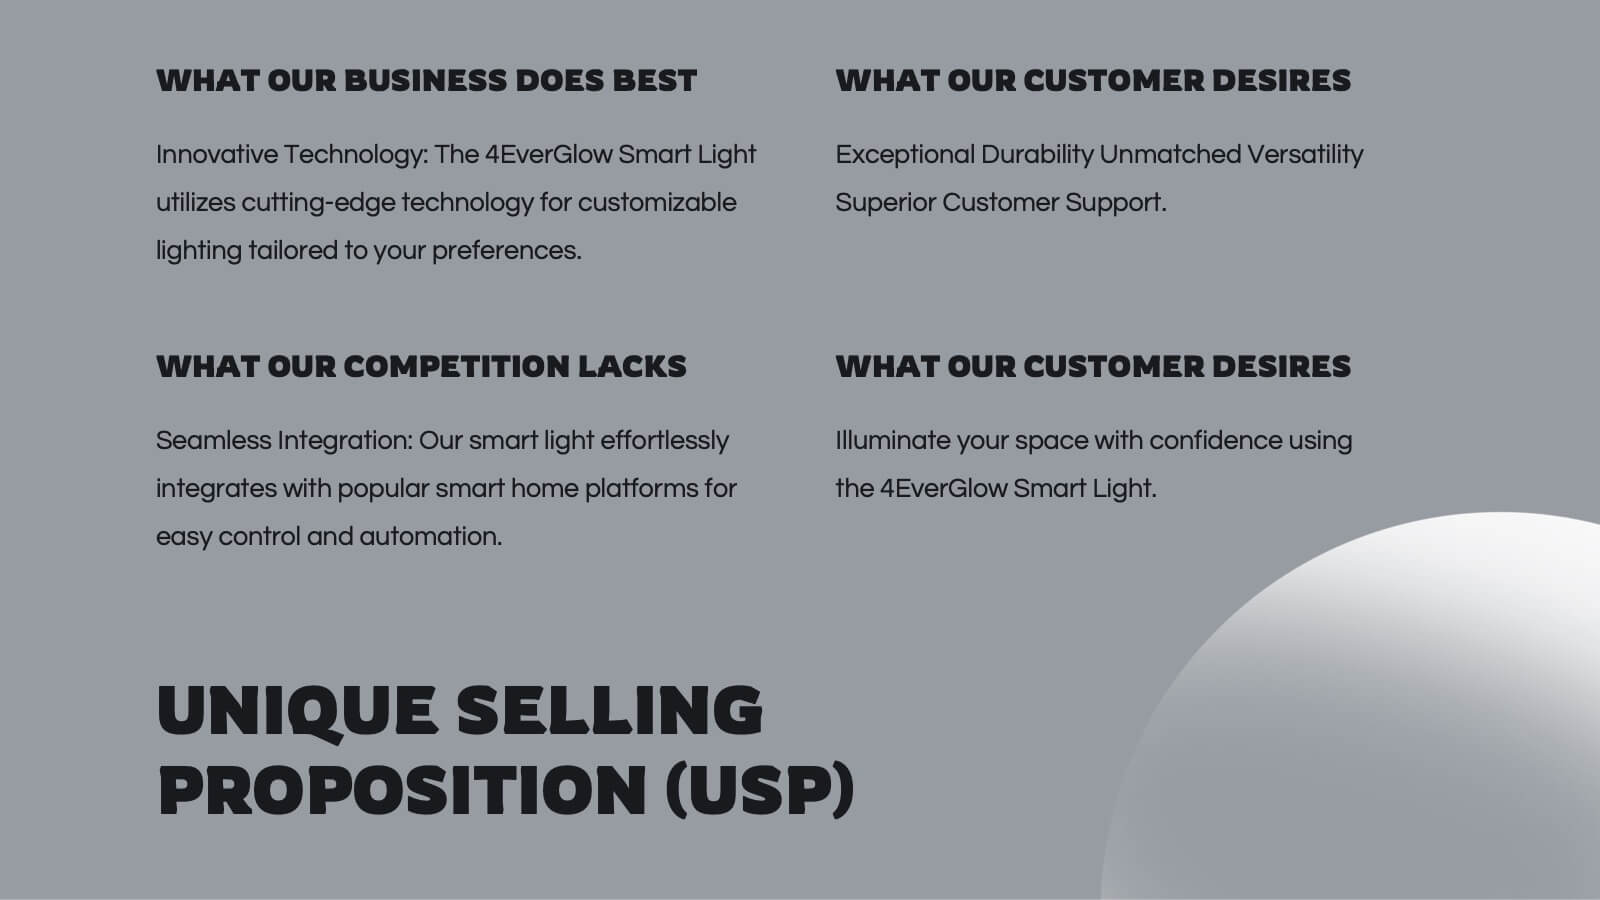
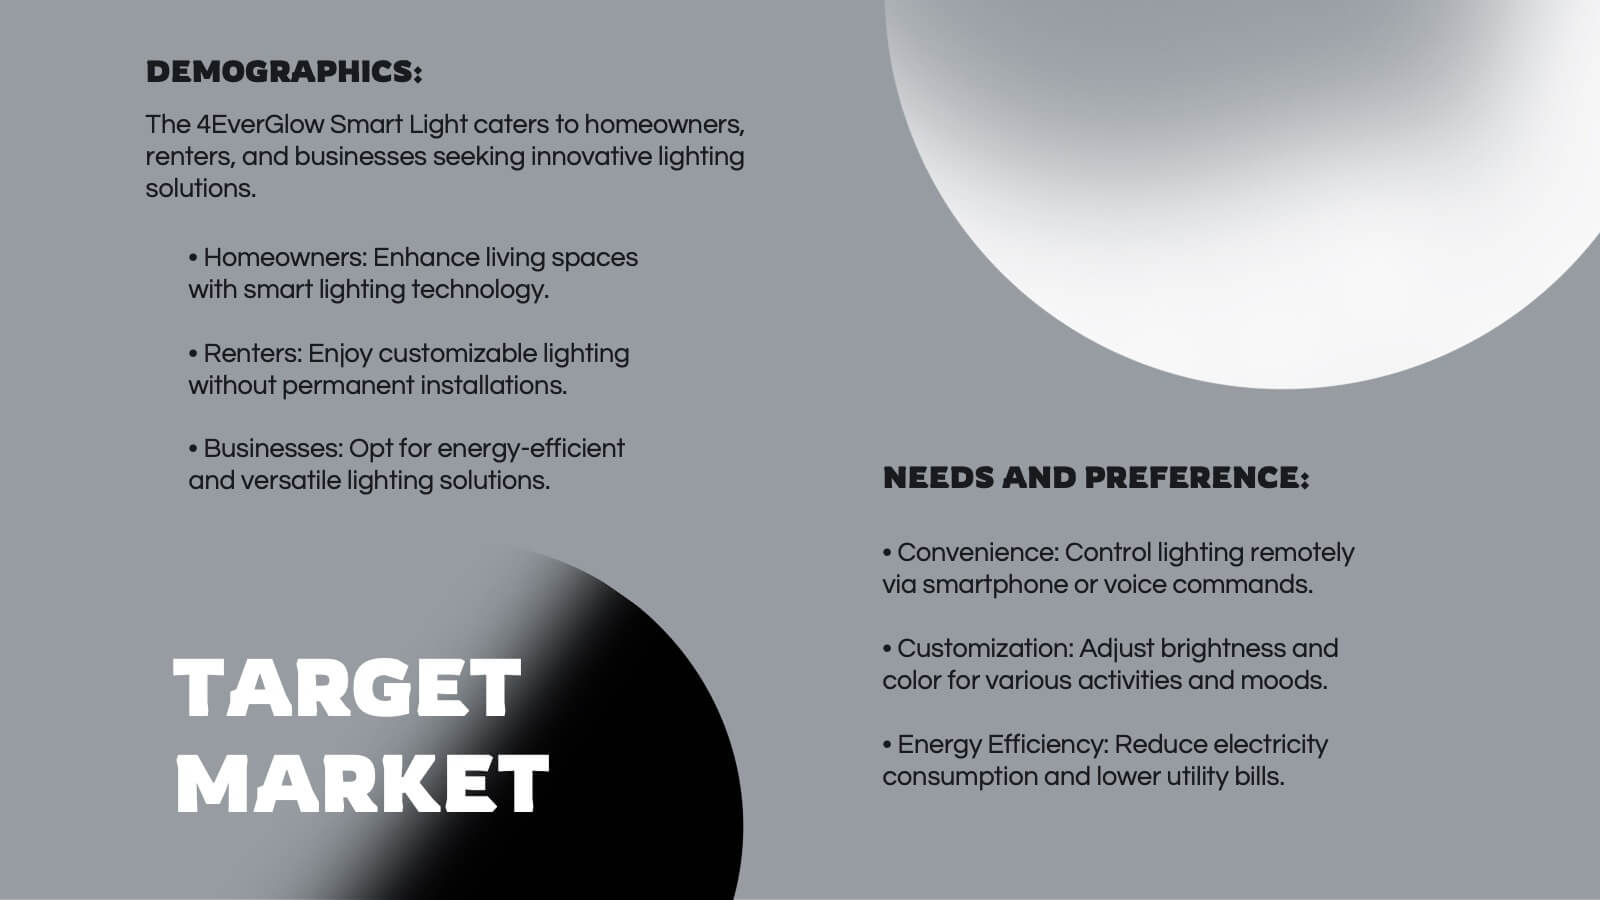
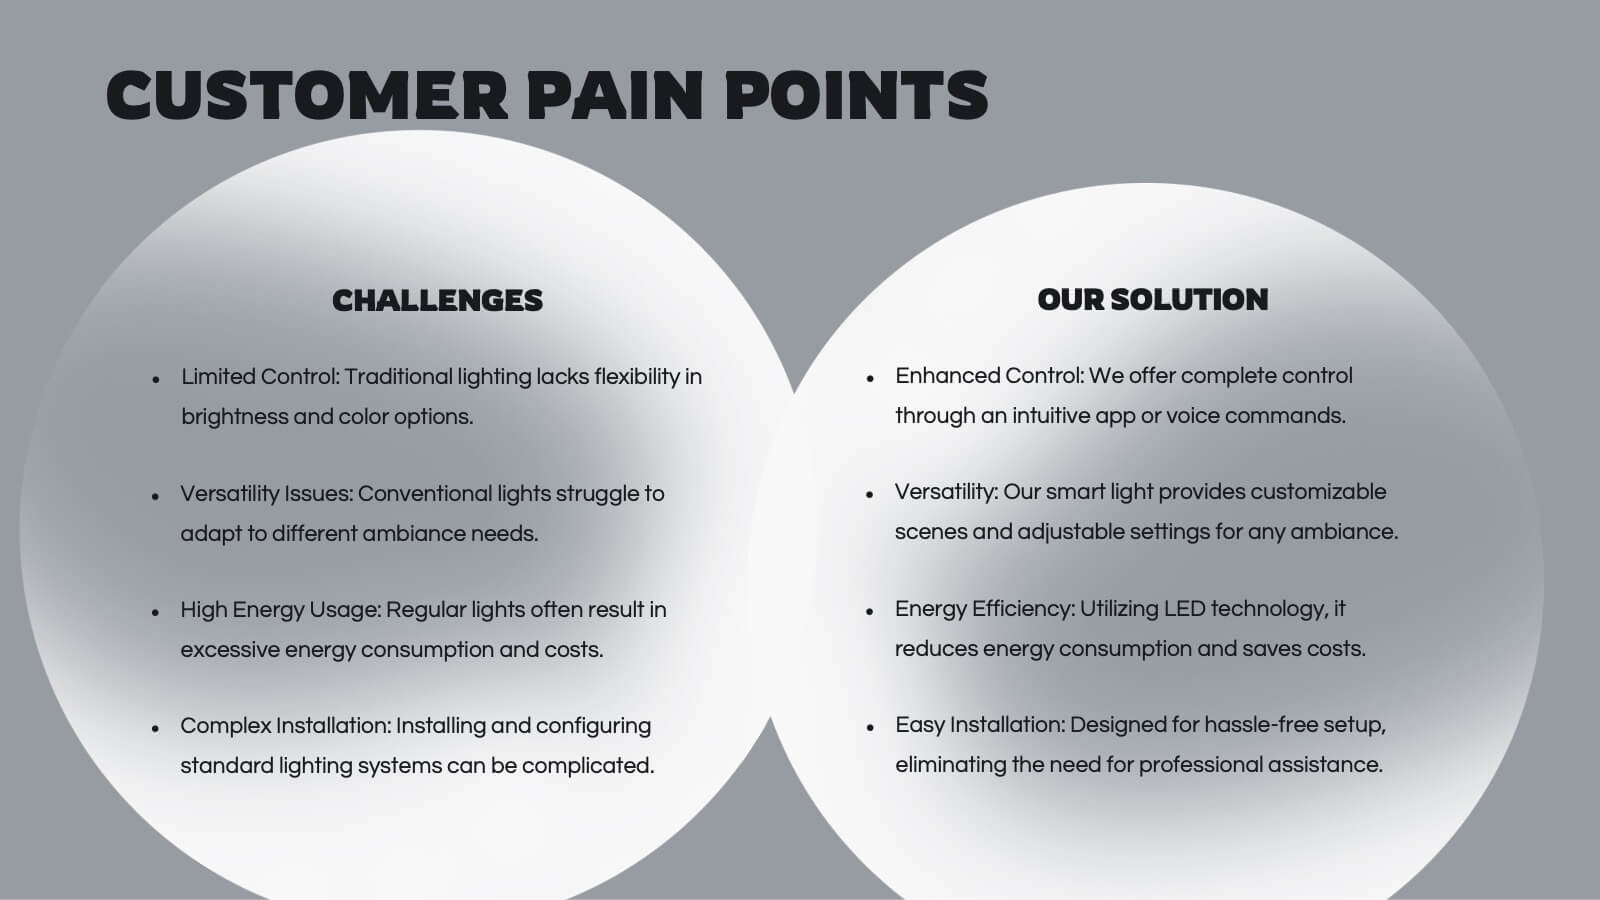
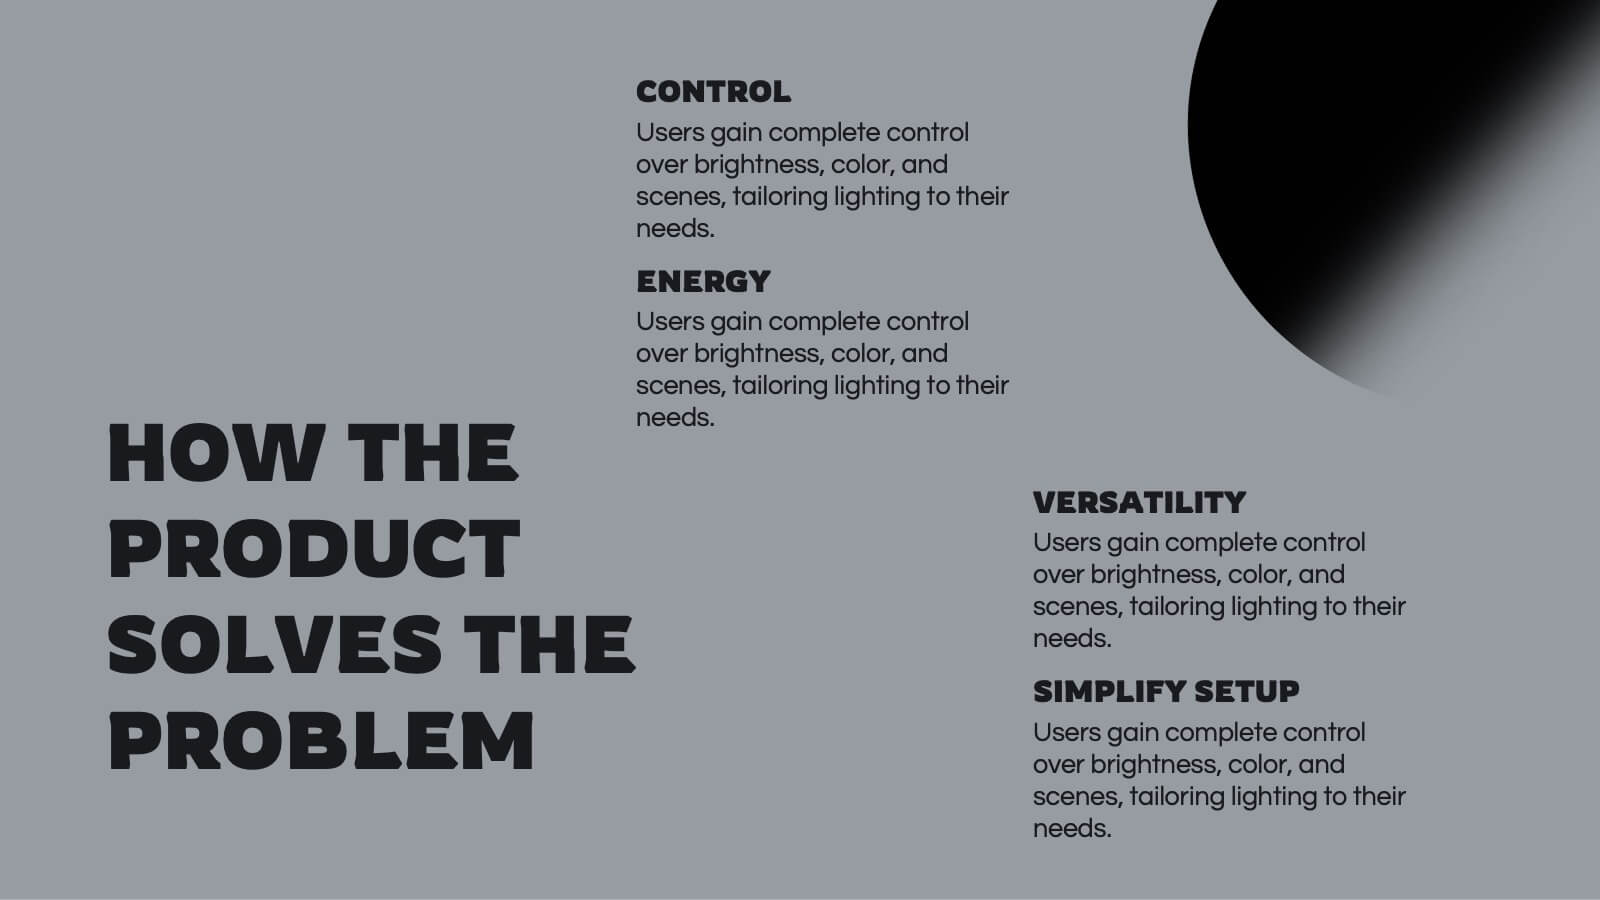
Cinderbark Product Launch Pitch Deck Presentation
Showcase your product launch with a sleek, modern, and professional pitch deck template. This design empowers you to captivate stakeholders by clearly presenting your problem statement, unique solutions, and market opportunity. Effectively highlight your target audience, revenue model, and competitive landscape to demonstrate market viability. Create impact with visuals detailing your sales strategy, growth projections, and financial summary, ensuring transparency and confidence in your business plan. Timeline and milestone slides keep the focus on key achievements and future goals, while team introduction pages establish credibility and expertise. Fully customizable and compatible with PowerPoint, Google Slides, and Keynote, this template is ideal for startups, entrepreneurs, and product managers aiming for a polished and compelling presentation. Tailor it to your needs and deliver your vision with clarity and style.


6 slides
Canvas Breakdown for Startup Strategy Presentation
Break down your startup strategy with this streamlined canvas layout. Designed for clarity and flow, this slide presents six core components in a visually engaging format. Ideal for early-stage founders, innovation teams, and pitch decks, it simplifies complex business models into clear, actionable sections for strategic alignment and storytelling.


2 slides
Corporate Identity and Services Overview Presentation
Clearly showcase your company’s offerings with the Corporate Identity and Services Overview Presentation. This modern, minimalist layout is ideal for highlighting key services, team roles, or business pillars with clarity and visual appeal. Fully editable in Canva, PowerPoint, and Google Slides for quick customization and professional results.