


Features
- 6 Unique slides
- Fully editable and easy to edit in Microsoft Powerpoint, Keynote and Google Slides
- 16:9 widescreen layout
- Clean and professional designs
- Export to JPG, PDF or send by email


Do you have any questions?
Recommend


7 slides
Target Market Segmentation Infographic Presentation
A Target Market refers to a specific group of customers or consumers that a company or organization aims to sell its products or services too. This template has a design that can compliment your company's or organization's branding elements to make it a professional looking presentation. This template is perfect for the audience with in-depth knowledge of marketing; the template allows you to include important facts and statistics that will make it easily understandable by all types of audiences. The template comes with different chart slides, nice color combinations and graphs!


6 slides
Process Direction Flow Mapping
Showcase linear progress with clarity using the Process Direction Flow Mapping Presentation. This layout features a clean, step-by-step directional flow with five stages, ideal for outlining project phases, business workflows, or timeline milestones. Each stage is color-coded with editable text areas, making it easy to customize and adapt for PowerPoint, Keynote, or Google Slides.


7 slides
System Solution Infographic Presentation
A System Solution infographic is a visual representation of a proposed solution to a specific problem or challenge within a system or organization. This template can be used to provide a clear and informative overview of the proposed solution, highlighting its key features, benefits, and potential impact. This infographic includes flowcharts, diagrams, and fun graphs to illustrate how the solution will work within the existing system. This template can be a useful tool for organizations who are seeking to implement a new solution or address a specific challenge within an existing system.


12 slides
Business Environmental Factors PESTEL Analysis Presentation
Visualize critical external influences on your business strategy with this Business Environmental Factors PESTEL Analysis slide. Designed for consultants, business analysts, and executive teams, this template uses a circular layout to highlight the six core PESTEL categories—Political, Economic, Sociocultural, Technological, Environmental, and Legal. Each segment is clearly marked with icons and labels, offering space to insert key insights or impact notes. Perfect for competitive analysis, board presentations, and long-term planning. Fully editable in PowerPoint, Keynote, and Google Slides.


9 slides
Business Dashboard Infographics
A business dashboard, often referred to as a business intelligence dashboard, is a visual representation of an organization's key performance indicators and critical business metrics. Empower your business analysis and strategy with our Infographic. This dynamic template enables you to present key business metrics, performance indicators, and trends in a clear and impactful manner. Compatible with Powerpoint, Keynote, and Google Slides. This template is a powerful tool to visualize your business progress, identify opportunities, and communicate your success story to viewers, clients, or team members.


5 slides
Business Process Cycle Presentation
Energize your message with a clean, visual journey that turns complex workflows into an easy-to-follow cycle. This presentation helps you explain stages, roles, and transitions with clarity while keeping your audience focused on what matters. Designed for business process overviews and strategy talks, it works seamlessly in PowerPoint, Keynote, and Google Slides.


8 slides
Business Value Proposition
Clearly communicate your brand’s core value with this quadrant-style slide, ideal for pitching key benefits, market differentiators, or service pillars. Designed for product managers, marketers, and business consultants. Fully editable in PowerPoint, Keynote, and Google Slides—customize icons, titles, and layout with ease.


20 slides
Dreamspire Academic Research Report Presentation
Present your research findings with impact using this bold and dynamic report template! It includes essential sections such as objectives, methodology, key findings, and future research directions, ensuring a comprehensive overview. Perfect for academic, business, or industry research presentations, this template is fully compatible with PowerPoint, Keynote, and Google Slides.


14 slides
Leadership Training Workshop
Build stronger leaders with a visually engaging puzzle-style layout that maps out each stage of leadership development. This training workshop presentation uses an intuitive, step-by-step format to guide your audience through key growth areas, making it perfect for team-building or executive sessions. Fully compatible with PowerPoint, Keynote, and Google Slides.


6 slides
Business Strategy Pyramid Presentation
Outline your strategic priorities with clarity using the Business Strategy Pyramid Presentation. This template features a five-step 3D pyramid that highlights key business goals, initiatives, or stages. Each layer includes icons and numbered sections for easy interpretation. Ideal for strategy meetings, executive briefings, and growth plans. Fully editable in PowerPoint, Keynote, and Google Slides.


6 slides
Concentric Circles Strategy Infographics
Visualize your strategic approach with our Concentric Circles Strategy infographic template. This template is fully compatible with popular presentation software like PowerPoint, Keynote, and Google Slides, allowing you to easily customize it to illustrate and communicate your concentric circles strategy. The Concentric Circles Strategy infographic template offers a visually engaging platform to depict your strategy's core, intermediate, and peripheral elements. Whether you're a business leader, strategist, or planner, this template provides a user-friendly canvas to create informative presentations and effectively communicate your strategic vision. Enhance your strategic planning with this SEO-optimized Concentric Circles Strategy infographic template, thoughtfully designed for clarity and ease of use. Customize it to highlight the key components of your concentric circles strategy, ensuring that your team and stakeholders grasp the strategic direction clearly. Start crafting your personalized infographic today to drive alignment and execution of your strategic goals.


24 slides
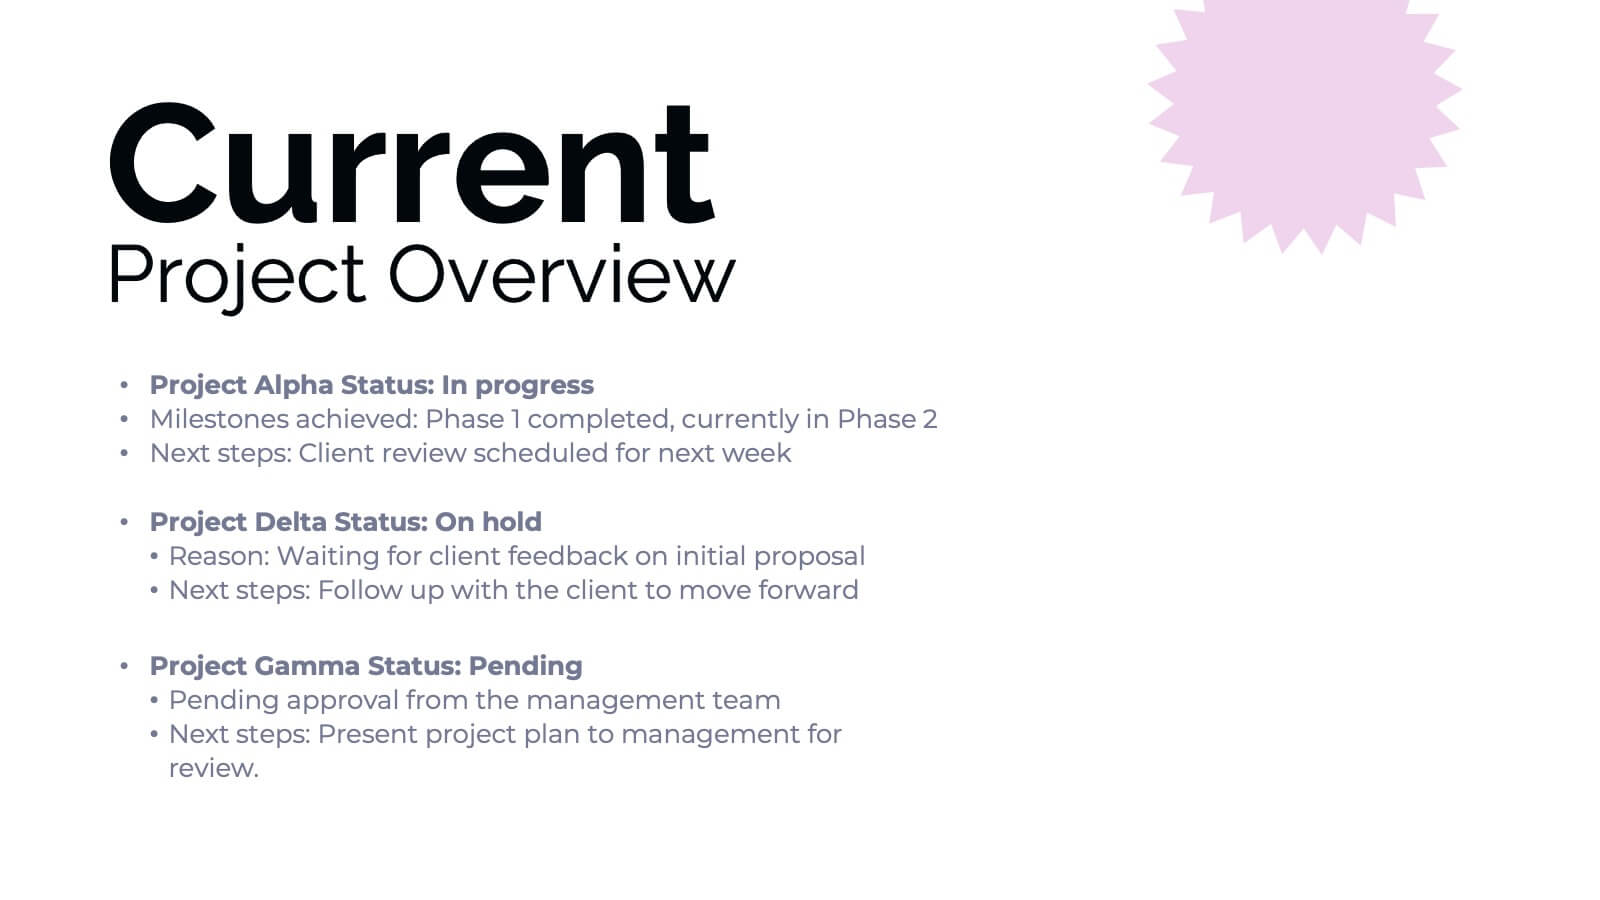
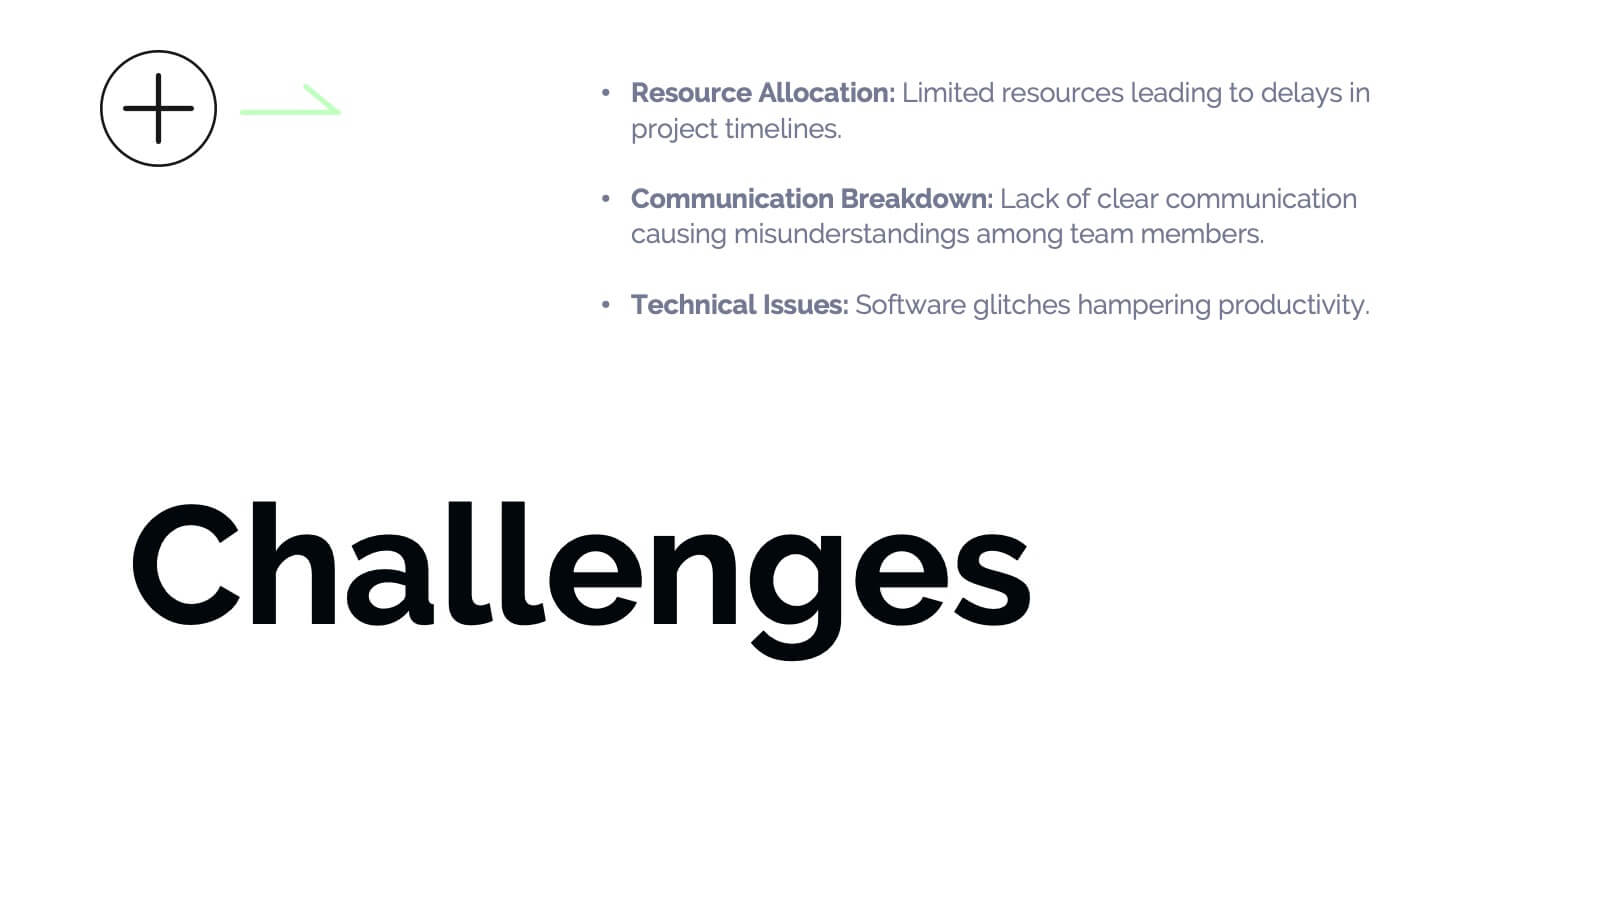
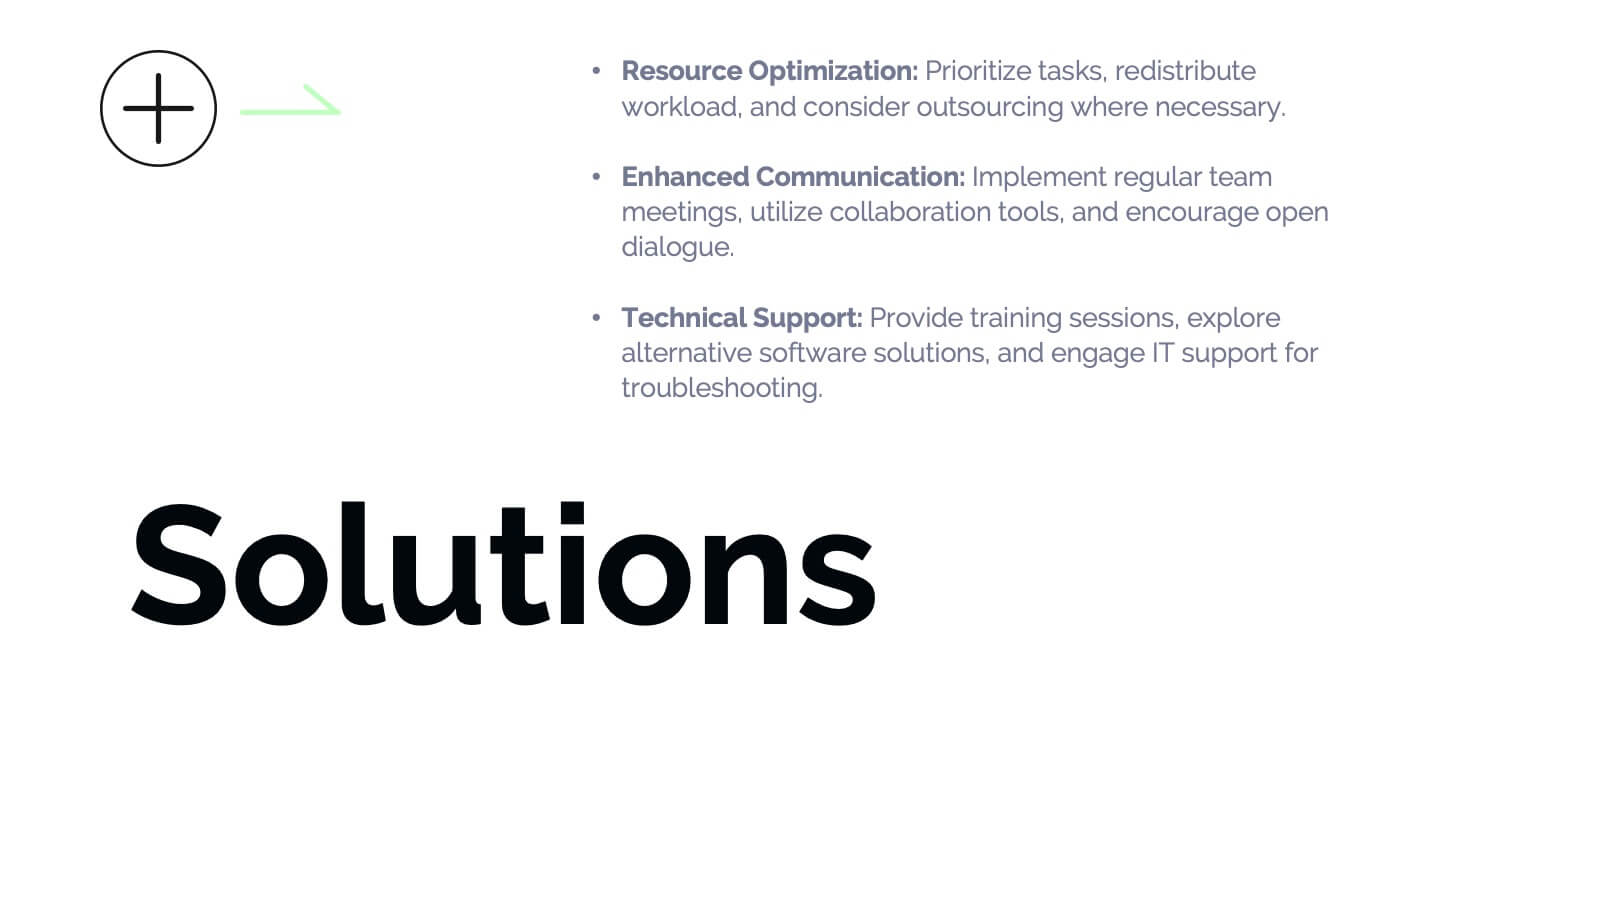
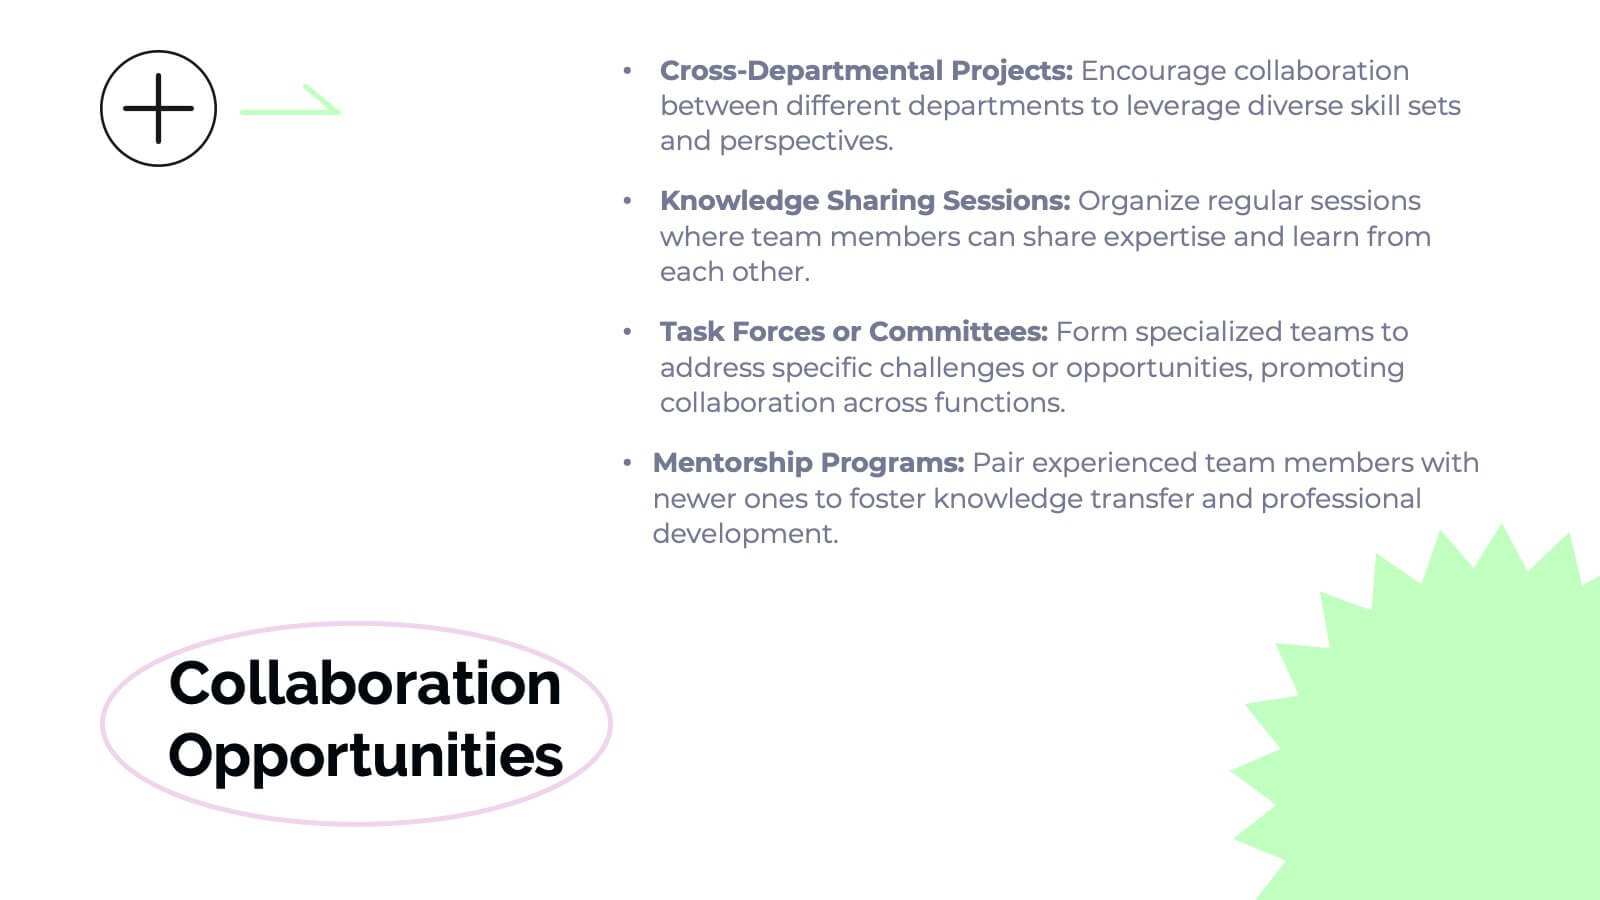
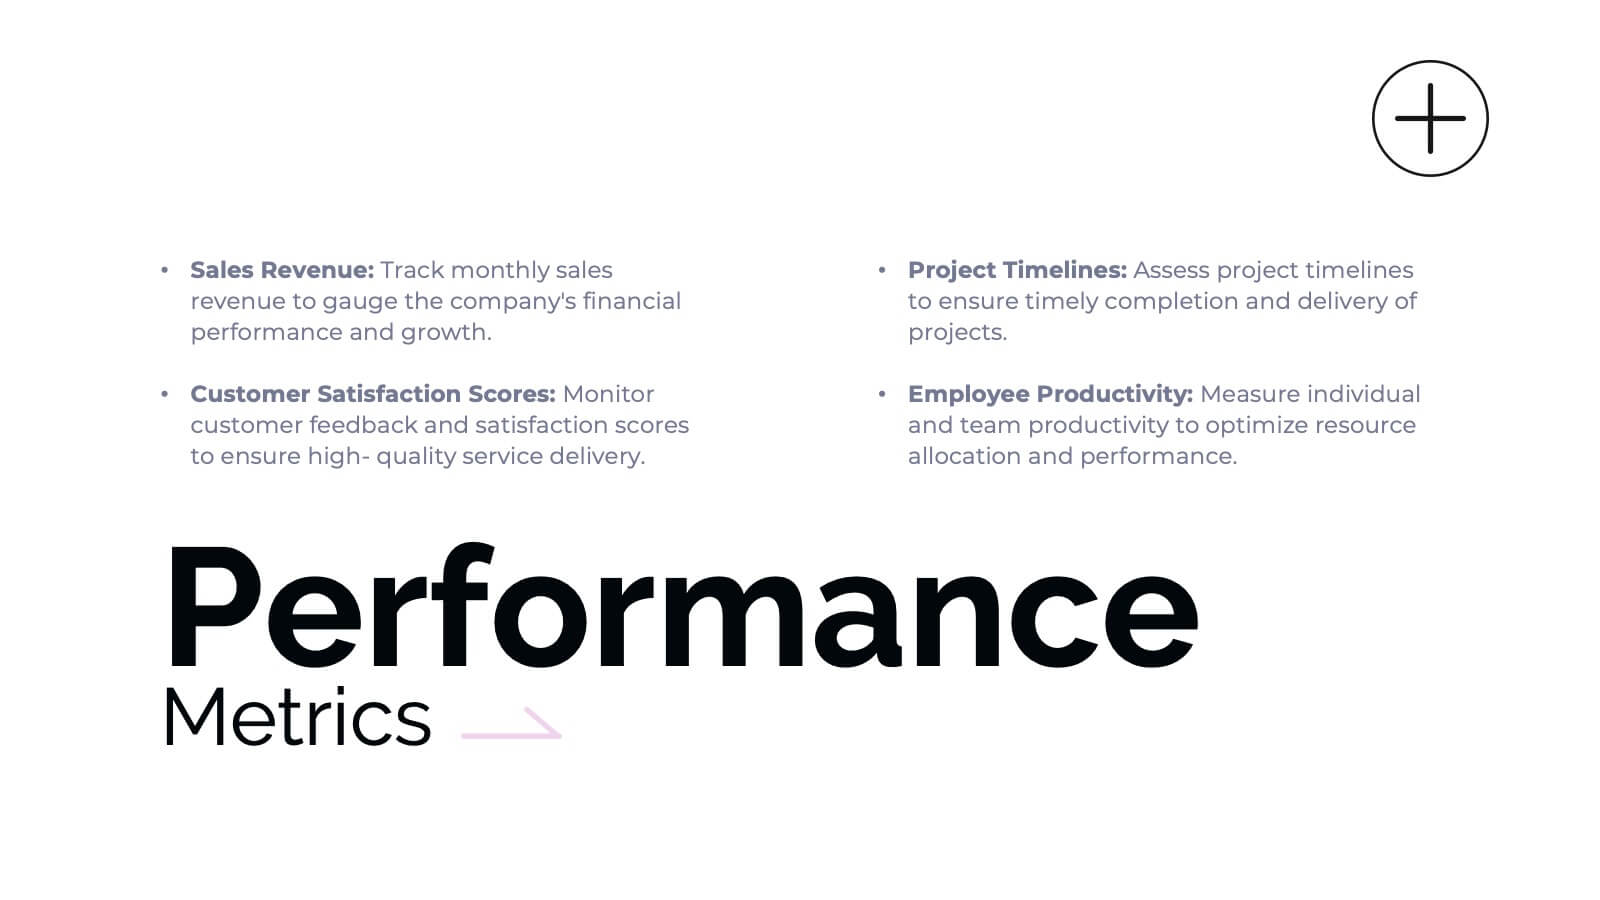
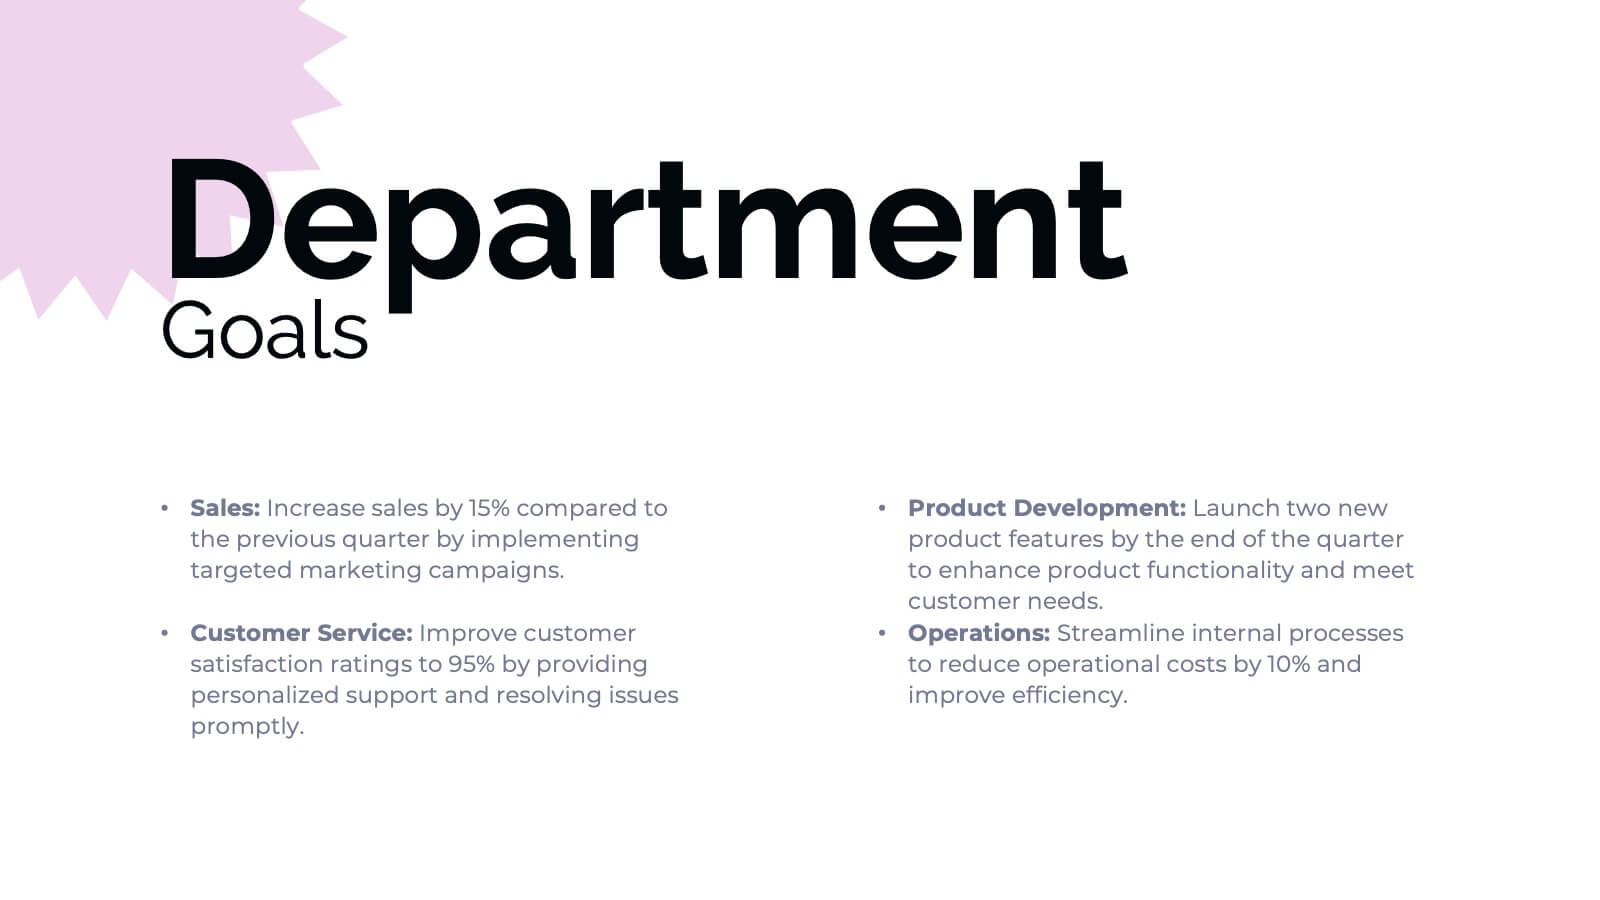
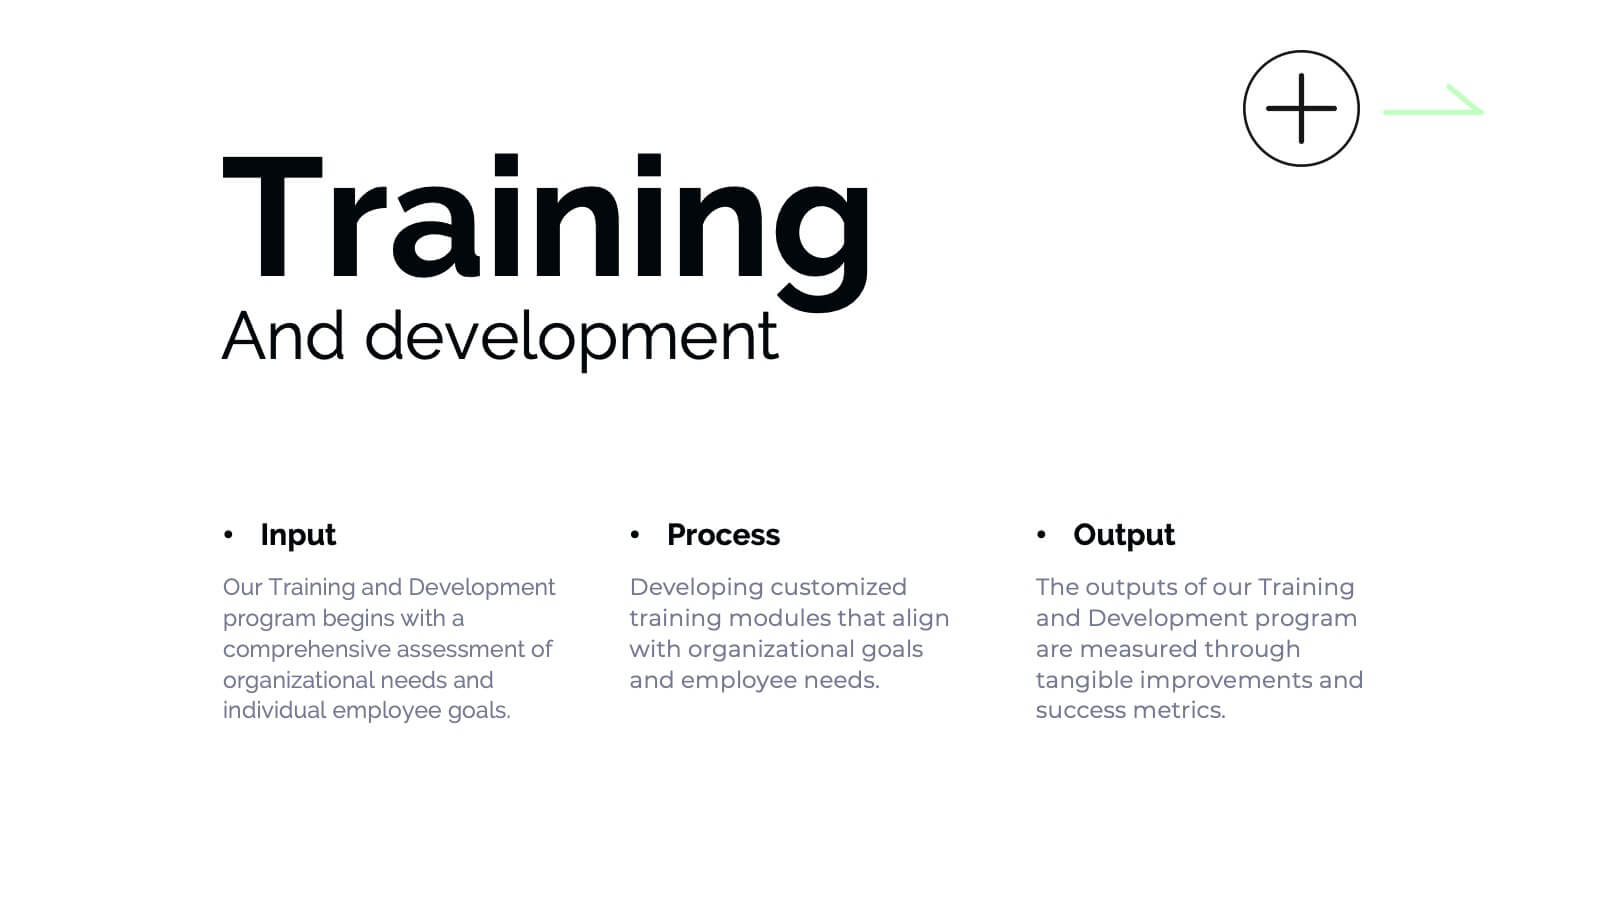
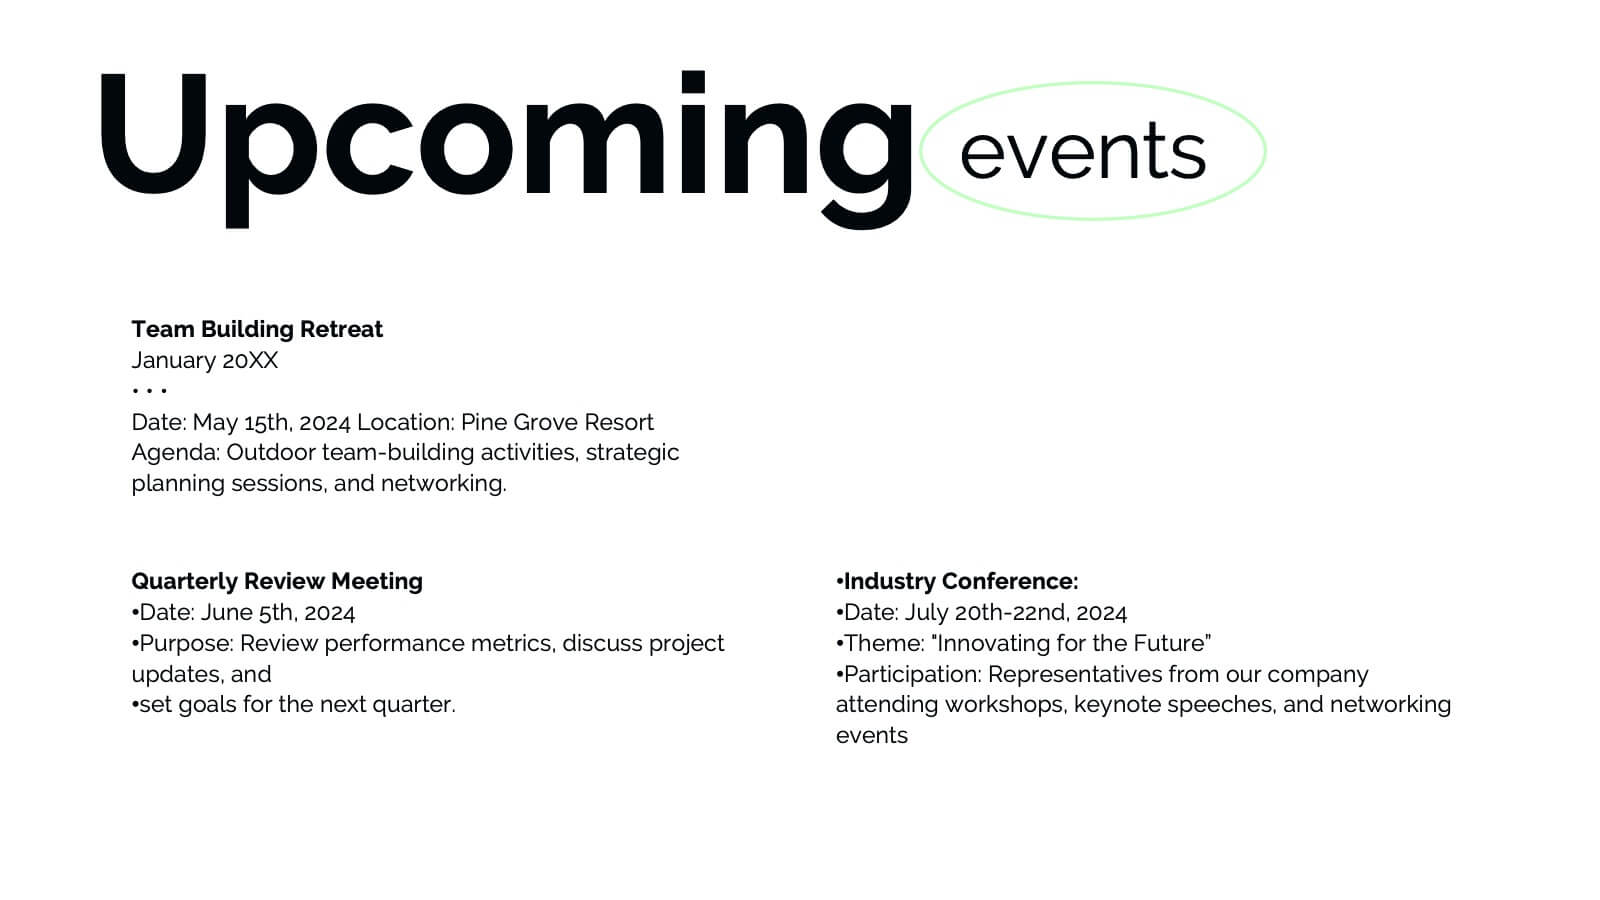
Banshee Business Operations Plan Presentation
Streamline your business operations with this comprehensive presentation template! From team updates and key achievements to challenges and solutions, every aspect of your business plan is covered. Ideal for tracking performance metrics, resource allocation, and upcoming events, this design keeps your operations organized and efficient. Compatible with PowerPoint, Keynote, and Google Slides for seamless integration.


23 slides
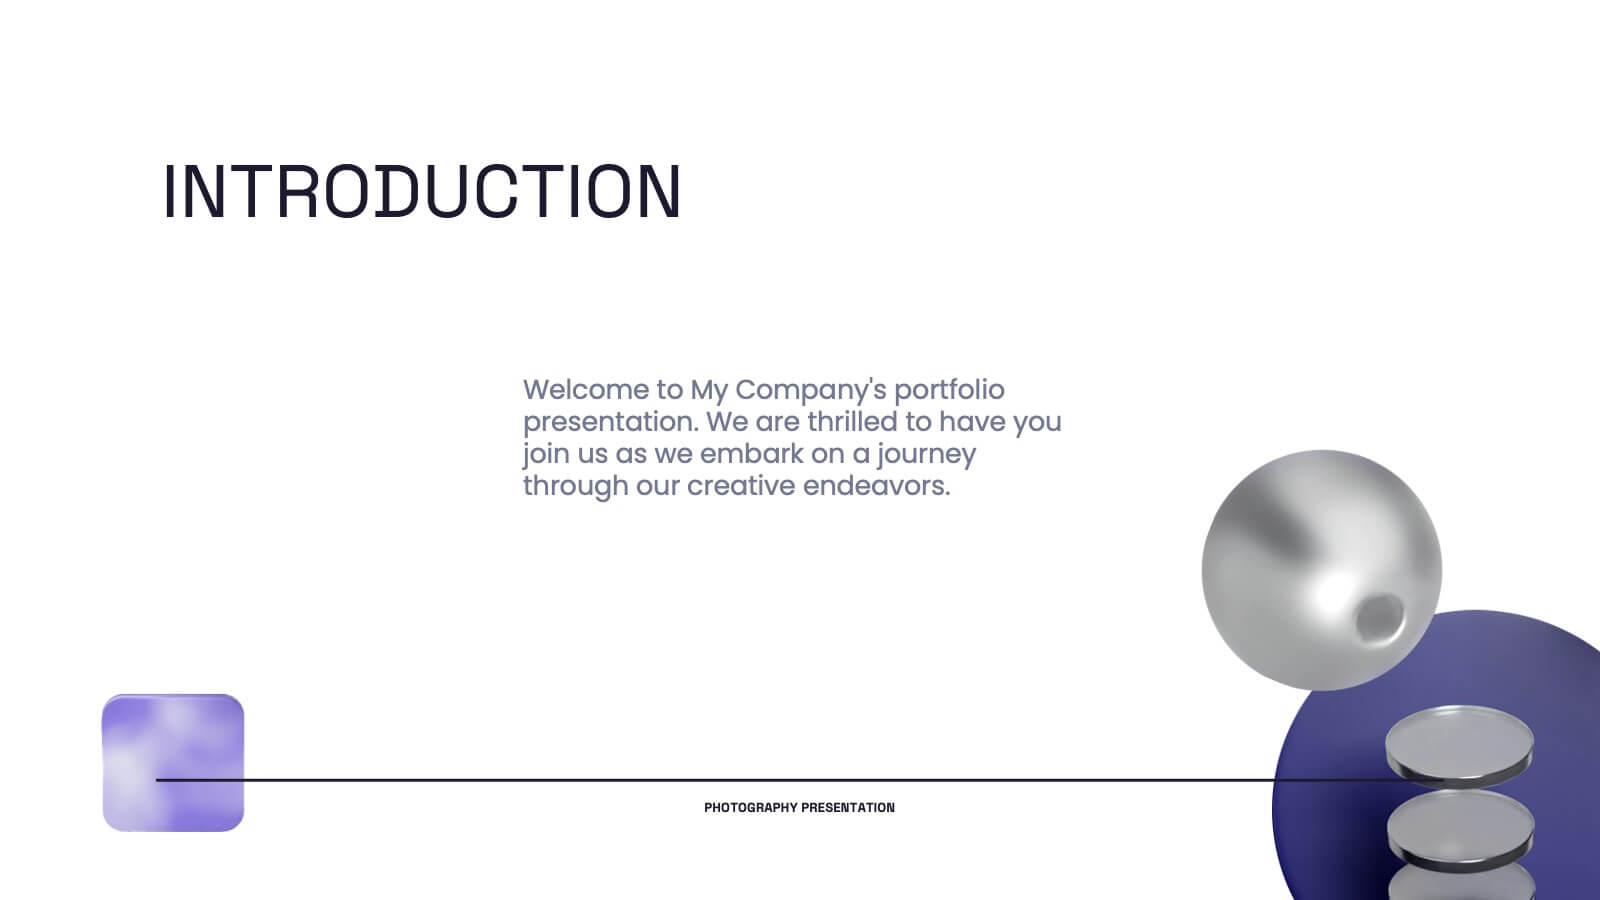
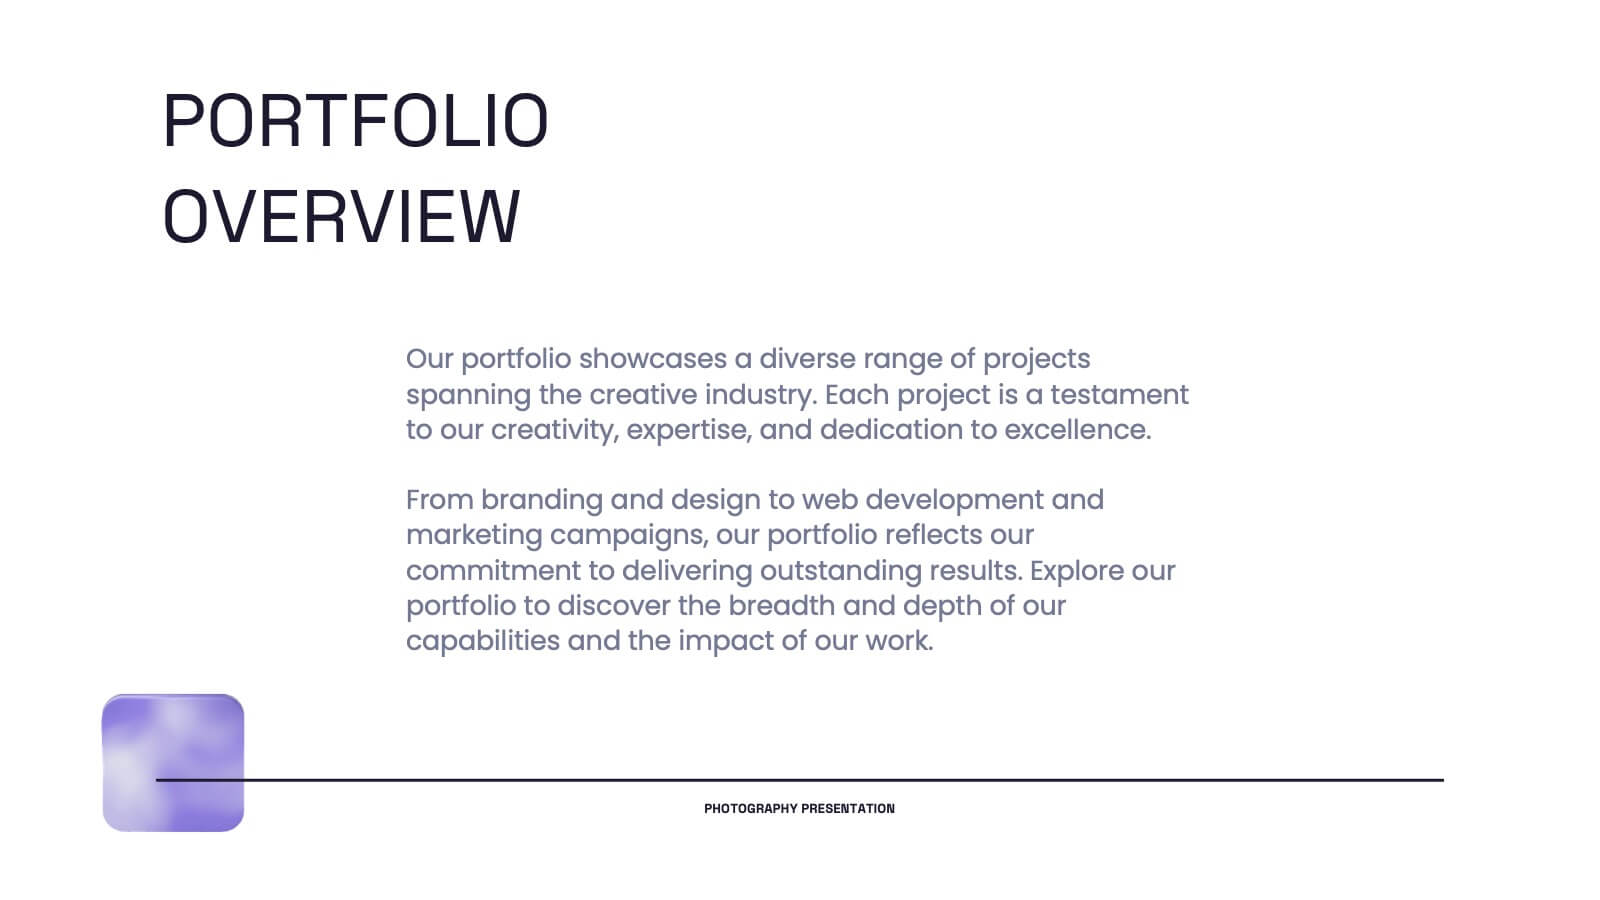
Pyroverse Photography Portfolio Presentation
Showcase your creative work effortlessly with this meticulously designed photography portfolio template. Tailored for photographers, this presentation highlights your style, achievements, and projects in a visually compelling format that speaks to your audience. This portfolio template includes dedicated slides for introducing your philosophy, showcasing your creative process, and presenting your best projects with high-impact layouts. Highlight client testimonials, collaborations, and awards to establish credibility and attract new clients. Additional slides for services, contact information, and social media links make it easier to connect with your audience. Compatible with PowerPoint, Google Slides, and Keynote, this template is fully customizable, allowing you to tailor it to your branding needs. Perfect for professional photographers, freelancers, and studios, this template ensures your portfolio stands out in a competitive market. Present your work with confidence and make a lasting impression with this professional design.


4 slides
Attention-Interest-Desire-Action Sales Strategy Presentation
Highlight each phase of your sales journey with this clean and modern AIDA model layout. Designed for clarity, it uses bold semicircle visuals and directional arrows to guide your audience from capturing attention to driving action. Perfect for sales teams, marketers, and consultants. Fully editable in PowerPoint, Keynote, and Google Slides.


23 slides
Wave Small Business Pitch Deck Presentation
This business pitch deck is your key to winning over investors! It covers everything from company background and product overview to SWOT analysis and market opportunity. With clear visuals of financial performance and strategic goals, this deck provides the perfect roadmap for success. Ideal for PowerPoint, Keynote, and Google Slides presentations!


10 slides
Cryptocurrency Market Trends
Highlight key movements in the crypto space with this 5-step 3D bar chart layout. Ideal for financial analysts, fintech startups, and blockchain professionals. Fully editable in PowerPoint, Keynote, or Google Slides—customize colors, text, and data to reflect your insights with precision.


7 slides
Business Funnel Infographic Presentation
A Funnel Infographic is used to help communicate the stages of a sales funnel in a transparent and visually appealing way. This is a marketing model that is used to track the journey from project to profit. This template includes a series of funnel-shaped graphics that represent the different stages of the sales funnel. You can customize this template with your own content, colors, and fonts to suit your specific needs. Add your own text to each stage of the funnel, and use the additional icons to represent each stage in more detail. Convey your marketing message with this Infographic!