


Features
- 5 Unique slides
- Fully editable and easy to edit in Microsoft Powerpoint, Keynote and Google Slides
- 16:9 widescreen layout
- Clean and professional designs
- Export to JPG, PDF or send by email


Do you have any questions?
Recommend


6 slides
Hierarchical Thought Flow Mind Map Presentation
Present your ideas with clarity using this Hierarchical Thought Flow Mind Map presentation. Designed for structured thinking, this layout displays six key concepts radiating from a central theme, making it ideal for workflows, strategies, or team roles. Fully editable in Canva, PowerPoint, and Google Slides for total customization.
22 slides
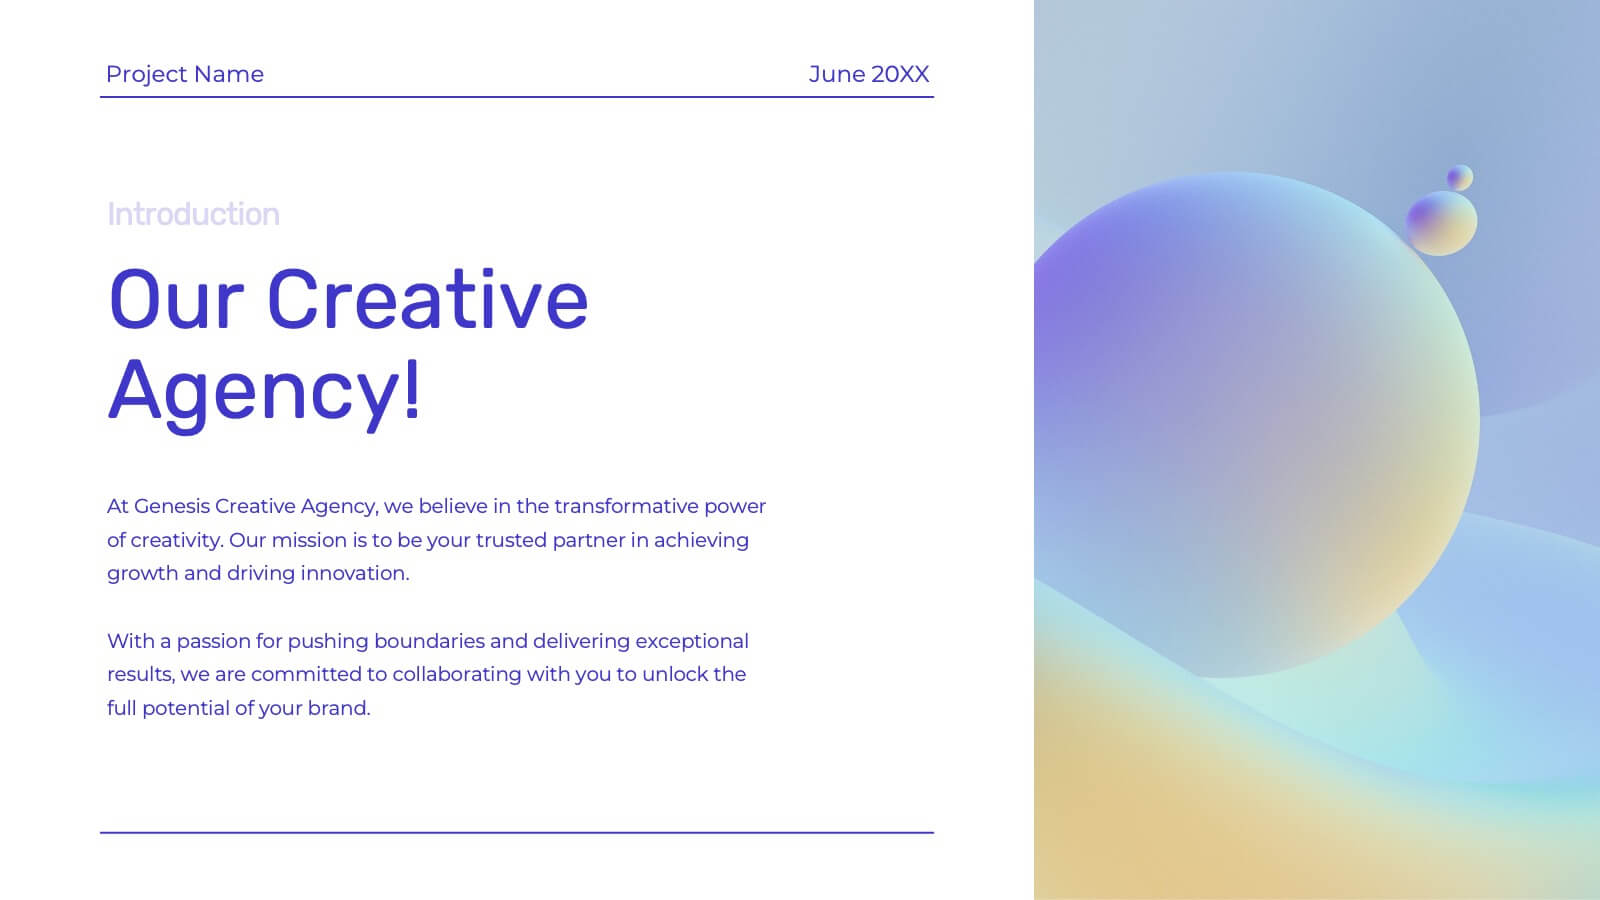
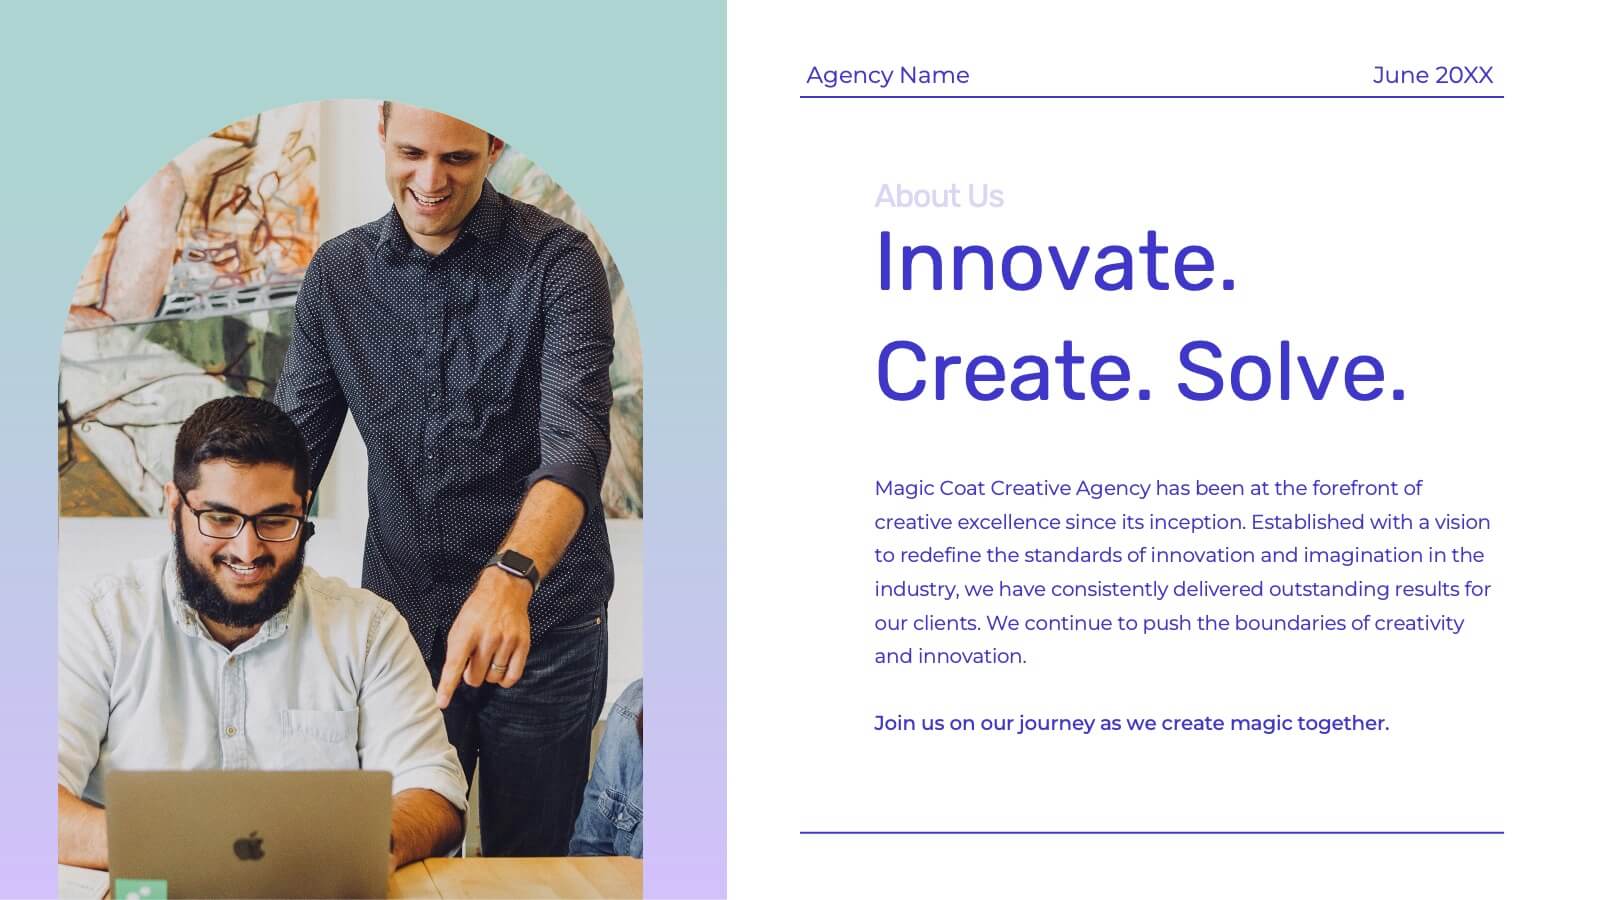
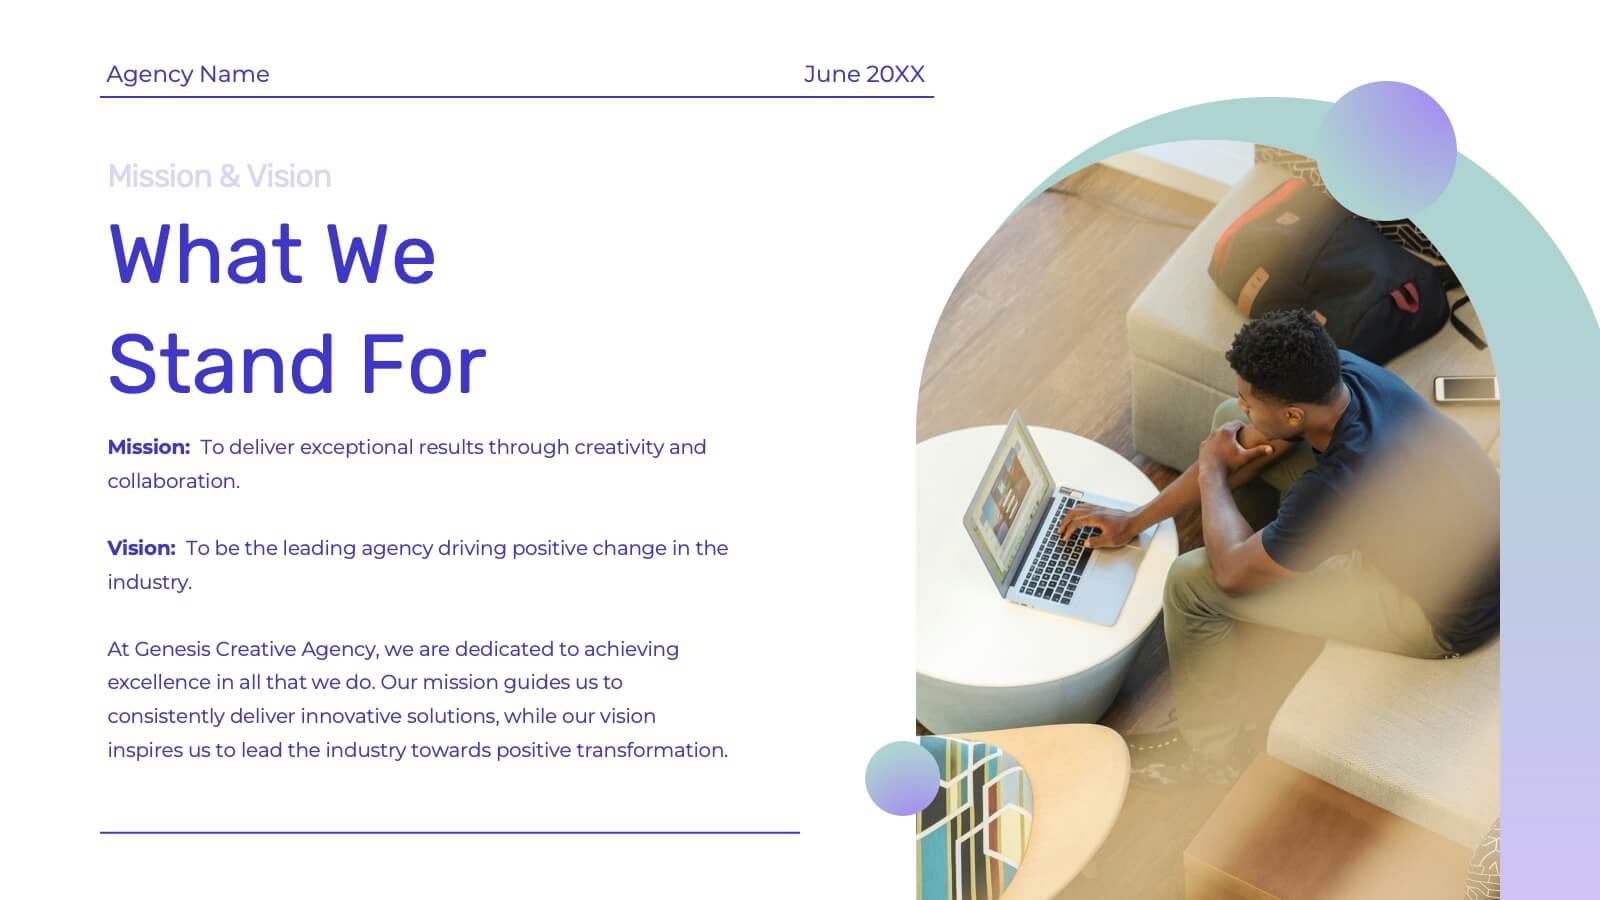
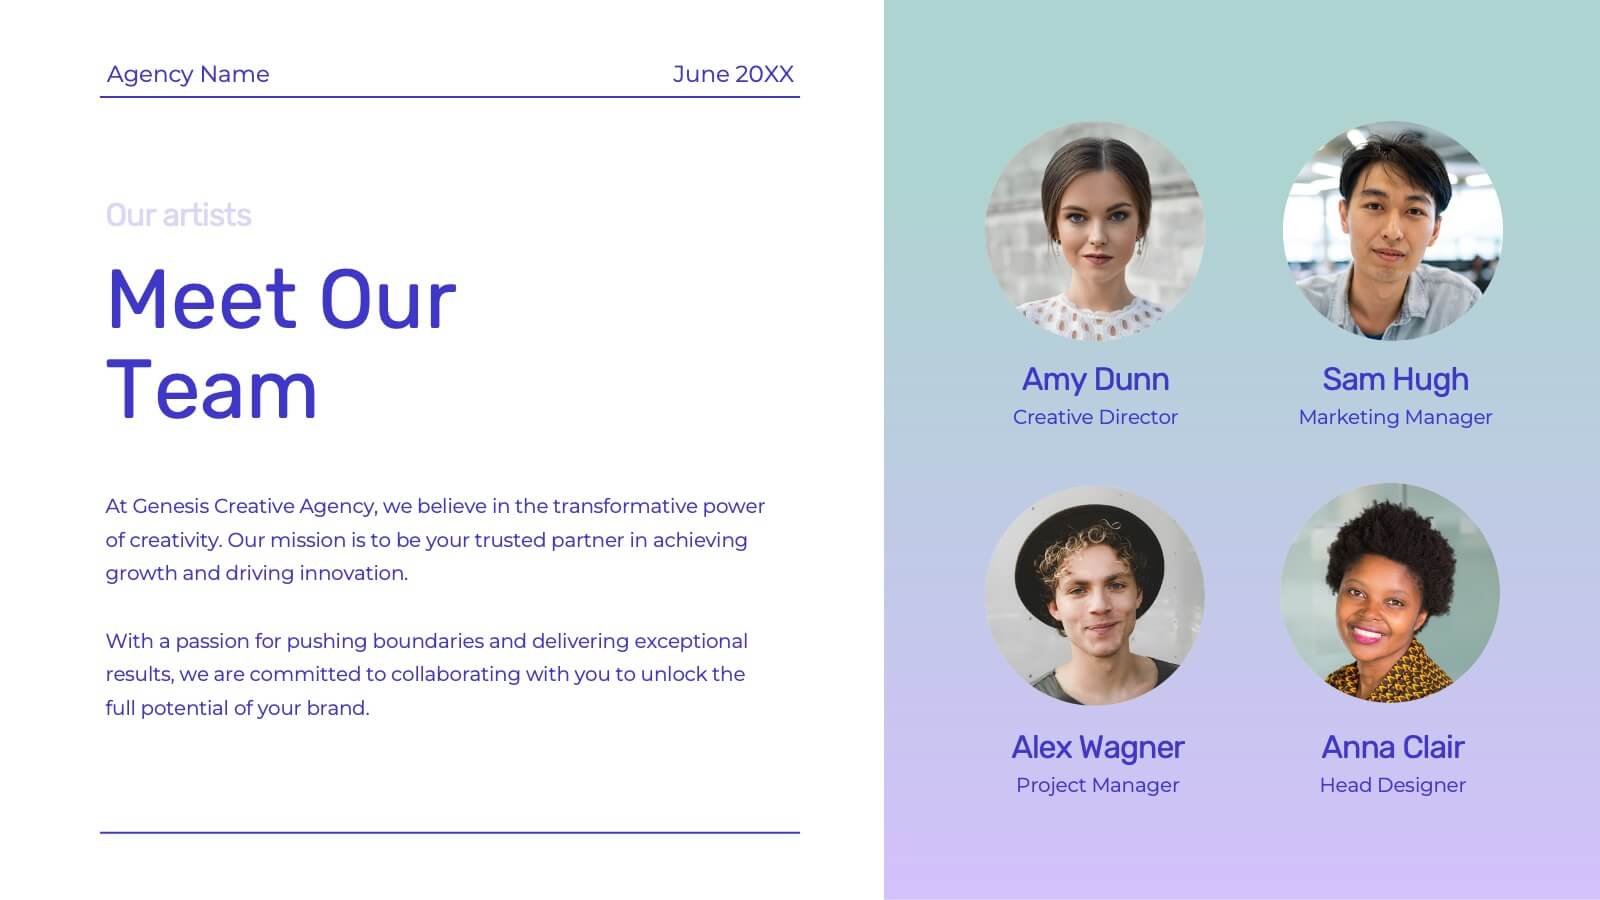
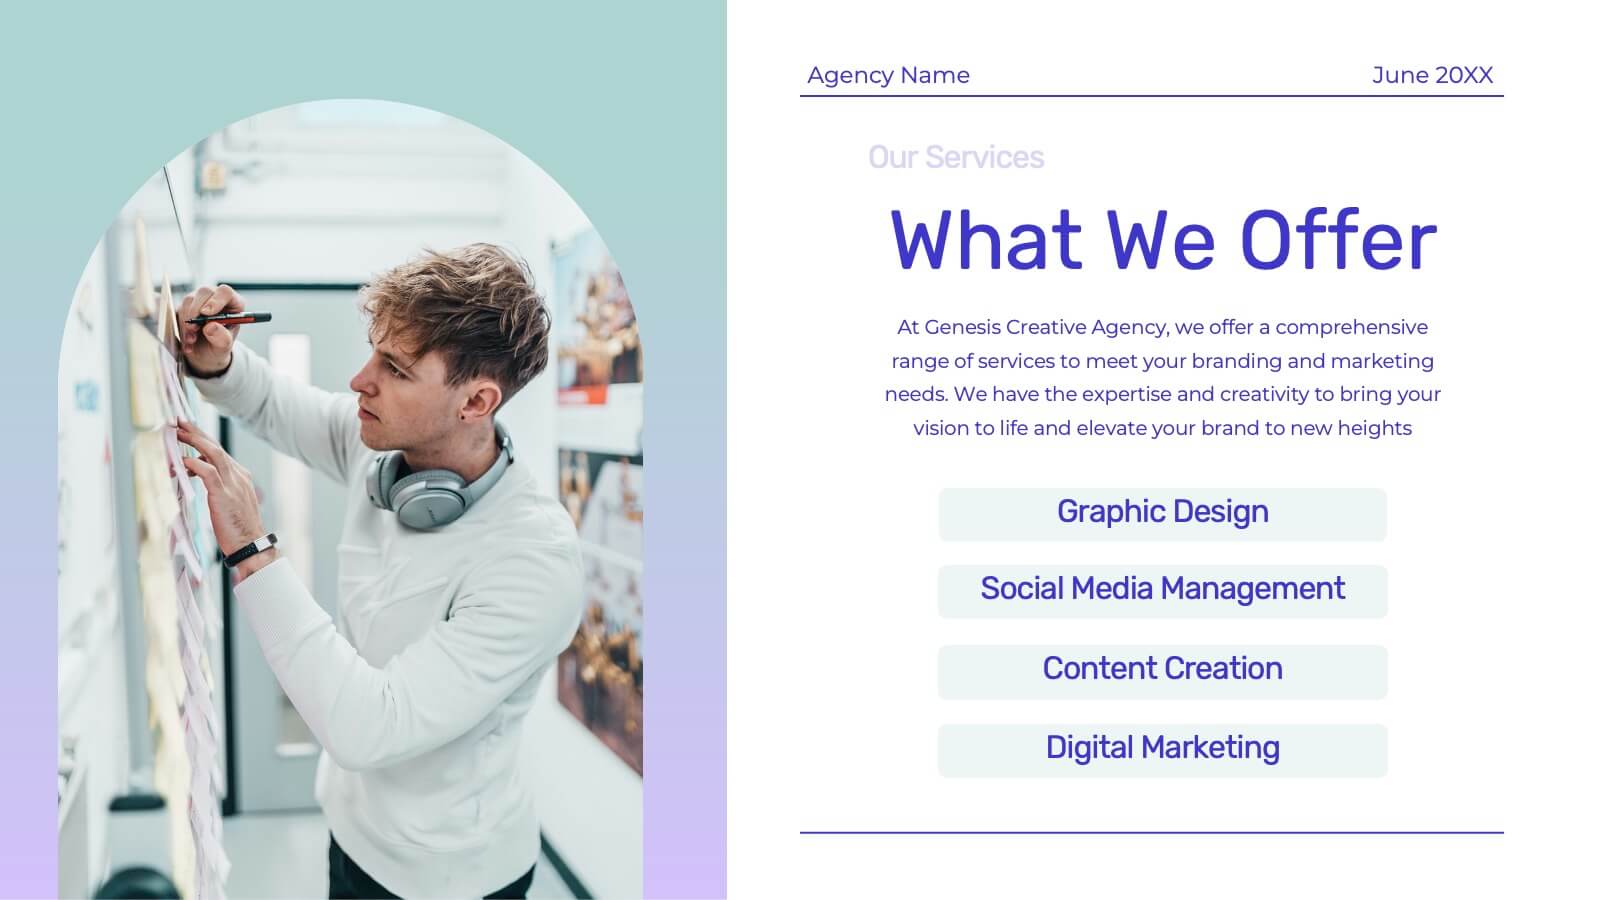
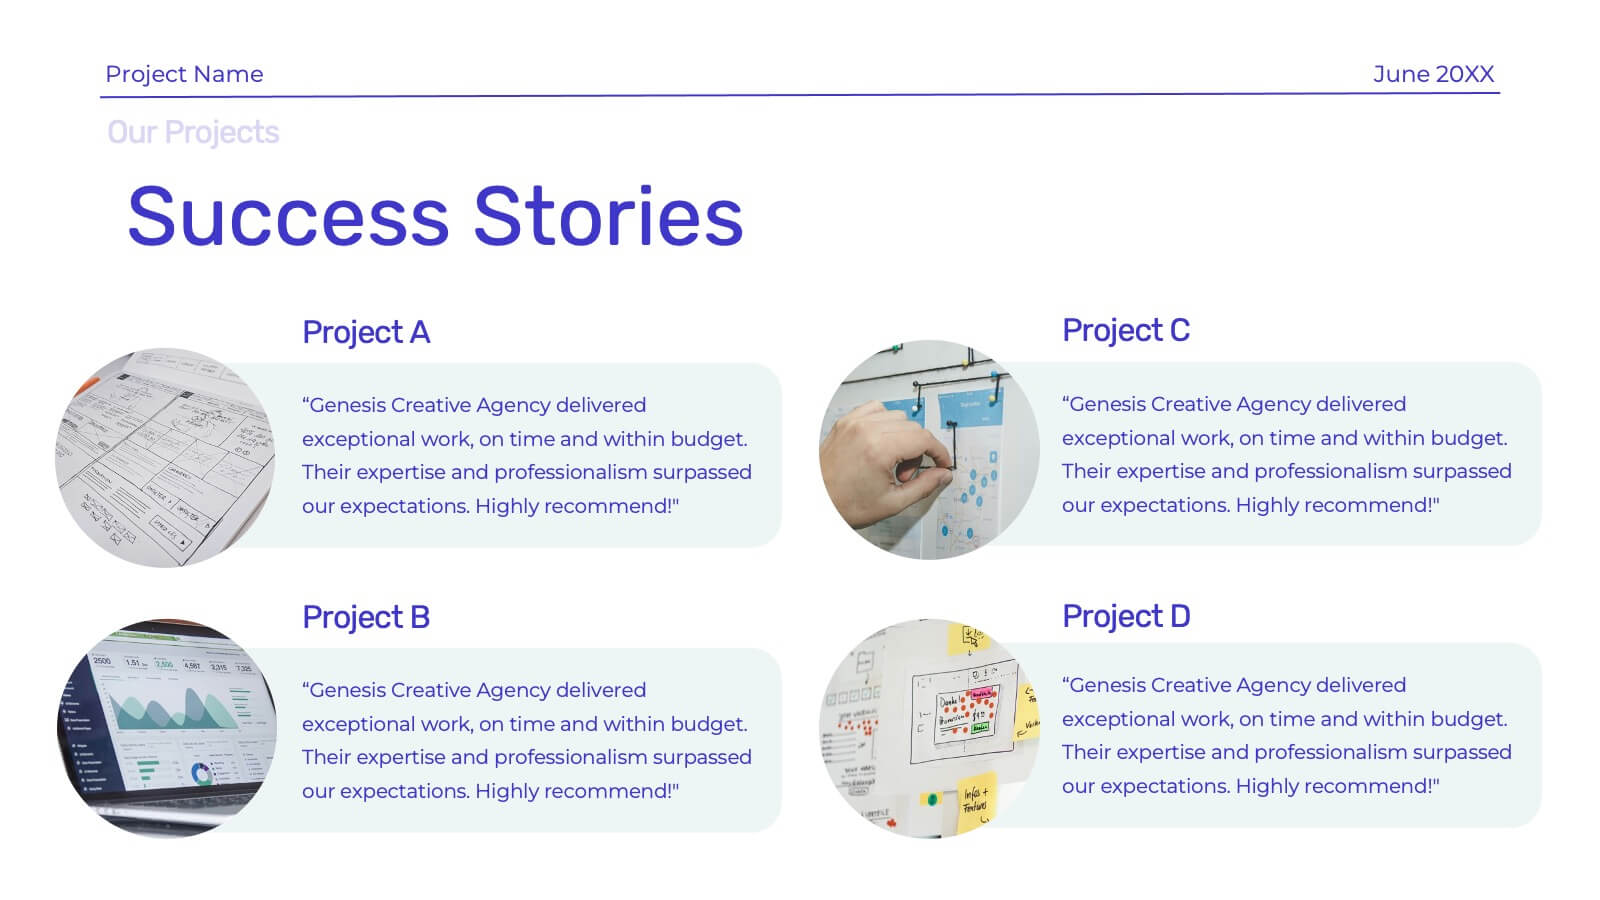
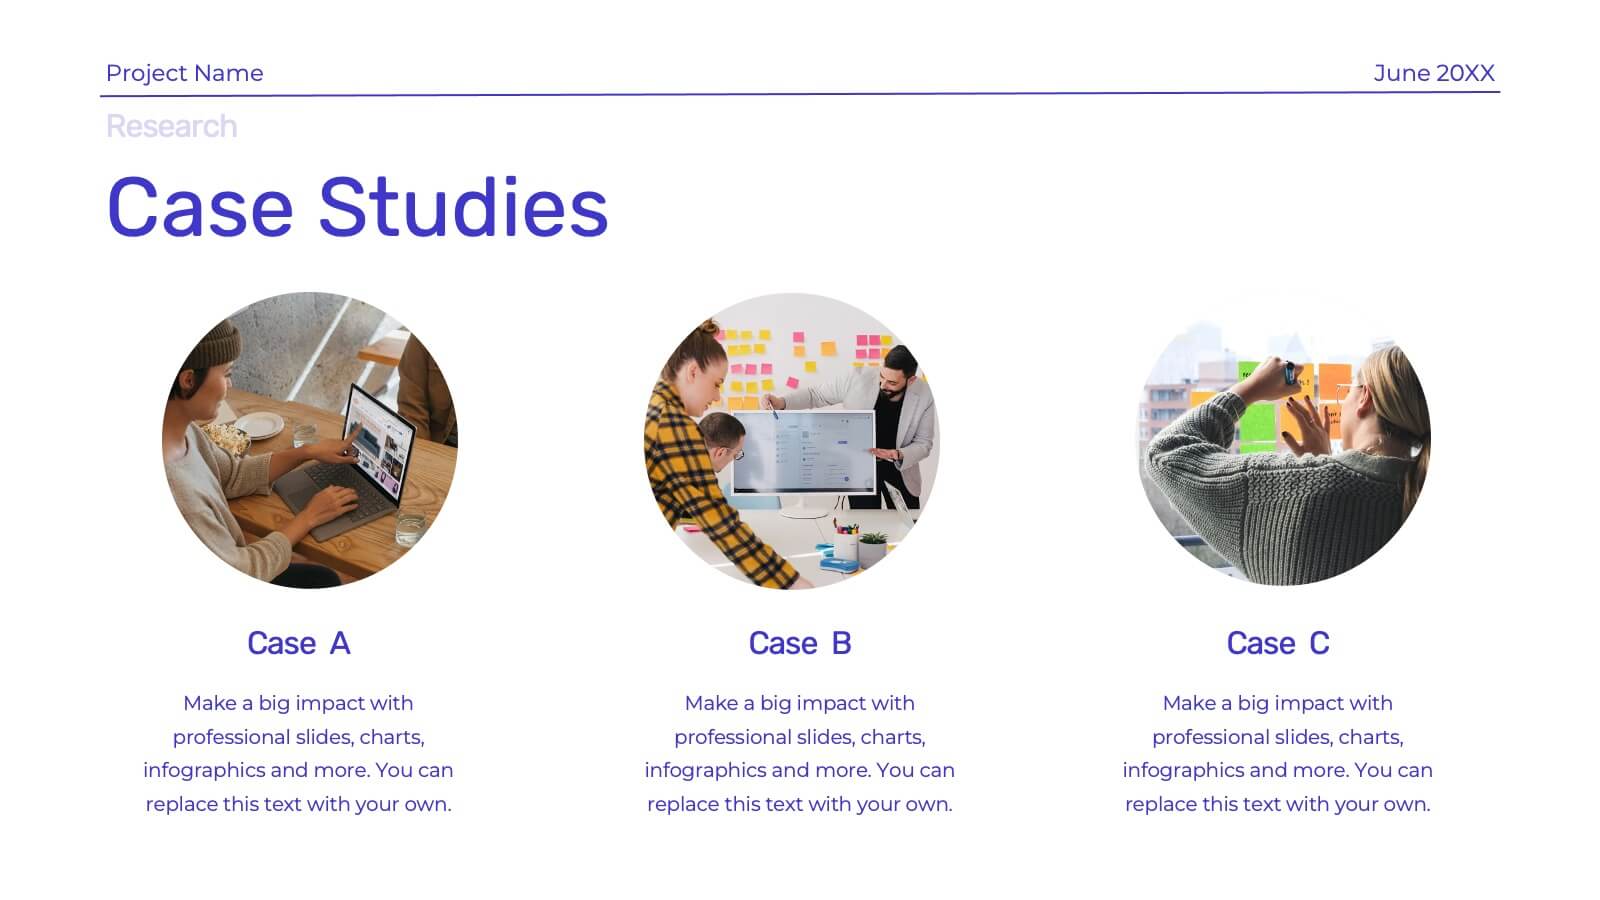
Genesis Creative Agency Pitch Deck Presentation
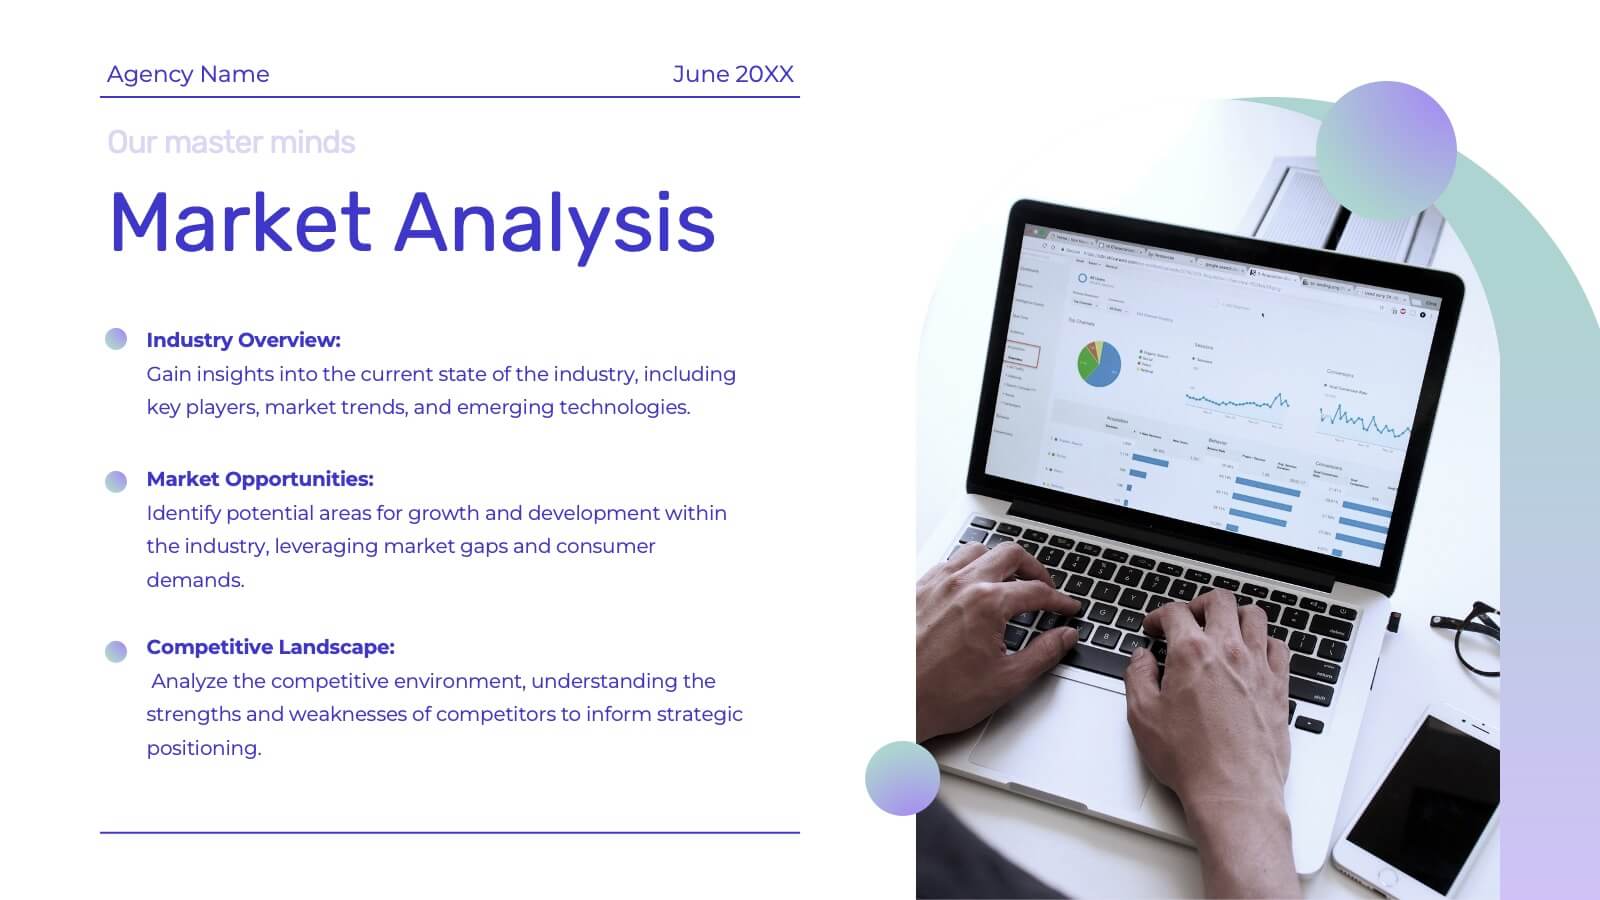
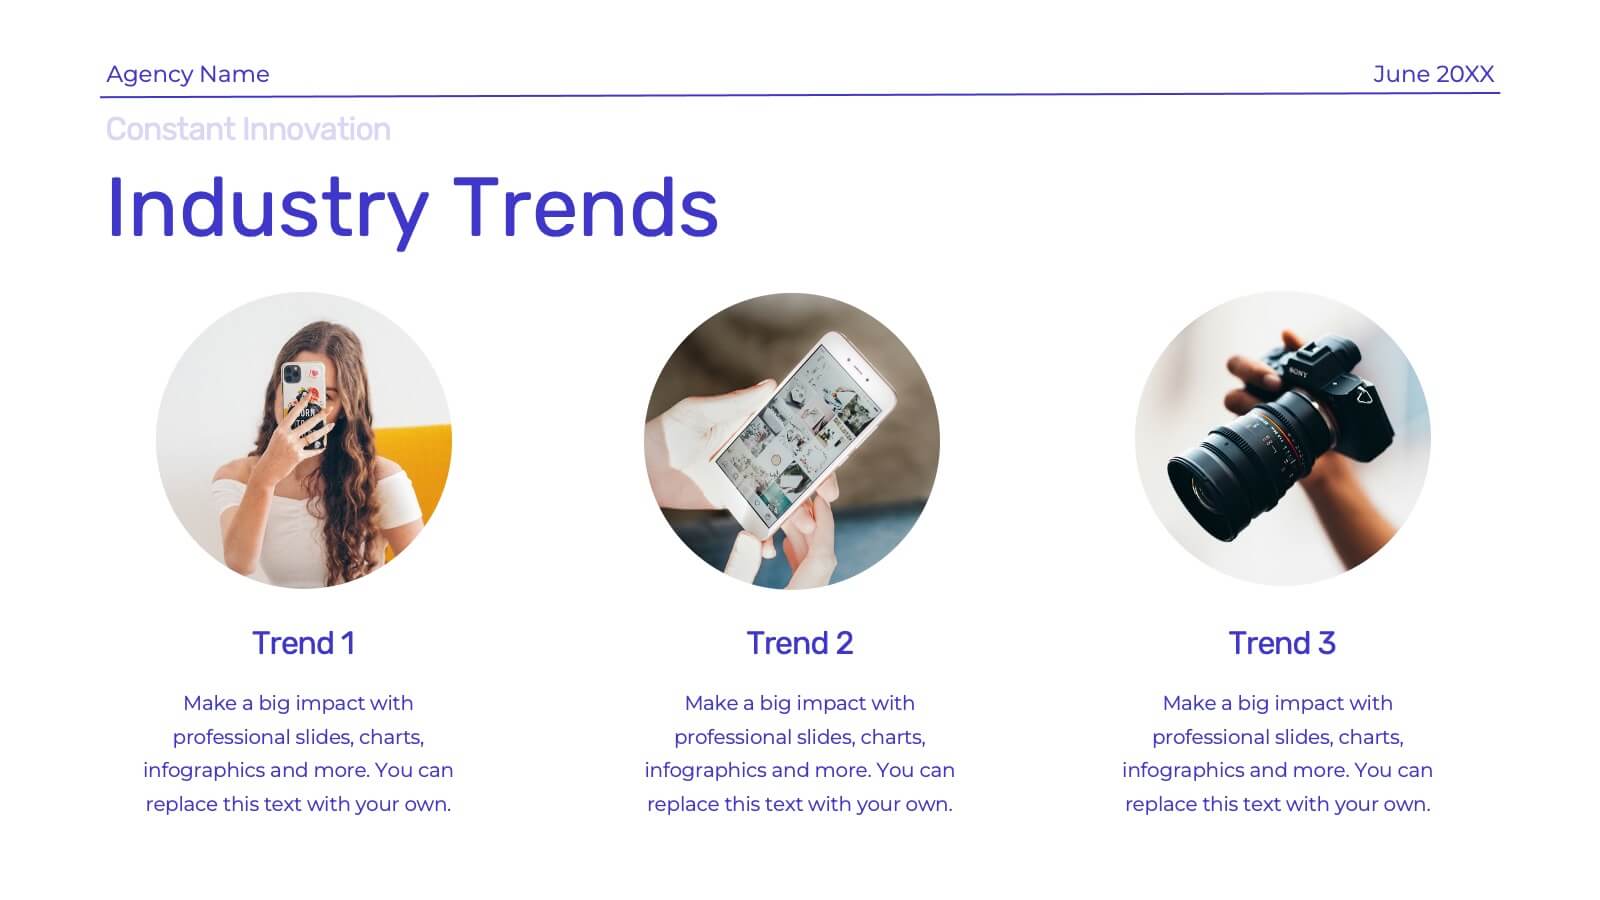
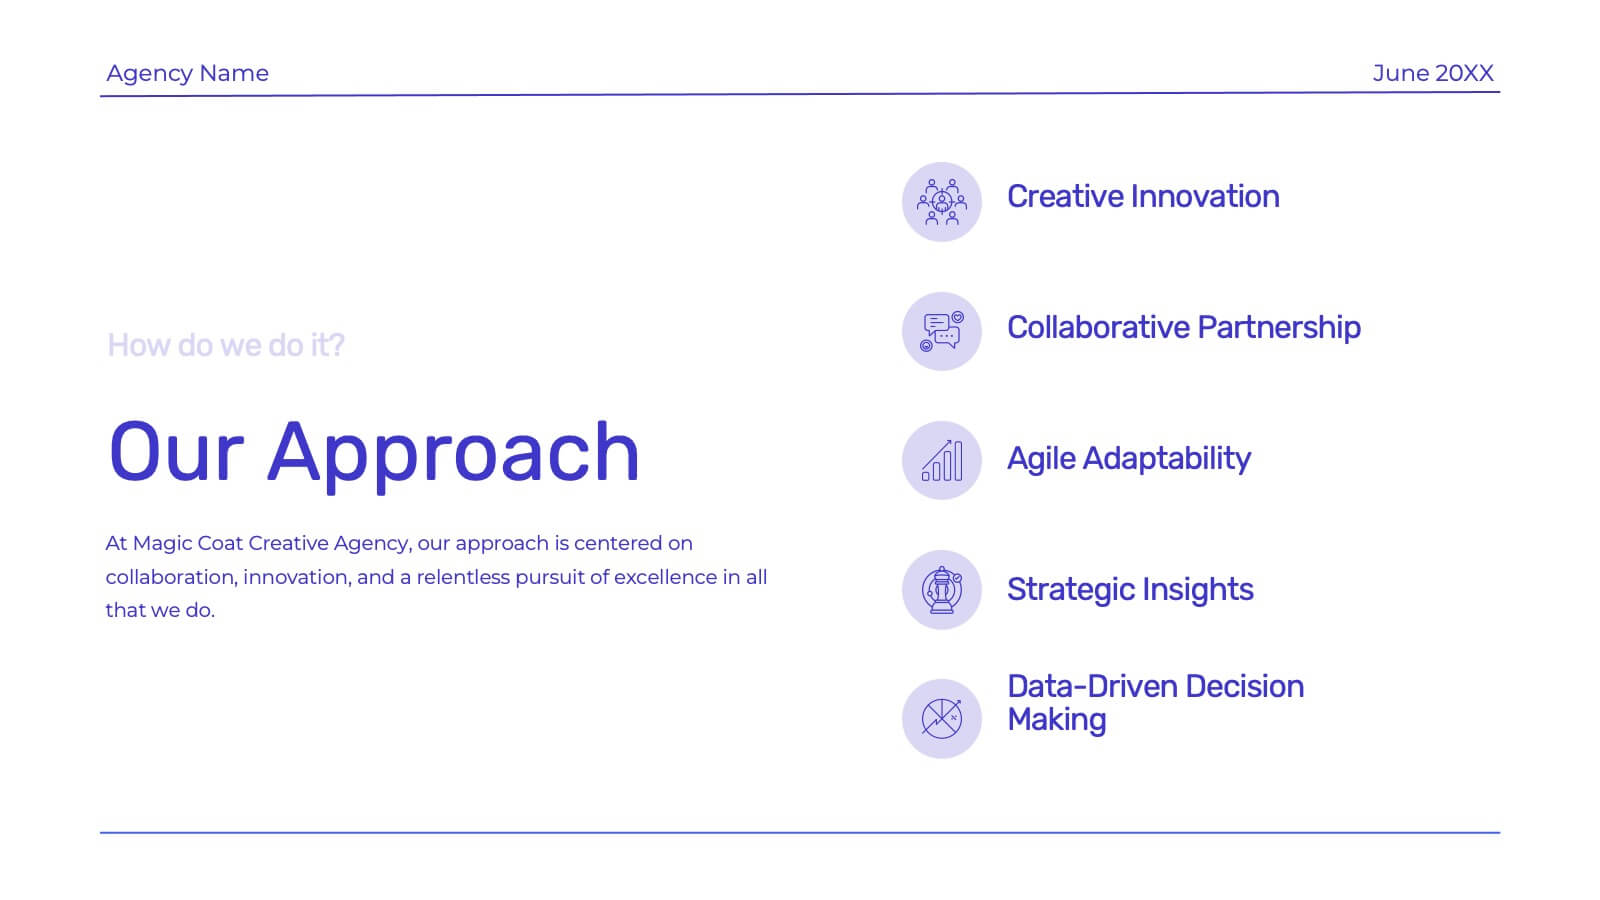
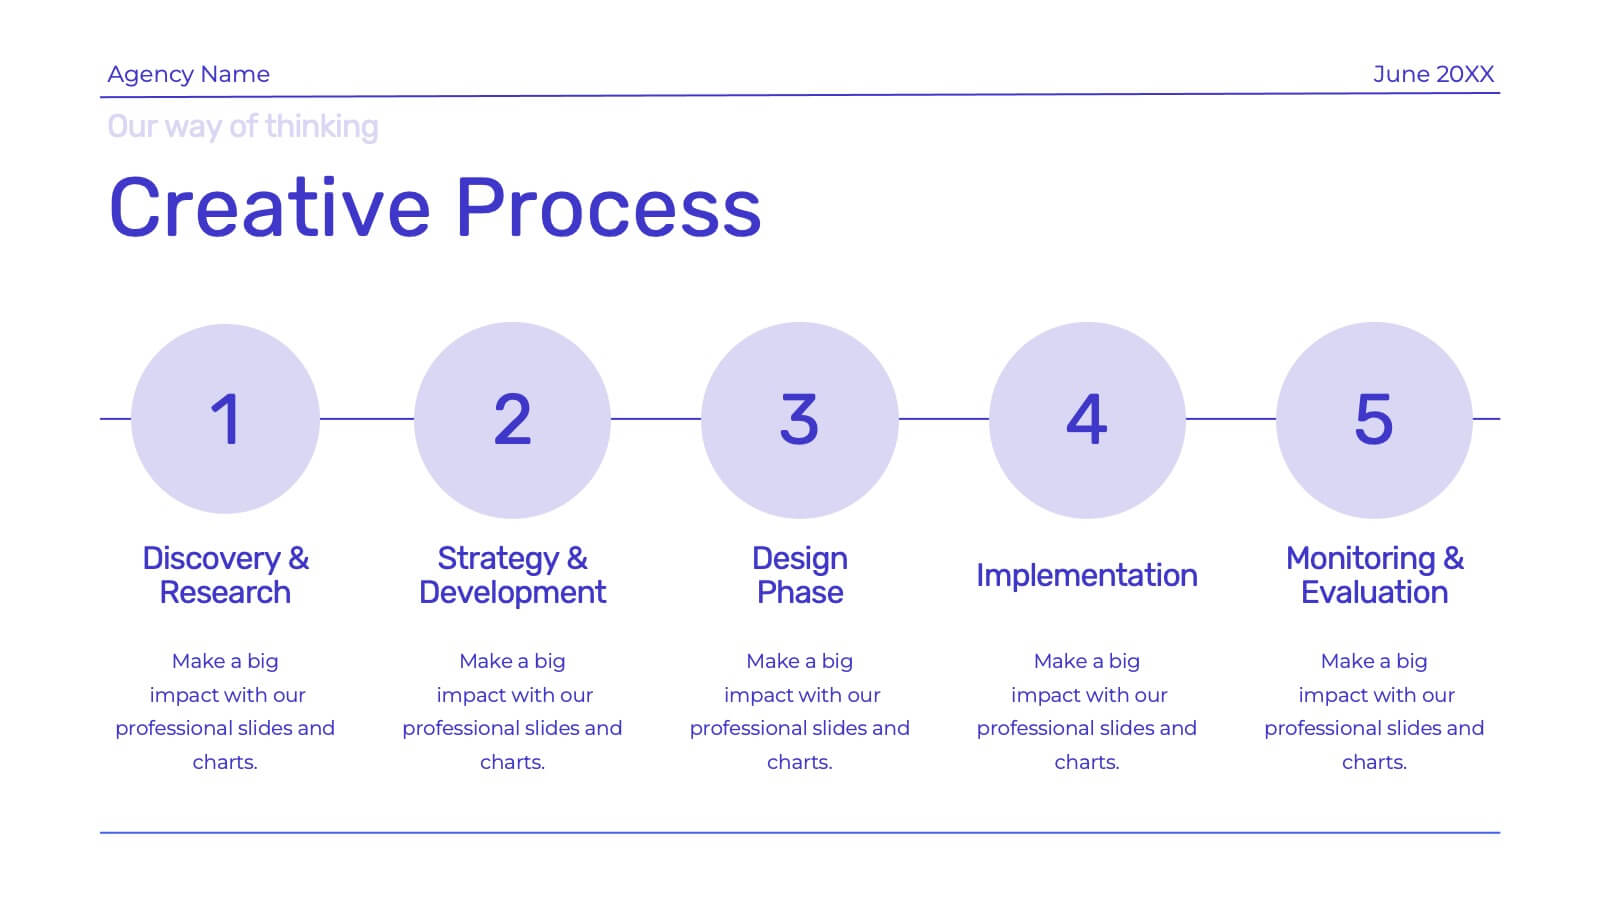
Showcase your creative agency’s strengths with this vibrant template. Highlight your team, services, success stories, and unique approach. Ideal for case studies, market analysis, and campaign execution. Fully compatible with PowerPoint, Keynote, and Google Slides.


5 slides
Pricing Strategy and Comparison Table Presentation
Present your pricing plans with clarity and impact using the Pricing Strategy and Comparison Table Presentation. This slide offers a structured layout to compare features, pricing tiers, and plan benefits side-by-side. Perfect for SaaS, services, or product pitches. Fully editable in Canva, PowerPoint, Google Slides, and Keynote.


8 slides
Construction Project Planning Presentation
Streamline project timelines with the Construction Project Planning template. This visually structured design helps organize key phases, tasks, and milestones for efficient workflow management. Ideal for project managers and construction professionals, it enhances clarity in presentations. Fully customizable and compatible with PowerPoint, Keynote, and Google Slides for seamless integration.


10 slides
Financial Growth Planning
Visualize your path to financial success with this puzzle-themed Financial Growth Planning template. Each step connects seamlessly to outline investment goals, budgeting strategies, or revenue milestones. Designed for clarity and impact, it's fully editable in PowerPoint, Keynote, and Google Slides for effortless customization.


5 slides
Business SWOT Evaluation Framework Presentation
Deliver clear strategic analysis with the Business SWOT Evaluation Framework Presentation. This layout features a modern quadrant design that segments Strengths, Weaknesses, Opportunities, and Threats around a central focus, making your insights easy to digest. Fully editable in PowerPoint, Canva, and Google Slides—perfect for business planning and executive reporting.


18 slides
Riftbound Creative Design Report Presentation
Unleash your creative vision with this beautifully structured design presentation! It covers essential aspects like concept development, typography, moodboards, wireframes, and final design, ensuring a comprehensive journey from idea to execution. Perfect for creative teams or client presentations, this template is fully compatible with PowerPoint, Keynote, and Google Slides.


6 slides
Strategic Solution Framework Presentation
Build your ideas step by step with this dynamic layout that turns strategies into a clear visual journey. Perfect for illustrating processes, growth plans, or solution pathways, it helps simplify complex frameworks into engaging visuals. Fully editable and compatible with PowerPoint, Keynote, and Google Slides for seamless customization.


5 slides
Elegant Abstract Watercolor Layout Presentation
Add artistic flair to your message with the Elegant Abstract Watercolor Layout Presentation. Featuring hand-drawn brush elements and delicate color drops, this design blends creativity with clarity. Ideal for storytelling, brand values, or conceptual visuals. Fully editable in PowerPoint, Keynote, and Google Slides for stylish and customizable presentations.


5 slides
Scrum Team Roles Presentation
A clear, engaging layout brings this presentation to life, making it easy to explain how each role contributes to a productive, collaborative workflow. Designed to simplify complex team structures, it helps you communicate responsibilities with confidence and clarity. Fully compatible with PowerPoint, Keynote, and Google Slides.


5 slides
Cyber Security Statistics Infographics
Cybersecurity refers to the practice of protecting computer systems, networks, and digital information from unauthorized access, data breaches, theft, or damage. These infographic templates are designed to help educate and raise awareness about the importance of protecting digital assets and staying vigilant against cyber threats. They allow you to effectively communicate the significance of cybersecurity through cyber icons and compelling statistics. This is useful for organizations, educational institutions, and individuals who want to promote awareness and encourage proactive measures to protect against cyber threats.


26 slides
Becka Presentation Template
Becka is a modern and powerful template for people who want to present themselves in a professional but bold way. Perfect for the CEO or company executive who wants to have a strong presence on screen. Made with clear and crisp typography, with added bold colors that appeal to both men and women which can evoke powerful emotions and confidence. This template contains easy to edit maps, charts and image place holders that are ready to use. The dynamic slides make it quick and easy to create the perfect presentation.


5 slides
Modern Home Layout Slides Presentation
Give your design ideas a modern edge with this clean, architectural presentation. Perfect for showcasing home layouts, interior concepts, or real estate projects, it combines structure and creativity to keep viewers engaged. Fully customizable and compatible with PowerPoint, Keynote, and Google Slides for effortless editing and professional delivery.


6 slides
Time Management Benefits Infographics
Unlock the benefits of effective time management with our Time Management Benefits infographic template. This template is fully compatible with popular presentation software like PowerPoint, Keynote, and Google Slides, allowing you to easily customize it to illustrate and communicate the advantages of mastering your time. The Time Management Benefits infographic template offers a visually engaging platform to highlight the positive outcomes of efficient time management, including increased productivity, reduced stress, improved work-life balance, and more. Whether you're a professional, student, or anyone looking to make the most of their time, this template provides a user-friendly canvas to create informative presentations and educational materials. Optimize your time management skills with this SEO-optimized Time Management Benefits infographic template, thoughtfully designed for clarity and ease of use. Customize it to showcase specific benefits, time-saving techniques, tools, and strategies for effective time management, ensuring that your audience understands the value of this essential skill. Start crafting your personalized infographic today to reap the rewards of improved time management.


6 slides
Simple Horizontal Timeline Design Presentation
Bring your story to life with a smooth, step-by-step visual that guides viewers through key events with clarity and ease. This presentation helps you outline timelines, processes, or project stages in a clean horizontal flow that’s simple to follow and easy to customize. Fully compatible with PowerPoint, Keynote, and Google Slides.


4 slides
Strategic Growth Next Steps Presentation
Achieve sustainable growth with the Strategic Growth Next Steps Presentation template. This structured, step-by-step layout guides your audience through key phases of business expansion, helping to communicate priorities and action plans effectively. The wavy path design adds a dynamic flow to your strategy, ensuring clarity and engagement. Fully customizable for PowerPoint, Keynote, and Google Slides, making it a versatile tool for strategic planning and business development.


24 slides
Silver Product Launch Presentation
Unleash the potential of your product launch with this vibrant and engaging presentation template! Designed to showcase your product's unique features, market positioning, and competitive edge, this template helps you tell a compelling story from start to finish. It’s perfect for grabbing attention and driving impact. Compatible with PowerPoint, Keynote, and Google Slides.