


Features
- 7 Unique Slides
- Fully editable and easy to edit in Microsoft Powerpoint, Keynote and Google Slides
- 16:9 widescreen layout
- Clean and professional designs
- Export to JPG, PDF or send by email


Do you have any questions?
Recommend


5 slides
Startup Growth Roadmap and Milestones Presentation
Present your startup journey clearly with the Startup Growth Roadmap and Milestones Presentation. This timeline-style layout breaks down your key phases, from initial concept to market traction. Ideal for investor decks, pitch presentations, or internal planning. Fully editable in PowerPoint, Canva, and Google Slides for seamless customization.


21 slides
Ember Agile Project Plan Presentation
Ready to ace your next project proposal? This sleek presentation template is perfect for outlining objectives, timelines, and budgets. Designed for professionals aiming to impress stakeholders and secure approvals. Compatible with PowerPoint, Keynote, and Google Slides, it ensures a smooth and professional presentation every time. Ideal for project managers and business leaders.


7 slides
Team Work Infographic Presentation Template
Teamwork is a method of working collaboratively in order to achieve a goal. Members of a team can accomplish more than they could individually through their combined talents, knowledge and experience. This template can be used to help explain what teamwork is, what it looks like, why it’s important, and how you can cultivate it within your organization. This teamwork template is designed to encourage communication. Use this template to help evaluate what areas your team can improve on and how they can do so. Point out exactly how vital teamwork is to the success of your business.


6 slides
Expert Tables Of Content Infographics
The "Expert Tables of Content" infographic template is a sophisticated and structured tool, designed to enhance presentations in PowerPoint, Keynote, and Google Slides. This template is ideal for authors, researchers, and professionals who need to present detailed content or reports in a clear and accessible format. This template efficiently organizes complex information into an easy-to-navigate format, showcasing chapters, sections, and key topics. It's tailored to highlight the depth and breadth of your content, making it an essential tool for academic presentations, business reports, or any comprehensive document requiring a detailed table of contents. The "Expert Tables of Content" infographic template revolutionizes the way we present complex information, perfectly crafted for PowerPoint, Keynote, and Google Slides. This template is a game-changer for authors, educators, and professionals aiming to captivate their audience with a well-structured and accessible presentation of their rich content. Designed to turn any extensive material into an engaging journey, this template masterfully organizes chapters, sections, and pivotal topics. It's an invaluable asset for transforming detailed reports, comprehensive academic papers, or sprawling creative works into a visually appealing and easily navigable format. With a design that's as striking as it is functional, the template boasts a color scheme that balances professionalism with vibrancy. T....


5 slides
Opportunity Mapping with Market Segments Presentation
Spot untapped potential with the Opportunity Mapping with Market Segments Presentation. This strategic quadrant chart helps visualize market segments by plotting quality against size, ideal for identifying where to focus efforts. Customize each section with your data in PowerPoint, Keynote, or Google Slides for a clean, professional pitch.


7 slides
Important Stats and Metrics by Numbers Presentation
Display key metrics with impact using this modern numeric infographic layout. Ideal for summarizing performance statistics, benchmarks, or data highlights across six categories. The circular markers and bold percentages enhance readability and focus. Fully editable in Canva—perfect for business reviews, investor decks, or analytical presentations that demand clarity.


26 slides
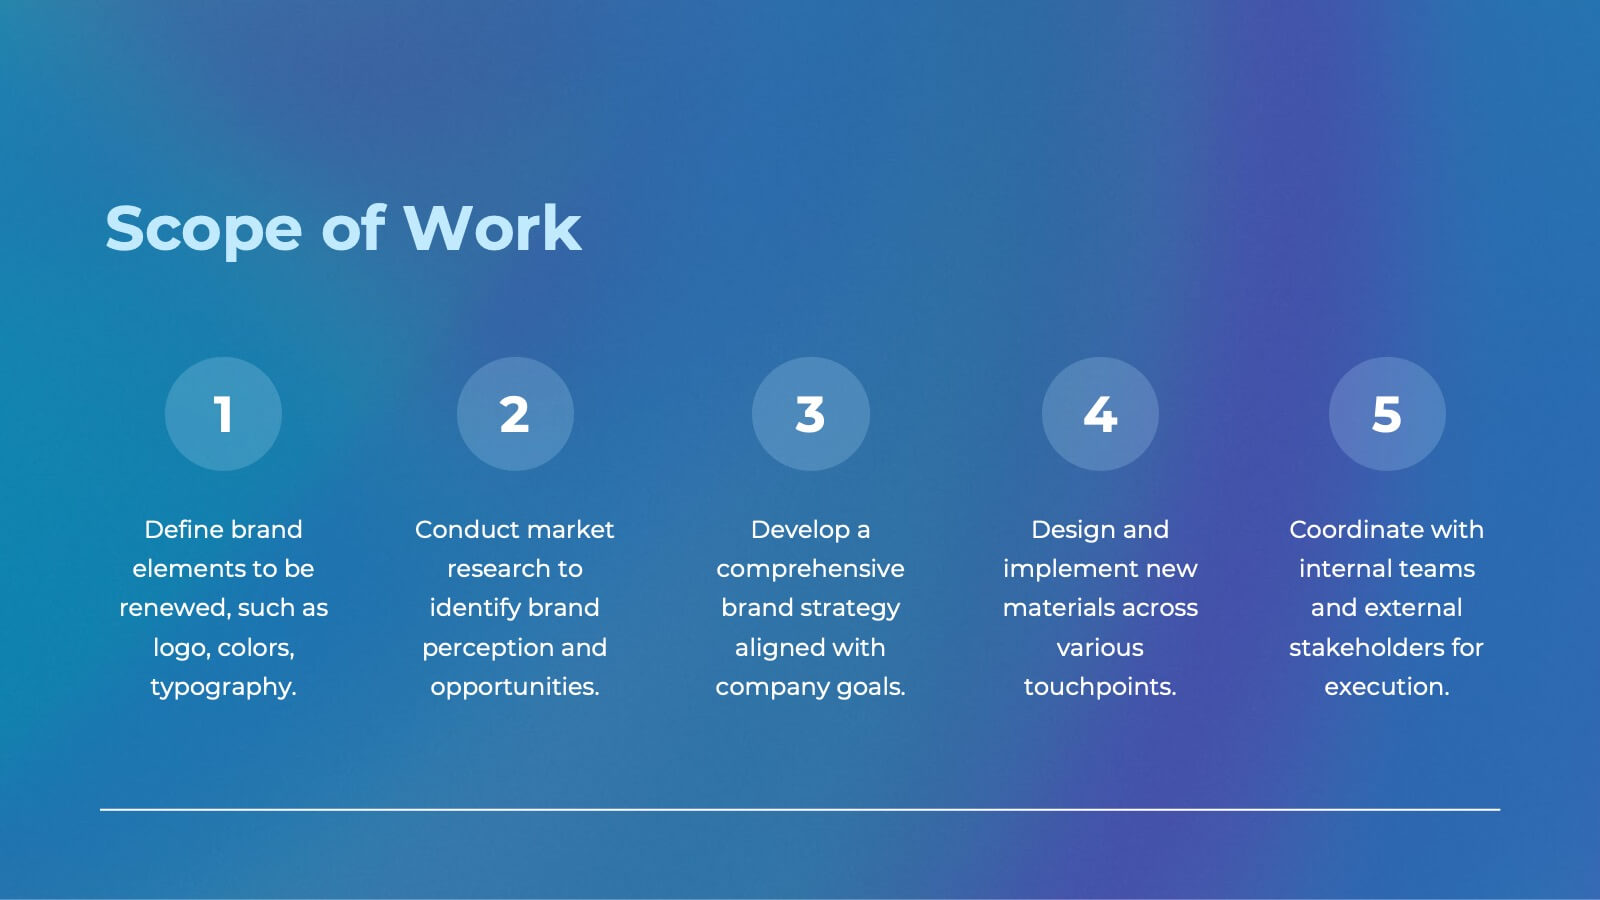
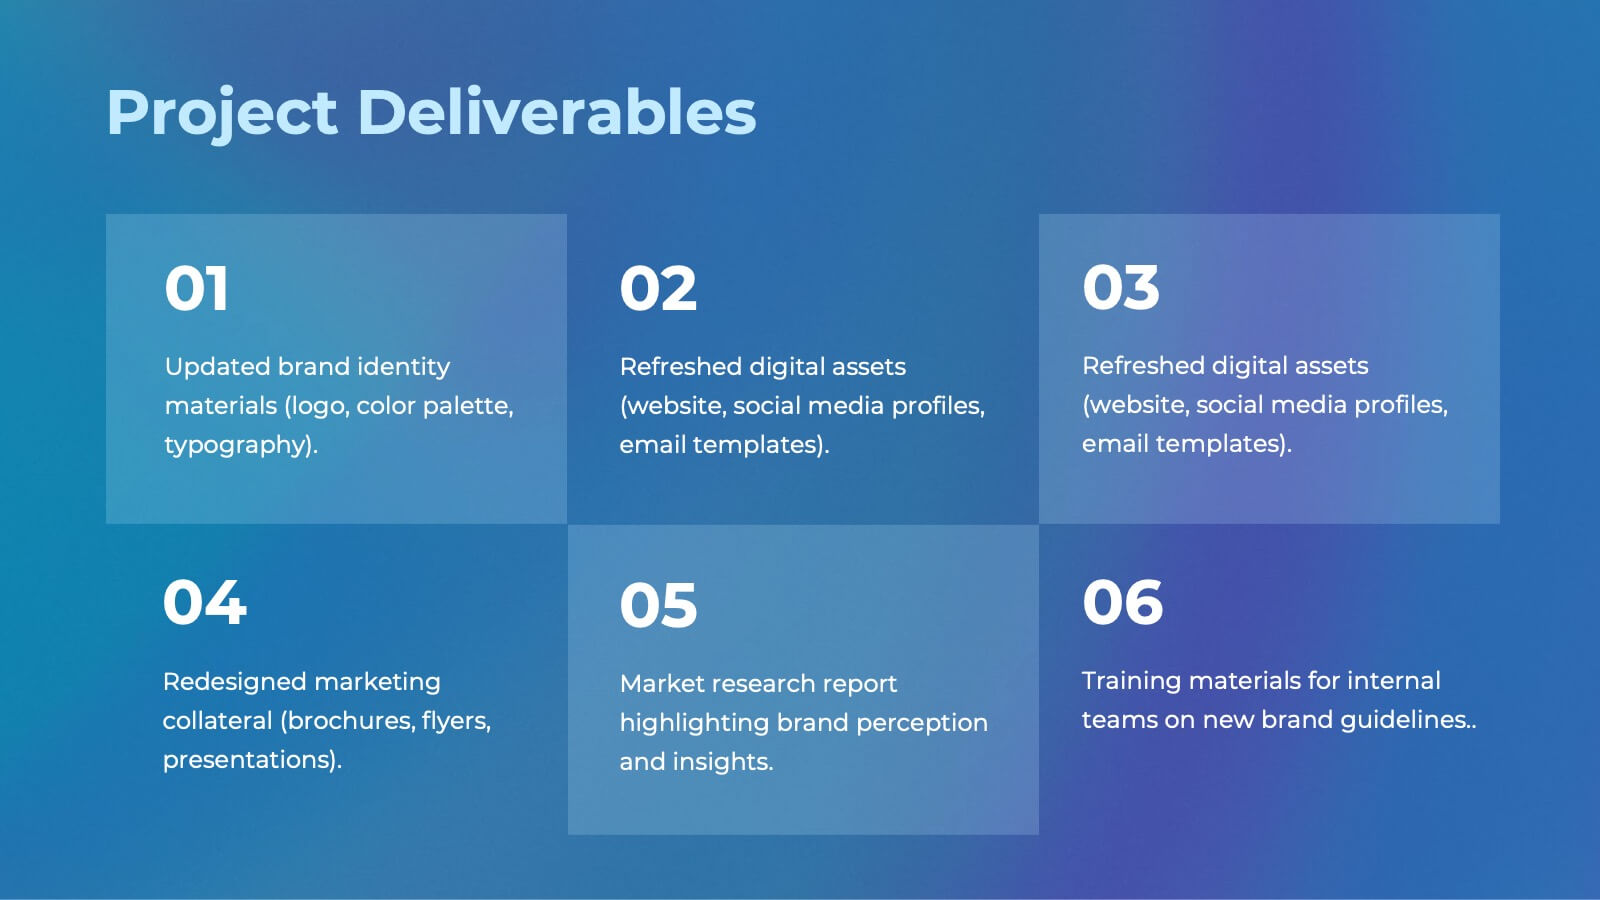
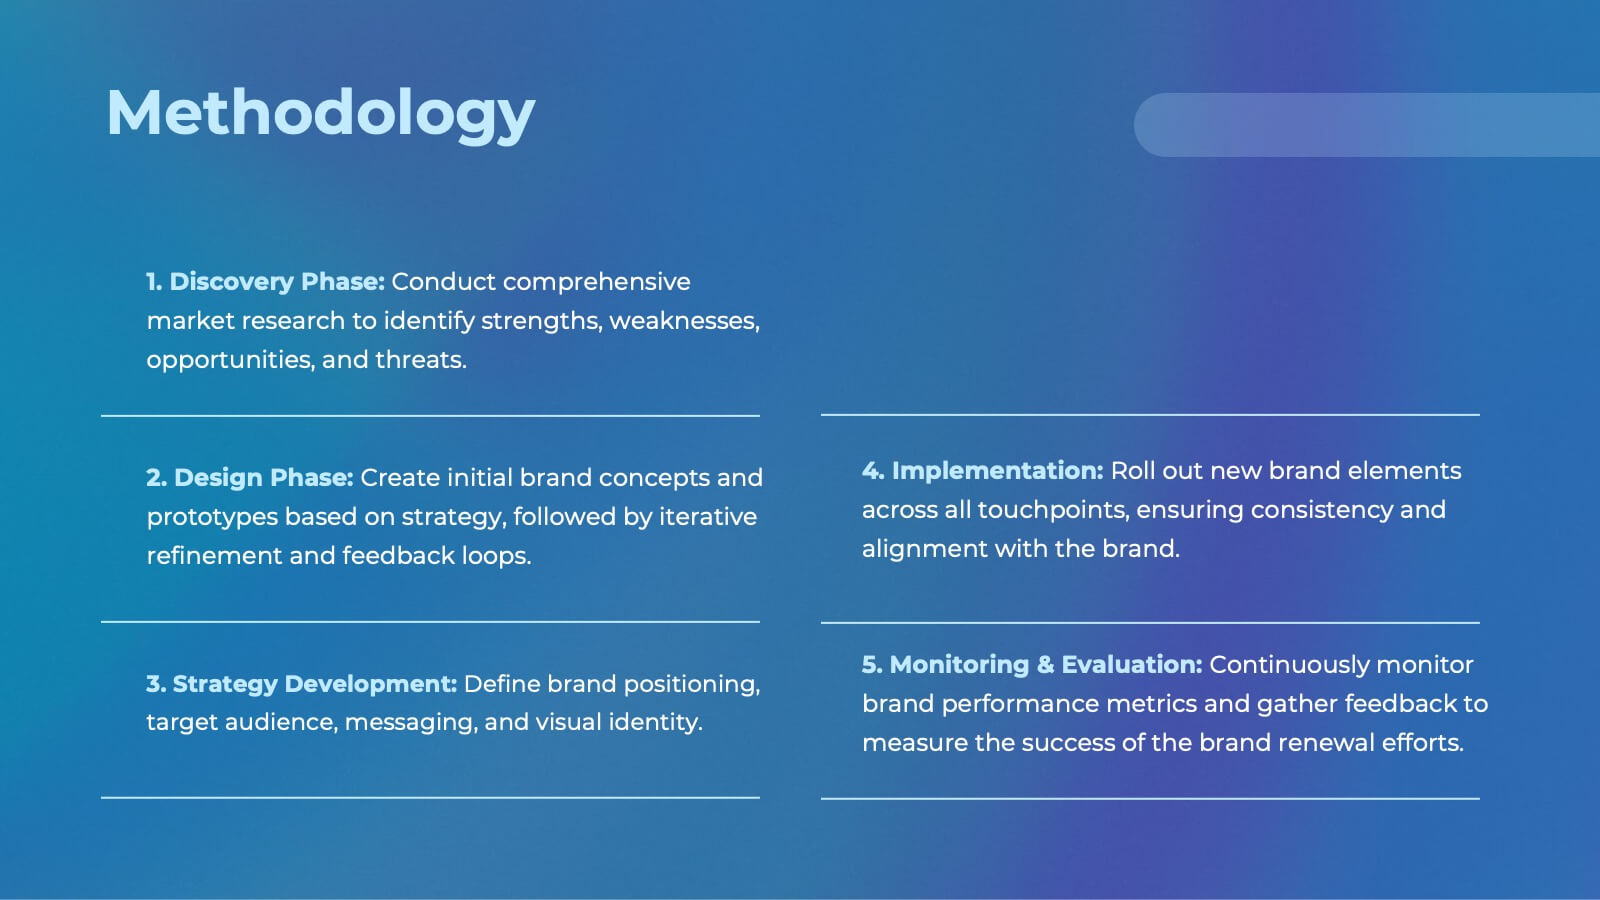
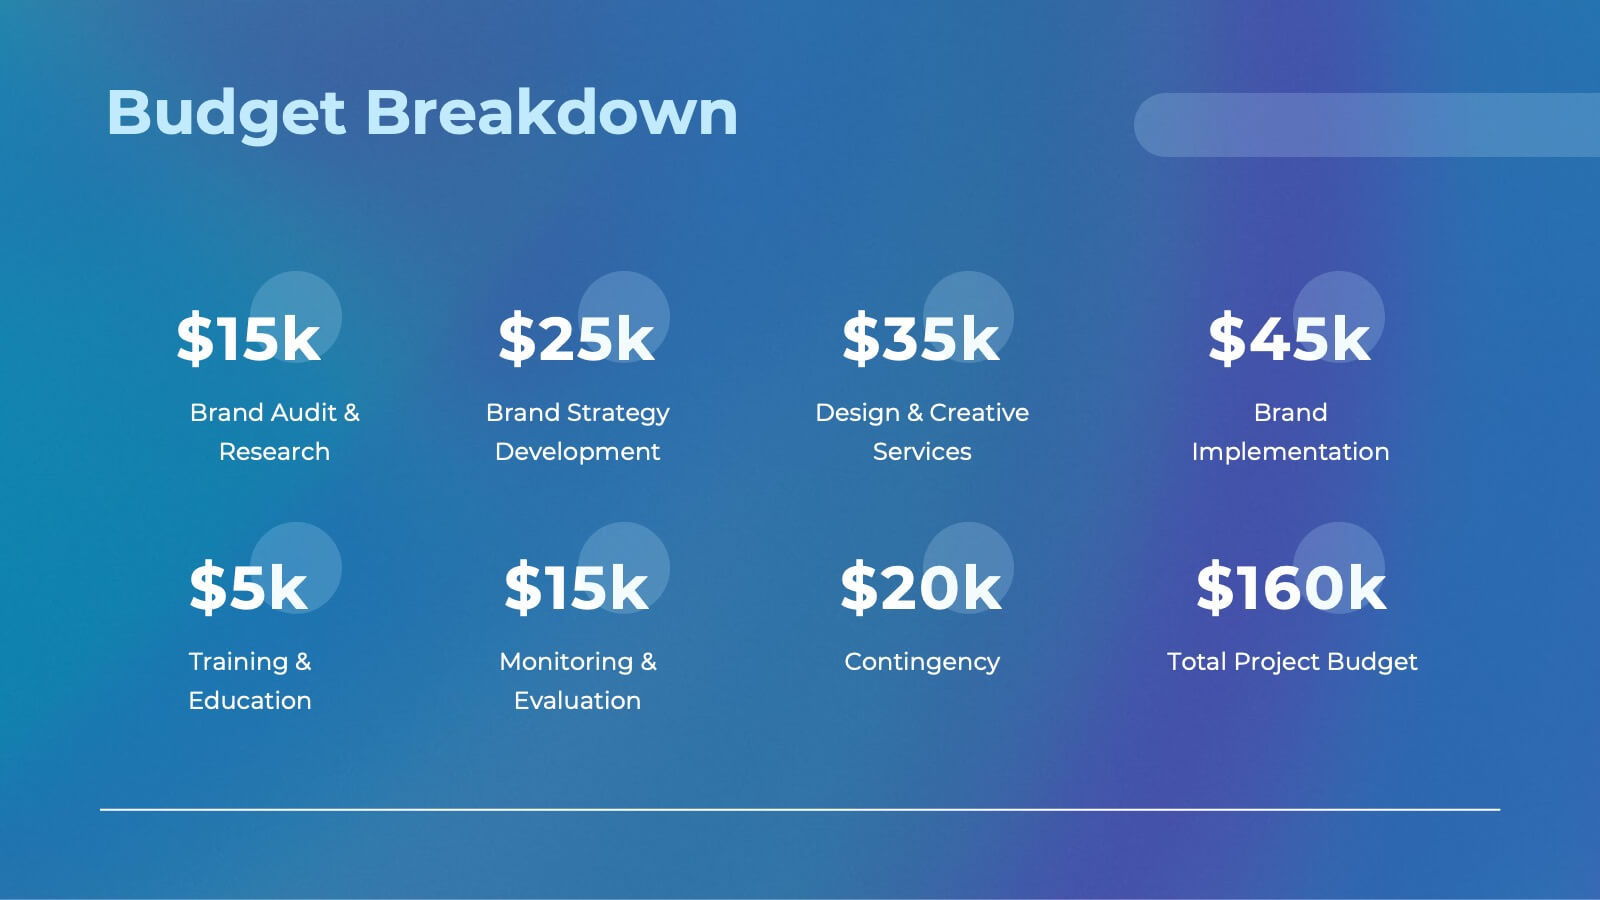
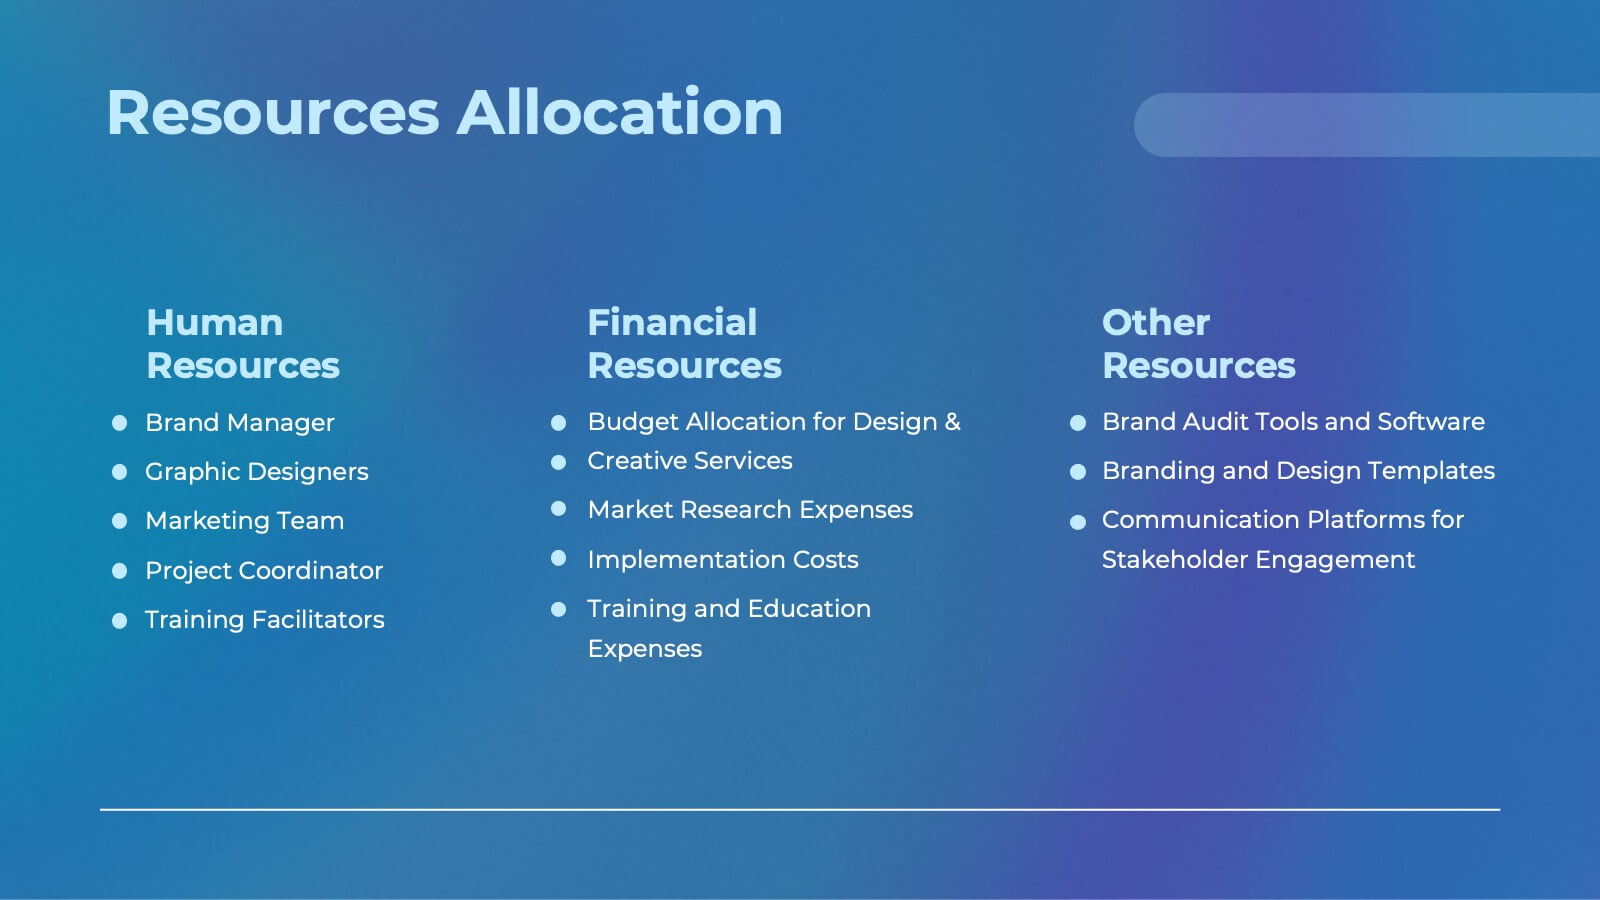
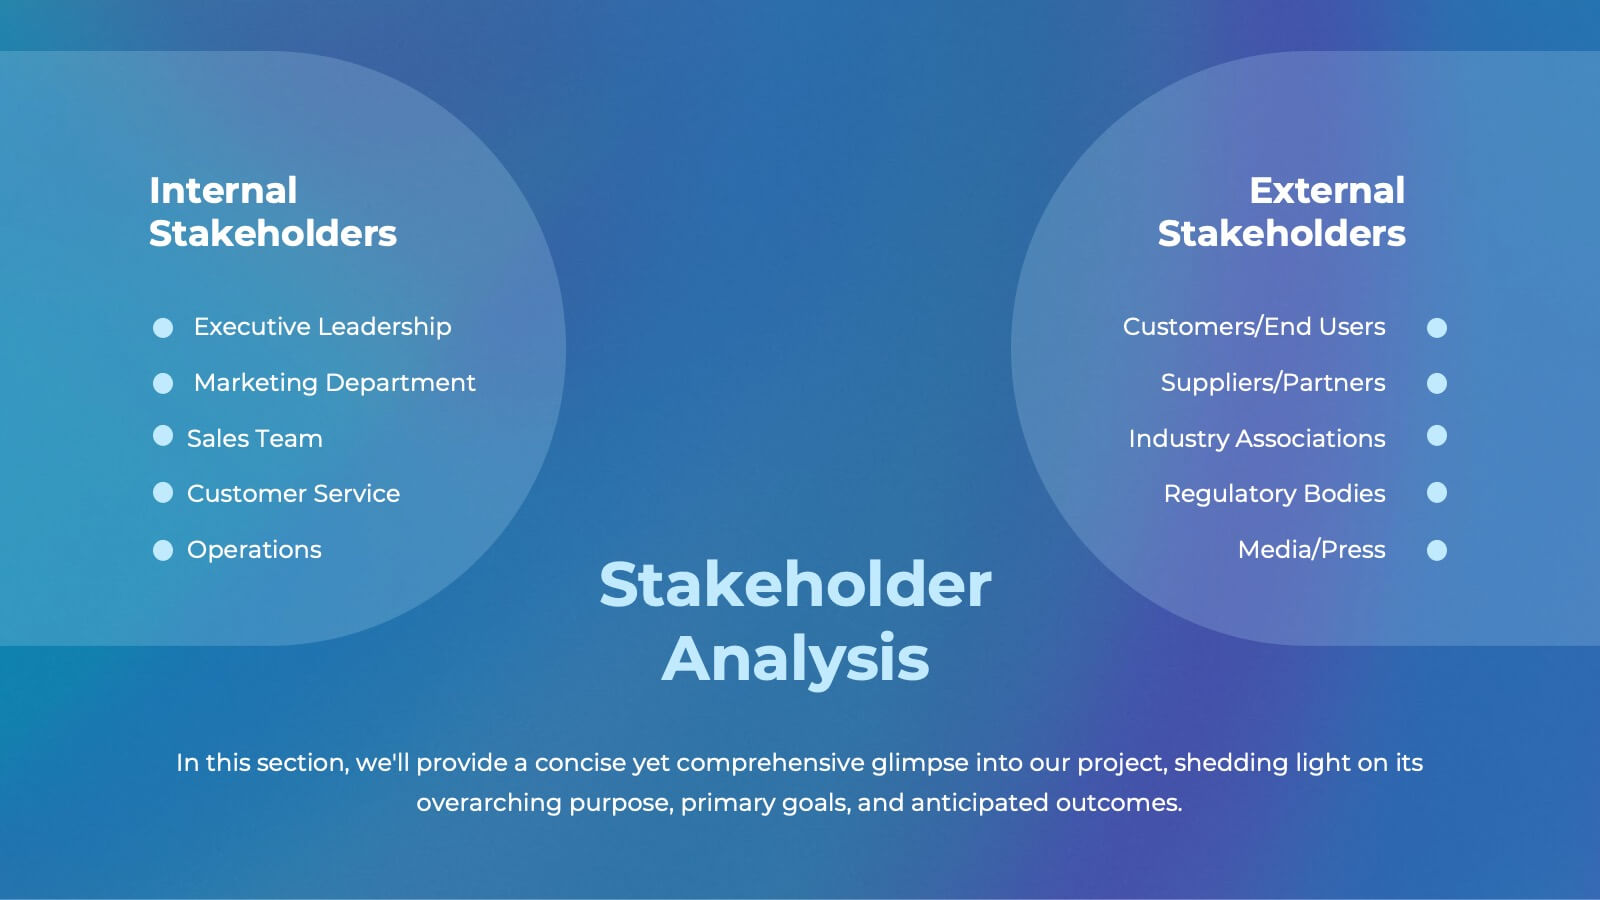
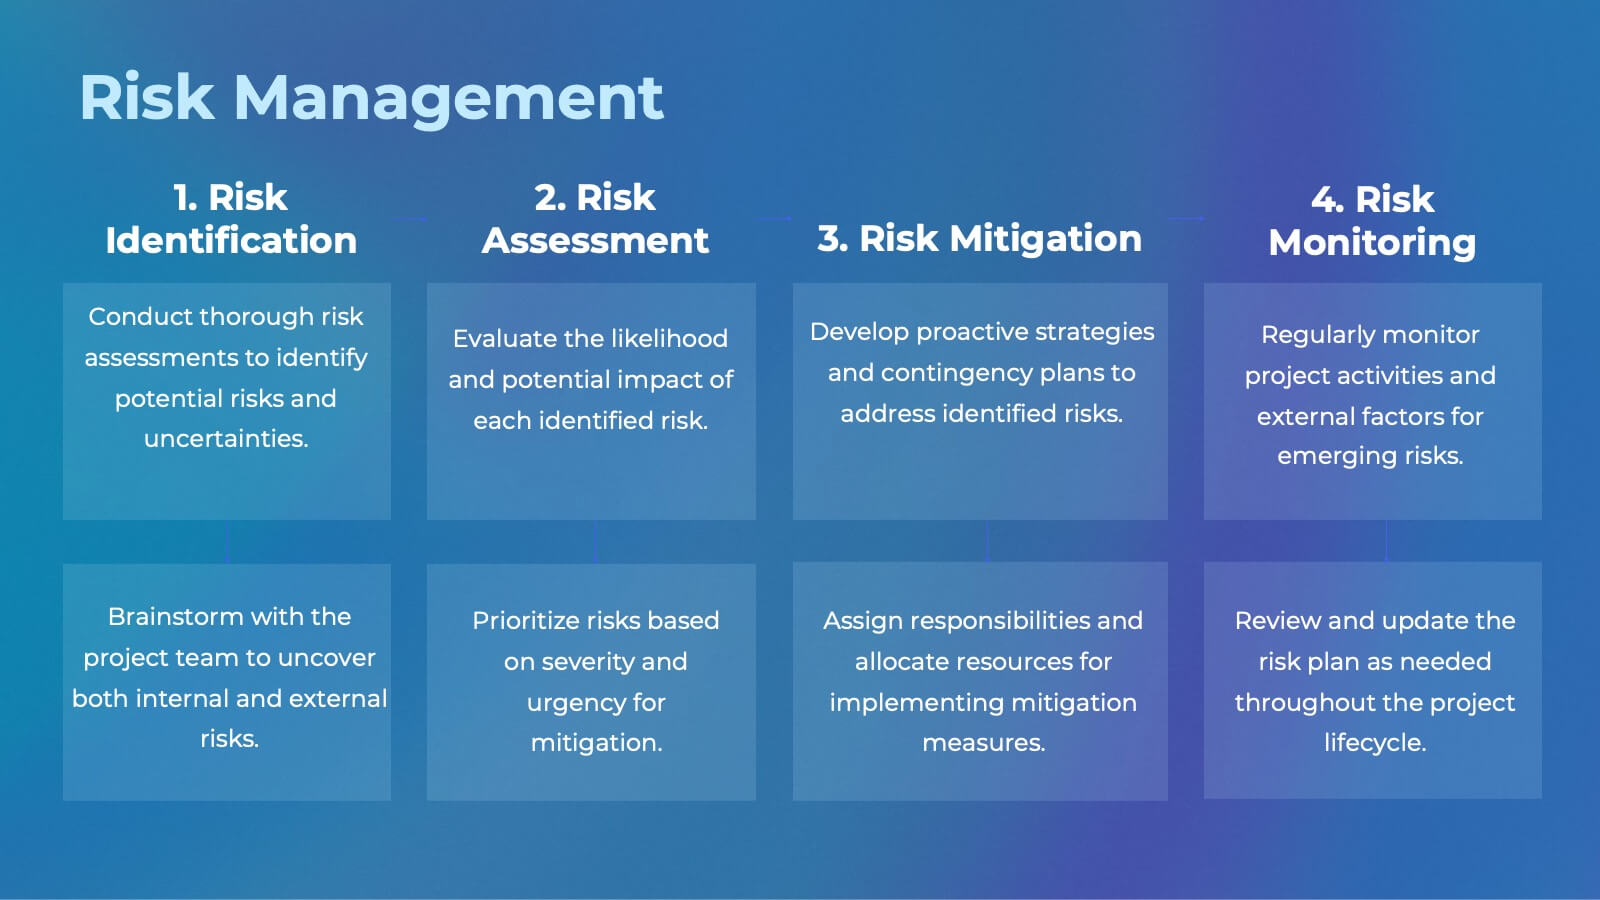
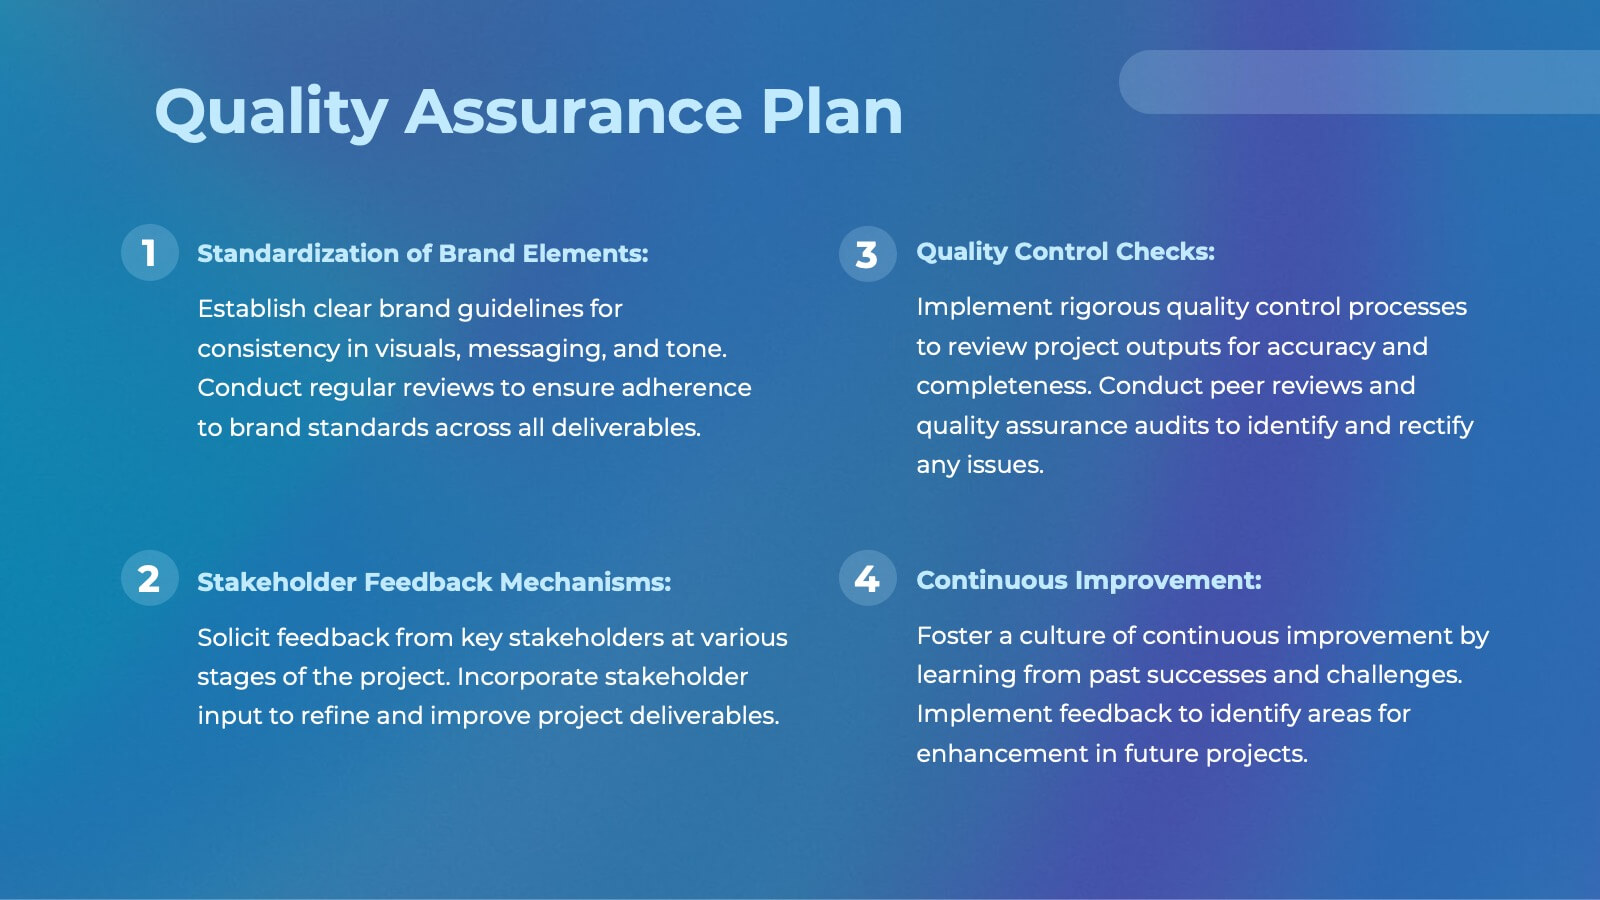
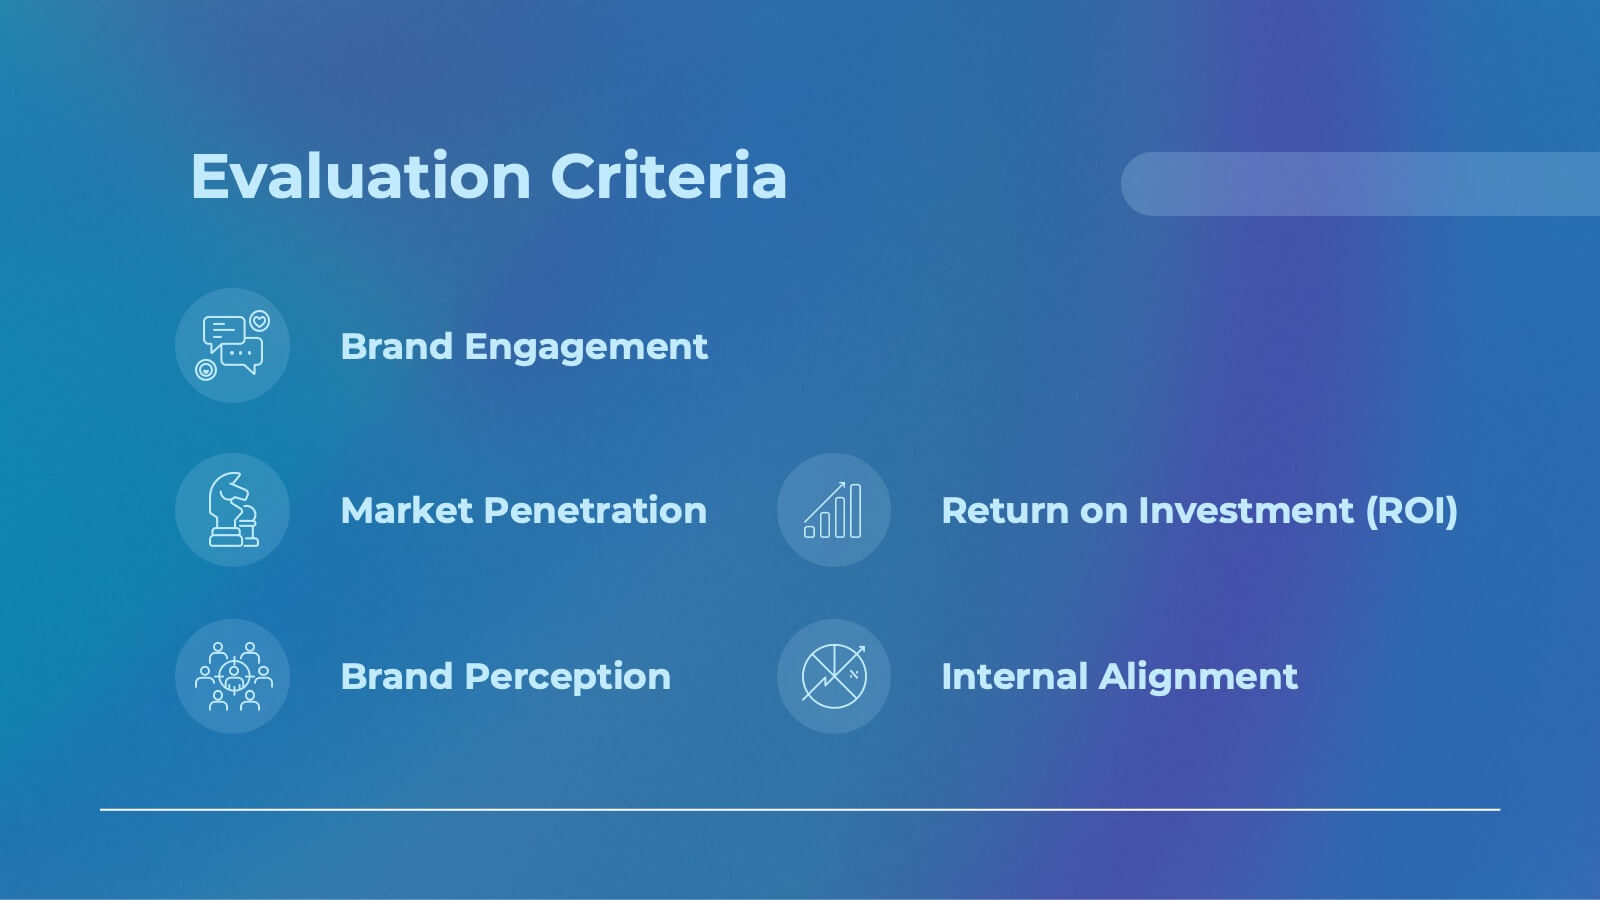
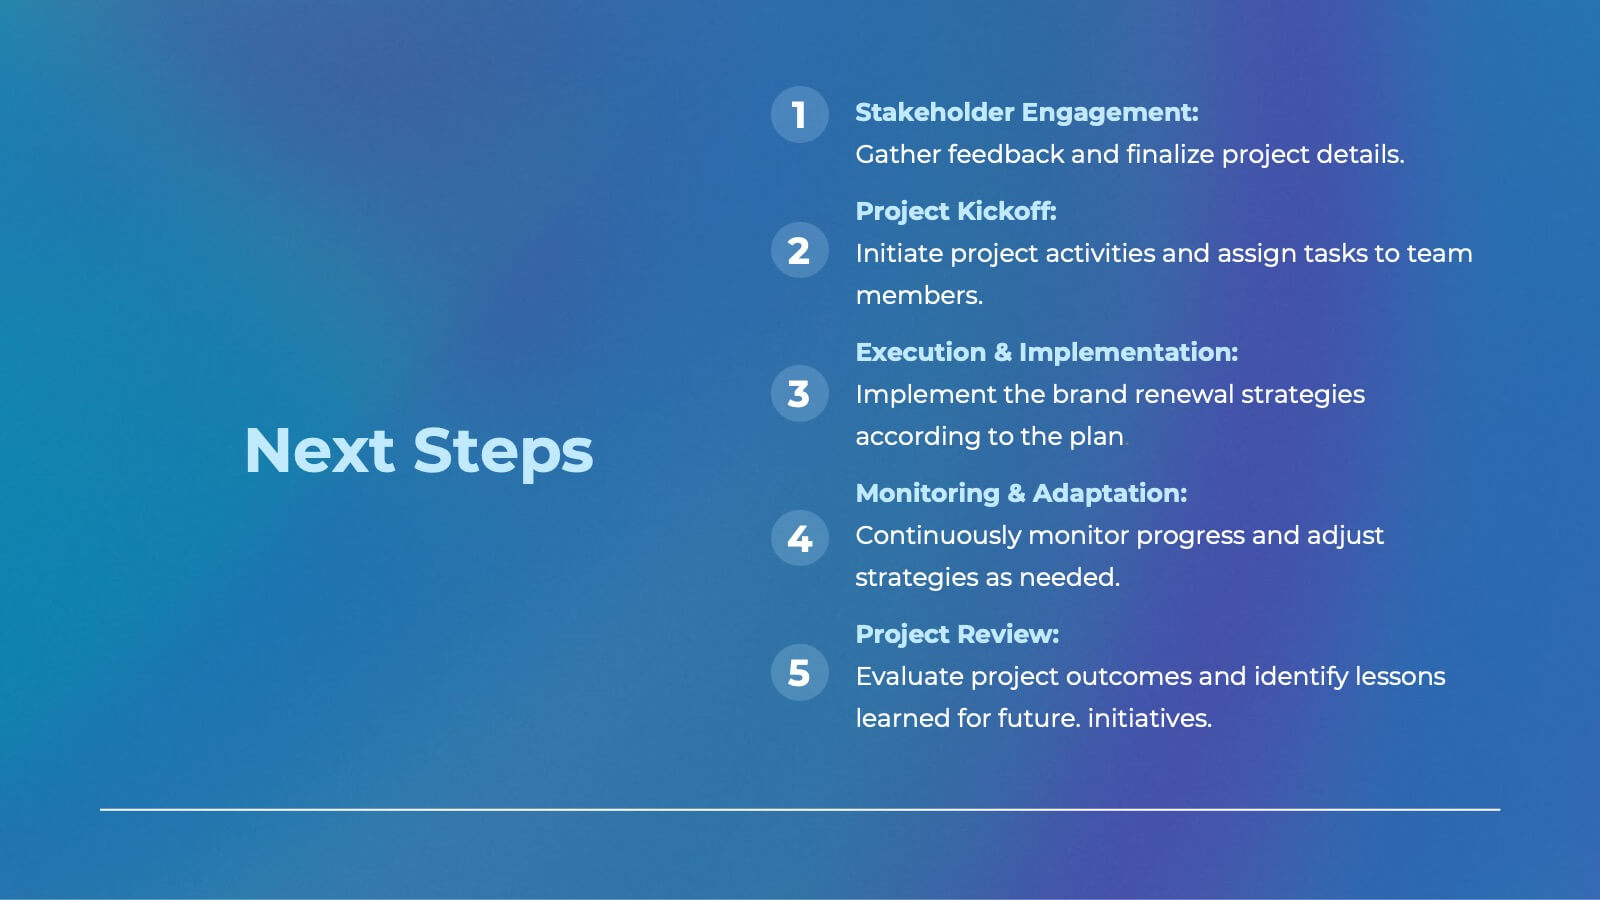
Spellis Rebranding Project Plan Presentation
Revamp your brand’s identity with this sleek and strategic presentation template. Covering key aspects such as brand values, audience personas, strategy, positioning, and future development, this template ensures a comprehensive rebranding approach. Fully customizable and compatible with PowerPoint, Keynote, and Google Slides for seamless use.


6 slides
Financial Health Overview Dashboard Presentation
Simplify financial reporting with this Financial Health Overview Dashboard. Designed for analysts, executives, and consultants, it features a visual summary of key metrics and performance insights. Fully editable with icon placeholders and balanced layout. Ideal for PowerPoint, Keynote, and Google Slides presentations that demand clarity in financial storytelling.


6 slides
Targeted Segment Analysis and Mapping Presentation
Highlight your market focus with the Targeted Segment Analysis and Mapping Presentation. This circular layout is perfect for breaking down five audience segments, using subtle icons and visual emphasis for clarity. Ideal for marketers, strategists, and business analysts presenting niche targeting. Fully editable in Canva, PowerPoint, Keynote, and Google Slides.


7 slides
Business Model Canvas Infographic Presentation Template
The Business Model Canvas is a tool for articulating a strategy in the form of a business model for a start-up or existing enterprise. This template provides a visual overview for entrepreneurs and innovators to write about the critical components of their business, from different perspectives. With this template presenting information in graphical format, the Canvas aids communication between business people with different backgrounds and skill sets, helping to align ideas. We created a simple and effective presentation that will help you to grasp the concepts of this tool in a few minutes!


8 slides
Business Gap Analysis Framework Presentation
Identify key business gaps with this Business Gap Analysis Framework presentation template! Featuring a structured layout that highlights the current state, desired state, and actionable steps to bridge the gap, this template is perfect for strategic planning, performance reviews, and business growth discussions. Fully customizable and compatible with PowerPoint, Keynote, and Google Slides.


12 slides
Corporate Hierarchy Structure Presentation
Showcase your Corporate Hierarchy Structure with a sleek and professional design. This template helps visualize organizational roles, reporting relationships, and team structures for clear communication. Perfect for HR teams, business leaders, and project managers, it’s fully customizable and compatible with PowerPoint, Keynote, and Google Slides for easy editing.


5 slides
User Experience Survey Findings Presentation
Present key insights from your user research in a clean and impactful way with this survey findings slide. Designed to highlight percentages and categories clearly, it helps your audience quickly understand what users value most. Ideal for UX reports and product feedback reviews. Fully compatible with PowerPoint, Keynote, and Google Slides.


4 slides
Crypto Investment and Trading Strategies Presentation
Visualize your crypto strategy with clarity using this modern, step-by-step slide. Featuring a rising arrow graph, coin icon, and shopping cart illustration, this layout is ideal for explaining investment phases, trading tactics, or market entry strategies. Editable in PowerPoint, Keynote, and Google Slides for maximum flexibility.


5 slides
AIDA Digital Marketing Infographics
Immerse yourself in the dynamic world of digital marketing with our AIDA digital marketing infographics. This template, drenched in striking cream, red, and blue hues, adopts a vertical design, perfect for professionals, marketers, and educators looking to elucidate the renowned AIDA model (Attention, Interest, Desire, Action). Each section is enriched with creative graphics, icons, and image placeholders, simplifying complex marketing strategies into digestible visual narratives. It's the quintessential tool for captivating presentations, compelling marketing pitches, or educational materials in digital marketing workshops.


6 slides
Framework Version Infographic
A framework infographic is a visual representation that outlines a structured approach, model, or framework for understanding a concept, solving a problem, or making decisions. This infographic template involves visually presenting different versions of a software or system framework along with their features and benefits. Summarize the improvements and benefits introduced by each framework version. This template provides a clear overview of the evolution of the framework and how each version brought value to users. By using icons, graphics, and concise descriptions, you can make the information easily digestible and engaging for your audience.


4 slides
Side by Side Comparison Presentation
Enhance your presentations with our "Side by Side Comparison Presentation" template. Designed for clarity, this infographic facilitates effective comparison of key business insights across multiple categories using a side-by-side layout. Color-coded arrows distinctly mark each comparison point, ensuring easy navigation and comprehension. Ideal for strategic reviews, product comparisons, or competitive analyses, this template helps present complex data clearly and engagingly. Its structured format is perfect for professionals looking to articulate differences and similarities effectively. Fully compatible with PowerPoint, Keynote, and Google Slides, it's an indispensable tool for those needing to present comparative data succinctly and persuasively.