


Features
- 3 Unique slides
- Fully editable and easy to edit in Microsoft Powerpoint, Keynote and Google Slides
- 16:9 widescreen layout
- Clean and professional designs
- Export to JPG, PDF or send by email


Do you have any questions?
Recommend


7 slides
Credit Card Infographic Presentation Template
A Credit card Infographic is a stacked chart showing data visualization of credit card types and associated information, including the number of cards owned by different age groups and gender, as well as overall debt. This infographic allows you to cover the ins and outs of credit cards, from rewards to fees and interest rates. This template will help you understand how credit cards work, while comparing cards based on price and other important factors. This Infographic is the perfect way to visualize data, trends and facts in an engaging way that grabs attention and keeps people reading.


7 slides
Time Management Infographic Presentation Template
Time management skills are important in all aspects of life, not just work. Mastering time management allows you to get everything that you want out of your day. This time management template is the perfect tool to help you stay productive. Keep track of tasks, create a schedule and organize time where you need it most. Use this template to build a database of your weekly tasks, daily activities and recurring tasks that can be easily structured in a clock view. This time management template Is compatible with Powerpoint, Keynote, and Google Slides, so you can use it on any device.


26 slides
Effective Communication Skills Presentation
Discover the key to successful interactions with our Effective Communication Skills presentation template. This all-in-one template is fully compatible with PowerPoint, Keynote, and Google Slides, making it the perfect addition to your toolkit, whether you're an educator, a corporate trainer, or a team leader. Our template is meticulously designed to help you convey the essence of effective communication, breaking down complex concepts into easily understandable segments. From active listening to clear articulation, it covers various aspects of communication that are crucial in both personal and professional environments. Each slide in the Effective Communication Skills template features a clean, engaging design, encouraging viewers to focus on the content. Editable charts, graphs, and models allow for a customized experience, ensuring that your message resonates with your specific audience. By using this template, you can confidently guide your audience through the intricacies of effective communication, making your presentation a reference point for those looking to improve their communication skills. Elevate your presentations and ensure your message is not just heard, but understood and acted upon.


25 slides
Siren Rebranding Project Plan Presentation
This sleek brand presentation template covers essential elements like market analysis, brand guidelines, positioning, and audience insights. It's designed to showcase your brand identity and development strategies with a modern layout. Compatible with PowerPoint, Keynote, and Google Slides, it’s perfect for delivering professional and engaging brand presentations.


7 slides
Home Office Scenes Infographic
Dive into the intricacies of the home office environment with our office scenes infographic. Rendered in a sophisticated palette of white and dark blue, this infographic offers an insightful visual exploration of today's work-from-home culture. With detailed icons and illustrative graphics, the design brings to life various scenarios and components of a home office. The layout is geared towards offering practical insights to its viewers. This template is perfect for remote work advocates, and any company transitioning to a hybrid work model. Compatible with PowerPoint, Keynote, and Google Slides this ensures seamless integration into your presentations.


6 slides
Investment Trust Infographic
An investment trust, also known as a closed-end fund, is a type of collective investment vehicle that pools funds from multiple investors to invest in a diversified portfolio of assets. This Infographic template visually communicates key information about investment trusts, which are financial vehicles from multiple investors to invest in a diversified portfolio of assets. This template highlights different types of investment, such as trusts, fixed-income trusts, or sector-specific trusts. The icons and images are included to represent each type. This infographic is fully customizable and compatible with Powerpoint, Keynote, and Google Slides.
22 slides
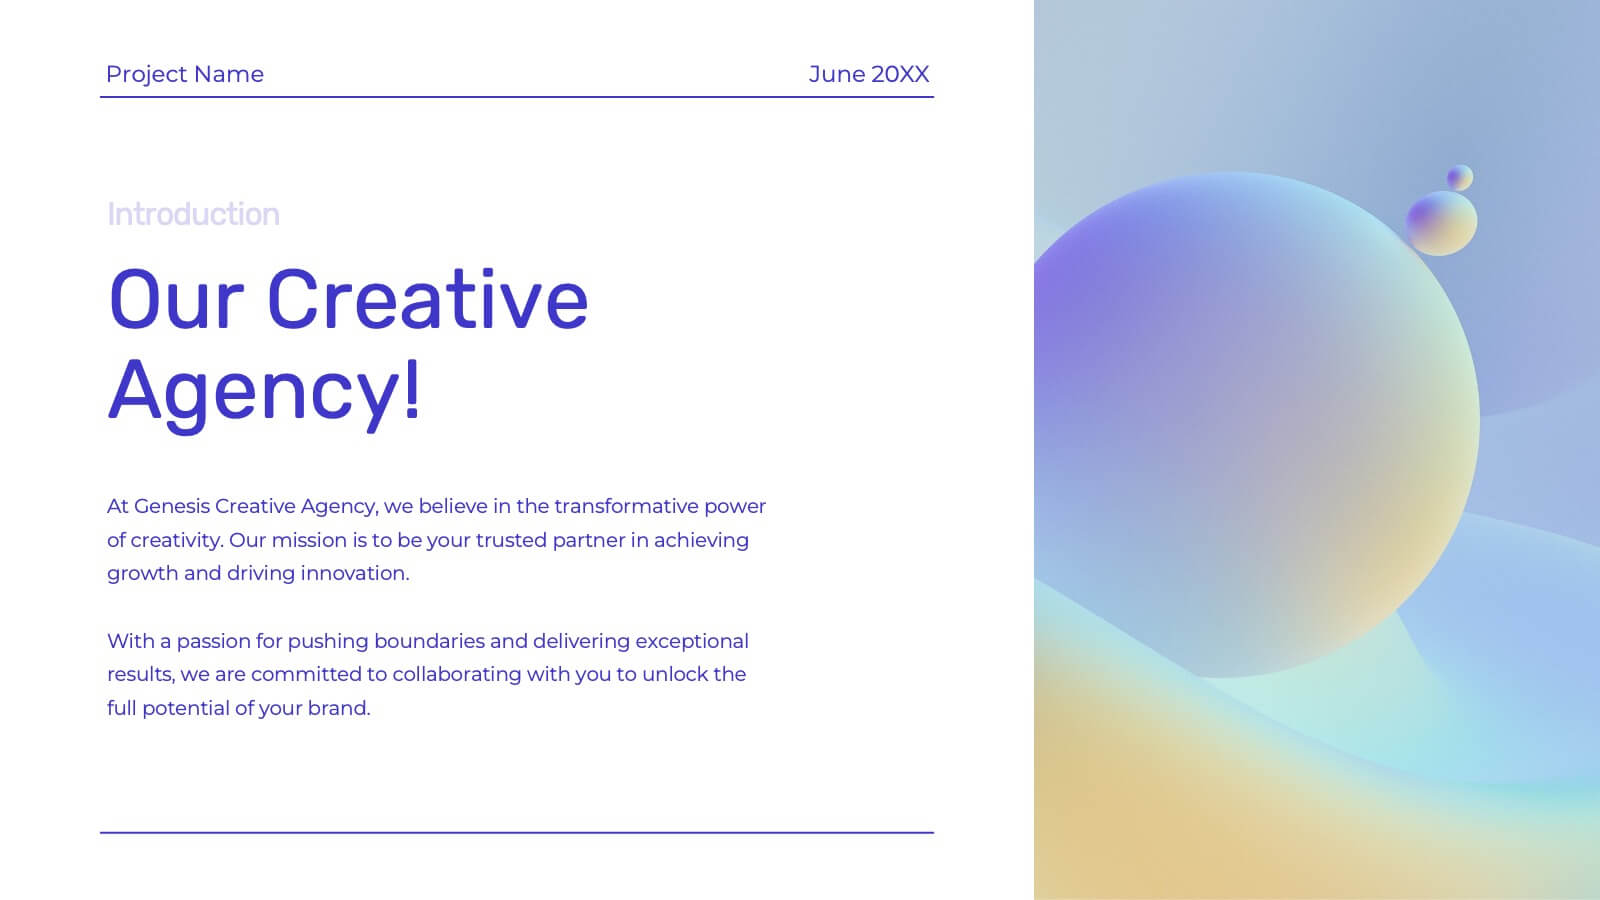
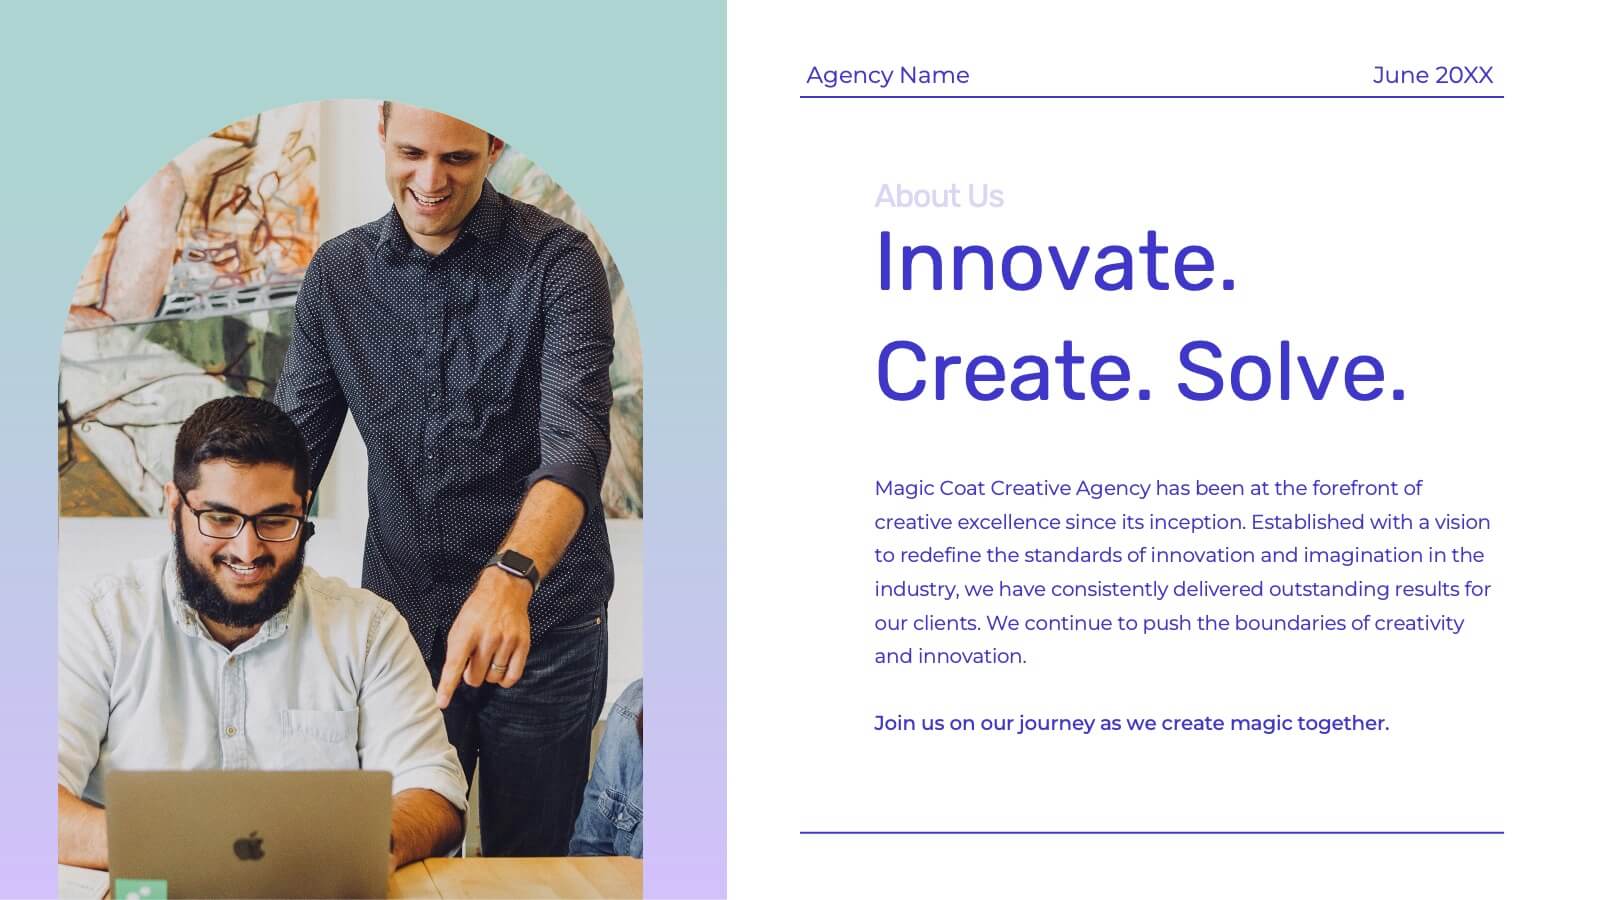
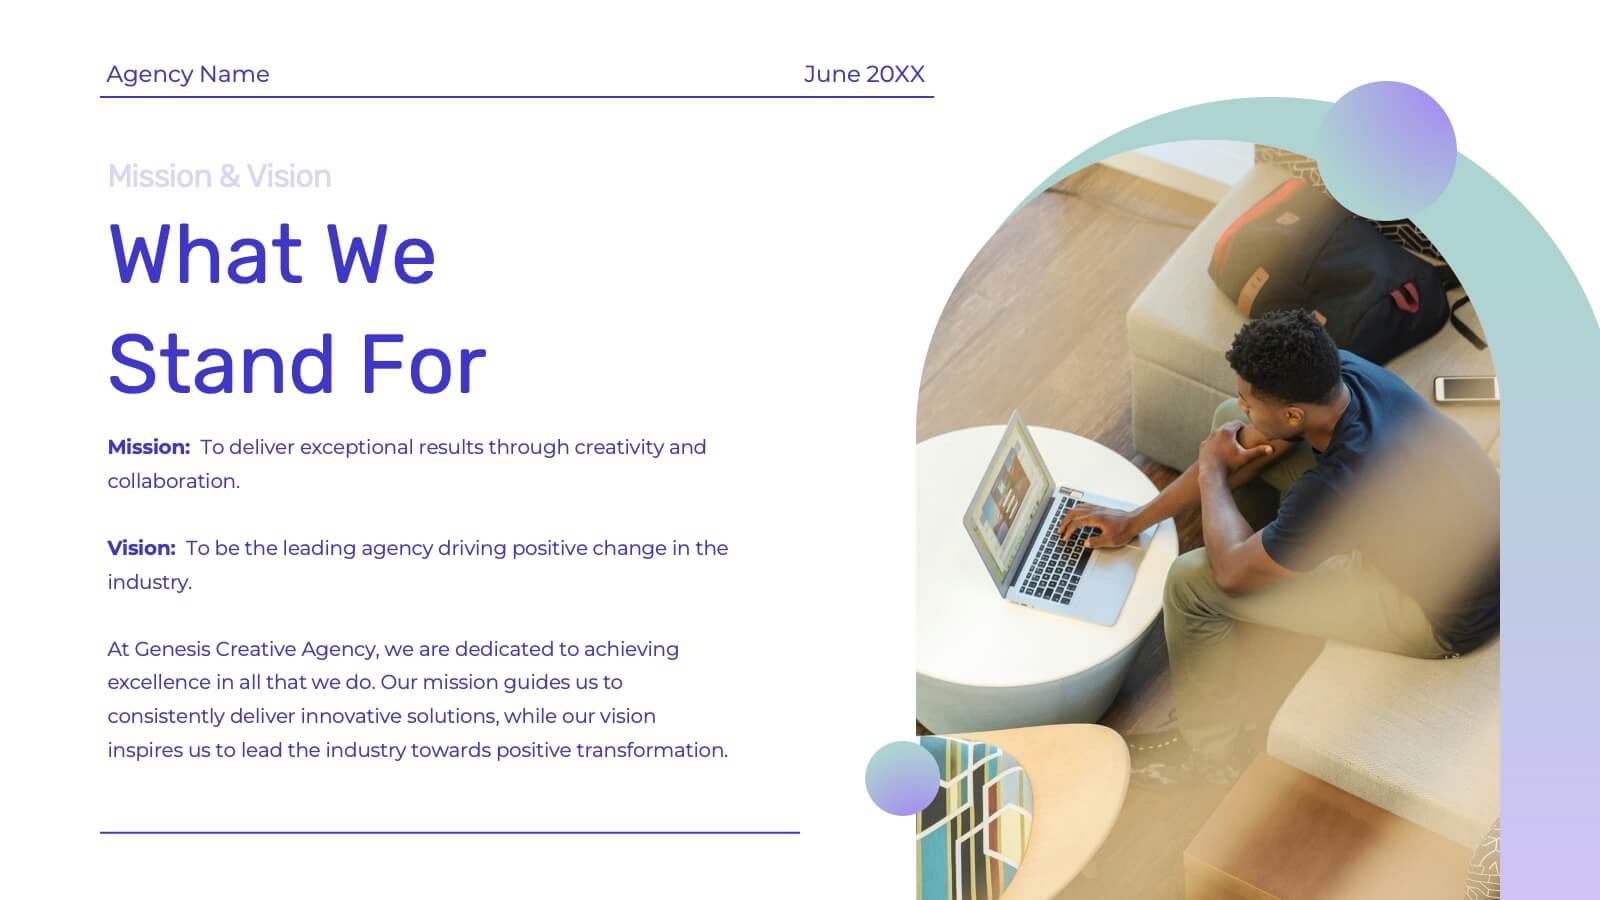
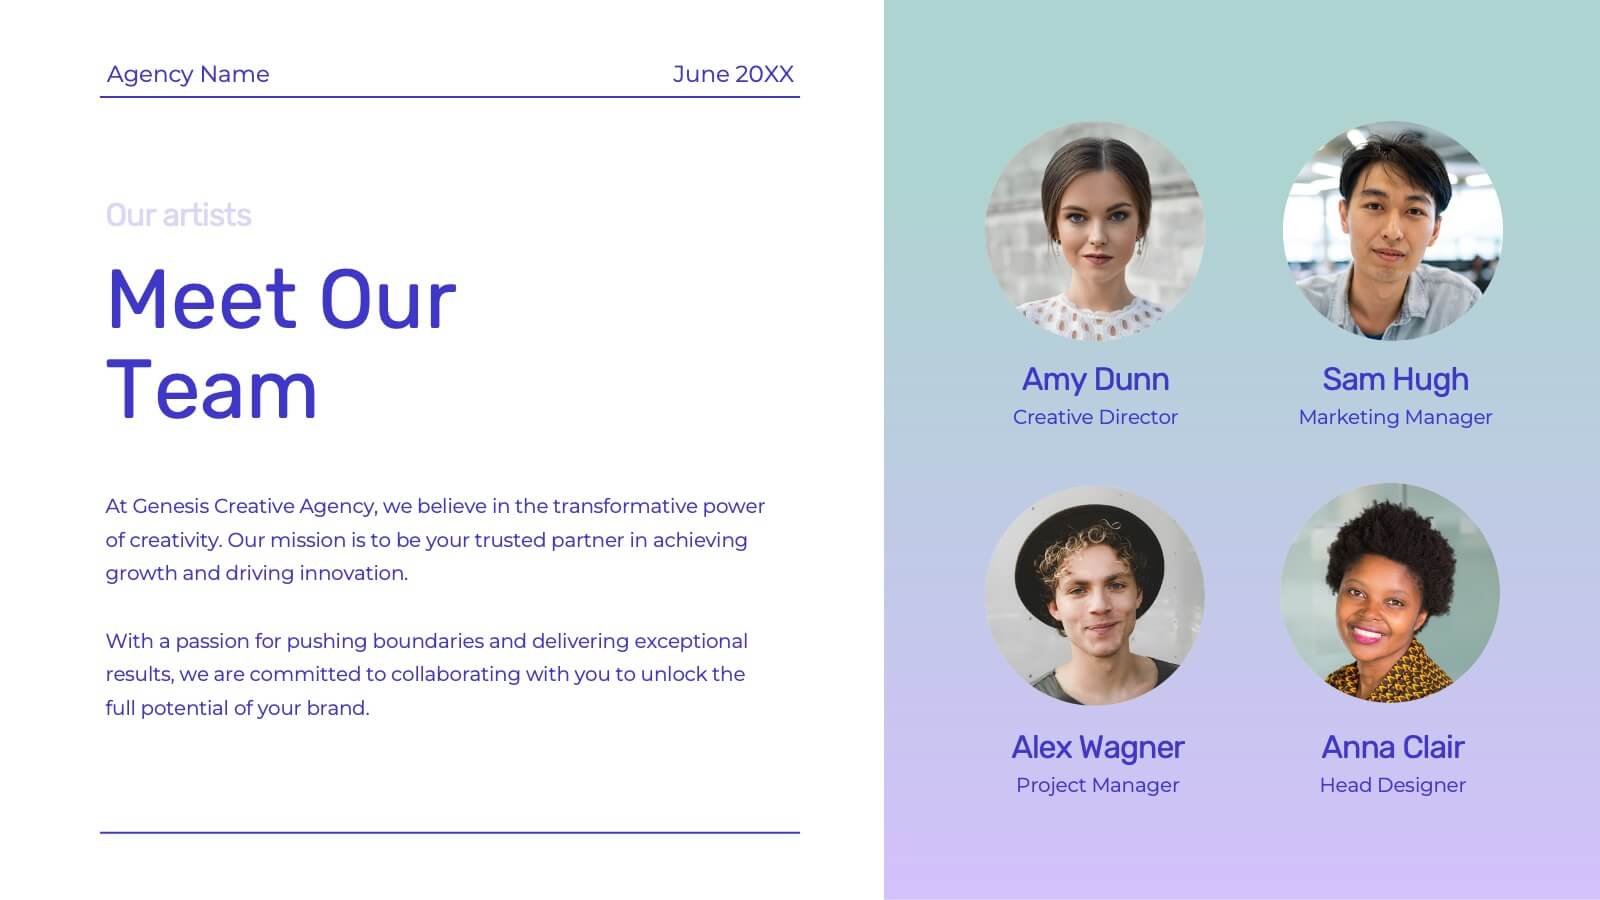
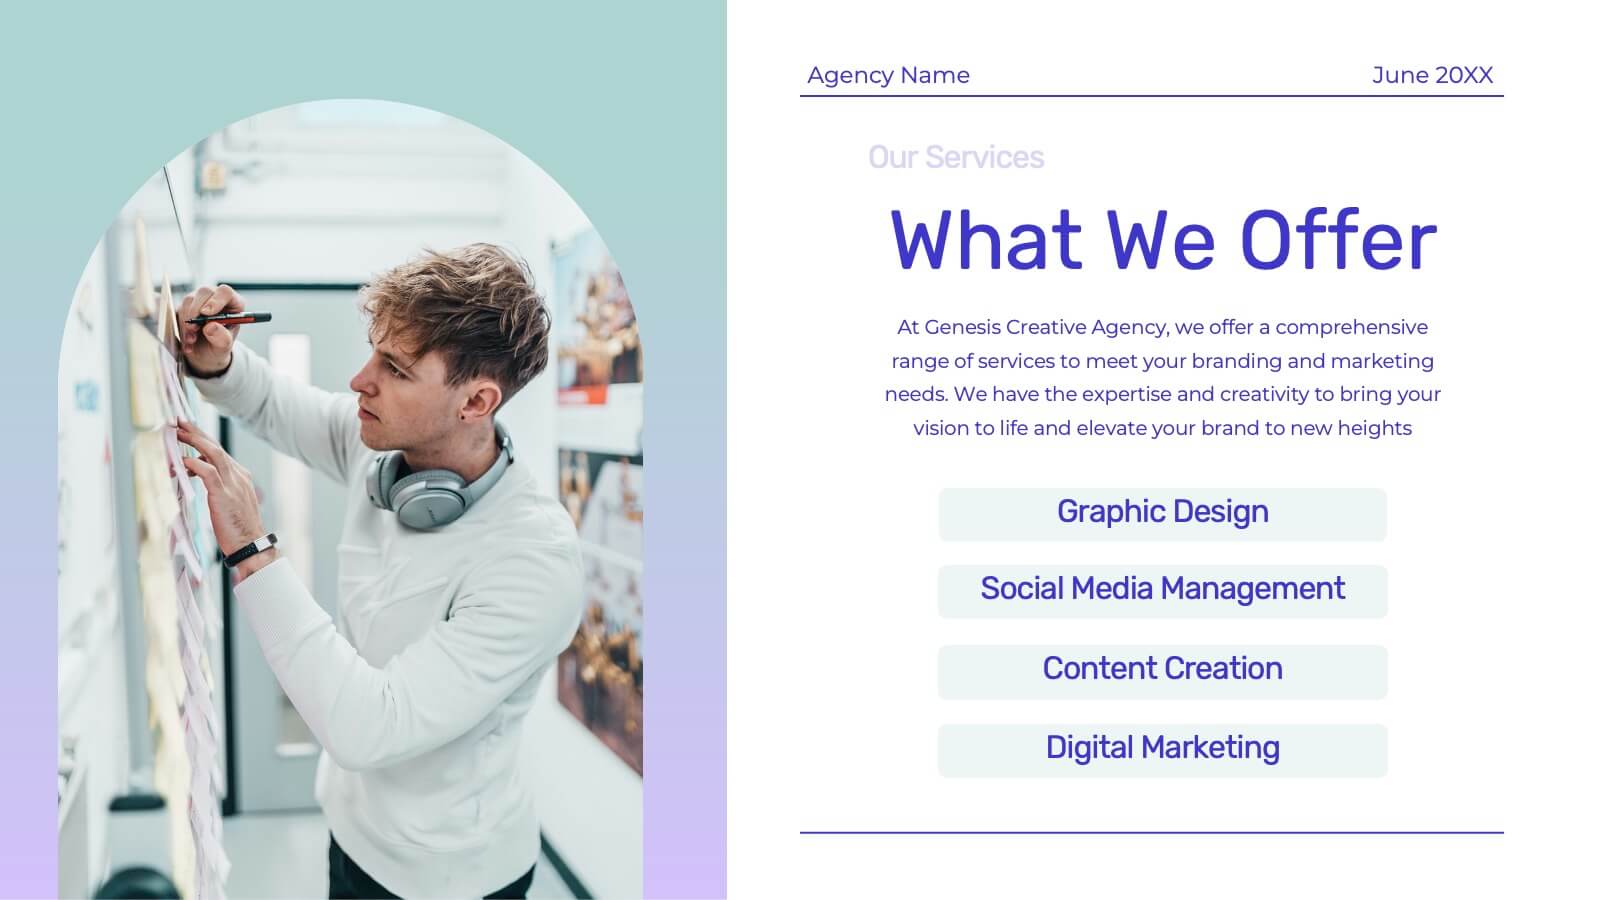
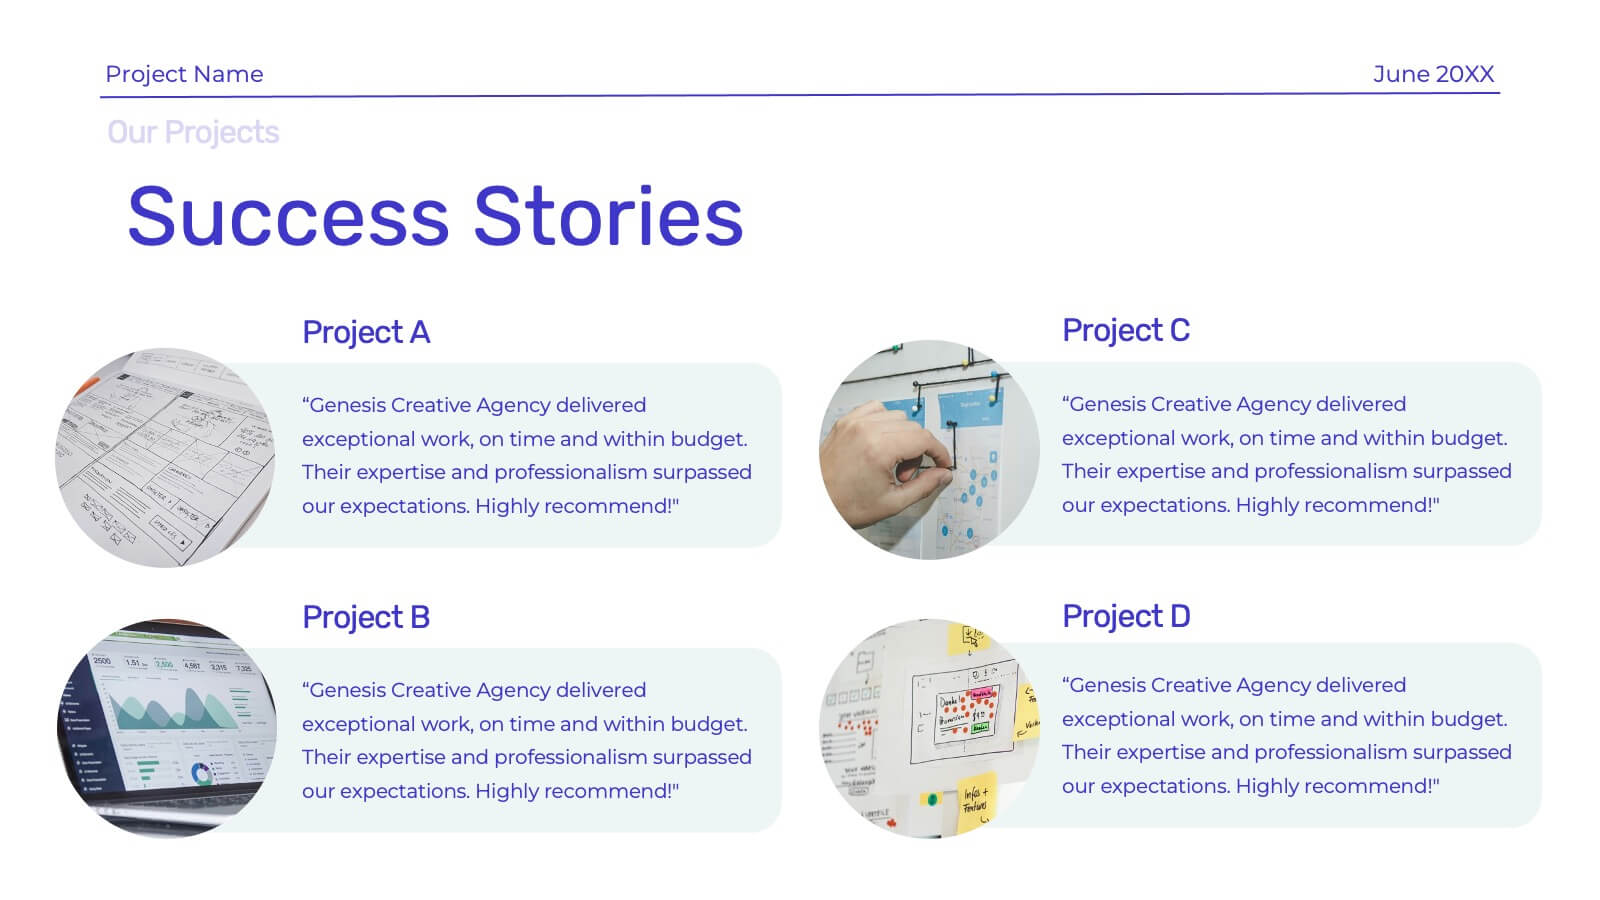
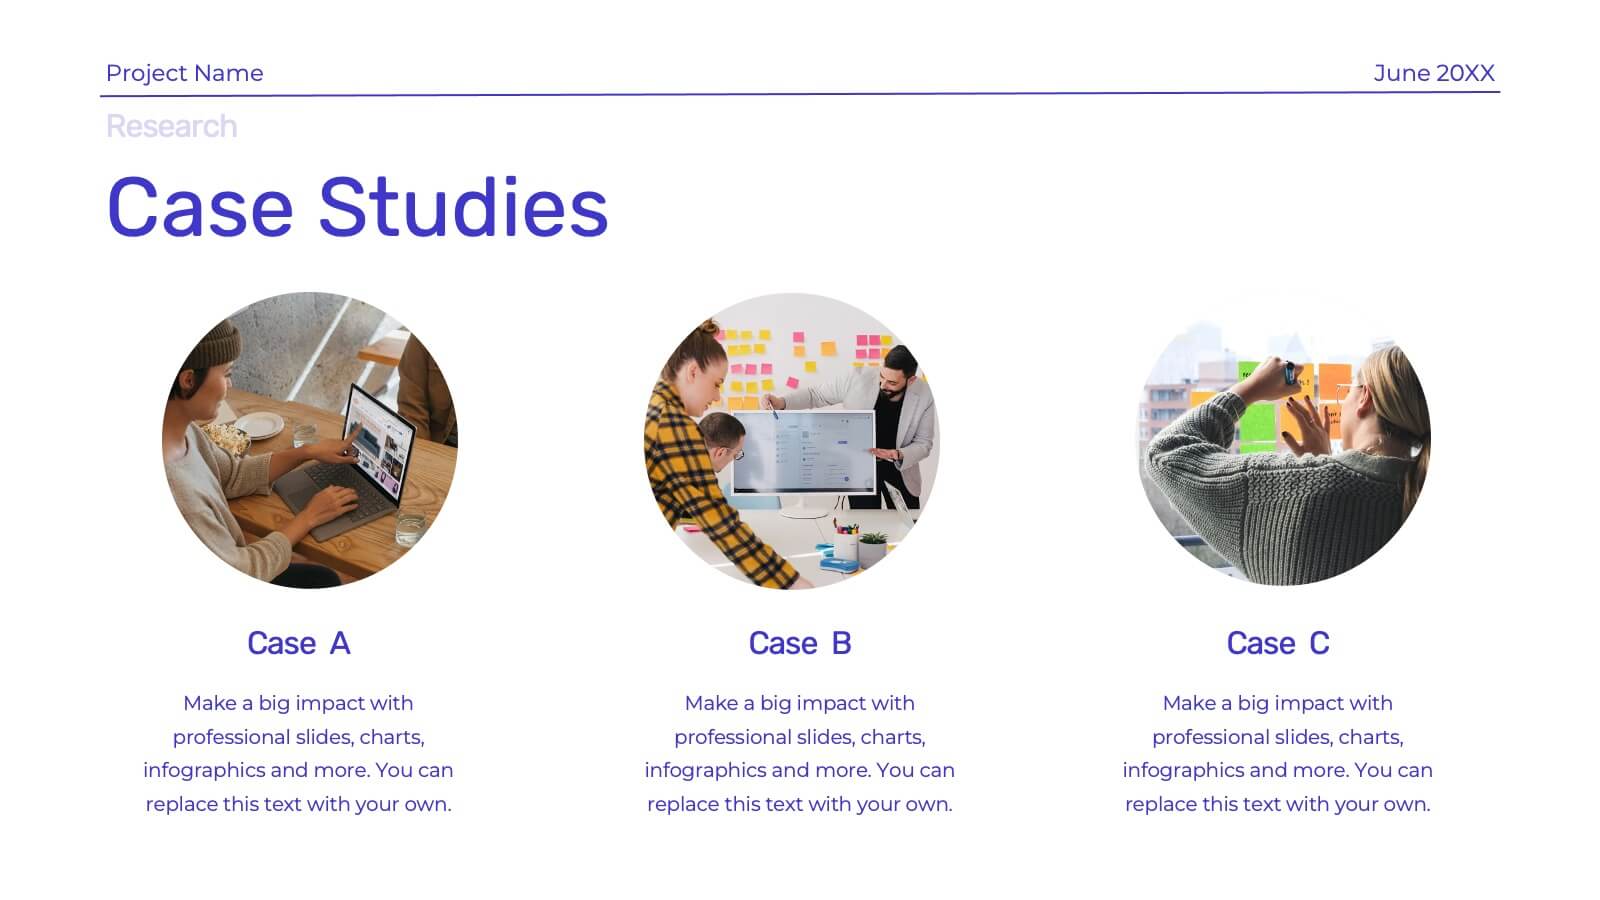
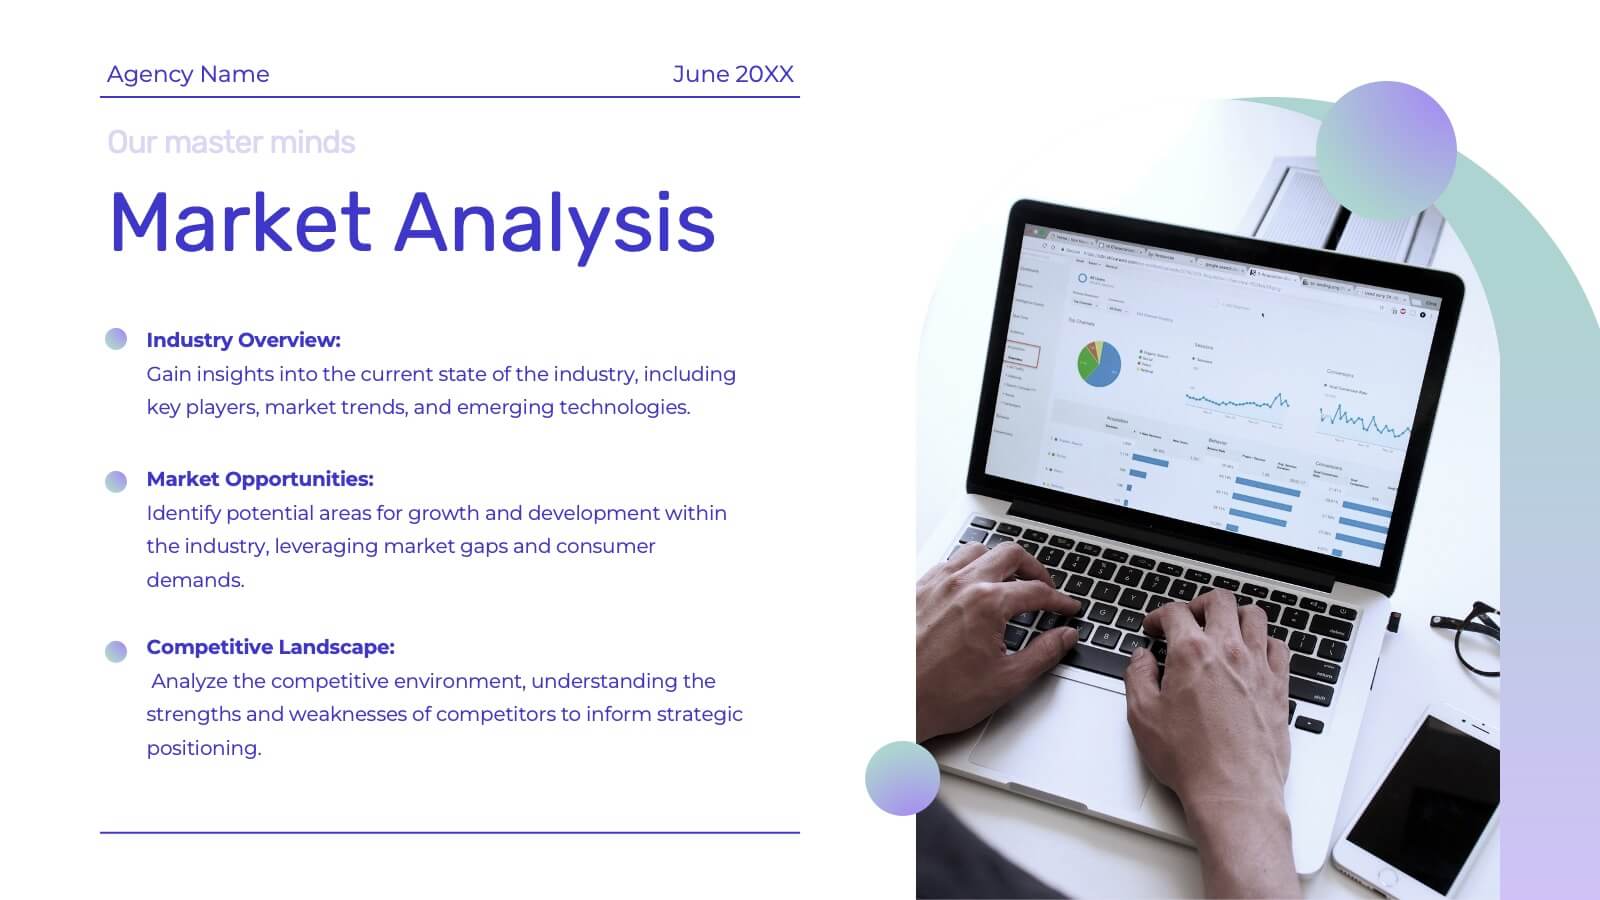
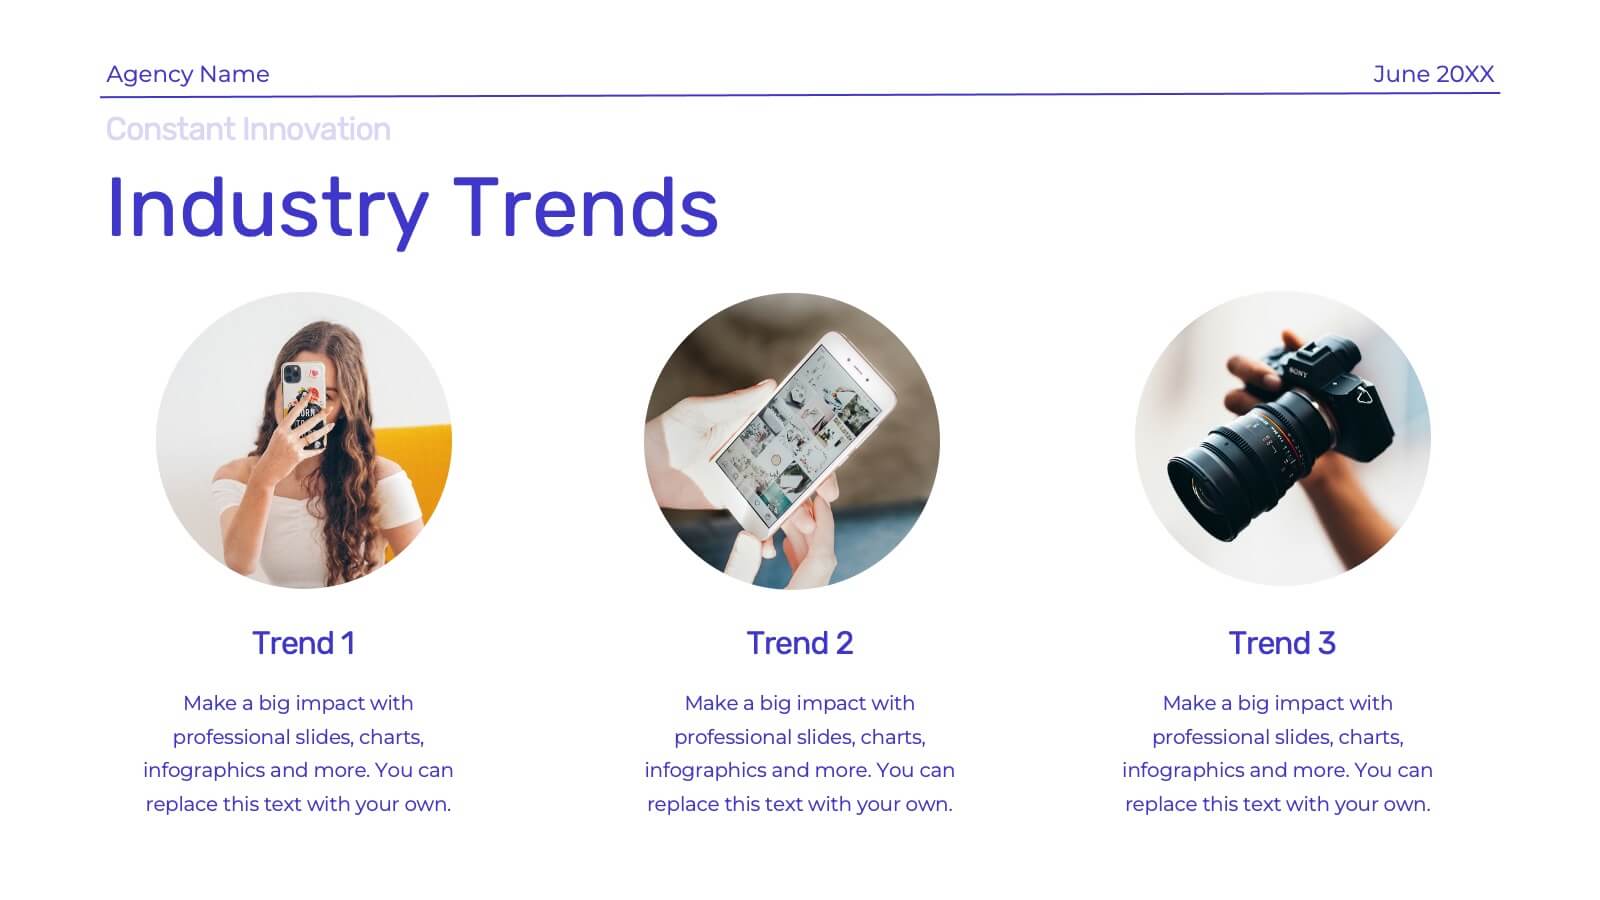
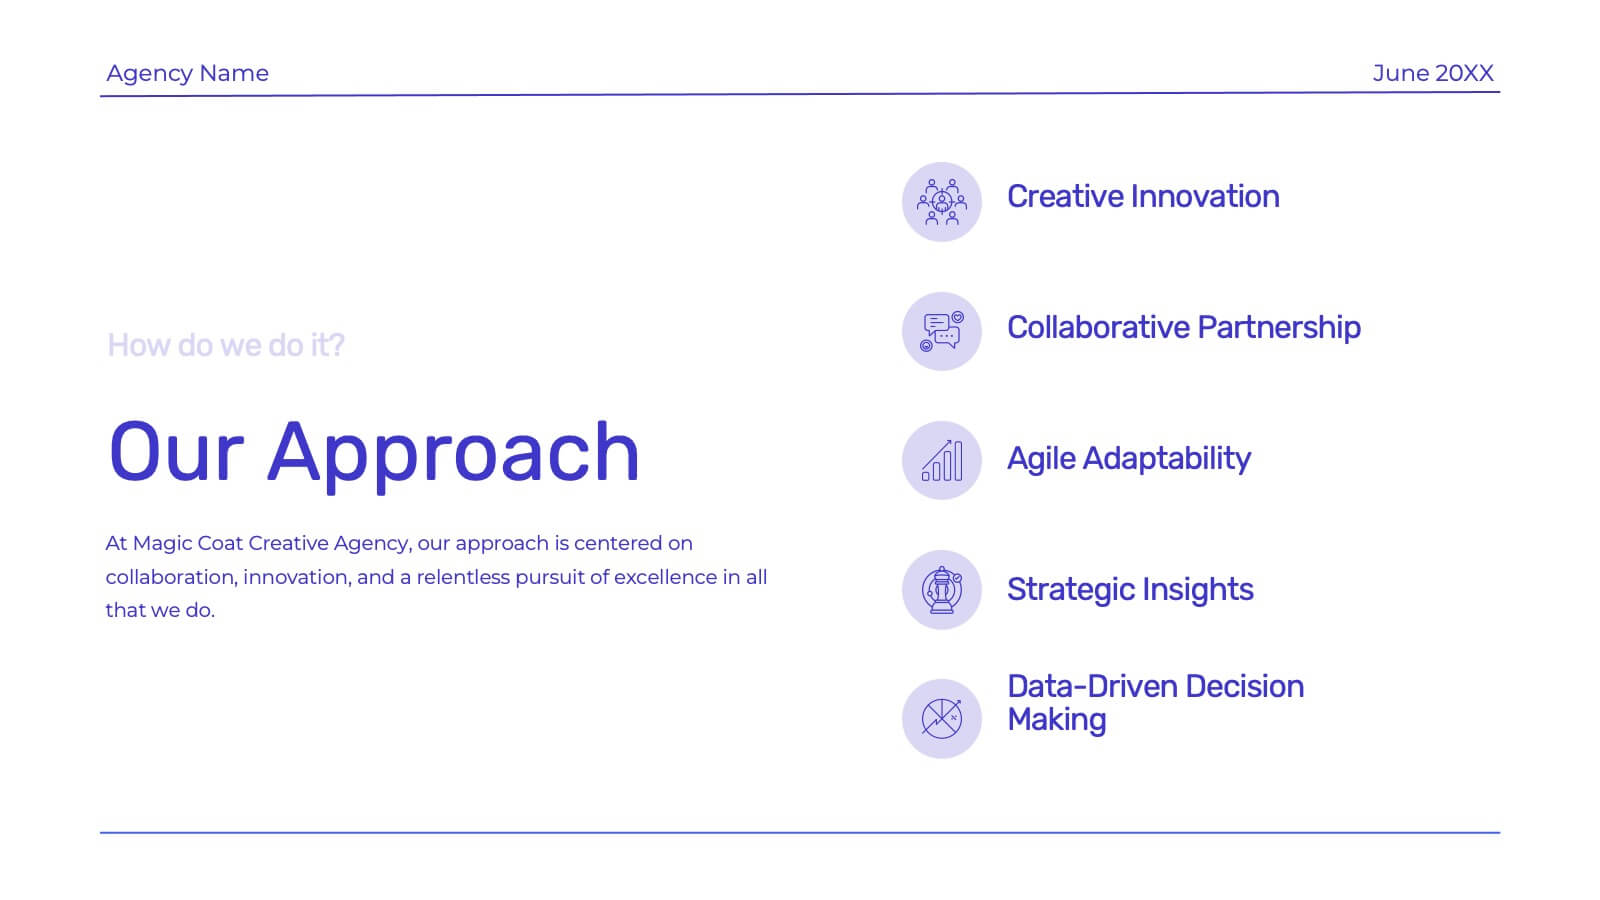
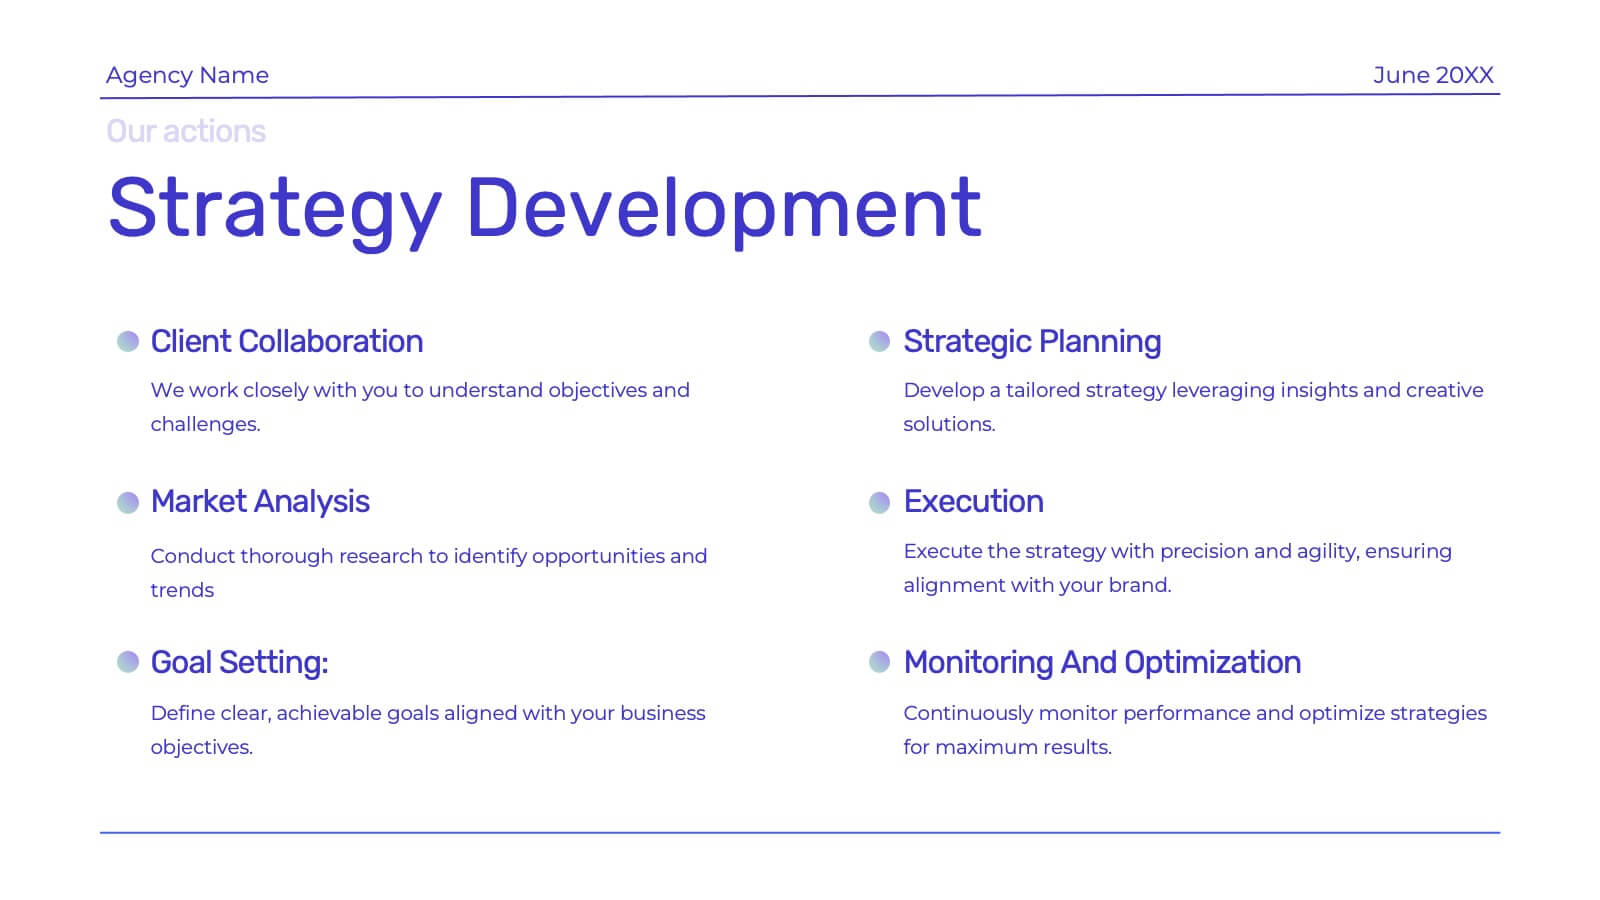
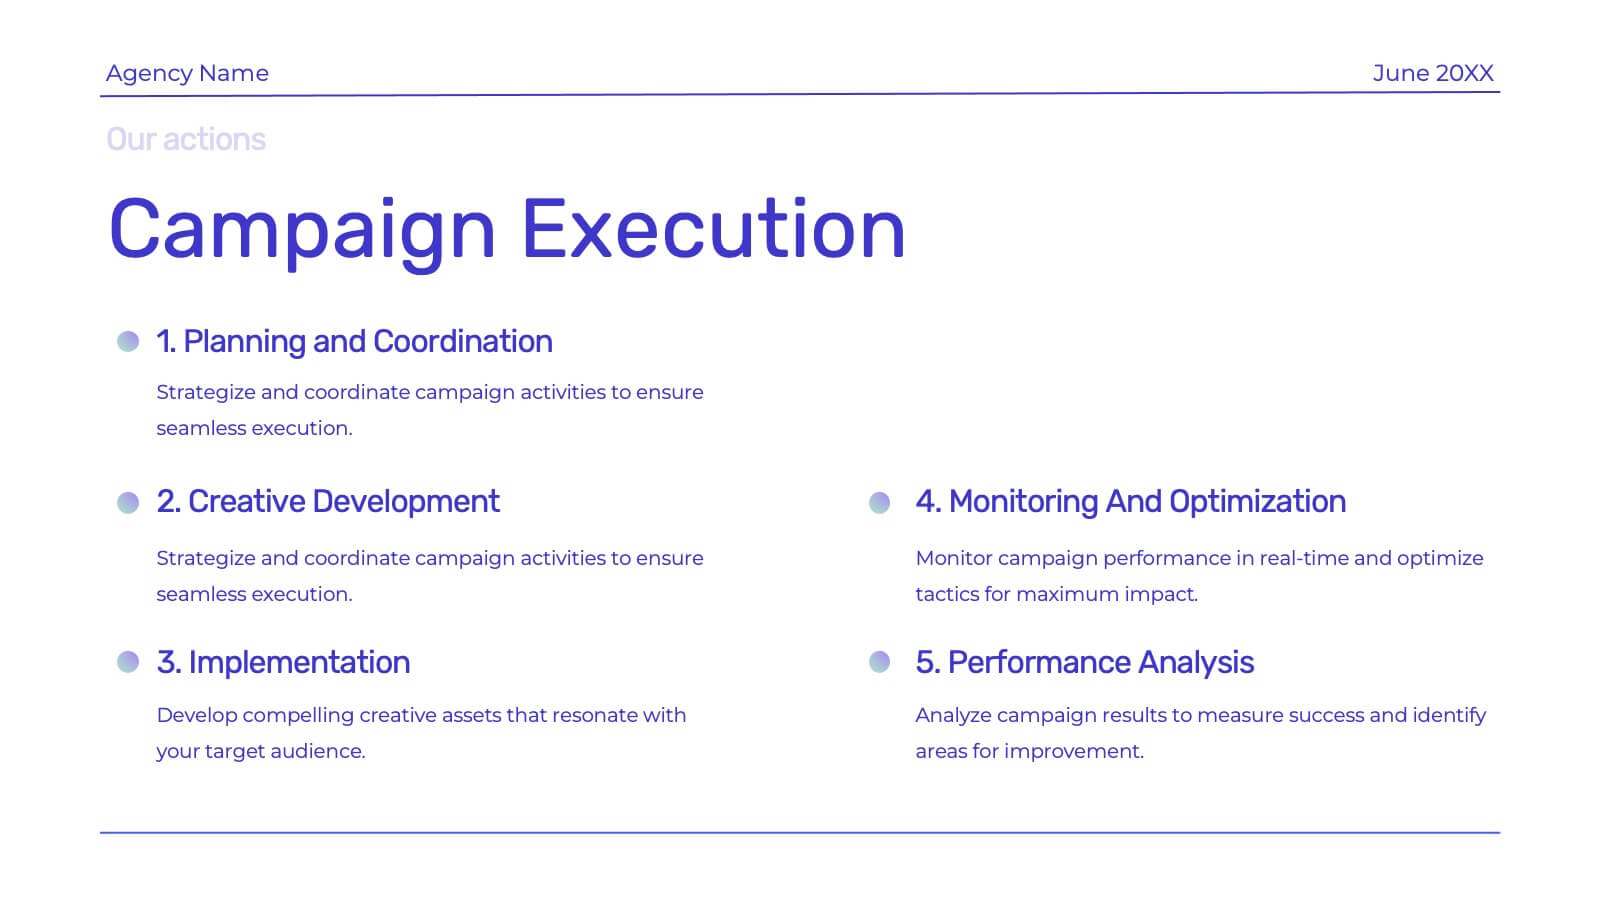
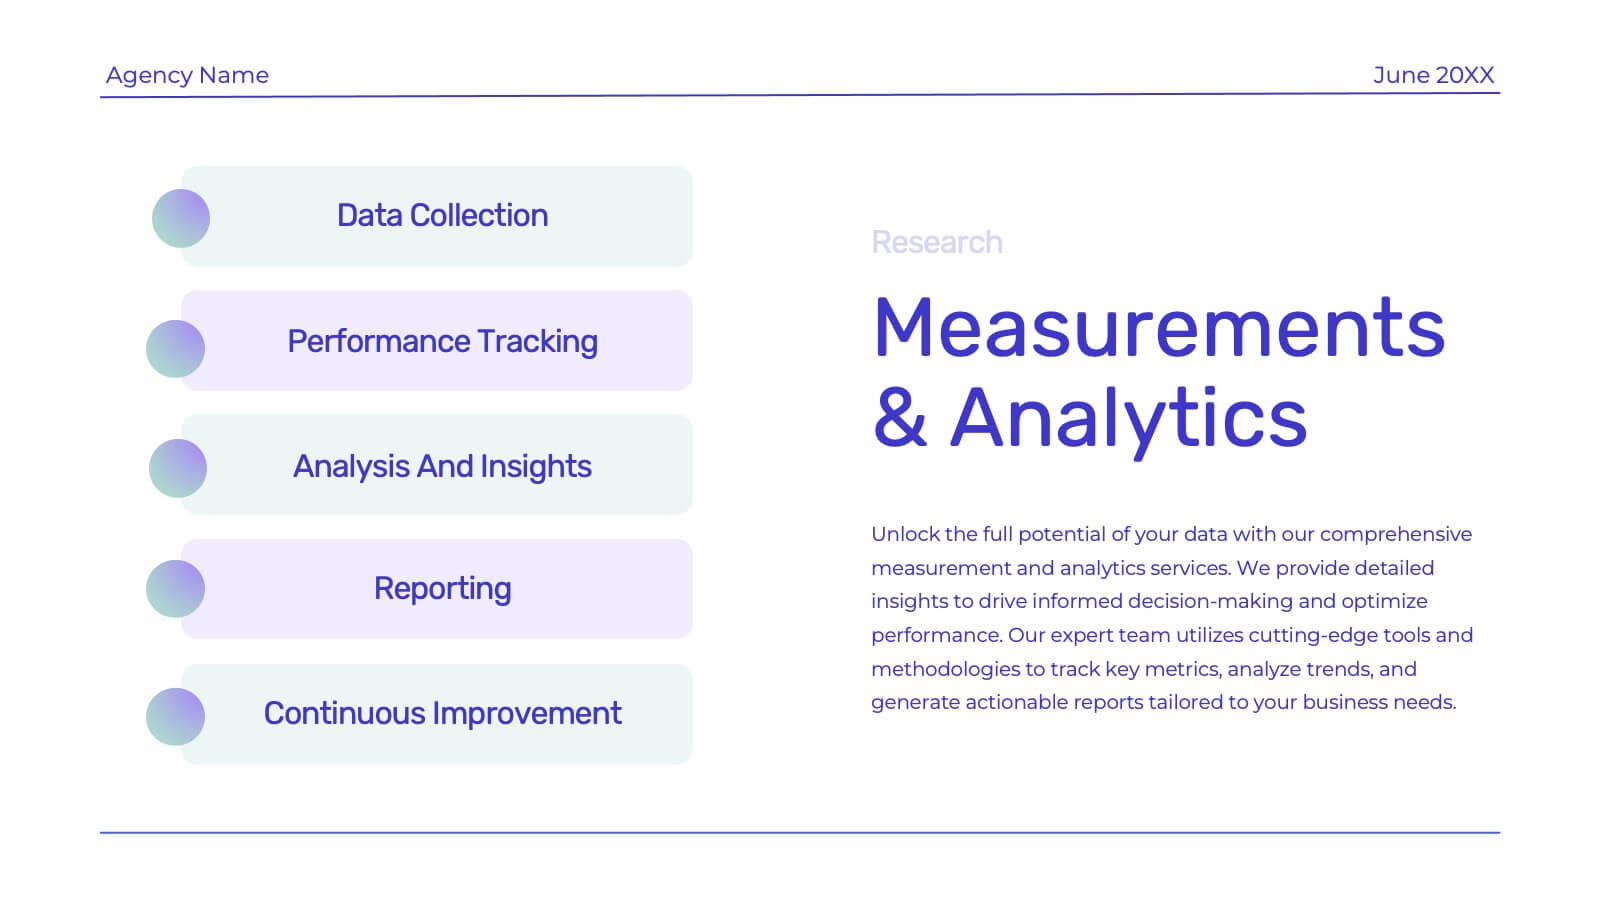
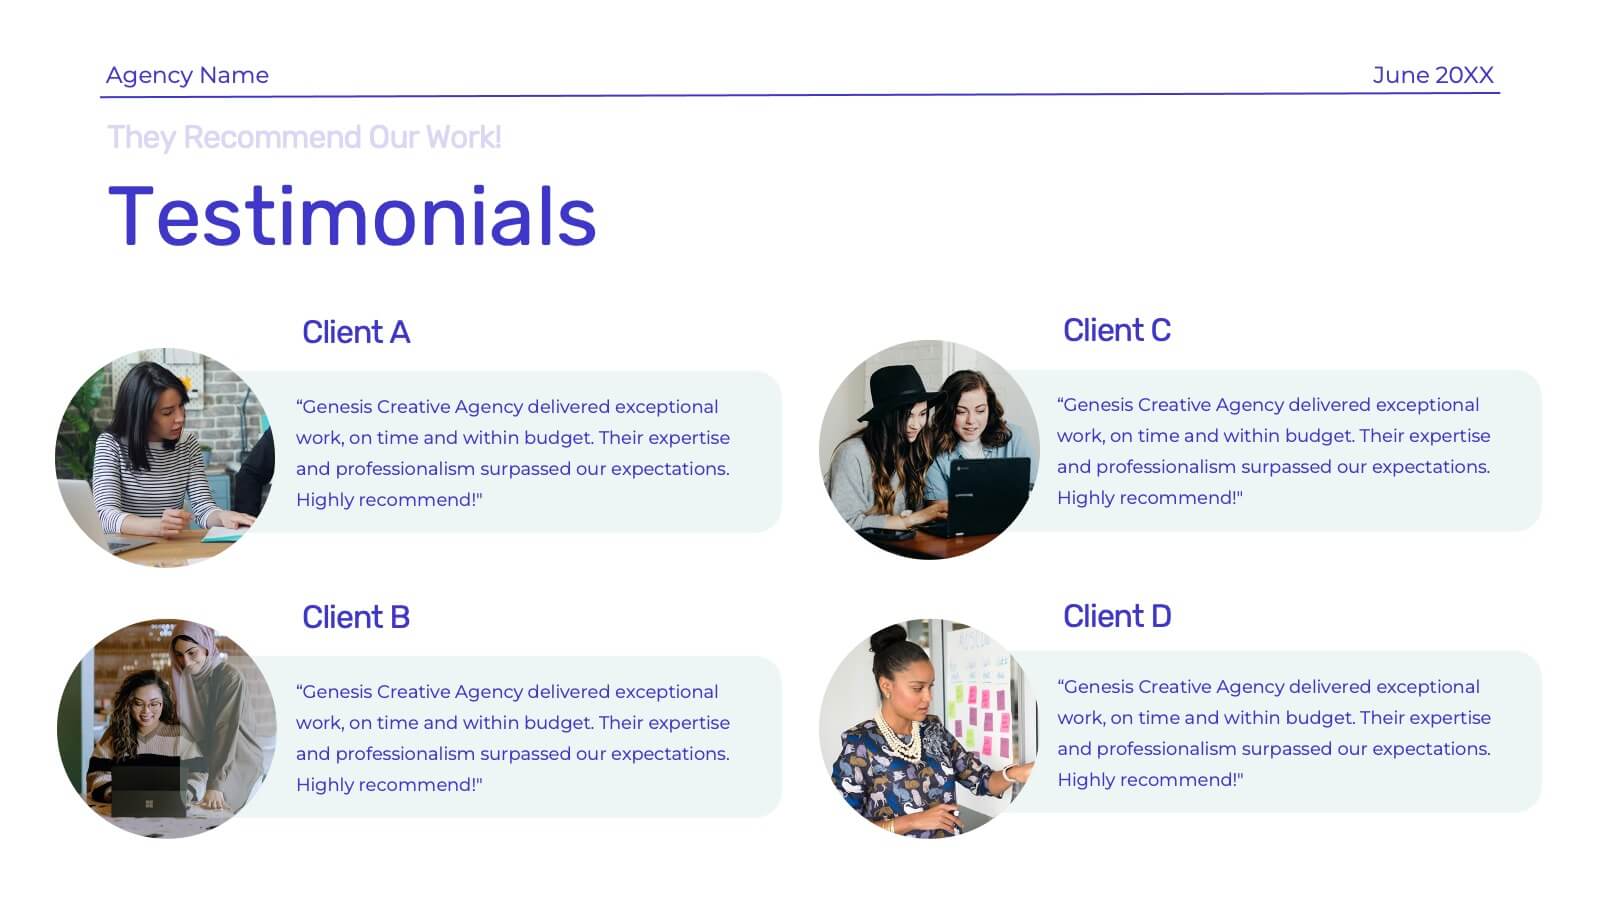
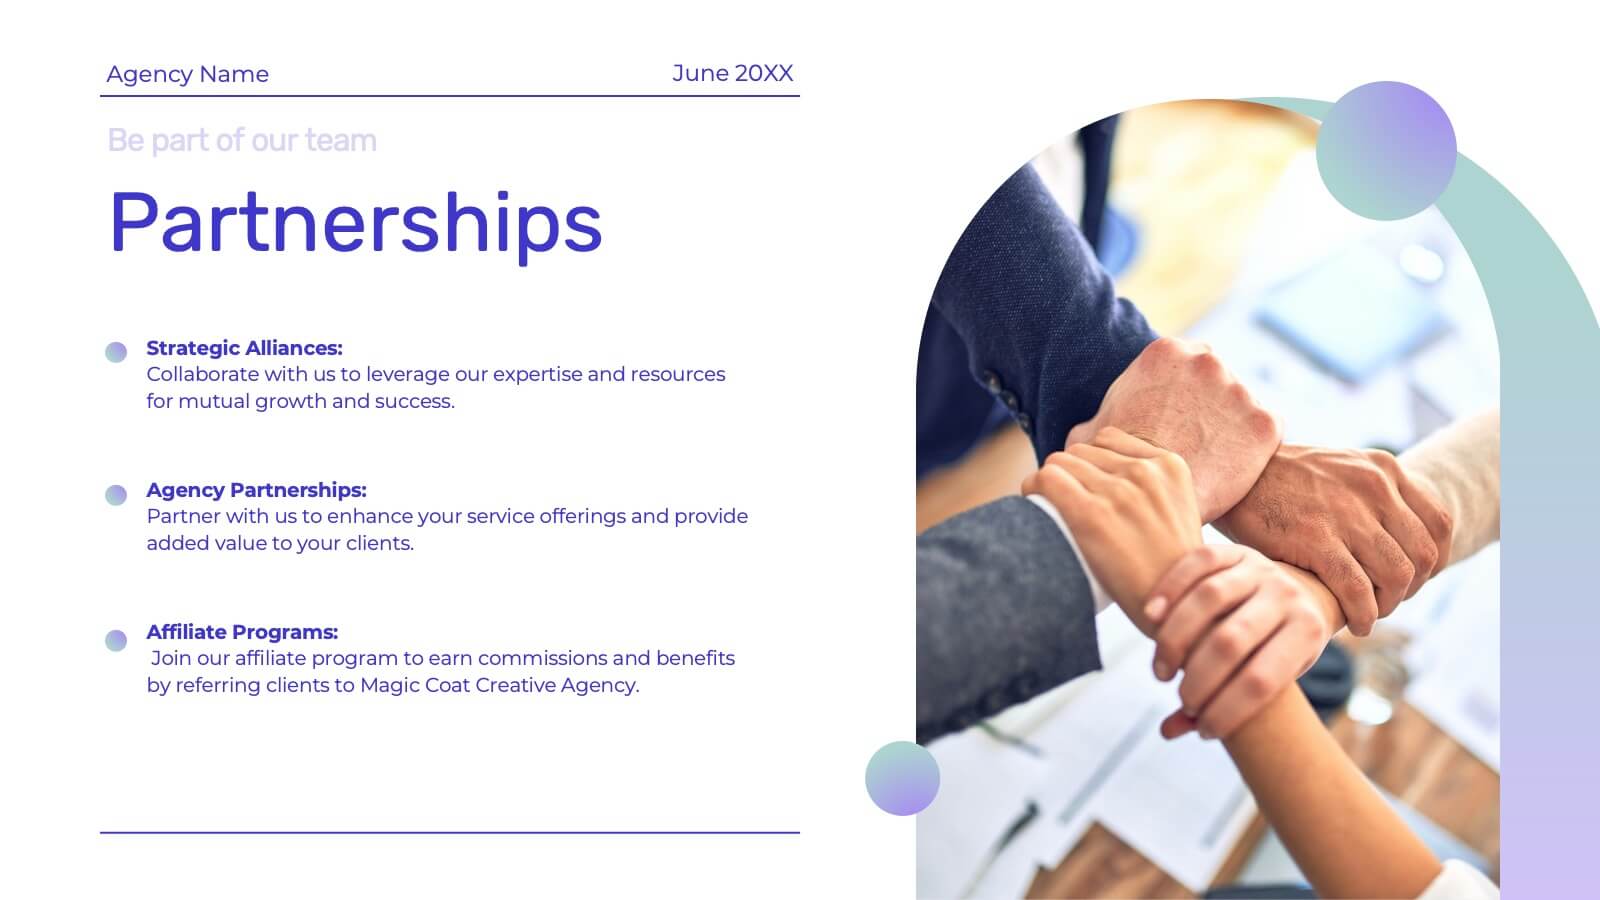
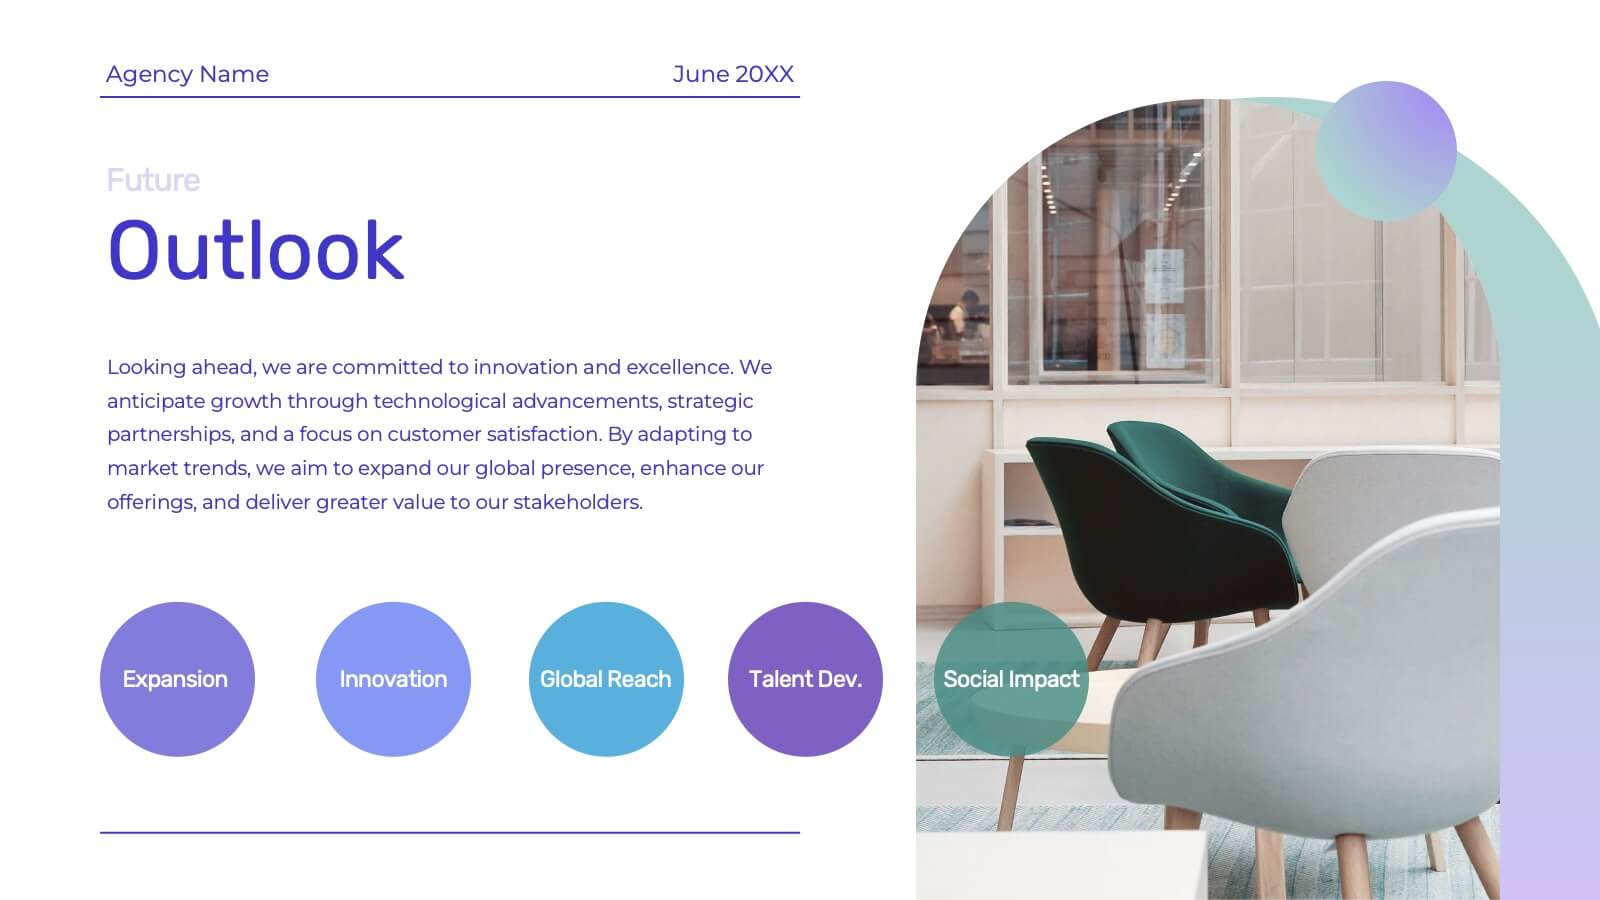
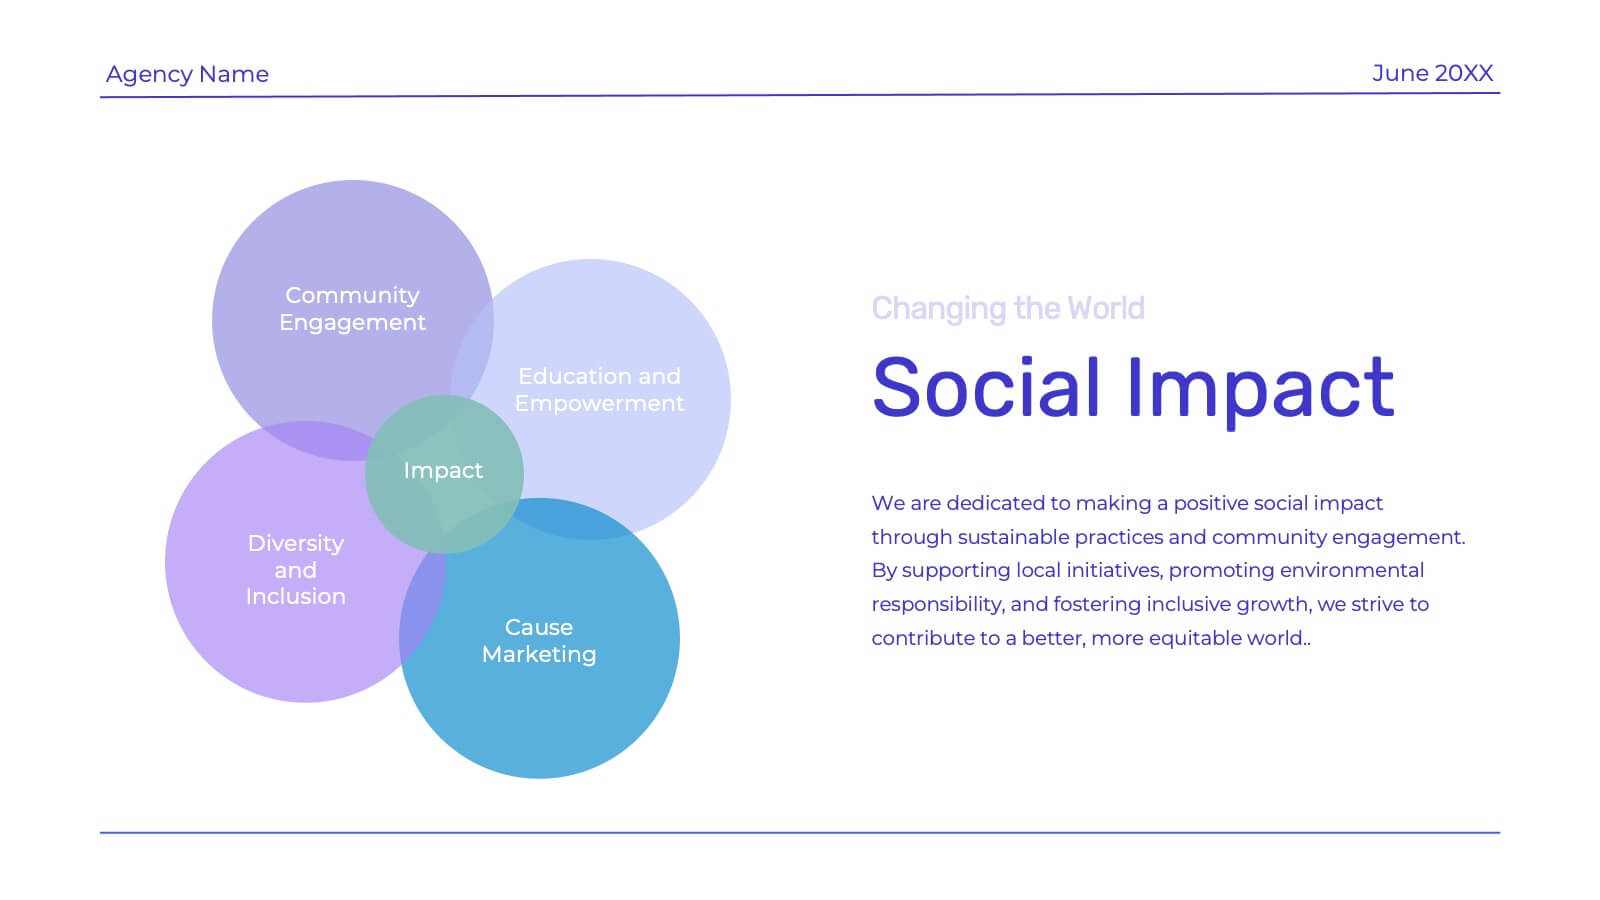
Genesis Creative Agency Pitch Deck Presentation
Showcase your creative agency’s strengths with this vibrant template. Highlight your team, services, success stories, and unique approach. Ideal for case studies, market analysis, and campaign execution. Fully compatible with PowerPoint, Keynote, and Google Slides.


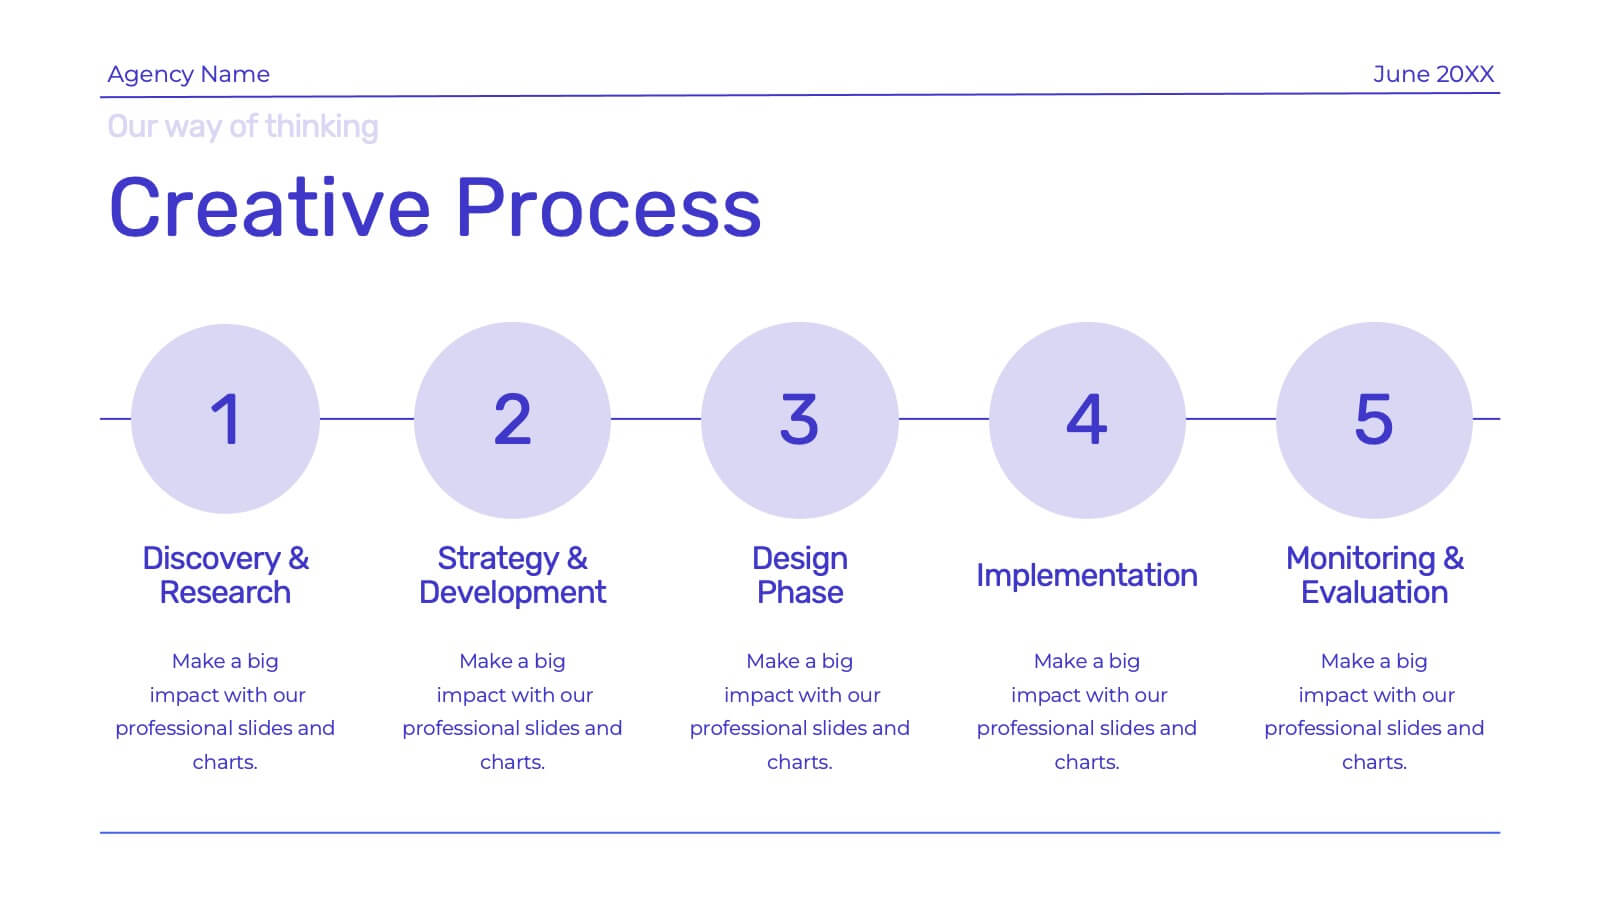
5 slides
Process Flow Infographics
Streamline your pathway to success with our process flow infographics template. Utilizing a professional gray palette accented with colorful highlights, this creative vertical design is tailored for clarity and impact. Ideal for business strategists and process engineers, this template assists in illustrating step-by-step progressions or workflows in an engaging manner. It's perfect for those who need to communicate processes effectively, ensuring every phase is visually represented and easy to understand. This template comes equipped with innovative graphics, diverse icons, and dedicated spaces for images, making your data presentation a smooth, navigable experience.


7 slides
Demographic Data Infographic
Demographic data refers to information that characterizes the composition of a population or a specific group based on various socio-economic factors. Our demographic data infographic is not just a graphic, this is a powerful visualization that explores society and empowers decision-makers to understand, connect, and prosper. Prepare for an exhilarating journey through demographics, where data transforms into meaningful insights. Compatible with Powerpoint, Keynote, and Google Slides. This can be used for a variety of purposes, including market research, targeted marketing, policy development, resource allocation, urban planning, and more.


7 slides
Objective Infographic Presentation Template
Our Objective Infographic template is designed to visually highlight the key points of a business plan and help you get your message across. With this template's simple layout and bold illustration, you can convey the most important parts of your plan in a way that is straightforward and compelling. This infographic template has been created to help you illustrate the key goal of your project. A clear and attractive infographic, this eye-catching template can be used to create interesting informative content. This will captivate your audience and keep them interested in what you have to say.


5 slides
5 Types of Credit Cards Explained Presentation
Unlock the world of smarter spending with this clear, engaging layout designed to break down different credit card types in a simple, visual way. It helps you present features, benefits, and key distinctions with ease, making financial concepts easy to understand. Fully editable and compatible with PowerPoint, Keynote, and Google Slides.


7 slides
Target Market Advertising Infographic
Target market advertising, also known as target advertising or target marketing, is a strategy in marketing and advertising where promotional efforts are directed towards a specific and well-defined group of consumers who are most likely to be interested in a product or service. The goal of this infographic template is to tailor marketing messages and campaigns to resonate with the characteristics and preferences of your specific audience, thus increasing the effectiveness and efficiency of the marketing efforts. Fully customize the content, to educate about targeting the right audience for advertising presentations.


6 slides
Modern Business Strategy Presentation
Bring your ideas to life with a sleek, forward-thinking presentation designed to communicate business growth and strategic planning. Ideal for outlining goals, performance steps, and innovation roadmaps, this clean and modern layout ensures every concept stands out. Fully compatible with PowerPoint, Keynote, and Google Slides for easy customization.


4 slides
Points-Based Membership Program Strategy Presentation
Communicate your rewards system with clarity using the Points-Based Membership Program Strategy presentation. This visual template is ideal for outlining tiered rewards, point accumulation methods, and redemption mechanics through a clean, card-themed layout. Perfect for loyalty teams, marketing strategists, and membership programs. Fully editable in PowerPoint, Keynote, and Google Slides.


6 slides
Business Challenges and Solutions Presentation
Address challenges with strategic solutions using this Business Challenges and Solutions template. Featuring a clear side-by-side layout, this design helps visualize business obstacles and their corresponding solutions for effective decision-making. Perfect for problem-solving discussions, strategy meetings, and brainstorming sessions, this template ensures your content remains structured and impactful. Fully customizable for PowerPoint, Keynote, and Google Slides.


5 slides
Online Education Training Presentation
Present your digital learning programs with this Online Education Training Presentation. The visual layout highlights a central computer screen connected to key e-learning components, making it perfect for explaining course structures, virtual classroom tools, or distance learning workflows. Designed for trainers, educators, or edtech professionals. Fully editable in PowerPoint, Keynote, and Google Slides.


10 slides
Effective Decision-Making in Five Steps Presentation
Make smarter choices with the Effective Decision-Making in Five Steps presentation. This dynamic template breaks down the key stages of strategic thinking and problem-solving into a clear, engaging framework. Designed for leaders, teams, and consultants, this structured layout helps guide discussions and optimize workflows. Fully editable and available for PowerPoint, Keynote, and Google Slides for seamless customization.