


Features
- 6 Unique slides
- Fully editable and easy to edit in Microsoft Powerpoint, Keynote and Google Slides
- 16:9 widescreen layout
- Clean and professional designs
- Export to JPG, PDF or send by email


Do you have any questions?
Recommend


5 slides
Online Digital Marketing Infographics
Online Digital Marketing refers to the promotion of products, services, or brands using digital channels and technologies. These infographic templates aims to educate and inspire the audience about the world of digital marketing and equip them with valuable insights and strategies to enhance their online presence. This is a valuable tool for presenting the intricacies of digital marketing in a clear and engaging manner. The templates provide slides that focus on analytics and measurement, emphasizing the importance of tracking and evaluating digital marketing efforts. You can customize the templates with your own branding to create a professional look.


10 slides
Social Media Marketing Growth Presentation
Boost your social media strategy with this dynamic infographic template! Perfect for illustrating marketing growth, engagement tactics, and content performance, it features an intuitive flow that simplifies complex data. Ideal for presentations to teams and clients, it’s fully customizable and works seamlessly with PowerPoint, Keynote, and Google Slides.


5 slides
Butterfly Chart Data Visualization Presentation
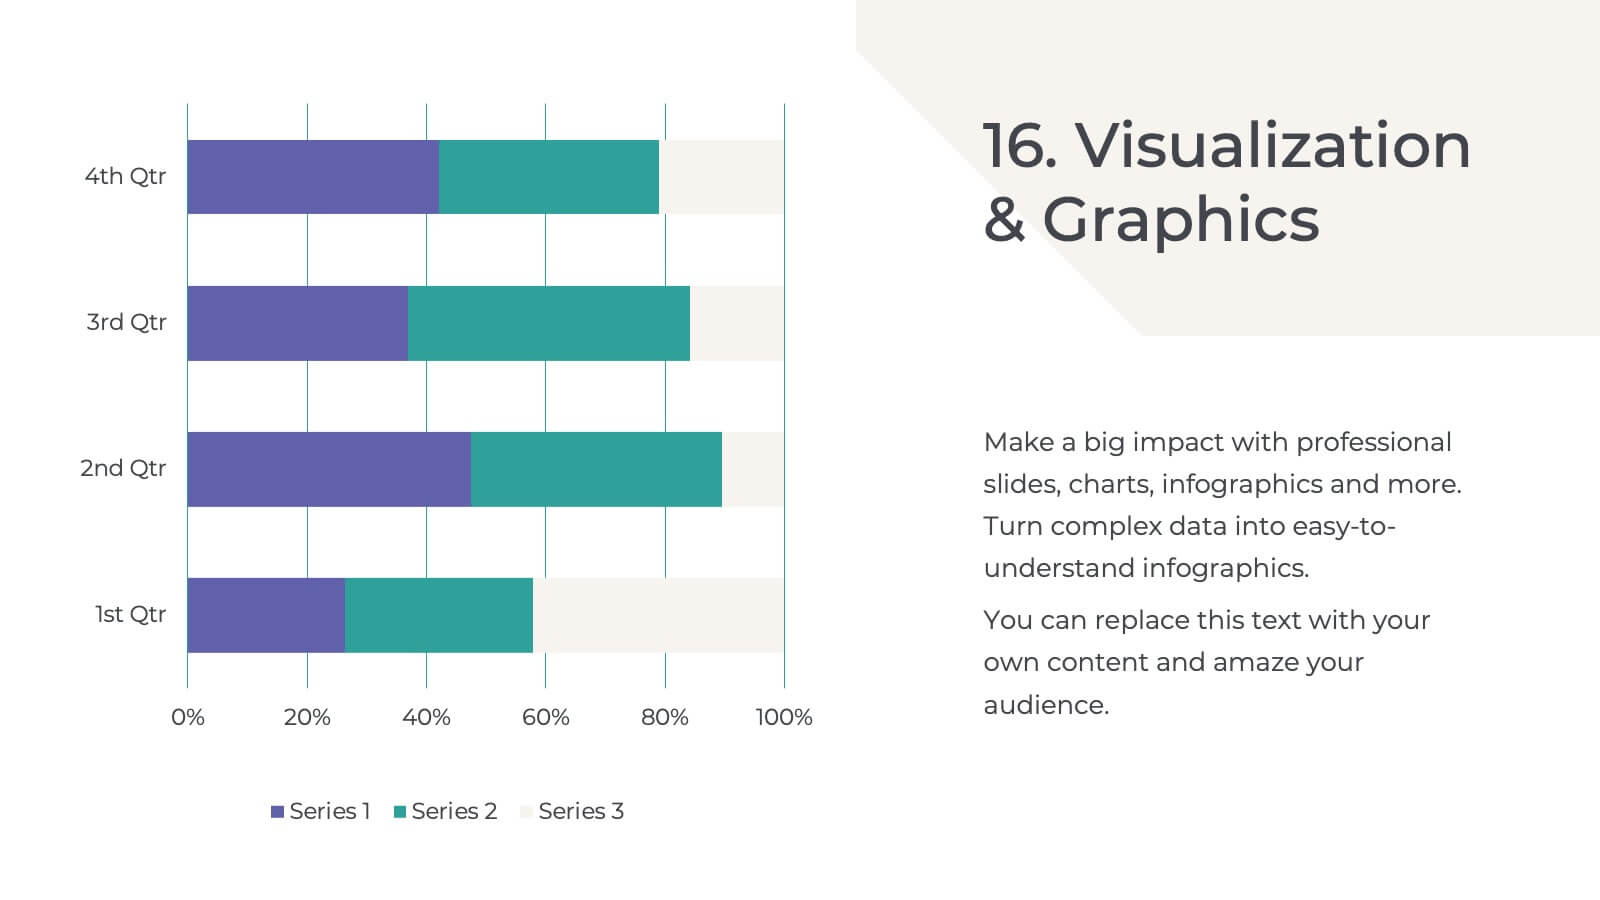
The "Butterfly Chart Data Visualization" presentation template is designed for comparative analysis across multiple options, facilitating easy visualization of data such as performance metrics, survey results, or any other quantifiable comparison. Each option is presented with dual opposing bars extending from a central axis, making it effortless to compare two datasets side by side for each category. This layout helps highlight differences and similarities effectively, ideal for presentations that require detailed analysis and clear visual distinctions between data points.


5 slides
Interlocking Puzzle Infographic Presentation
Visually connect ideas with the Interlocking Puzzle Infographic. This design is perfect for illustrating processes, relationships, and key concepts that fit together seamlessly. Whether you're presenting business strategies, project workflows, or educational content, this template enhances clarity and engagement. Fully customizable and compatible with PowerPoint, Keynote, and Google Slides.


6 slides
Pillar Foundation Infographics
Gain insights into Pillar Foundation construction with our customizable infographic template. This template is fully compatible with popular presentation software like PowerPoint, Keynote, and Google Slides, allowing you to easily customize it to illustrate and communicate the key aspects and principles of pillar foundation construction. The Pillar Foundation infographic template offers a visually engaging platform to explore and explain the construction process, types of pillars, materials used, and the significance of pillars in building stability. Whether you're a construction professional, architect, engineer, or simply interested in construction techniques, this template provides a user-friendly canvas to create informative presentations and educational materials. Deepen your knowledge of Pillar Foundation construction with this SEO-optimized infographic template, thoughtfully designed for clarity and ease of use. Customize it to showcase foundation types, construction steps, reinforcement methods, and the role of pillars in supporting structures, ensuring that your audience gains valuable insights into this crucial aspect of construction. Start crafting your personalized infographic today to delve into the world of Pillar Foundation construction.


6 slides
Market Challenges and Resilience Strategy Presentation
Tackle volatility with clarity using the Market Challenges and Resilience Strategy presentation. This slide features a modern smartphone graphic surrounded by six key strategy zones, each with its own icon and text area—ideal for outlining market pressures, competitive moves, or adaptive responses. Use it to communicate resilience frameworks, digital transformation steps, or scenario planning. Fully customizable in PowerPoint, Keynote, and Google Slides.


5 slides
How To Stop Fake News Infographics
Dive into the realm of media literacy with our how to stop fake news infographics. Crafted with striking shades of trust-inspiring blues and engaging, colorful accents, this vertical, informative, and creatively styled template is a beacon for journalists, educators, social media users, and advocates of truth. It is specifically designed to aid in the identification, debunking, and prevention of the spread of misinformation. Compatible with Powerpoint, Keynote, and Google Slides. The infographic encapsulates compelling graphics, easy-to-understand icons, and versatile image placeholders pertinent to the battle against fake news.


5 slides
Employee Onboarding Training Roadmap Presentation
Visualize your training journey with the Employee Onboarding Training Roadmap Presentation. This layout uses a road-style timeline with trucks to represent each step of the onboarding process—perfect for outlining key milestones, training modules, or departmental introductions. Fully editable in PowerPoint, Keynote, Google Slides, or Canva.
22 slides
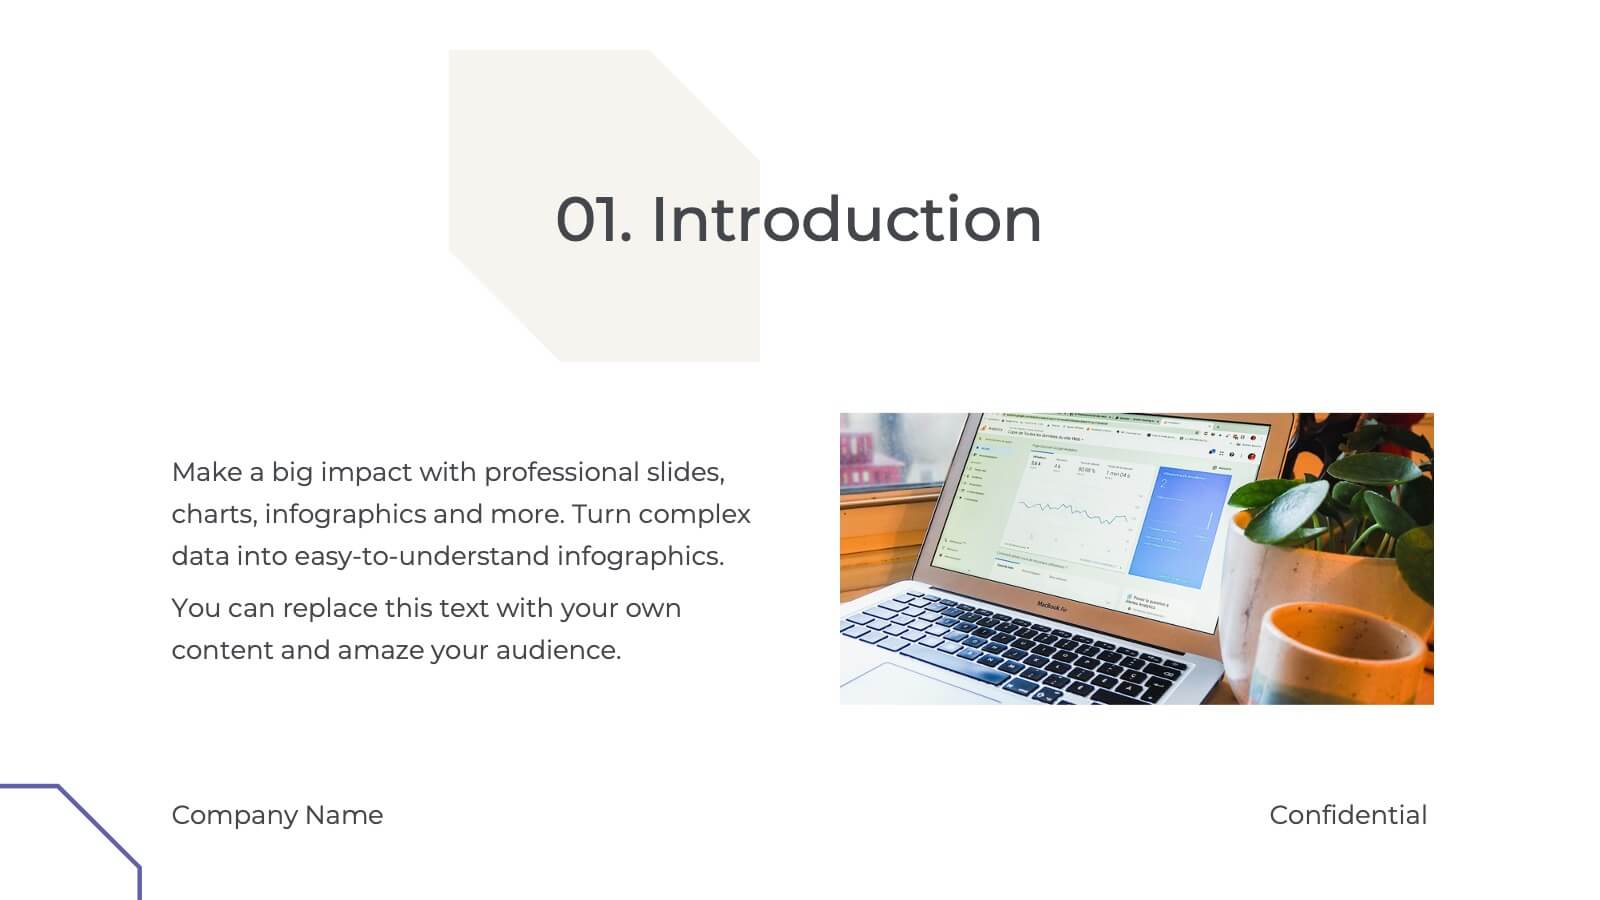
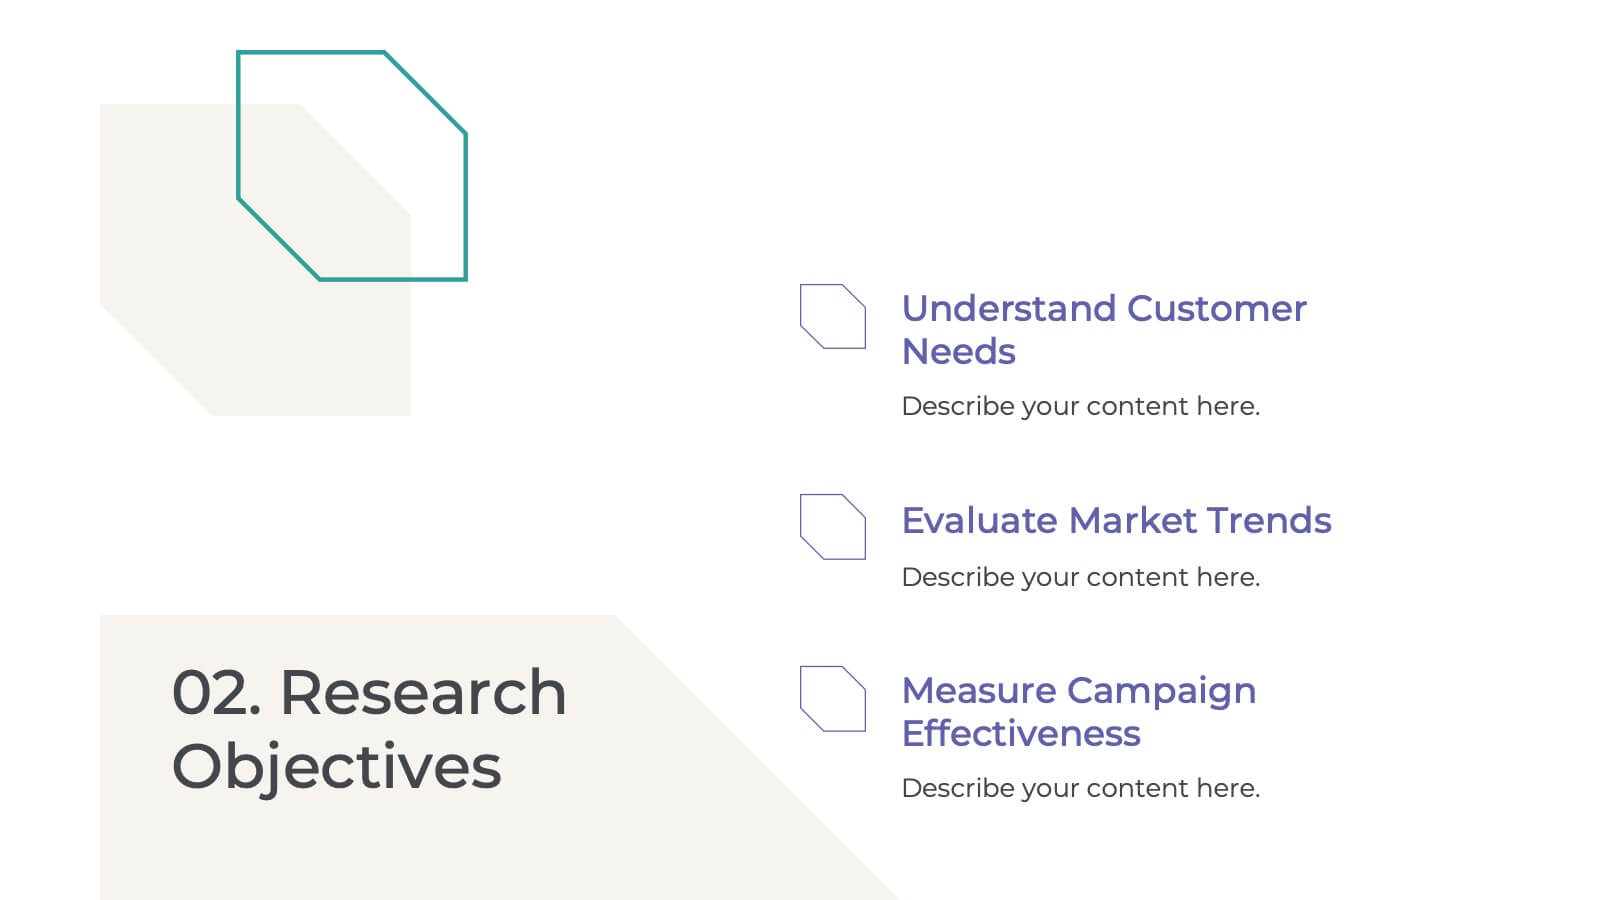
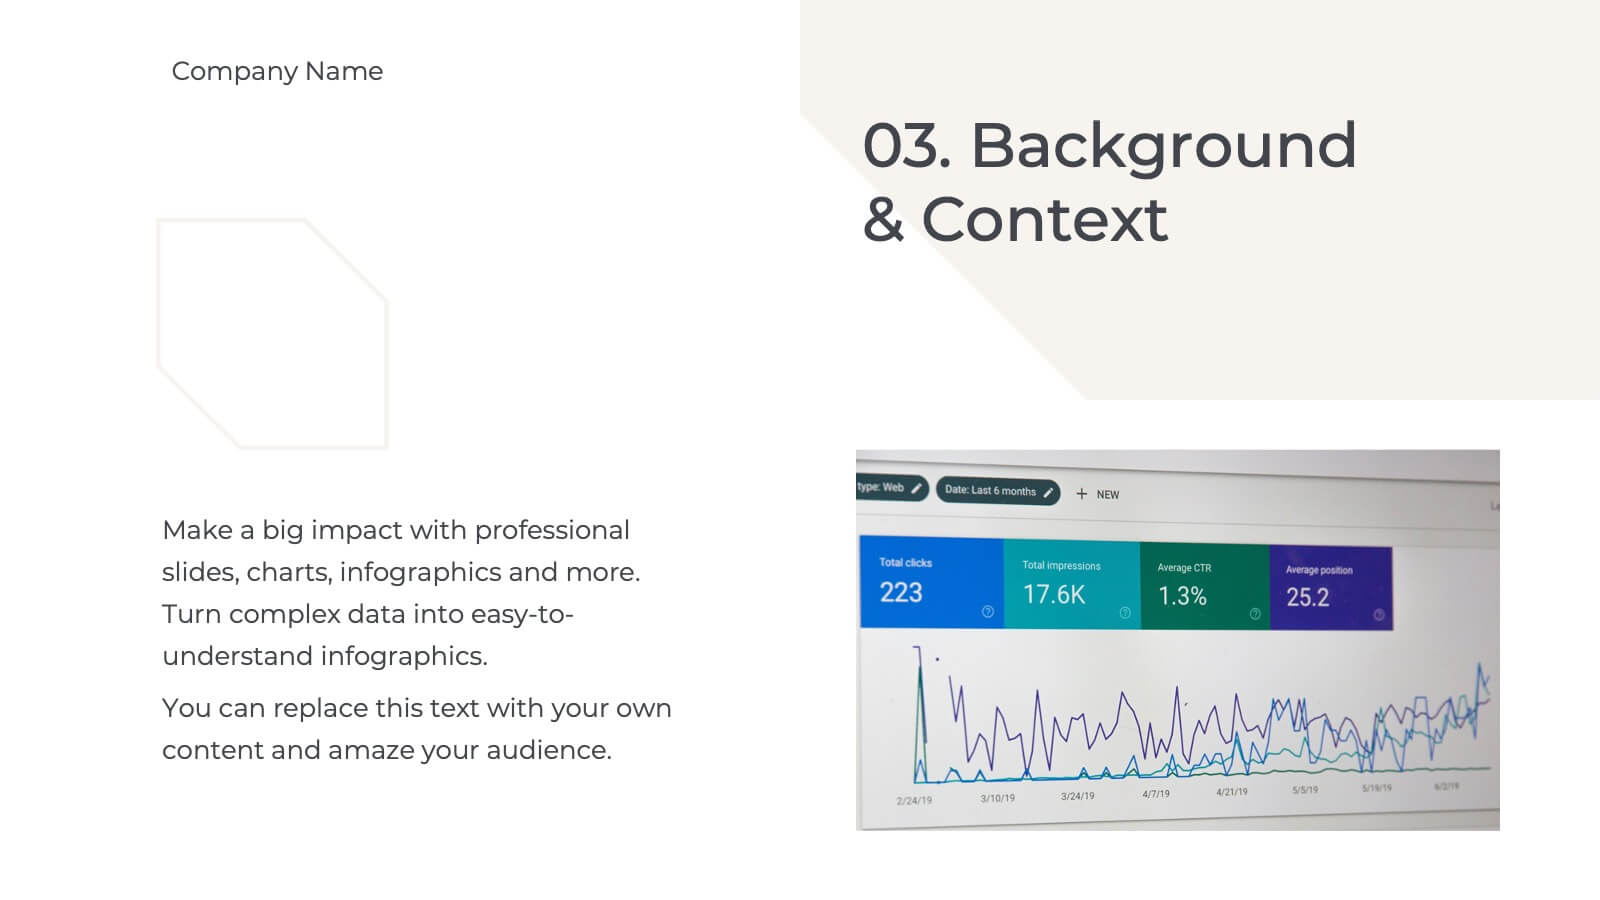
Palladium Qualitative Research Findings Presentation
Present your qualitative research findings effectively with this sleek, professional template. It includes sections for objectives, data analysis, key findings, and recommendations. Ideal for organizing research insights clearly, it's customizable and compatible with PowerPoint, Keynote, and Google Slides, ensuring smooth collaboration and impactful presentations for your audience.


7 slides
Financial Forecasting with Statistics Presentation
Unlock your financial future with the "Financial Forecasting with Statistics" presentation templates. These slides are designed to clearly present growth forecasts, trends, and statistics, empowering you to make informed decisions. Ideal for financial analysts and corporate strategists, these templates are fully compatible with PowerPoint, Keynote, and Google Slides.


7 slides
Consulting Business Strategy Infographic Presentation
A company’s business strategy is a plan that helps it achieve its goals and meet long-term objectives. A business strategy should be designed to fulfill the company’s mission, vision, and values. This template is designed to make your business or company plan, easy to understand and present in a professional way with the best design. This template can be used to present your company's strategic vision, long-term goals, and key initiatives. With its colorful and dynamic design, this can attract your audience’s attention, while also providing them with useful information about your strategy.


7 slides
Startup Business Infographic
A startup business refers to a newly established company or entrepreneurial venture, typically characterized by its innovative business model, product, or service. Our startup business infographic, is a dynamic visual template guide that illuminates the exciting journey of entrepreneurship and the strategic steps involved in building a successful startup. Fully customizable and compatible with Powerpoint, Keynote, and Google Slides. This infographic is a versatile and informative tool that celebrates the entrepreneurial spirit and guides aspiring startups on the path to success.


5 slides
Problem Framing and Opportunity Identification Presentation
Spot challenges and uncover growth potential with this Problem Framing and Opportunity Identification presentation. Ideal for strategy sessions, this layered pyramid layout helps you organize problems from surface-level to root causes while aligning them with strategic opportunities. Fully editable in Canva, PowerPoint, or Google Slides for seamless customization.


10 slides
5 Step Business Growth Presentation
The "5 Step Business Growth Presentation" template is designed to clearly depict progressive strategies in business development. Featuring a visually engaging staircase-style layout, this infographic effectively guides viewers through sequential stages, making it perfect for presentations that outline growth phases or strategic processes. Each step is color-coded and provides sufficient space to elaborate on key points, ensuring clarity and emphasis on important data. Ideal for use in business strategy meetings or any setting requiring a structured presentation of development stages, this template is versatile and compatible with various presentation platforms, enhancing the visual appeal and comprehension of your message.


10 slides
Project Responsibility Chart Presentation
Streamline your project management with our Project Responsibility Chart template. Designed to clarify roles and tasks across your team, this color-coded chart ensures transparency and efficiency. Ideal for project leads to assign duties clearly and effectively. The template supports PowerPoint, Keynote, and Google Slides, making it versatile for any team environment.


6 slides
Business People Services Infographic
"Business People Services" refers to a range of professional services and solutions offered to individuals and organizations to help them succeed in the business world. This infographic template is a visual representation of various services tailored to meet the needs of business professionals. This template aims to provide a quick overview of these services and their benefits. The purpose of this infographic is to convey important information in an engaging format. Use concise text, relevant visuals, and a logical structure to make it easy for business professionals to understand and benefit from your data presented.


26 slides
Thadd Presentation Template
Thadd presents your business in a professional light. The bold fonts and colors make for a clean, professional aesthetic that won't distract from your message. It features a strong horizontal identity that instantly communicates your brand. Charts, timelines and easy to edit text give this template an edge over the competition. It comes with easy to edit text and images, making changing content a breeze. It makes for a great business tool for companies who want to get their message across without wasting time on graphics and design. Invest in your future and download this template today.