


Features
- 26 Unique slides
- Fully editable and easy to edit in Microsoft Powerpoint, Keynote and Google Slides
- 16:9 widescreen layout
- Clean and professional designs
- Export to JPG, PDF or send by email


Do you have any questions?
Recommend


6 slides
Circle Diagram for Organizational Structure Presentation
Visualize team roles and functions with the Circle Diagram for Organizational Structure Presentation. This hexagon-centered circular layout clearly displays six departments or categories around a unified core, using icons and color coding for easy interpretation. Perfect for showcasing business units, workflows, or collaborative systems. Fully editable in PowerPoint, Google Slides, and Canva.


8 slides
Business Workflow Process
Showcase your operations with this 4-step business workflow diagram. Designed for clarity and adaptability, each step features icons and text fields ideal for processes, pipelines, or phase breakdowns. Fully editable in PowerPoint, Keynote, and Google Slides—customize effortlessly to fit your business needs.


4 slides
Mental Health Awareness Presentation
Bright visuals meet deep meaning in this engaging slide, designed to spotlight key facts and insights. This template helps present vital information on emotional well-being, stigma reduction, and support strategies with clarity and empathy. Fully editable and easy to use in PowerPoint, Keynote, and Google Slides for seamless presentation delivery.


5 slides
Corporate Strategic Planning Presentation
Create a winning strategy with this corporate strategic planning template. Designed for business leaders, it helps structure goals, initiatives, and key performance areas in a clear, visual format. Ideal for strategic decision-making and long-term planning. Fully customizable and compatible with PowerPoint, Keynote, and Google Slides for seamless editing and presentation.


8 slides
Value Chain Optimization and Analysis Presentation
Streamline Your Business for Maximum Efficiency with this Value Chain Optimization and Analysis presentation template. This visually engaging template is designed to map, analyze, and enhance the key activities in your value chain, helping businesses identify opportunities for cost reduction, performance improvements, and strategic advantages. Featuring a clean flowchart layout, intuitive color-coded sections, and editable placeholders, this template is ideal for business analysts, consultants, and executives. Fully compatible with PowerPoint, Keynote, and Google Slides, ensuring seamless customization and professional delivery.


26 slides
Wok Presentation Template
Want to learn about popular Chinese dishes? Wok is a fun and colorful template made for you. It includes all the essential elements of a food related template: fresh ingredients and vibrant colors. Wok was developed to meet the needs of those who want to promote their business with a clean and organized design. It has easy editing features making it simple to customize by adding company logos and other relevant details. The template is responsive, which means that it will adapt its layout based on how the user wants it displayed. This makes it easy to access the site from wherever you may be.


22 slides
Athena Creative Design Report Presentation
Showcase your creative projects with this vibrant design report template! Highlight objectives, concept development, prototypes, and design iterations with sleek visuals. Perfect for designers and creative teams. Compatible with PowerPoint, Keynote, and Google Slides.


3 slides
Stock Market Performance Overview Presentation
Showcase financial growth like a pro with this clean, data-driven layout designed to visualize performance, market activity, and business progress over time. Ideal for professionals presenting key financial trends, metrics, or strategies. Fully compatible with PowerPoint, Keynote, and Google Slides for easy customization and professional presentation results.


7 slides
Law and Compliance Presentation
Bring order and precision to your reports with this modern, structured layout designed to simplify complex regulations and policies. Perfect for presenting legal processes, compliance updates, or governance strategies, it blends professionalism with clarity. Fully compatible with PowerPoint, Keynote, and Google Slides for seamless editing and presentation flexibility.


20 slides
Momentum Business Proposal Presentation
Elevate your business proposals with this vibrant, dynamic template designed to impress and persuade. Featuring a sleek design and a structured layout, this template is perfect for outlining project summaries, methodologies, and pricing structures. It's ideal for conveying professionalism and clarity. Compatible with PowerPoint, Keynote, and Google Slides, it ensures seamless presentations across all platforms.


5 slides
Real-Time KPI Monitoring Dashboard Presentation
Track performance at a glance with this Real-Time KPI Monitoring Dashboard. This slide includes a clean layout with metrics, charts, and gauges to visualize your top KPIs. Perfect for business reviews, executive updates, and performance reports. Fully editable in PowerPoint, Keynote, and Google Slides for fast customization.


4 slides
3-Tier Pricing Table Layout Presentation
Make your pricing pitch pop with this bold and modern layout! This presentation template is perfect for showcasing product or service plans with clear comparisons across three tiers. Designed to streamline pricing communication, it’s ideal for SaaS, consulting, or digital services. Fully compatible with PowerPoint, Keynote, and Google Slides.


4 slides
Circular Data Flow in Systems Presentation
Visualize relationships and flow within your systems using the Circular Data Flow in Systems Presentation. Ideal for showcasing input-output dynamics, data loops, or stakeholder interaction, this diagram presents centralized nodes with surrounding connectors for clarity. Each element is editable and works seamlessly in PowerPoint, Google Slides, and Canva.


22 slides
Chromatic Academic Research Report Presentation
A structured template for academic research proposals, covering objectives, methodology, findings, and implications. Ideal for detailed presentations of data, analysis, and future research directions. Compatible with PowerPoint, Keynote, and Google Slides, it offers a professional layout for academic, scientific, or market research presentations.


6 slides
Sales Skills Development Training Presentation
Bring your sales training to life with a sleek, infinity-loop visual that keeps learners engaged from start to finish. This template helps you map out each phase of sales skill development, from lead generation to closing. Fully customizable and compatible with PowerPoint, Keynote, and Google Slides for seamless integration.
8 slides
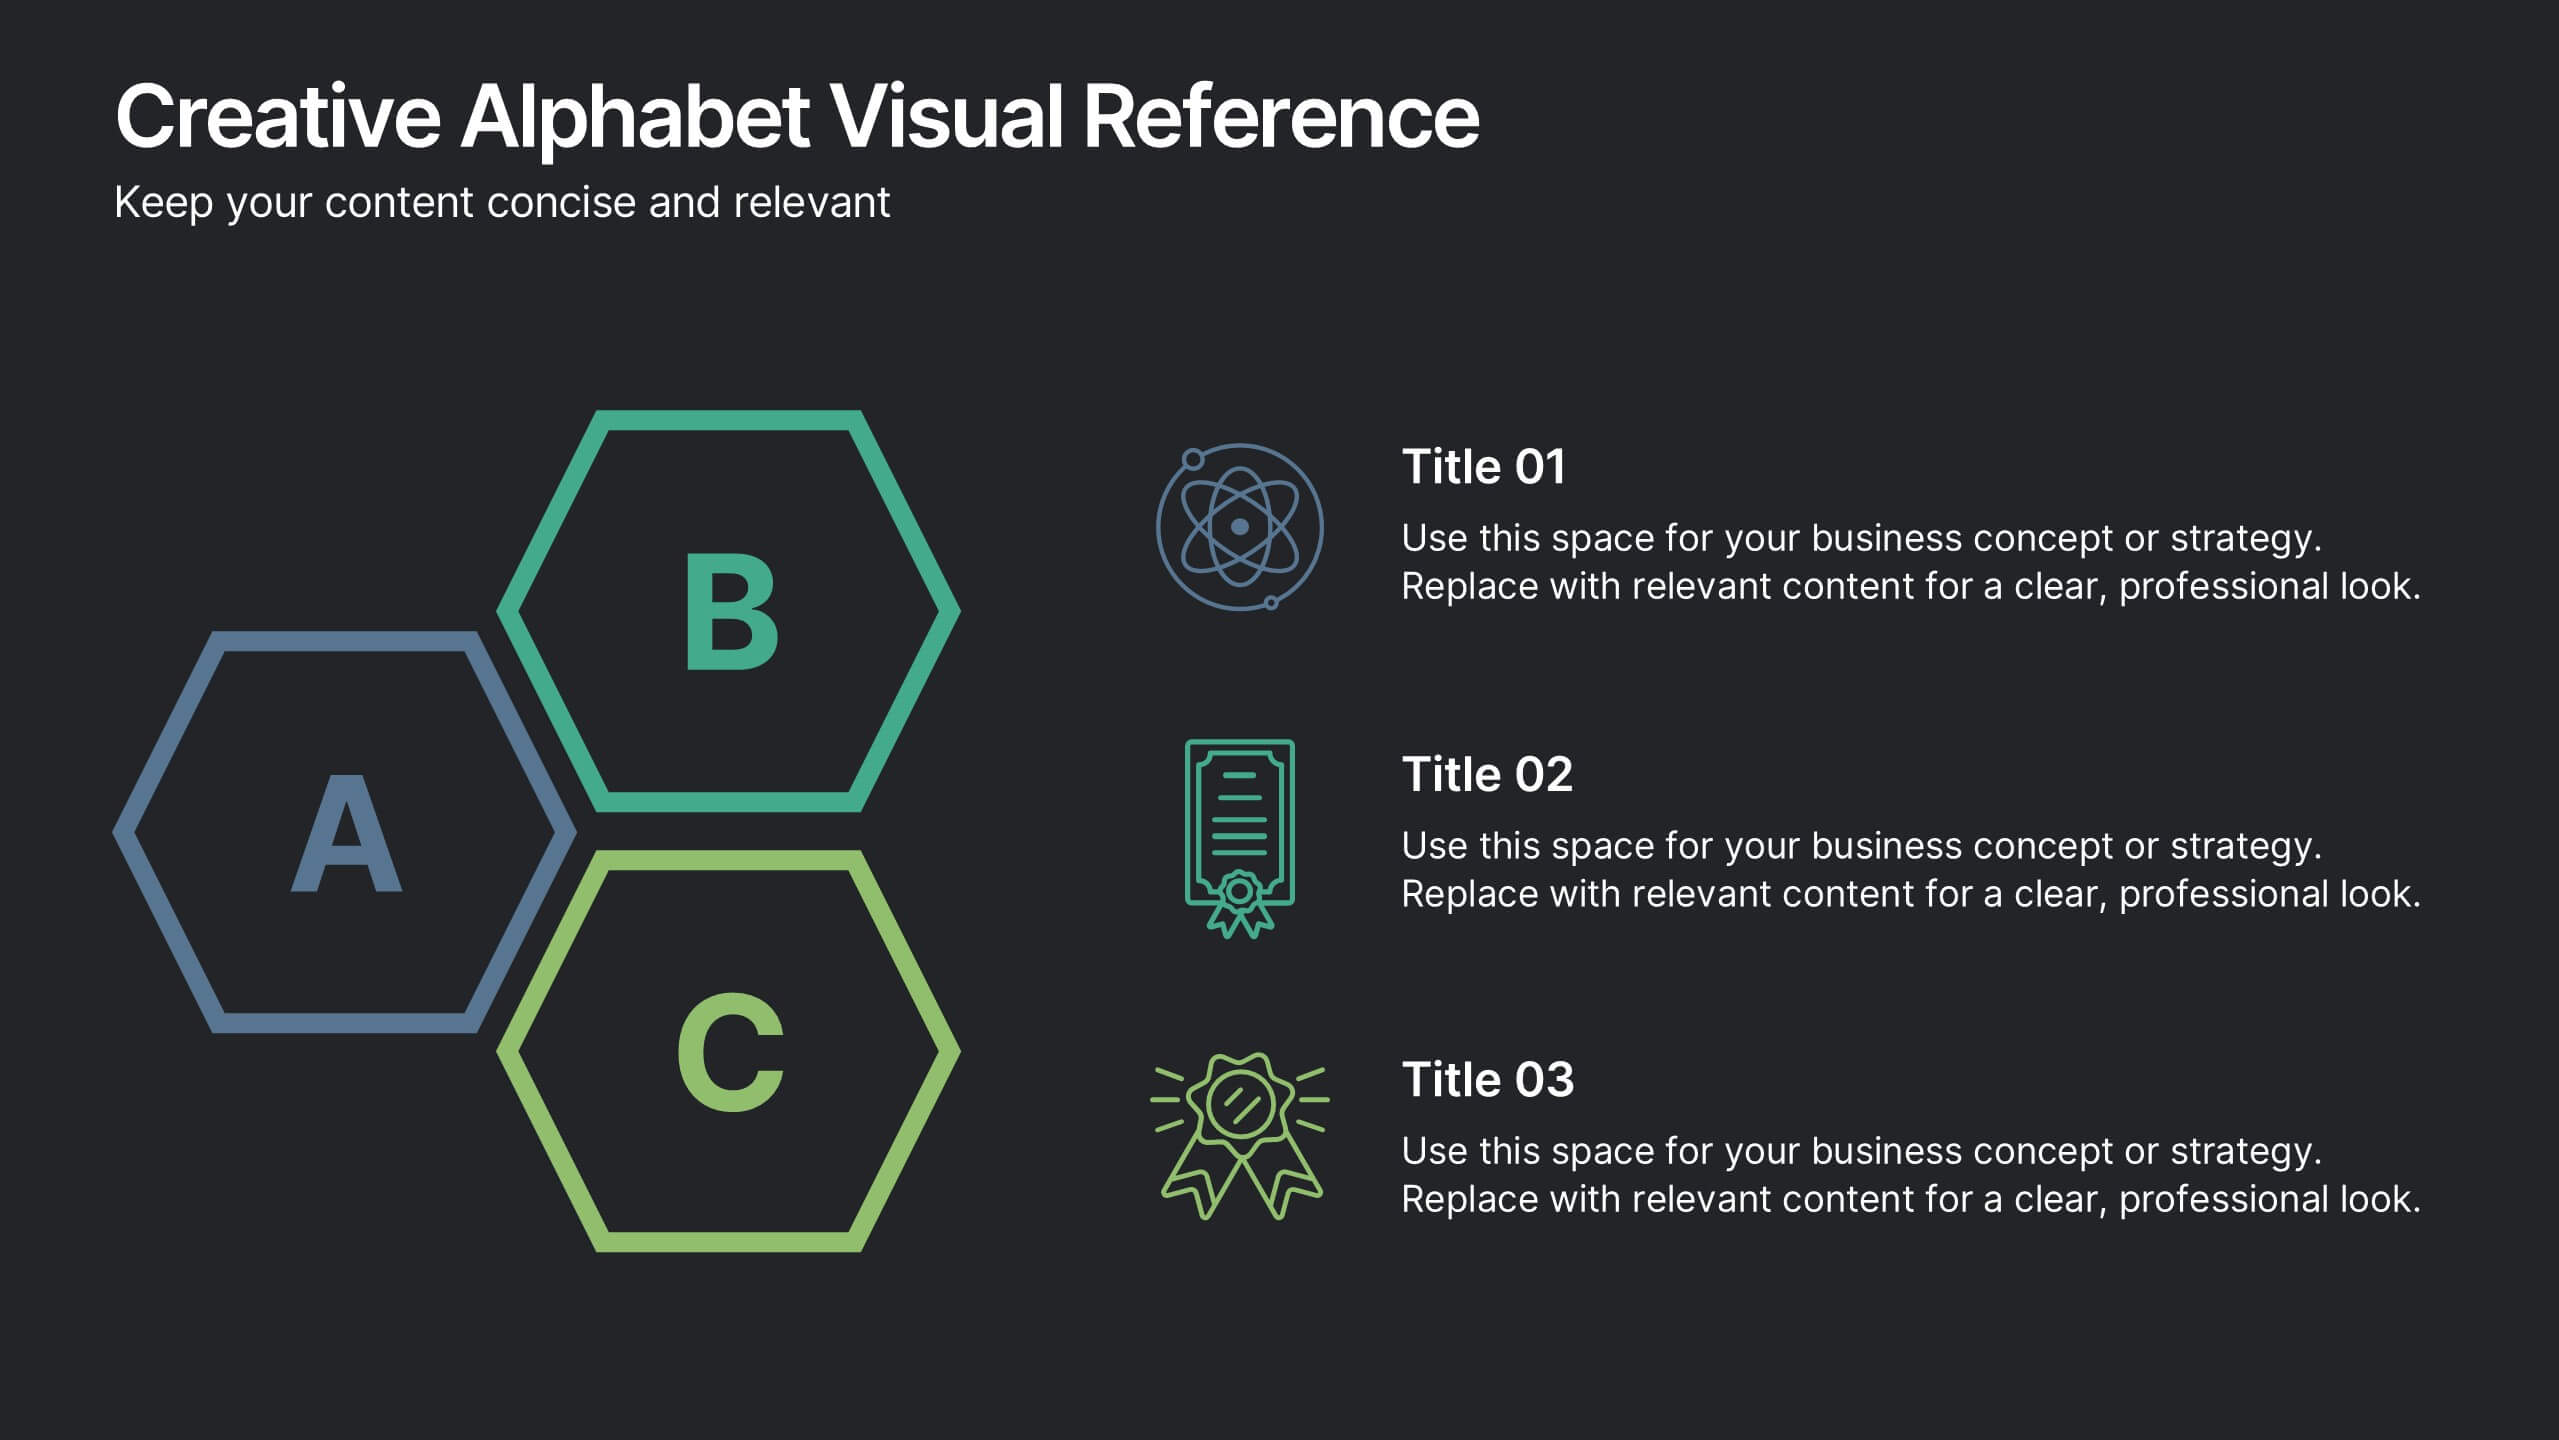
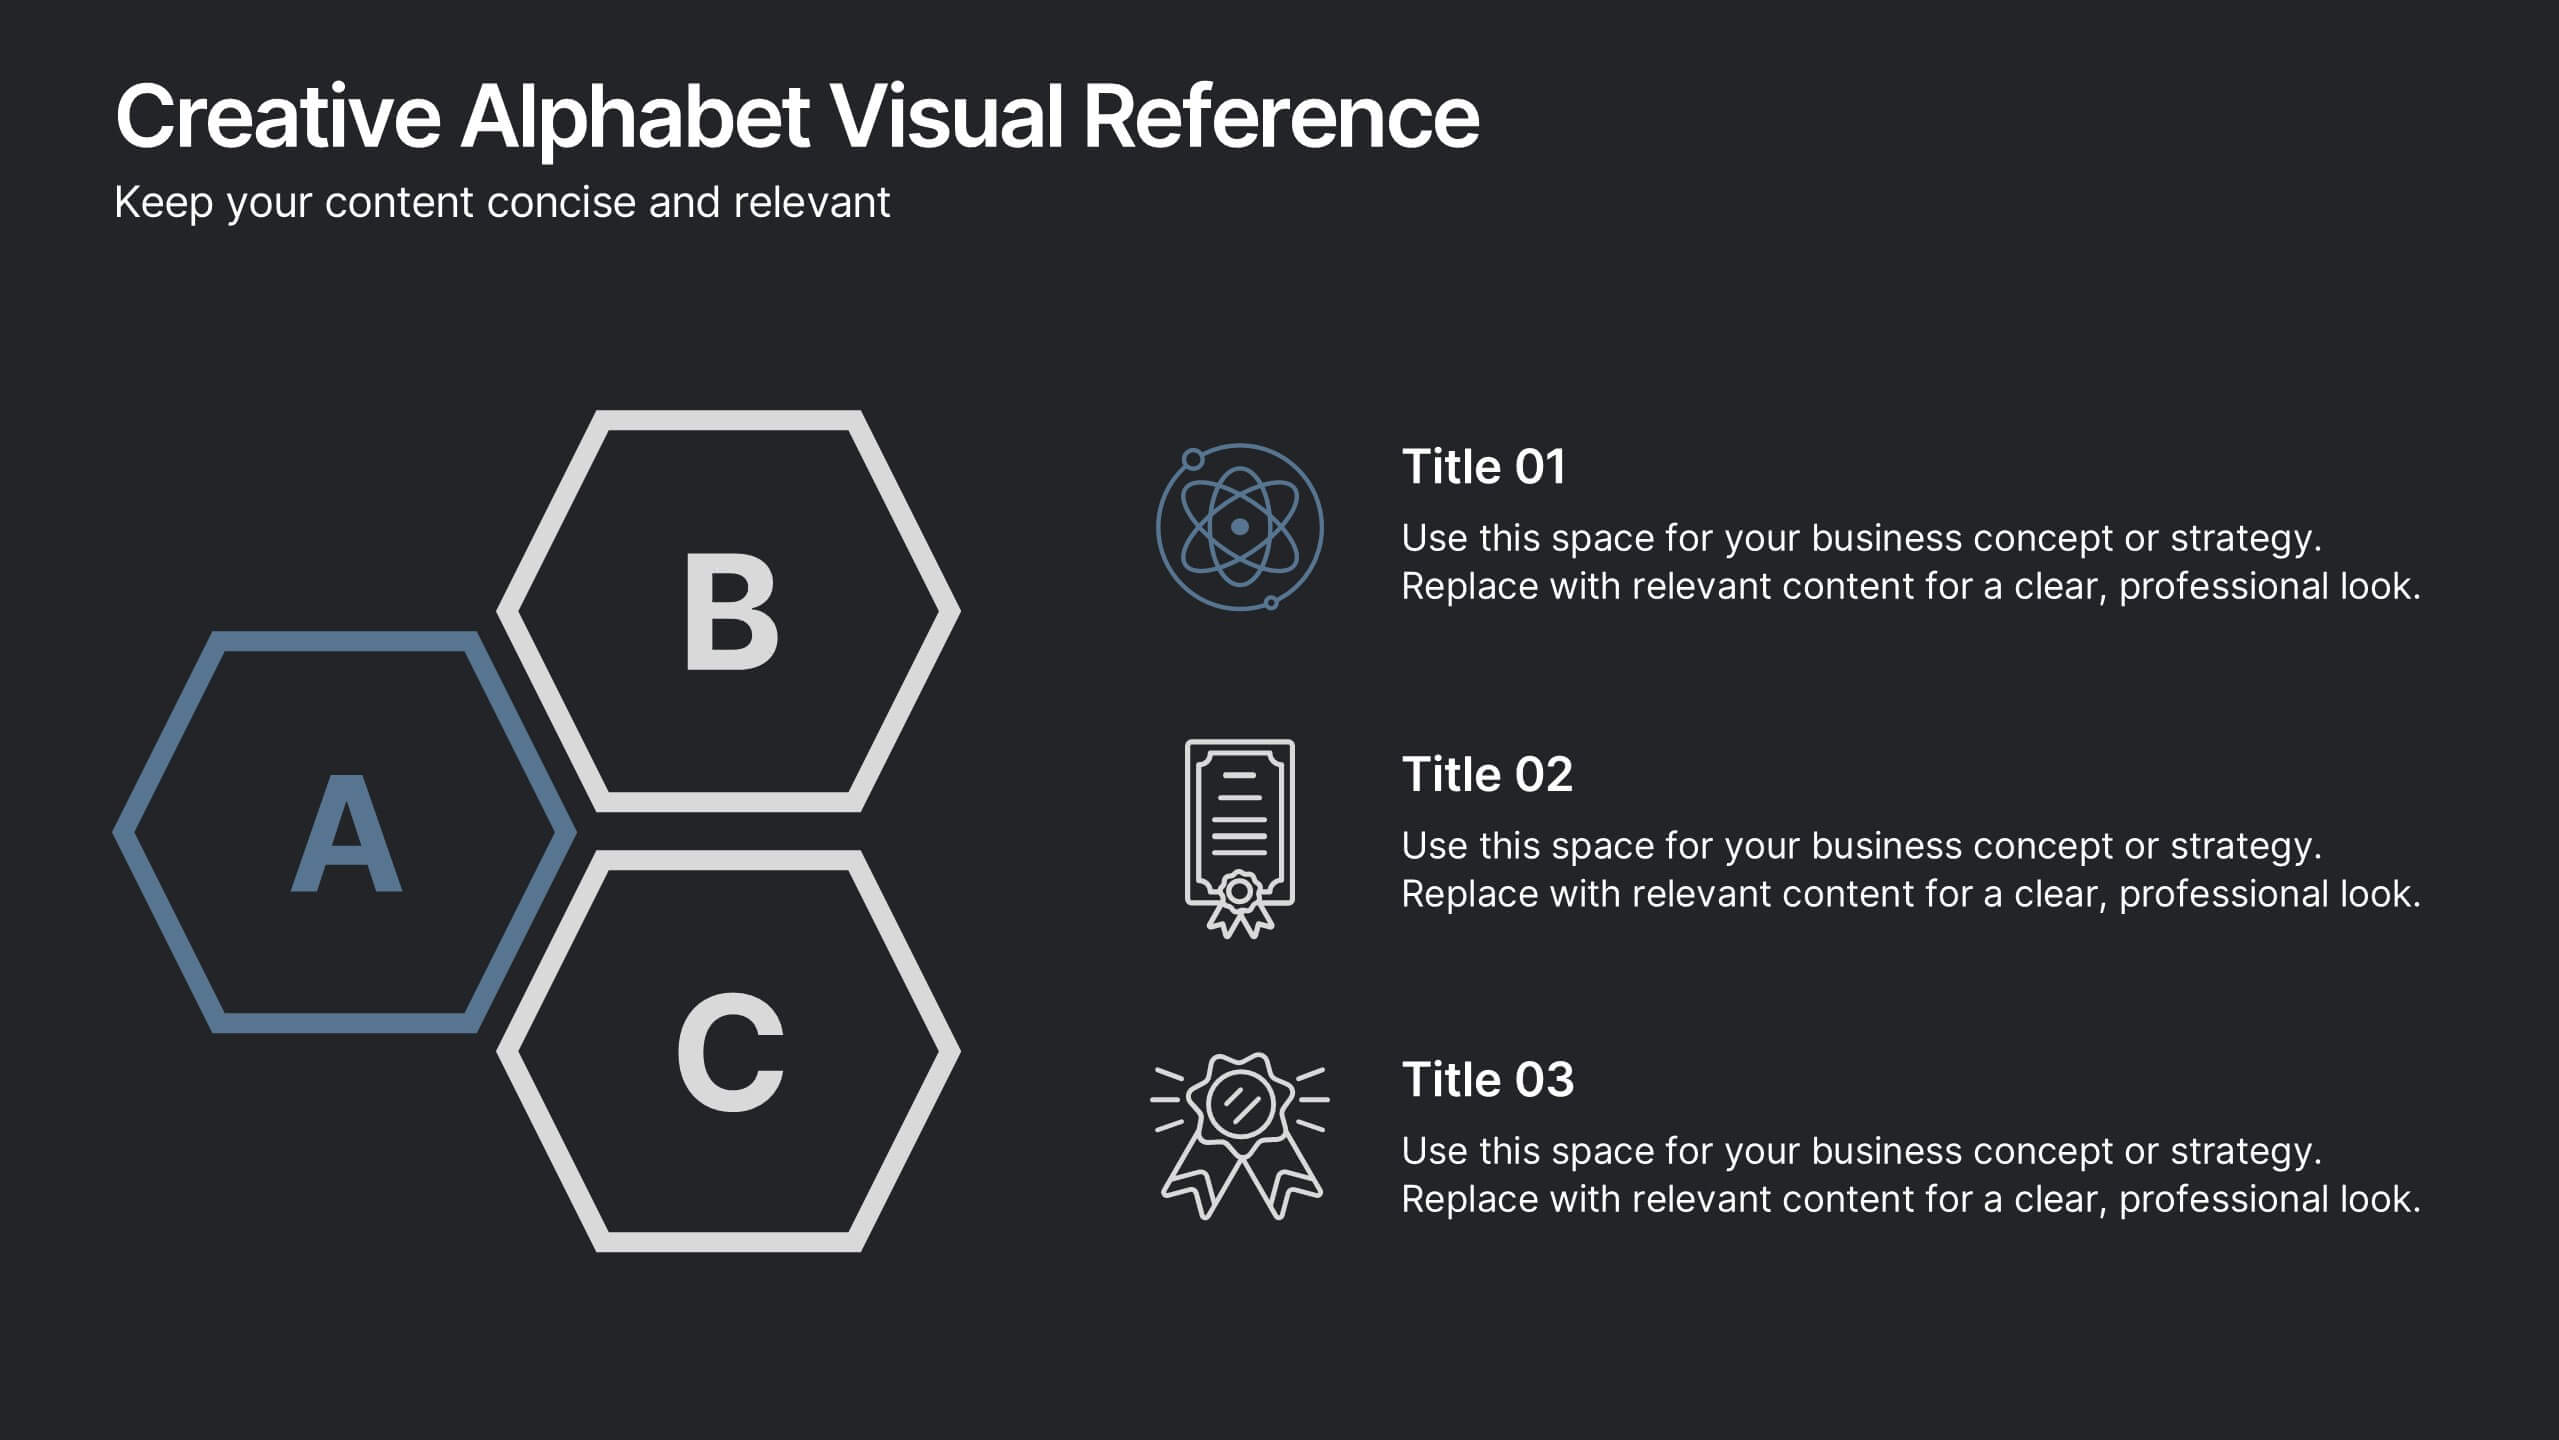
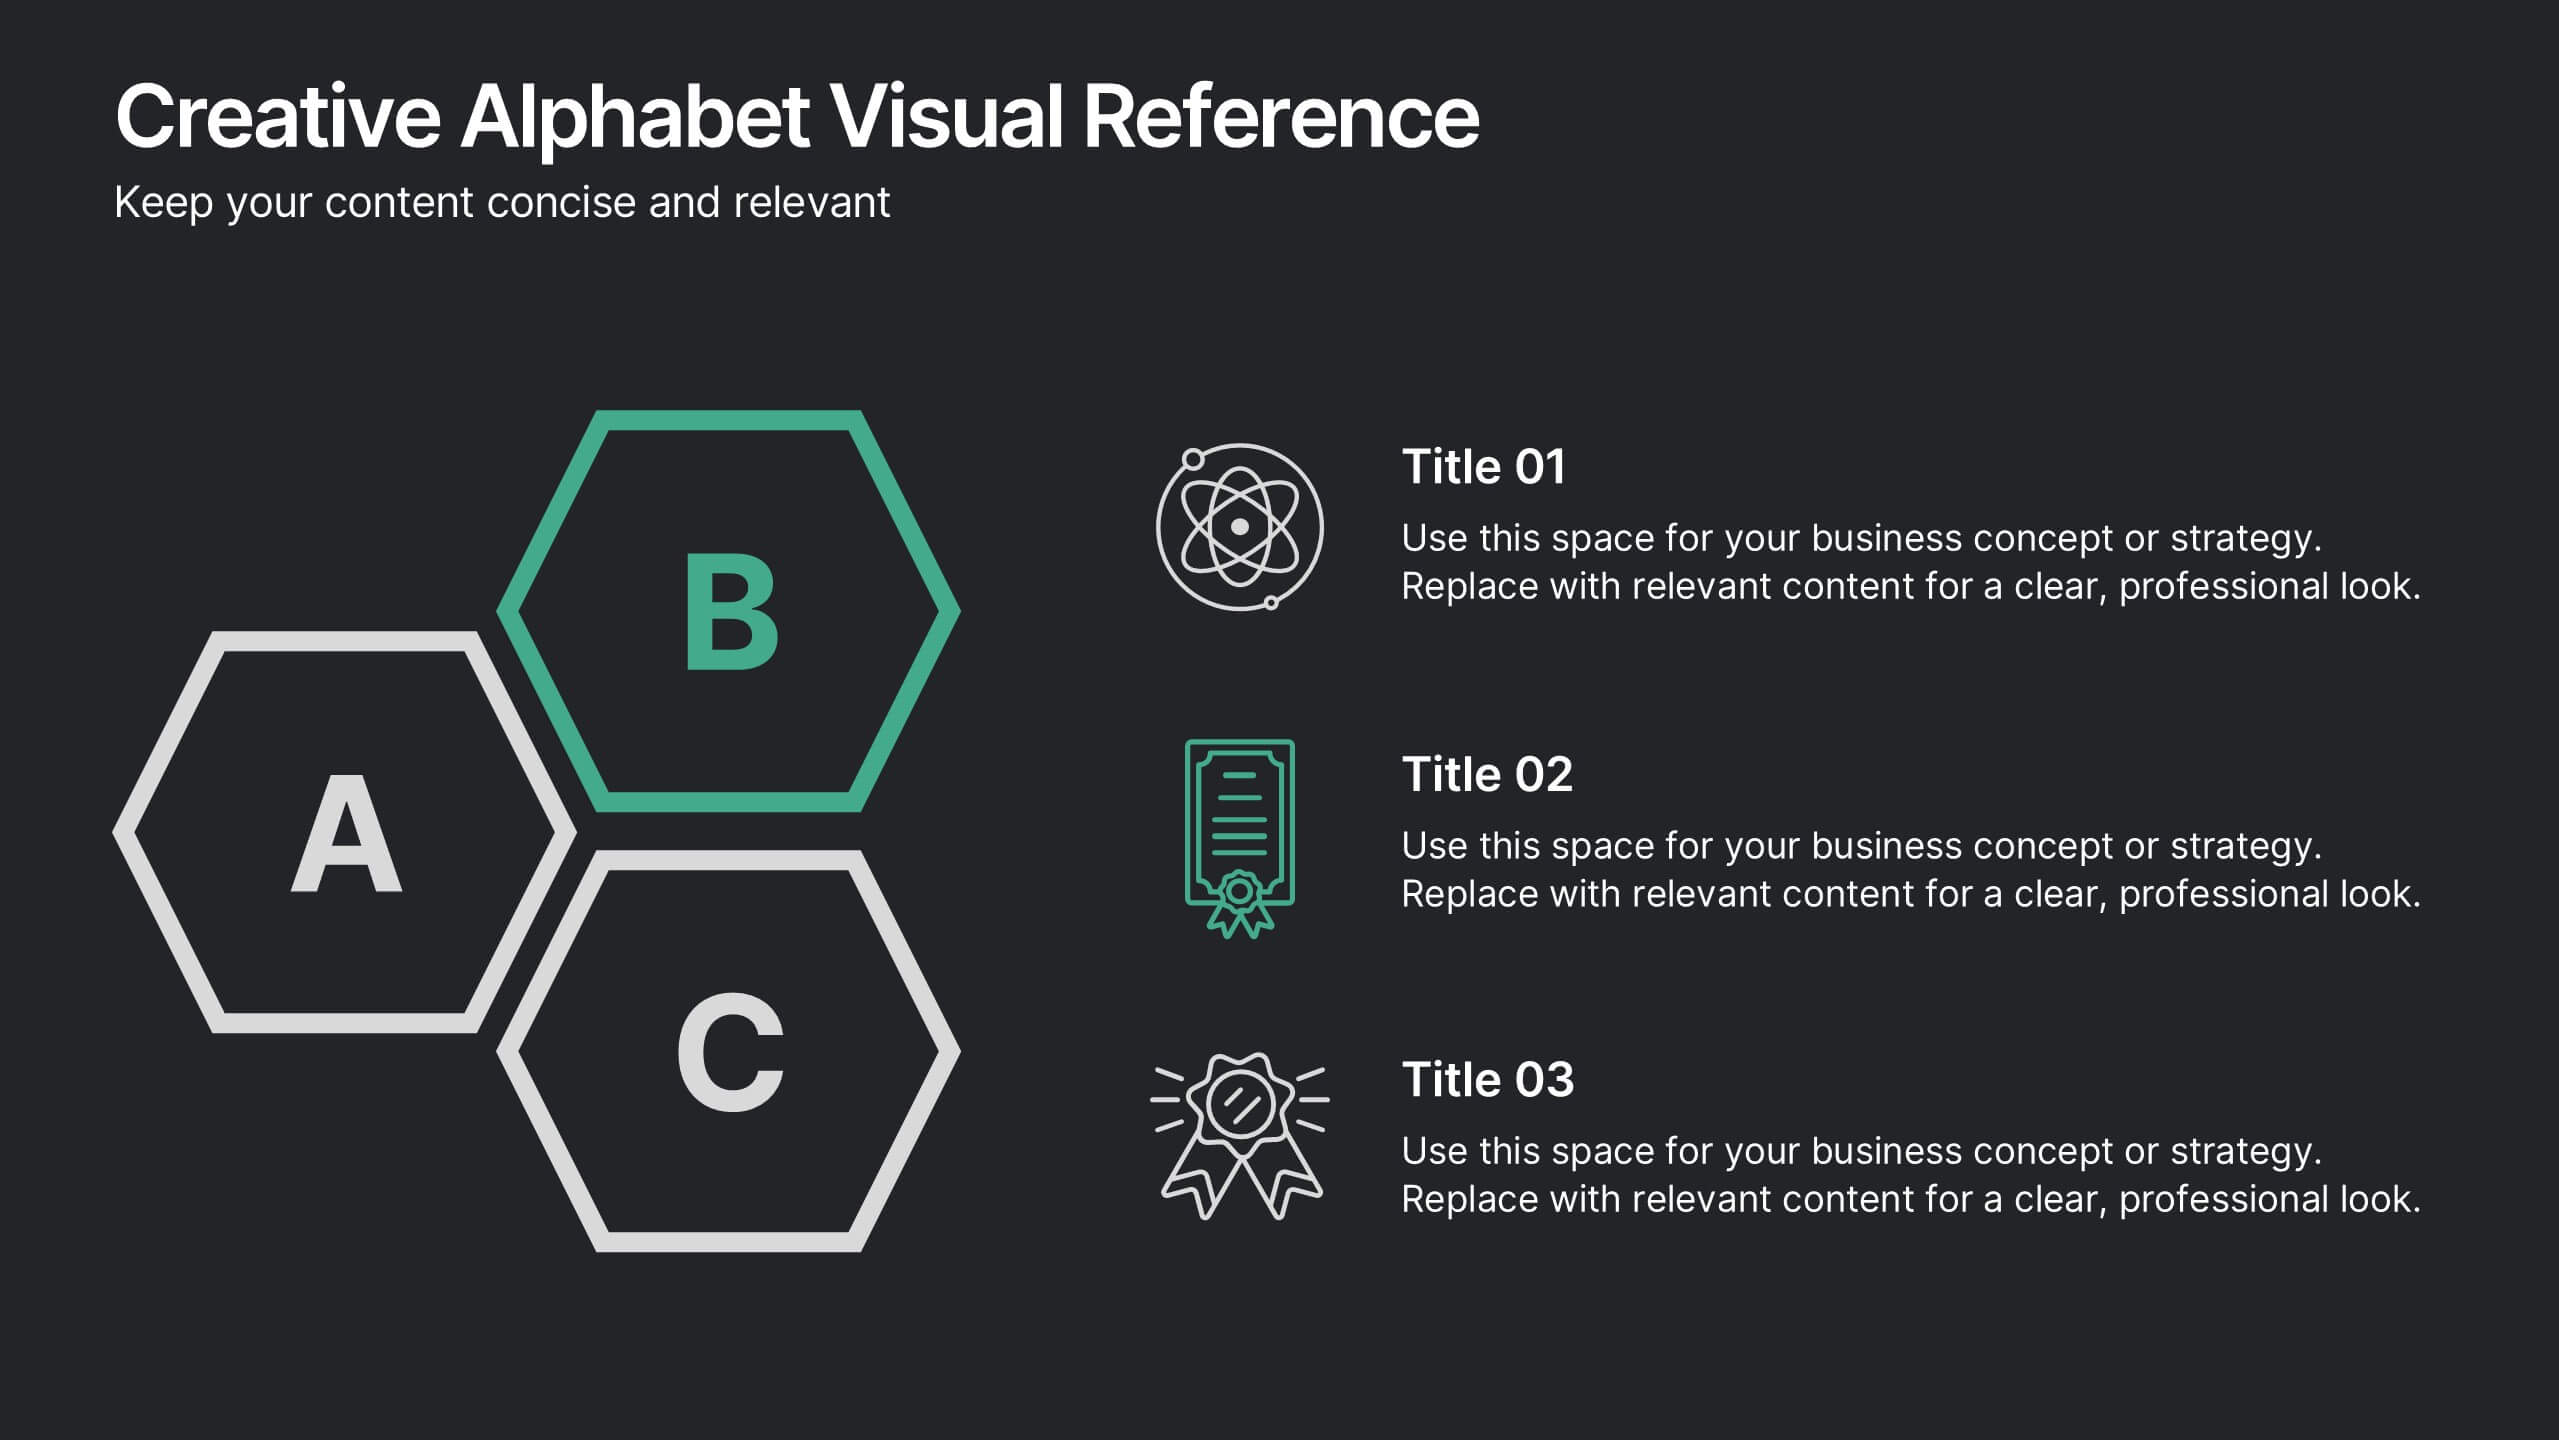
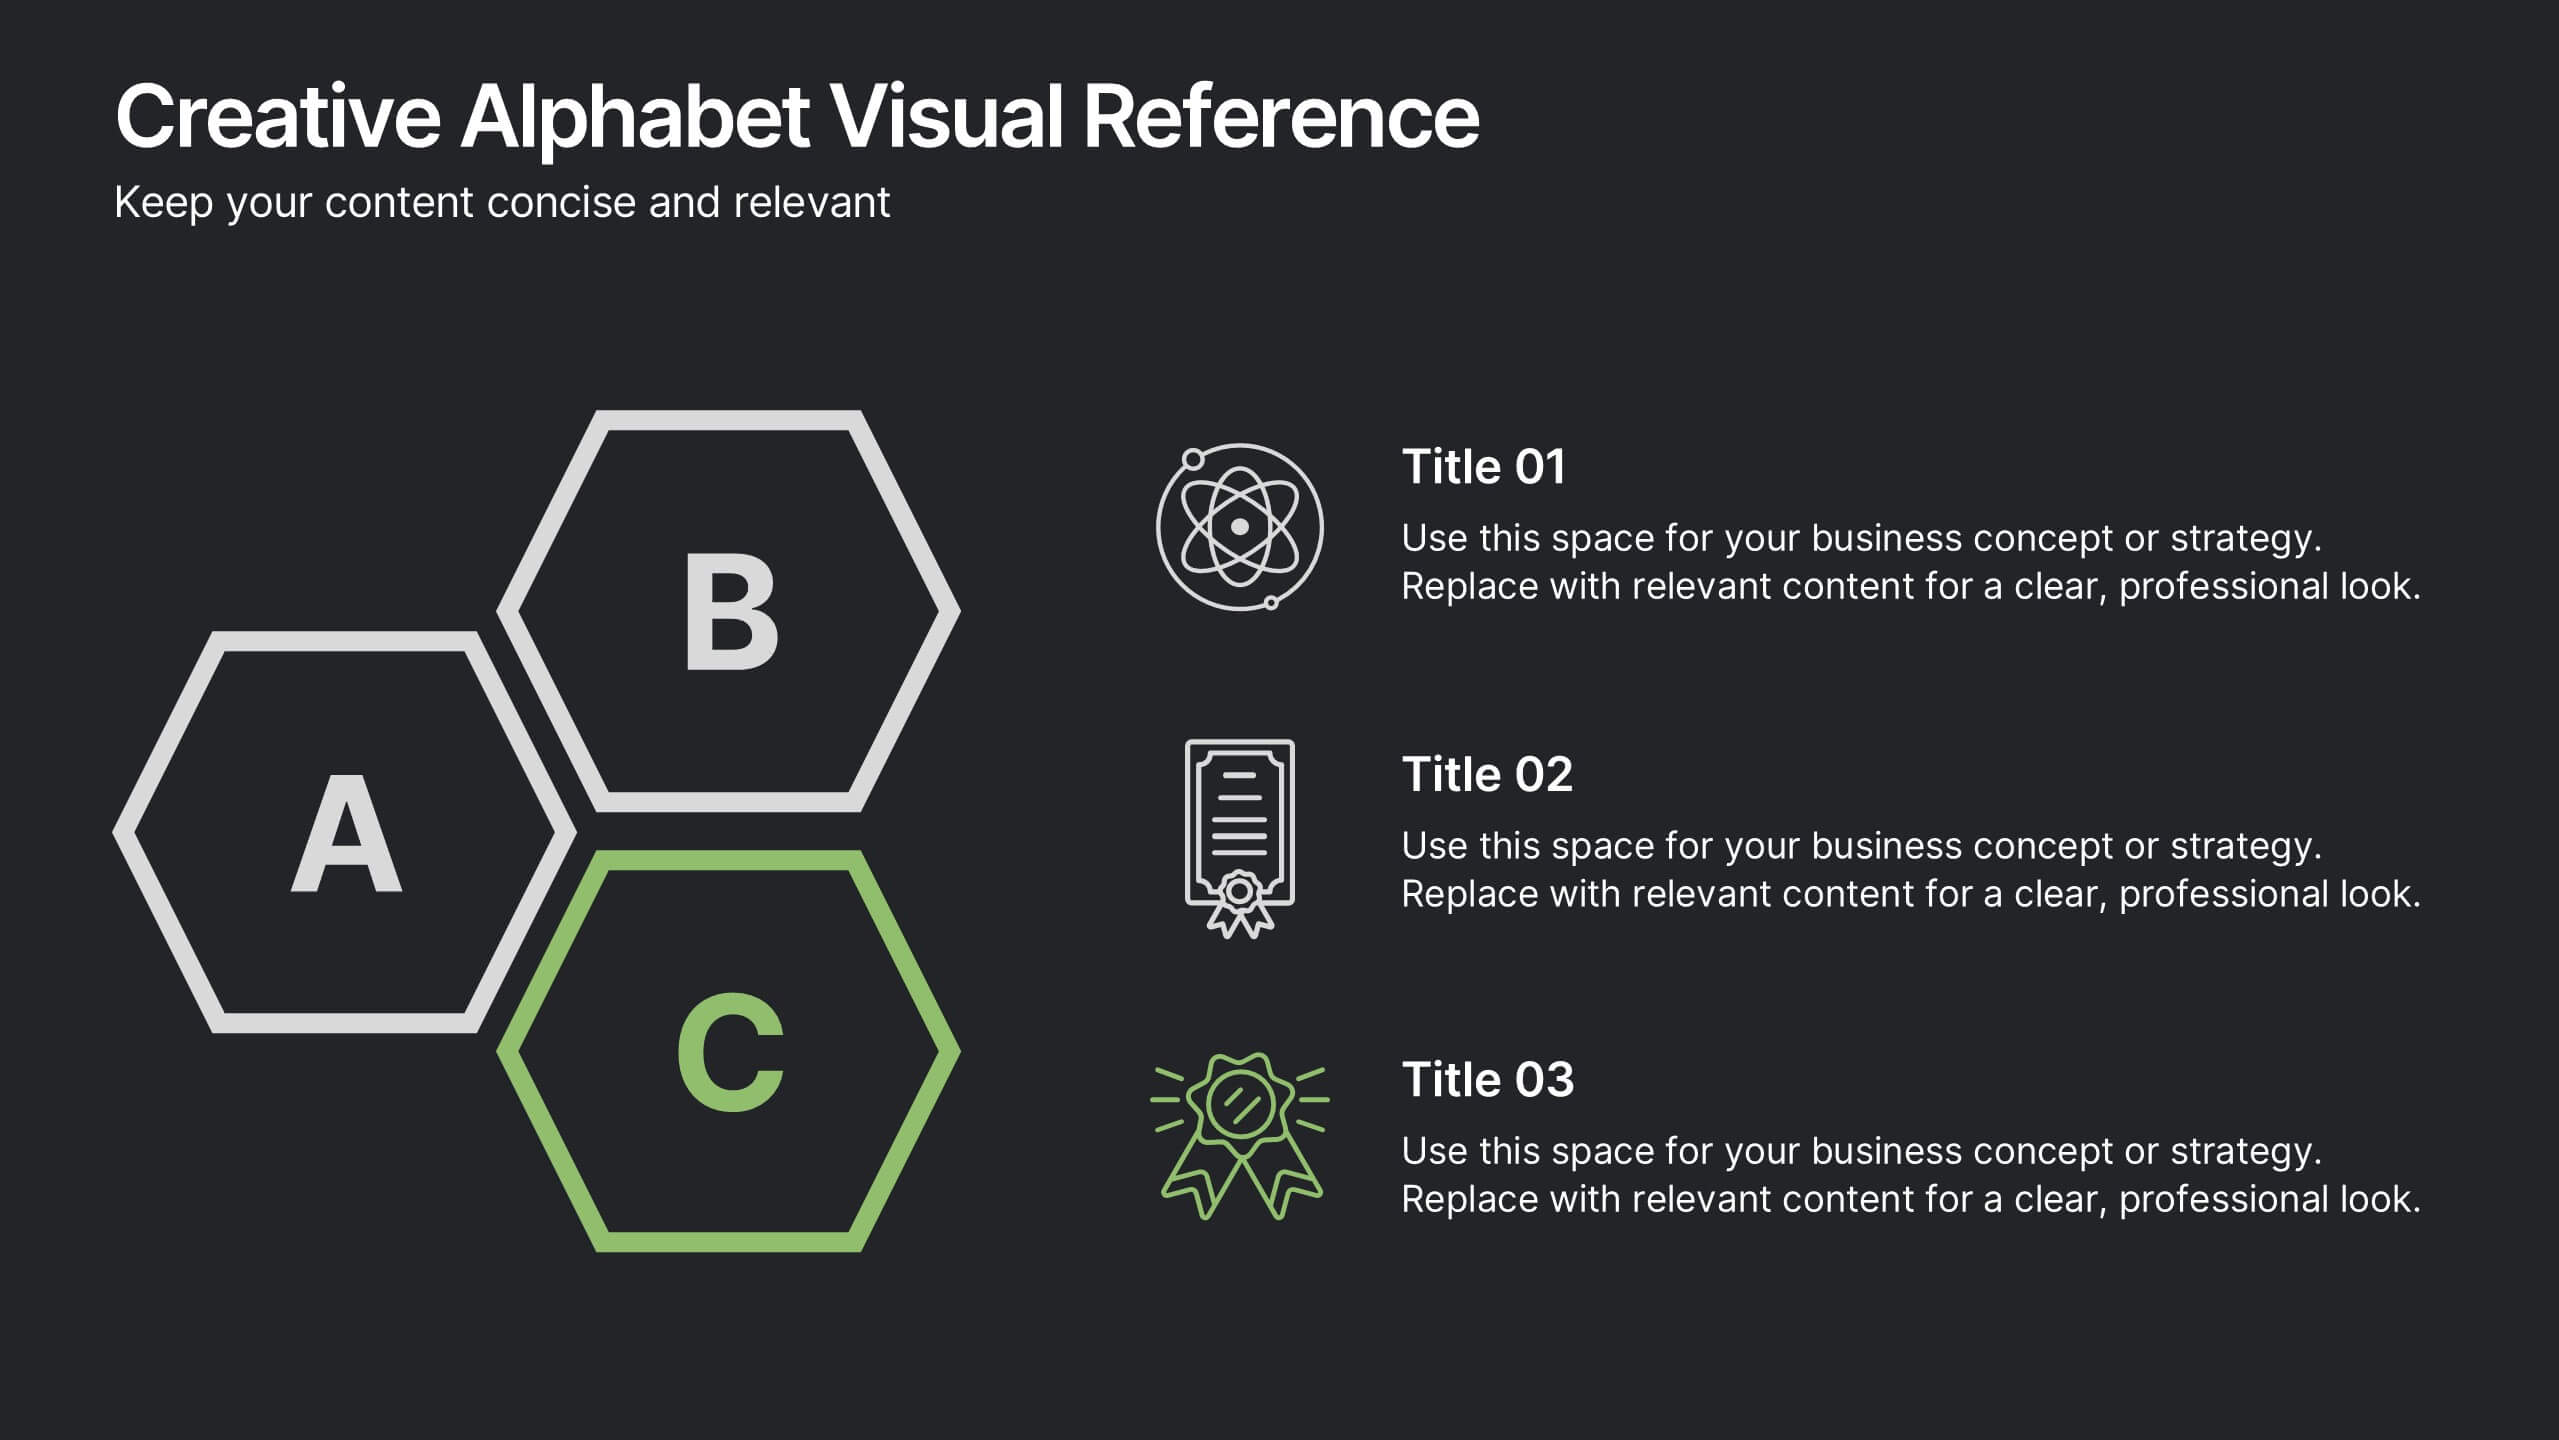
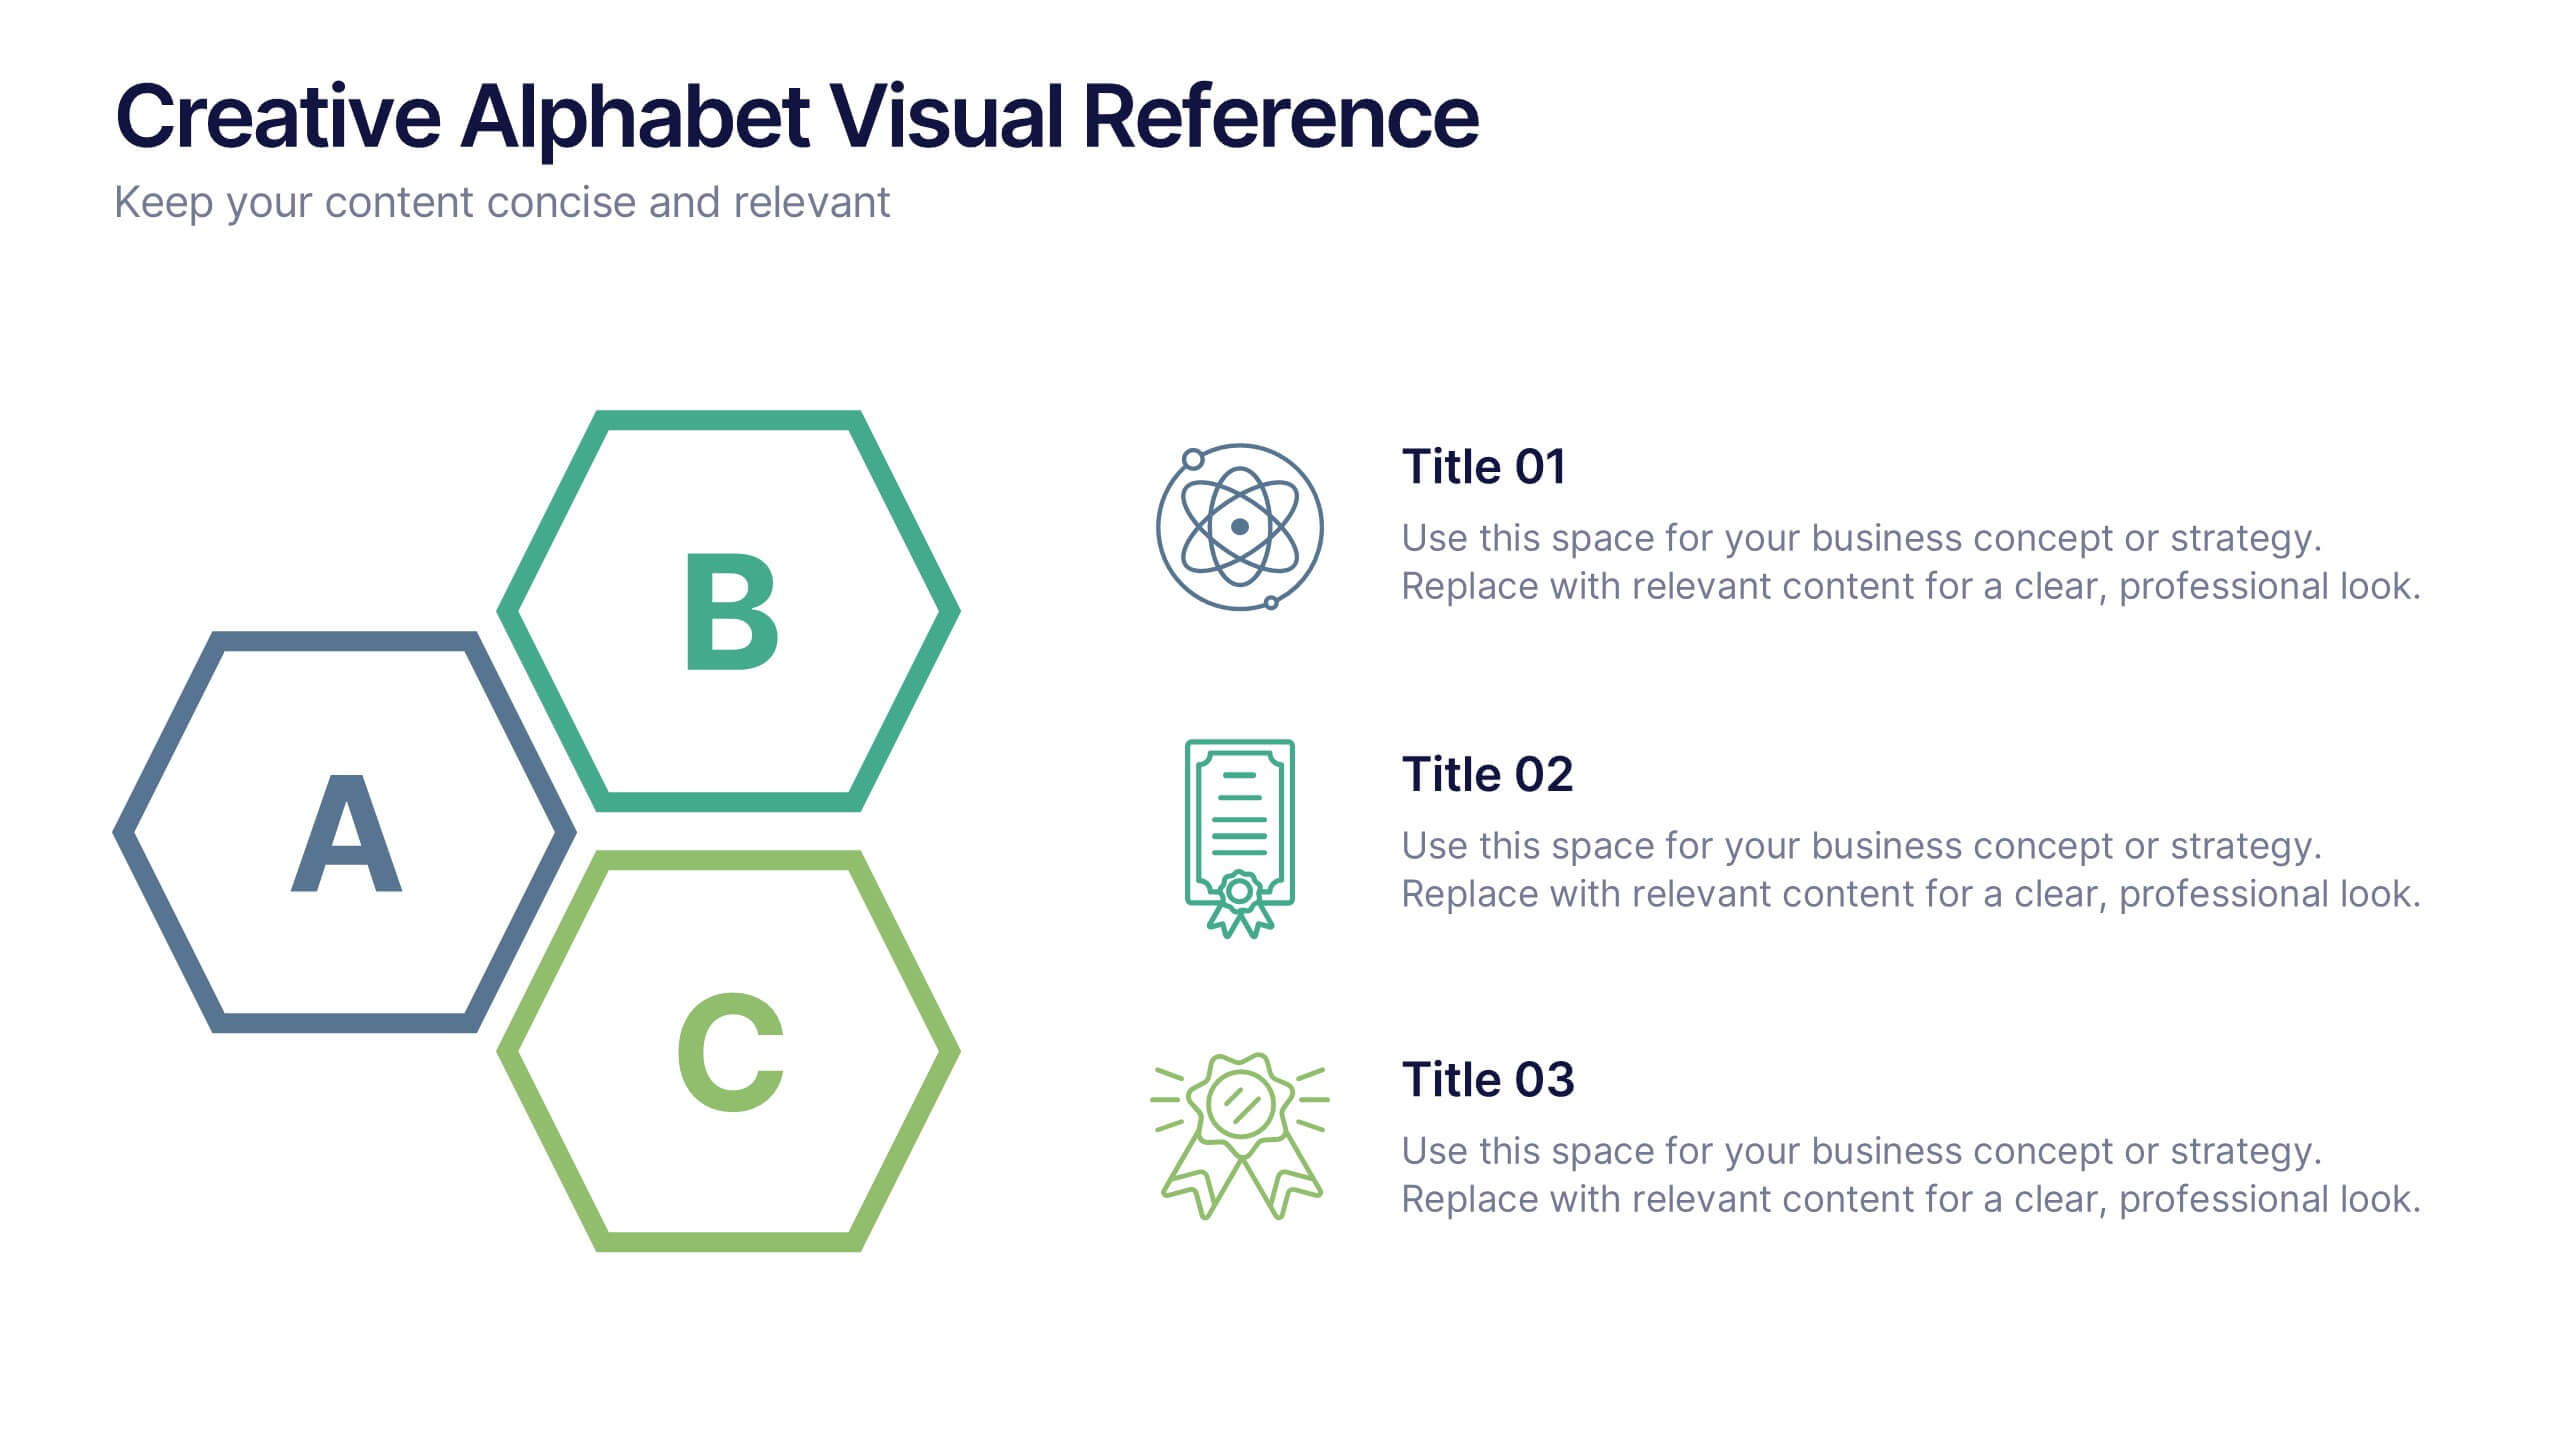
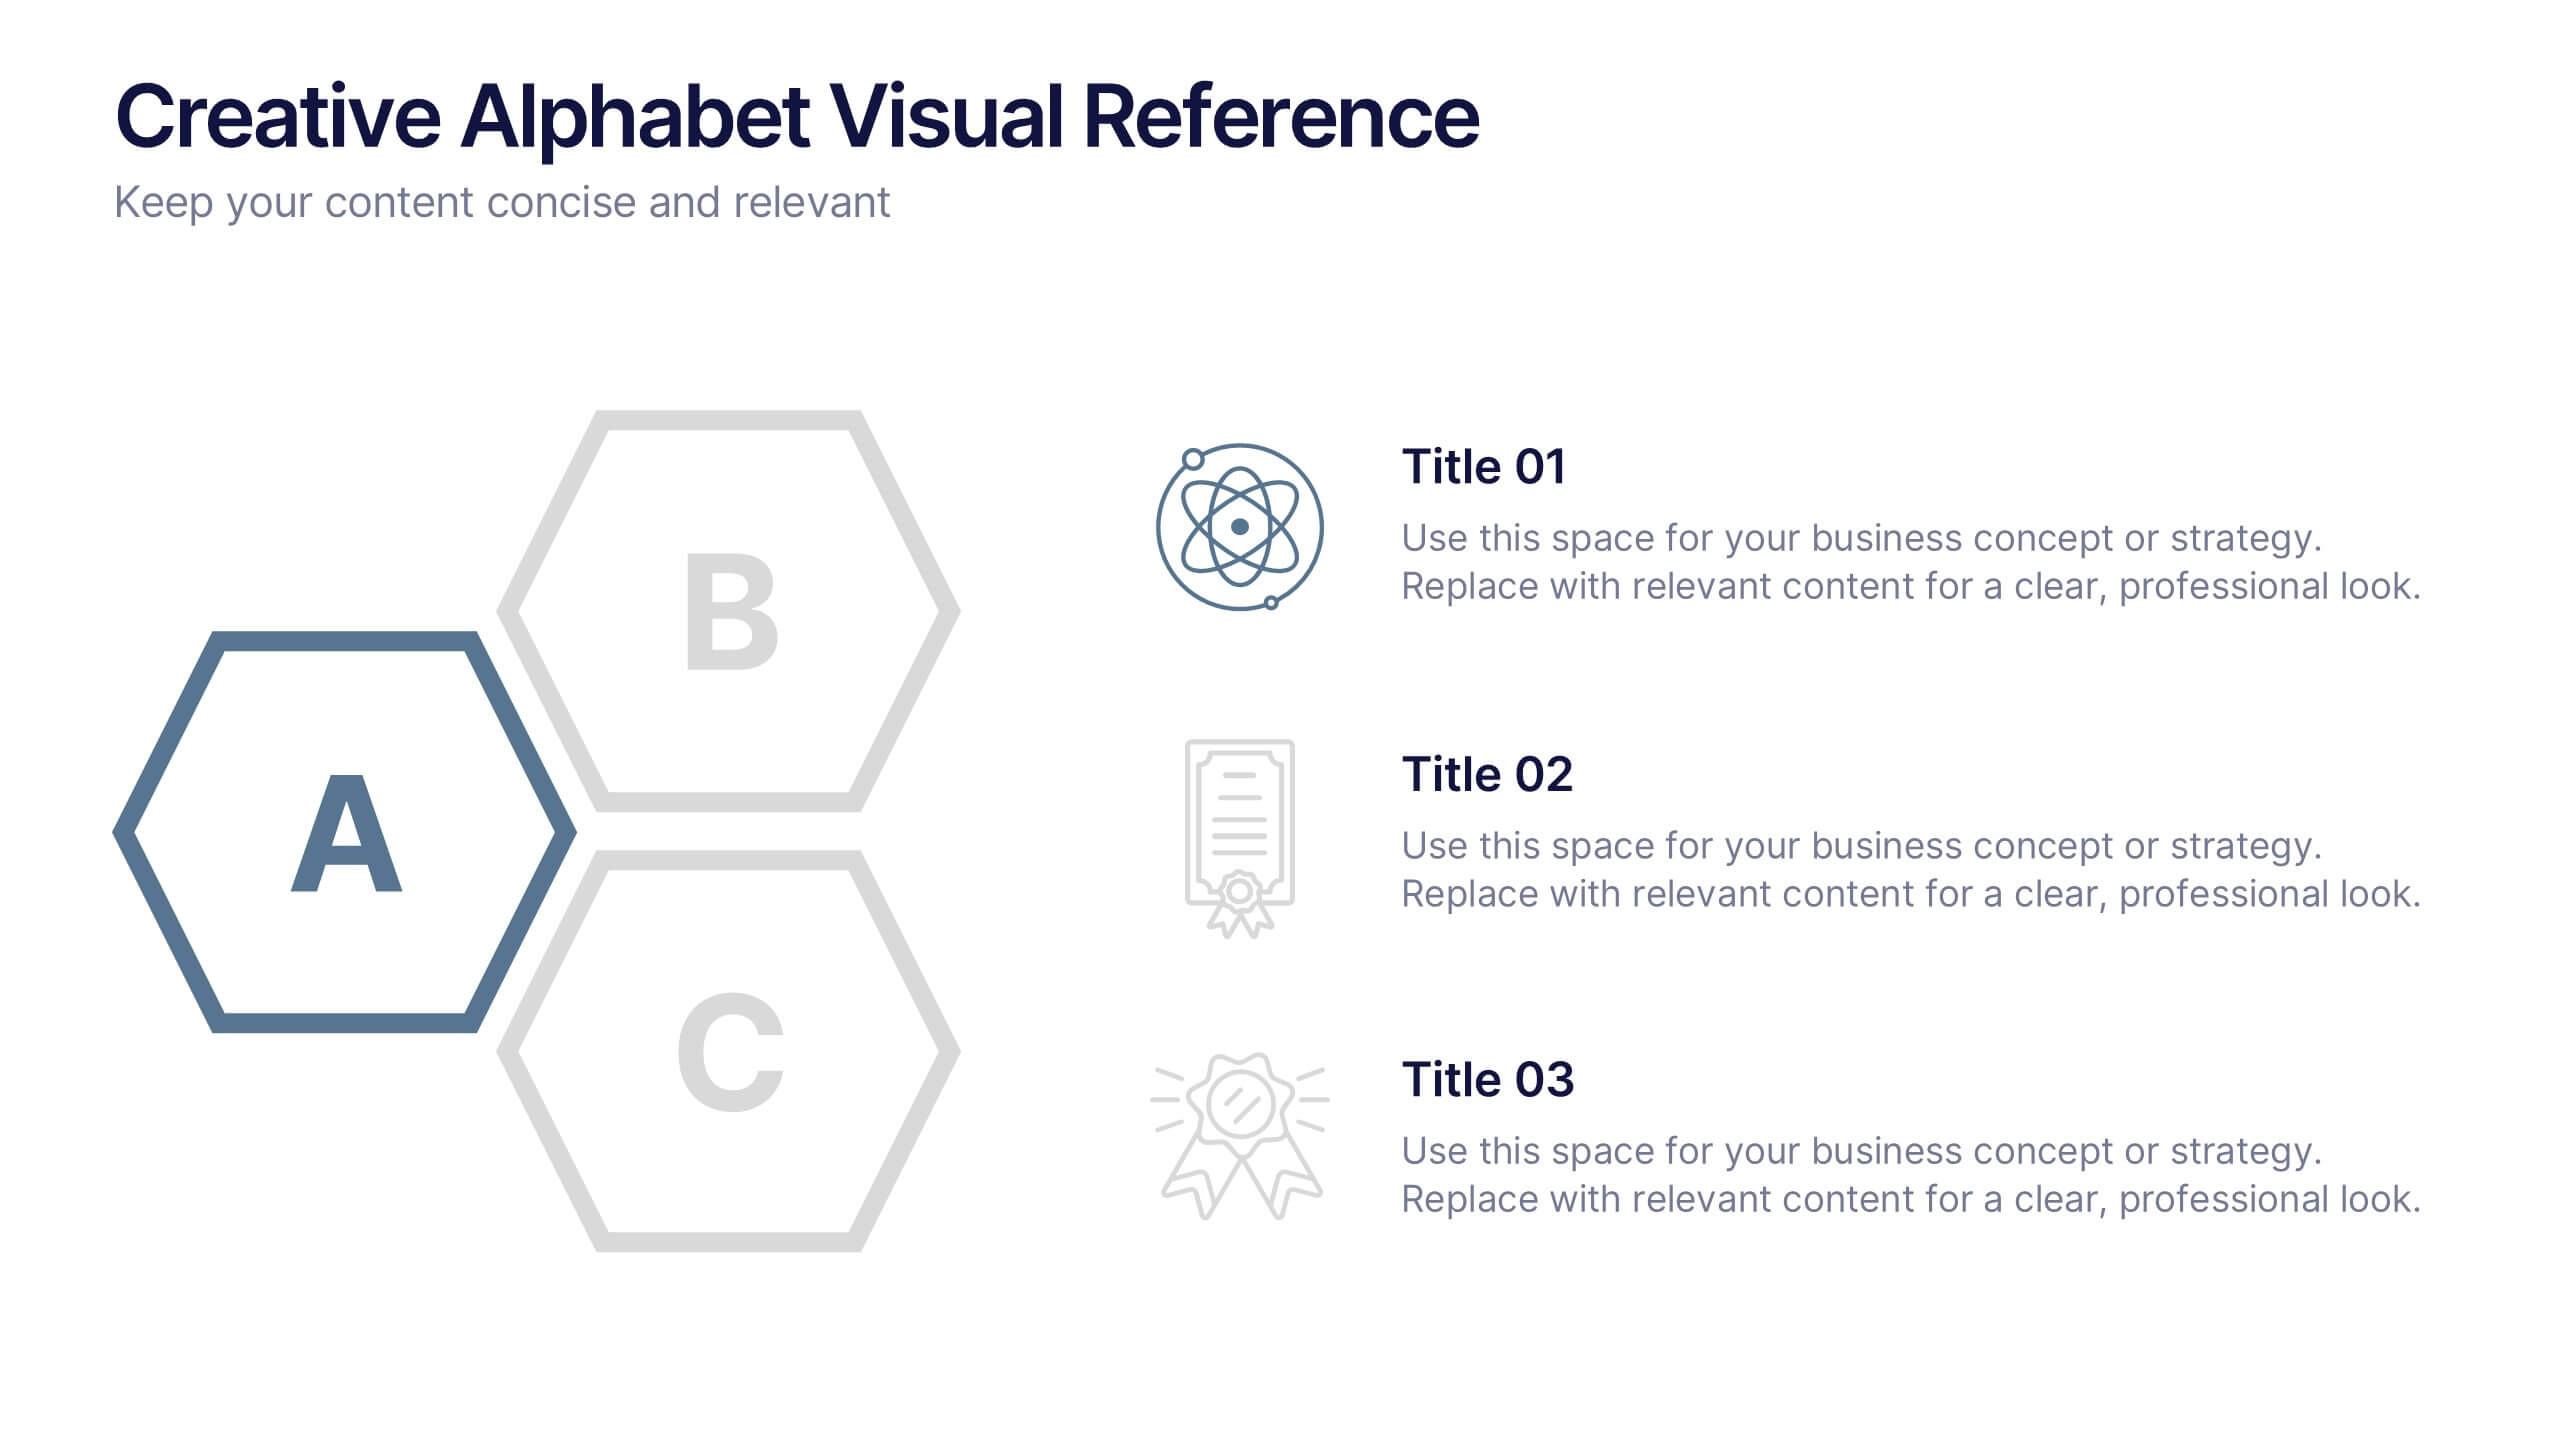
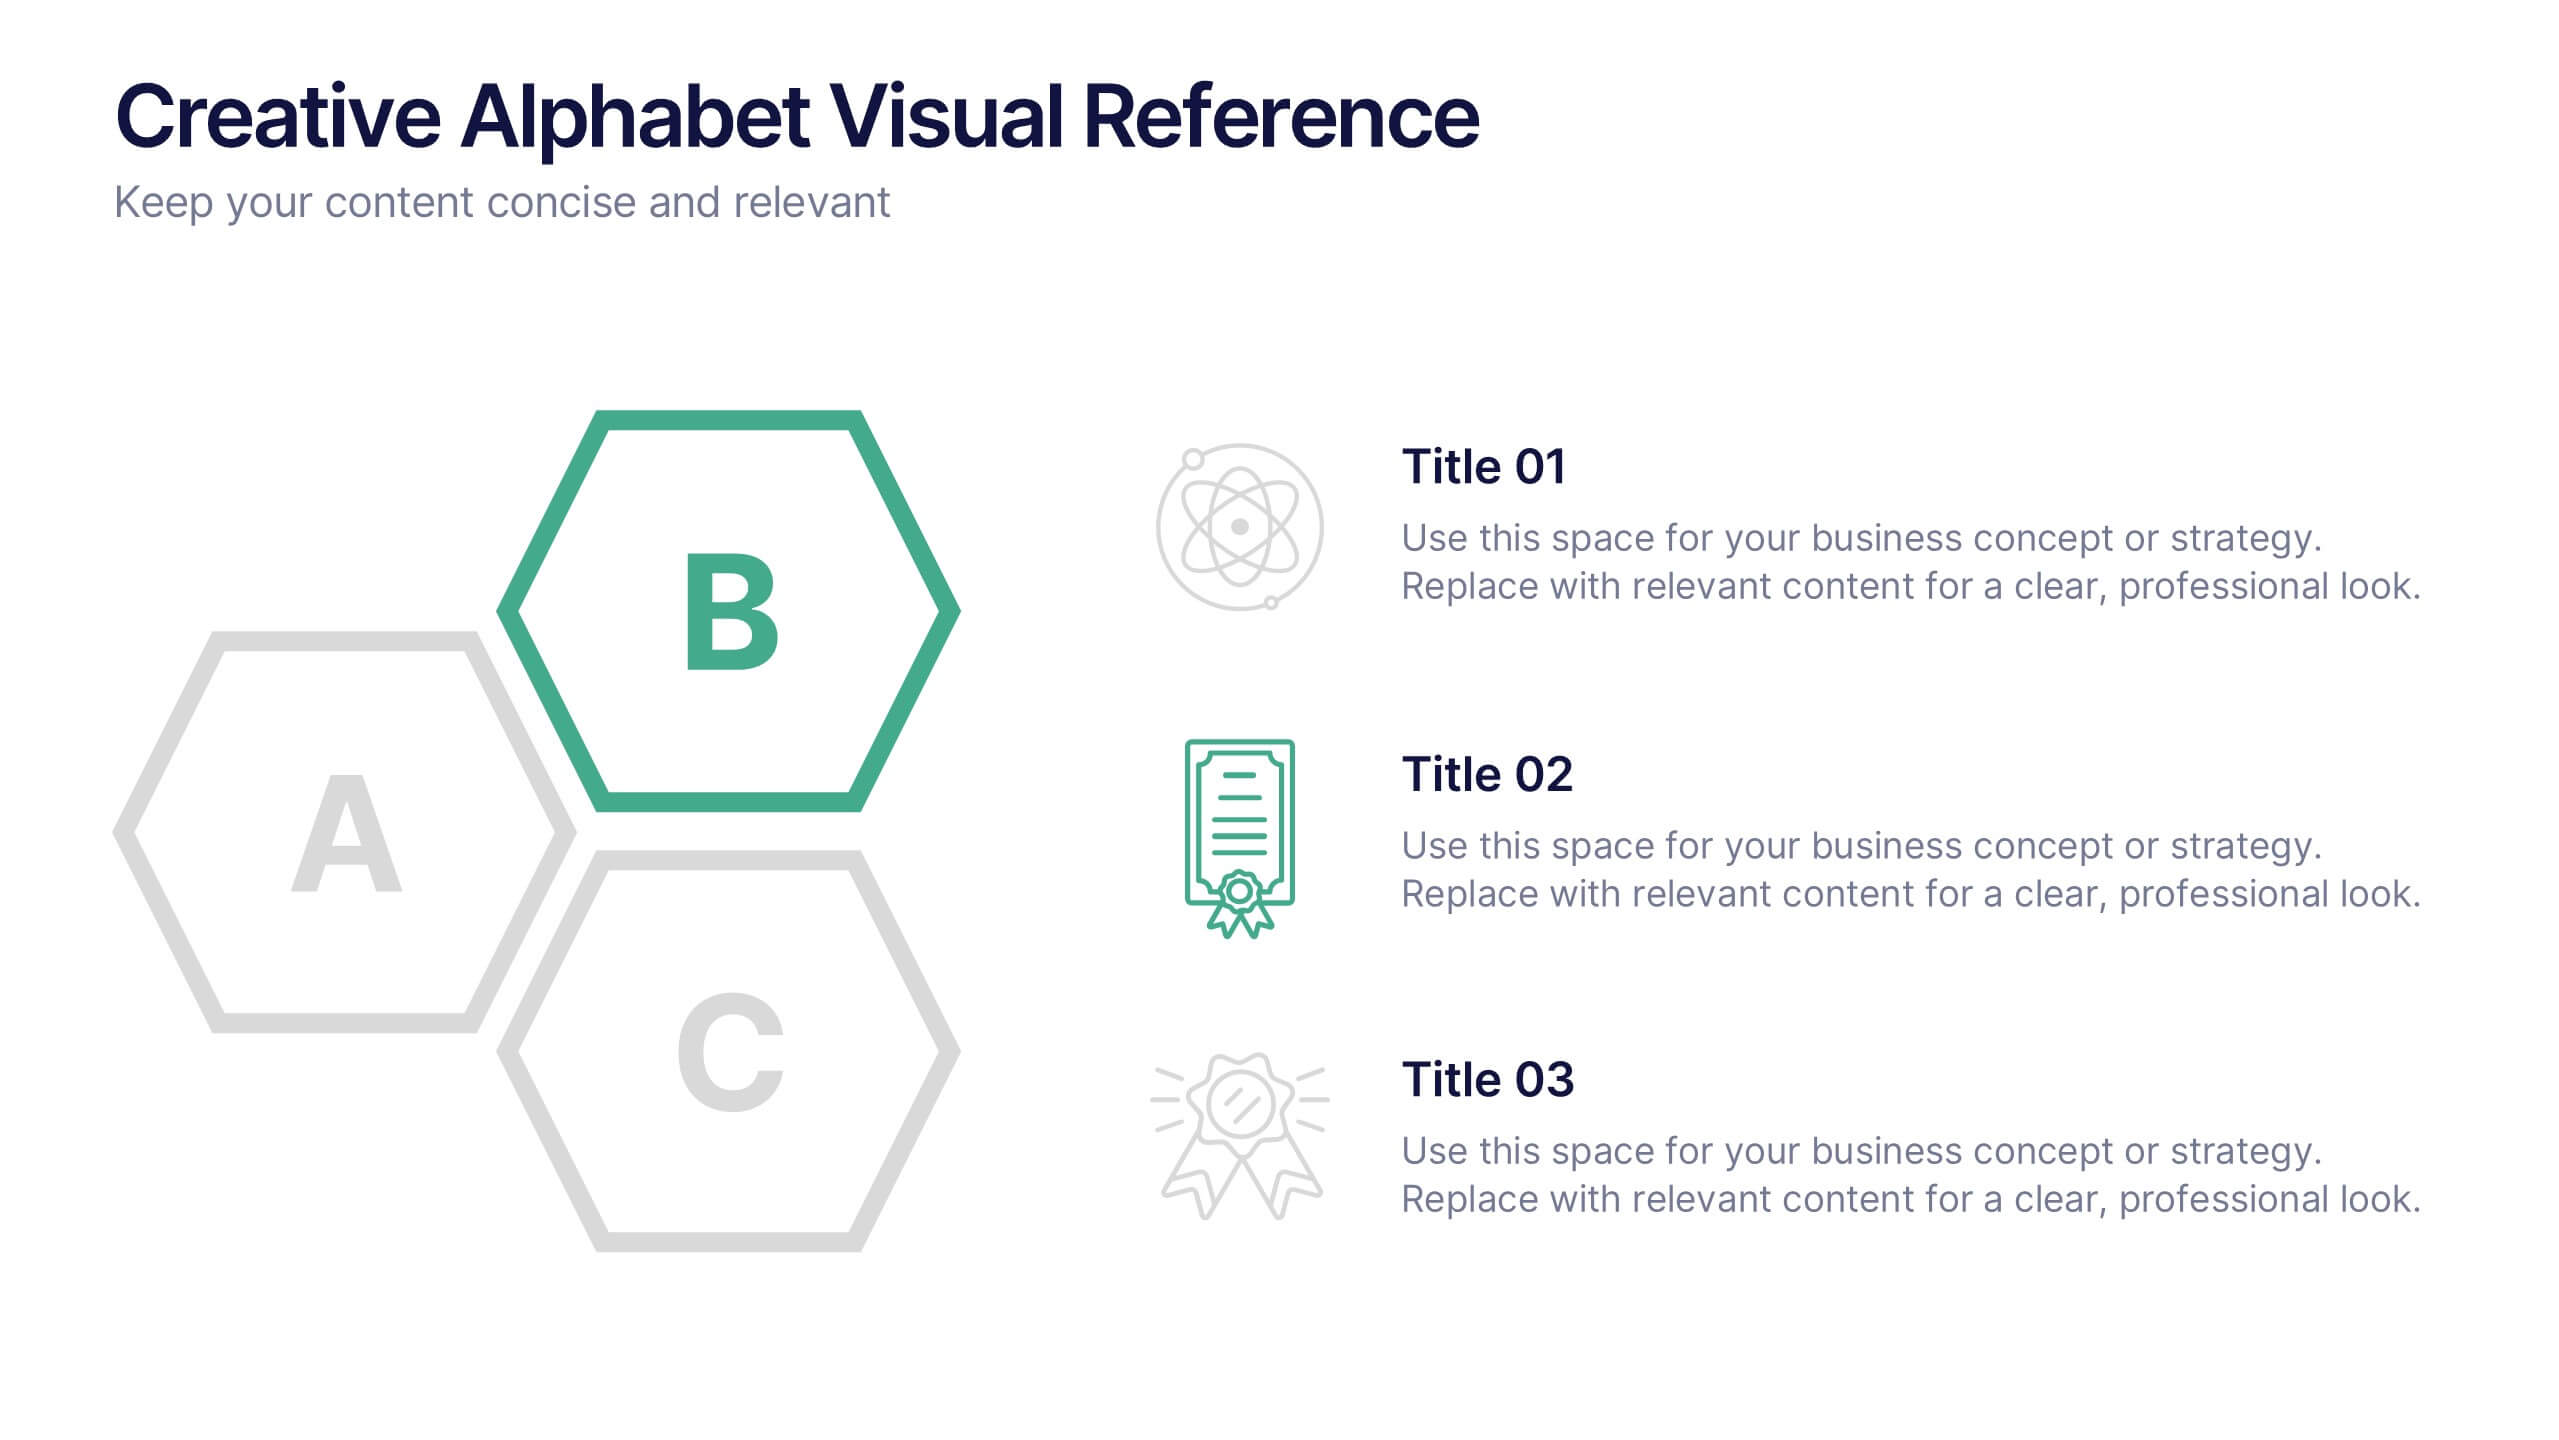
Creative Alphabet Visual Reference Presentation
This creative presentation uses a bold A–B–C visual structure to highlight key points in a clean, modern layout. Ideal for overviews, comparisons, or step-by-step frameworks. Fully customizable in Canva, it balances design and clarity—perfect for business strategies, education, or visual storytelling with strong alphabetical cues and icon integration.


2 slides
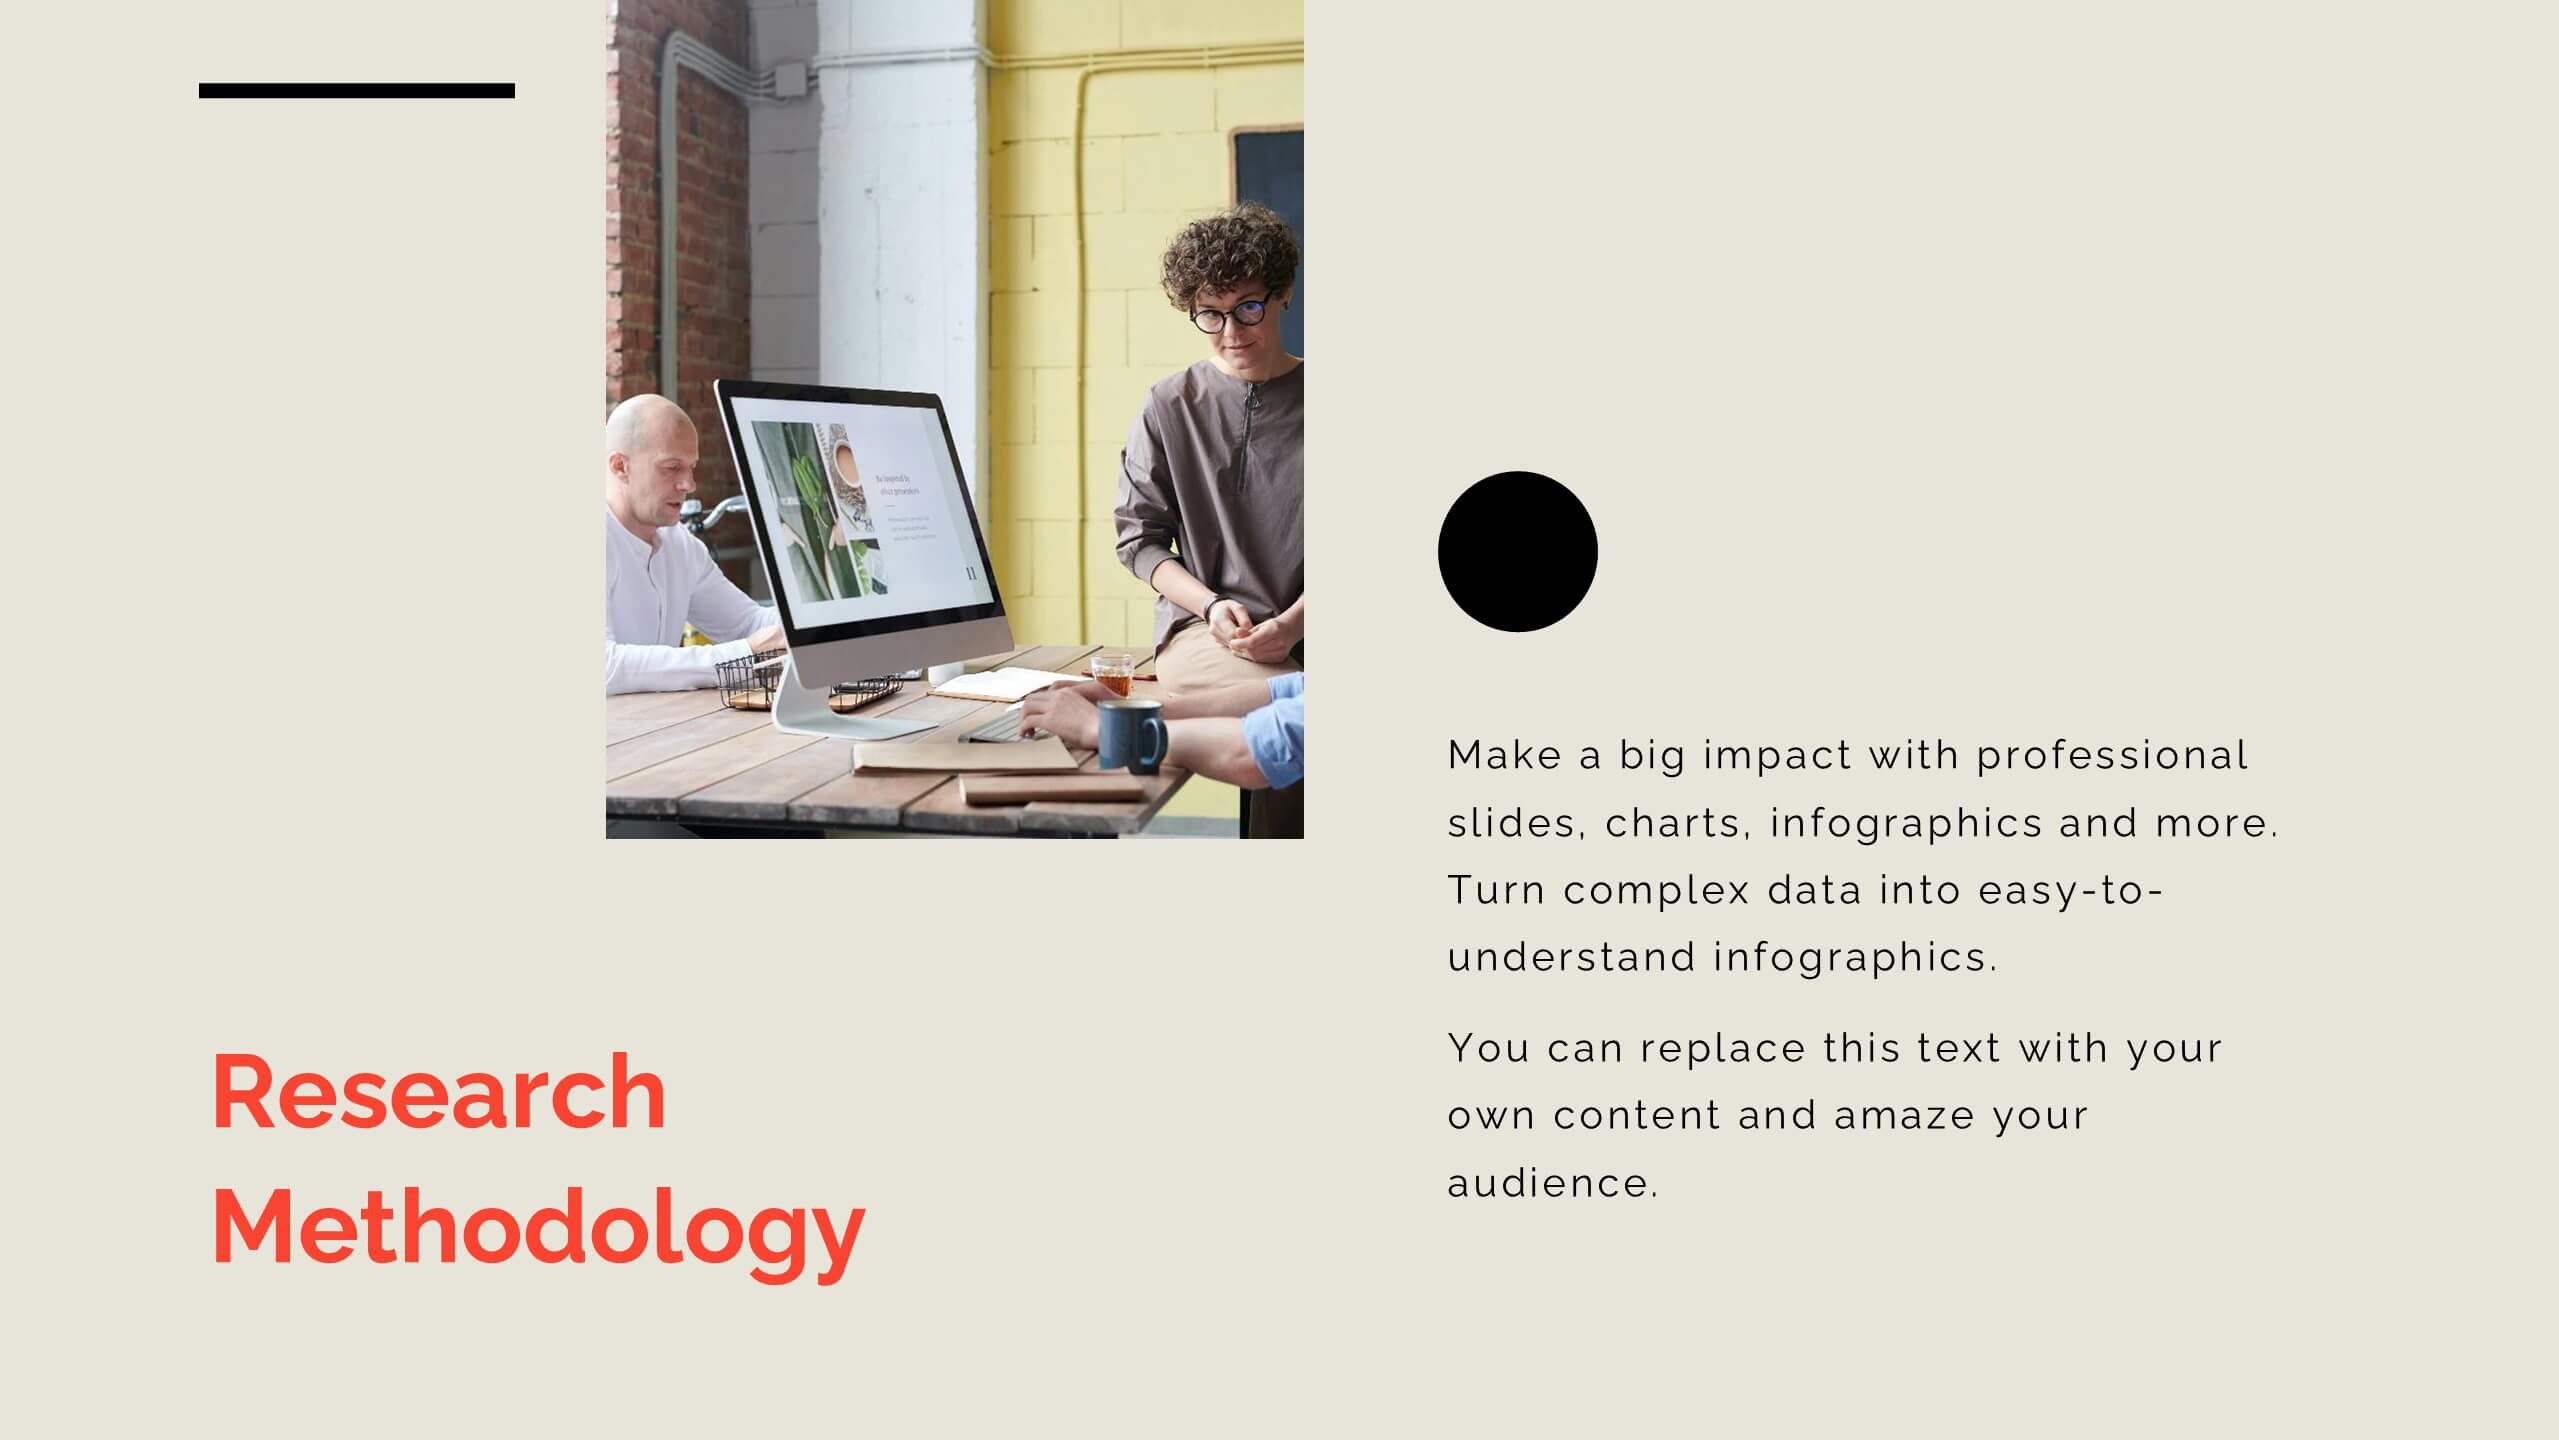
Introduction Slide for Professional Decks Presentation
Make a strong first impression with this clean and modern introduction slide. Designed to kick off your presentation with clarity, this template is ideal for professional decks, pitch presentations, and business briefings. Customize the layout with your visuals and text to align with your message. Fully compatible with PowerPoint, Keynote, and Google Slides.