


Features
- 3 Unique slides
- Fully editable and easy to edit in Microsoft Powerpoint, Keynote and Google Slides
- 16:9 widescreen layout
- Clean and professional designs
- Export to JPG, PDF or send by email


Do you have any questions?
Recommend


21 slides
Dewspire Project Management Plan Presentation
Streamline your project planning process with this visually striking and organized presentation template. Perfectly designed to communicate every stage of your project management, it features sections for problem analysis, objectives, and the scope of work. The timeline, budget breakdown, and resource allocation slides ensure your plans are both clear and actionable. Highlight team expertise with dedicated meet the team layouts and showcase your commitment to quality through evaluation criteria and risk management plans. Ideal for team presentations or client proposals, this template supports PowerPoint, Google Slides, and Keynote, offering full customization for seamless adaptability. Deliver your project vision with confidence and precision!


6 slides
Scrum and Kanban Agile Delivery Presentation
Streamline your Agile processes with this modern Scrum and Kanban workflow slide. Highlight six key stages in your delivery cycle using a sleek, color-coded format with icons. Ideal for project managers, developers, and Agile teams. Fully editable in PowerPoint, Keynote, and Google Slides. Clean, professional layout for maximum clarity.


4 slides
Business Decision-Making Framework Presentation
Visualize your path to smarter choices with this key-themed decision-making template. Ideal for strategy sessions, executive planning, or consulting presentations, it breaks down three core steps leading to actionable results. The layout emphasizes clarity and progression, with editable text zones and sleek icons. Works with PowerPoint, Keynote, and Google Slides.


5 slides
Types of Photography Infographics
There are various types of photography that cater to different subjects, styles, and purposes. These vertical infographics are designed to serve as a comprehensive guide for individuals interested in exploring different genres and styles of photography. These will allow you to provide an overview of different genres and types of photography. They aim to inform viewers about the diverse fields of photography, allowing them to explore various styles and find their areas of interest. Whether used in photography workshops, educational materials, or creative presentations, this template provides valuable insights and inspiration for individuals passionate about the art of photography.


7 slides
Change Management Process Infographic Presentation
Change Management is the process of managing and guiding an organization or individual through a planned and deliberate change. This template is perfect for discussing change management and allows you to customize the design and add your own tips. Designed in Powerpoint, Keynote, and Google Slides it is easy to use with helpful illustrations. Use this change management template to report on current practices, issues and reasons for change, along with how these changes can improve your organization's performance. The perfect tool to share your vision and plan, or align an entire organization!


26 slides
Navigating Freelance and Flexible Work Presentation
Take control of your career with this insightful presentation on navigating freelance and flexible work. Covering key topics like client management, productivity strategies, income stability, and remote work tools, this template helps you present a clear roadmap to success. Fully customizable and compatible with PowerPoint, Keynote, and Google Slides for a seamless experience.


4 slides
Comparison Table for Features & Data
Easily compare key features with the Comparison Table for Features & Data Presentation. This layout displays a side-by-side visual of two options, products, or services—ideal for showcasing benefits, pricing tiers, or performance metrics. With three rows of comparison points, central icons, and clean headings, this template is fully editable in PowerPoint, Keynote, or Google Slides.


5 slides
Numerical Highlights in Strategy Presentation
Present key strategic milestones using this visually engaging curved-number layout. Designed to emphasize four sequential points, it's perfect for showcasing steps, achievements, or data-driven highlights. The bold numbering and layered hills guide the viewer naturally. Fully editable in Canva—ideal for business plans, growth summaries, or performance strategy visuals.


23 slides
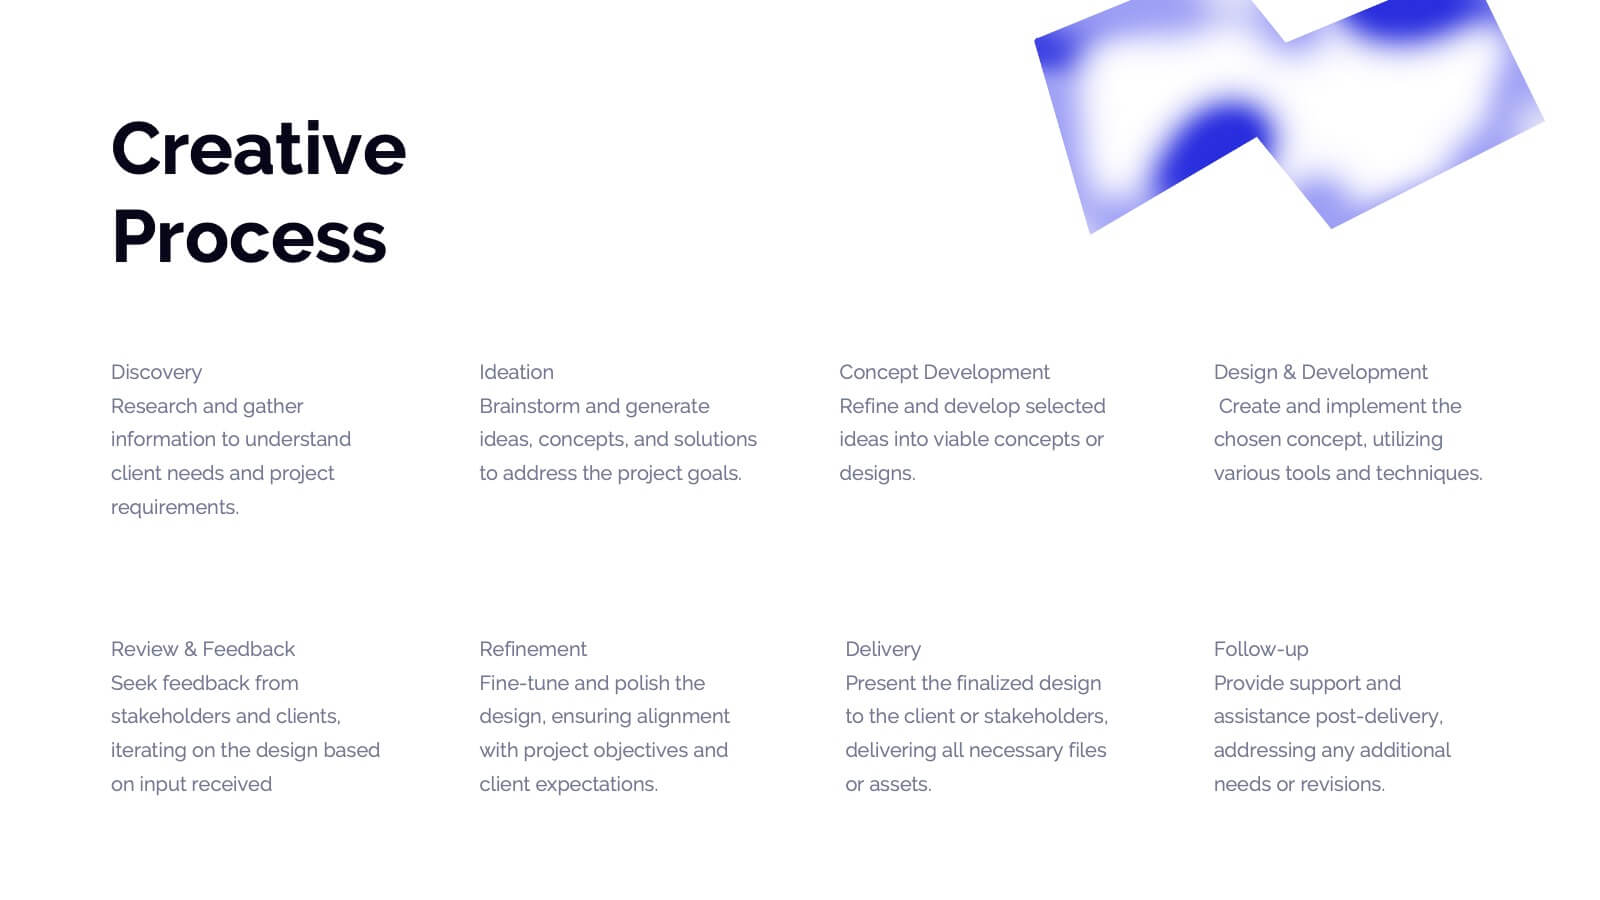
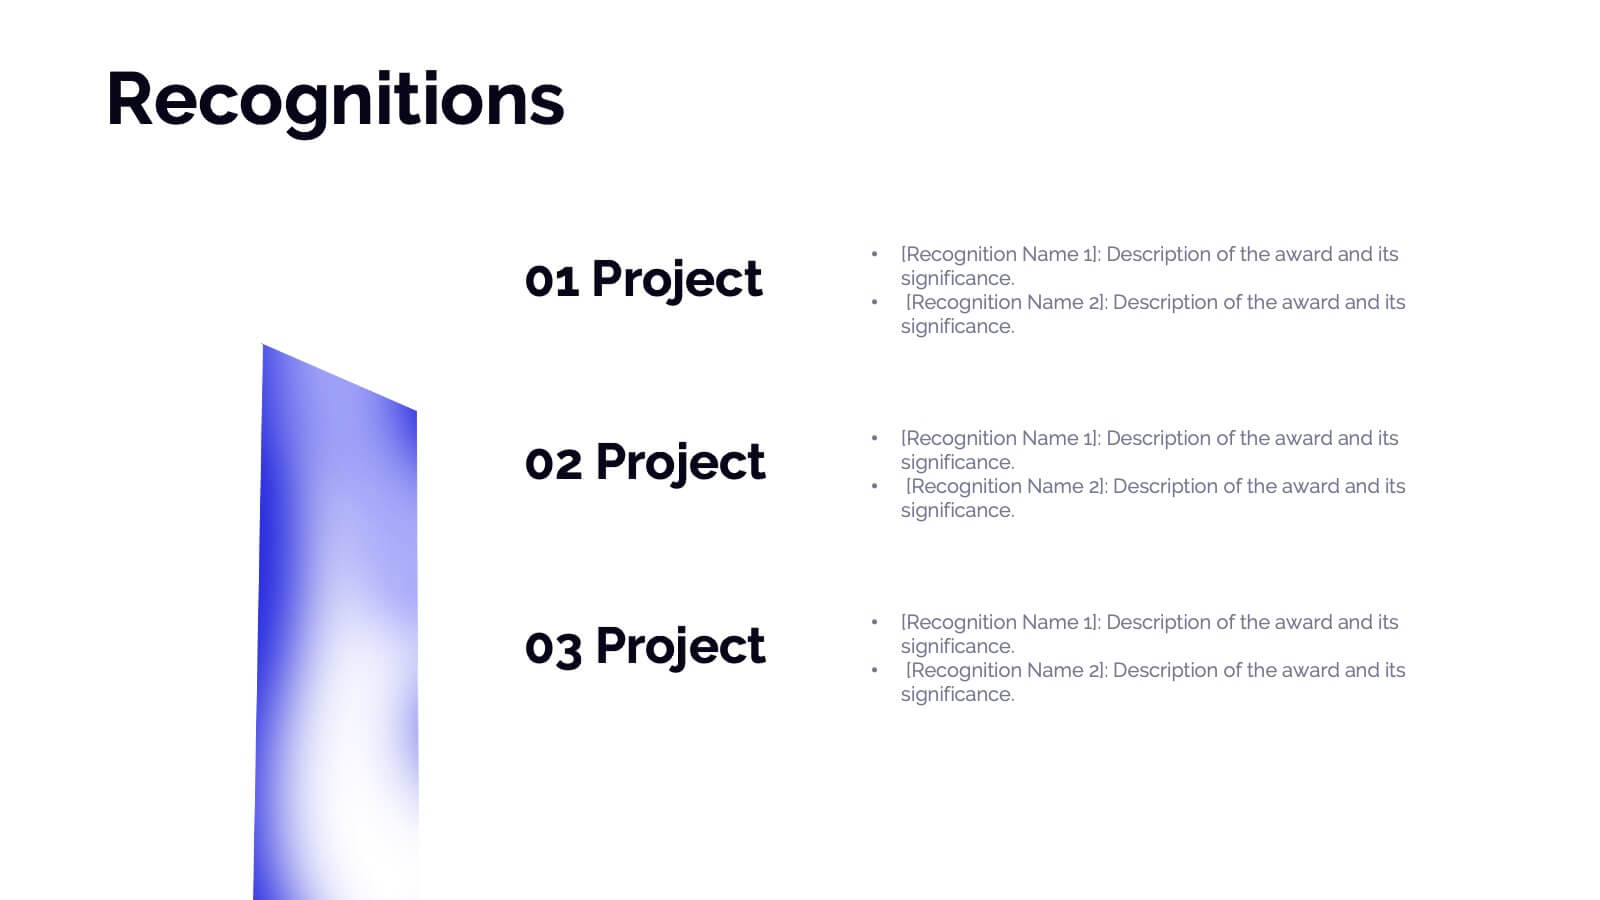
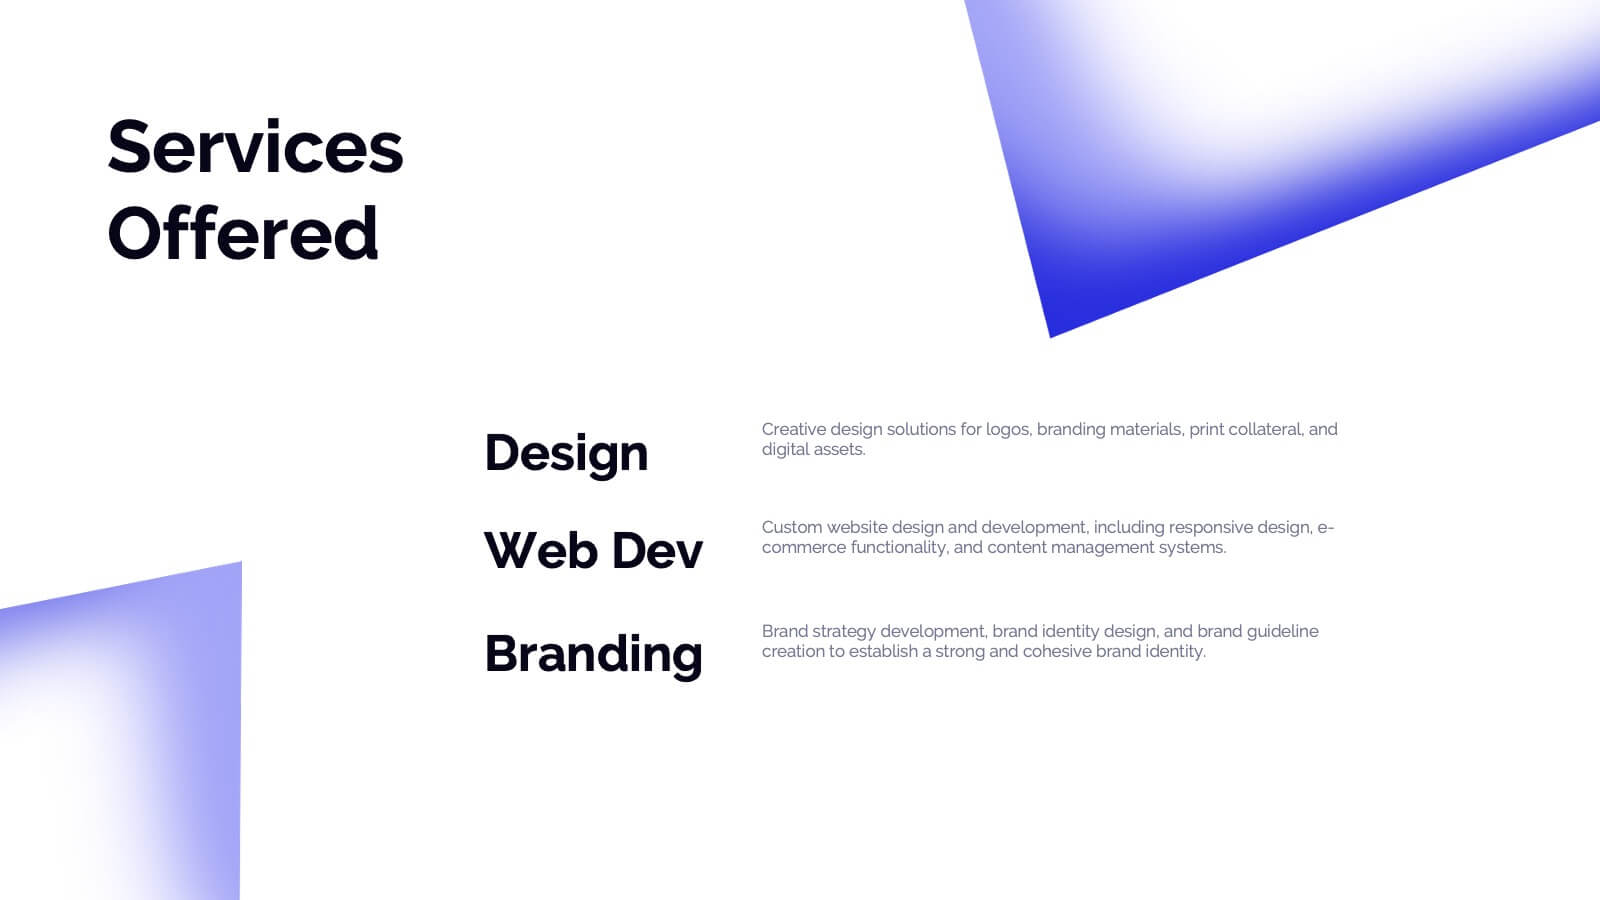
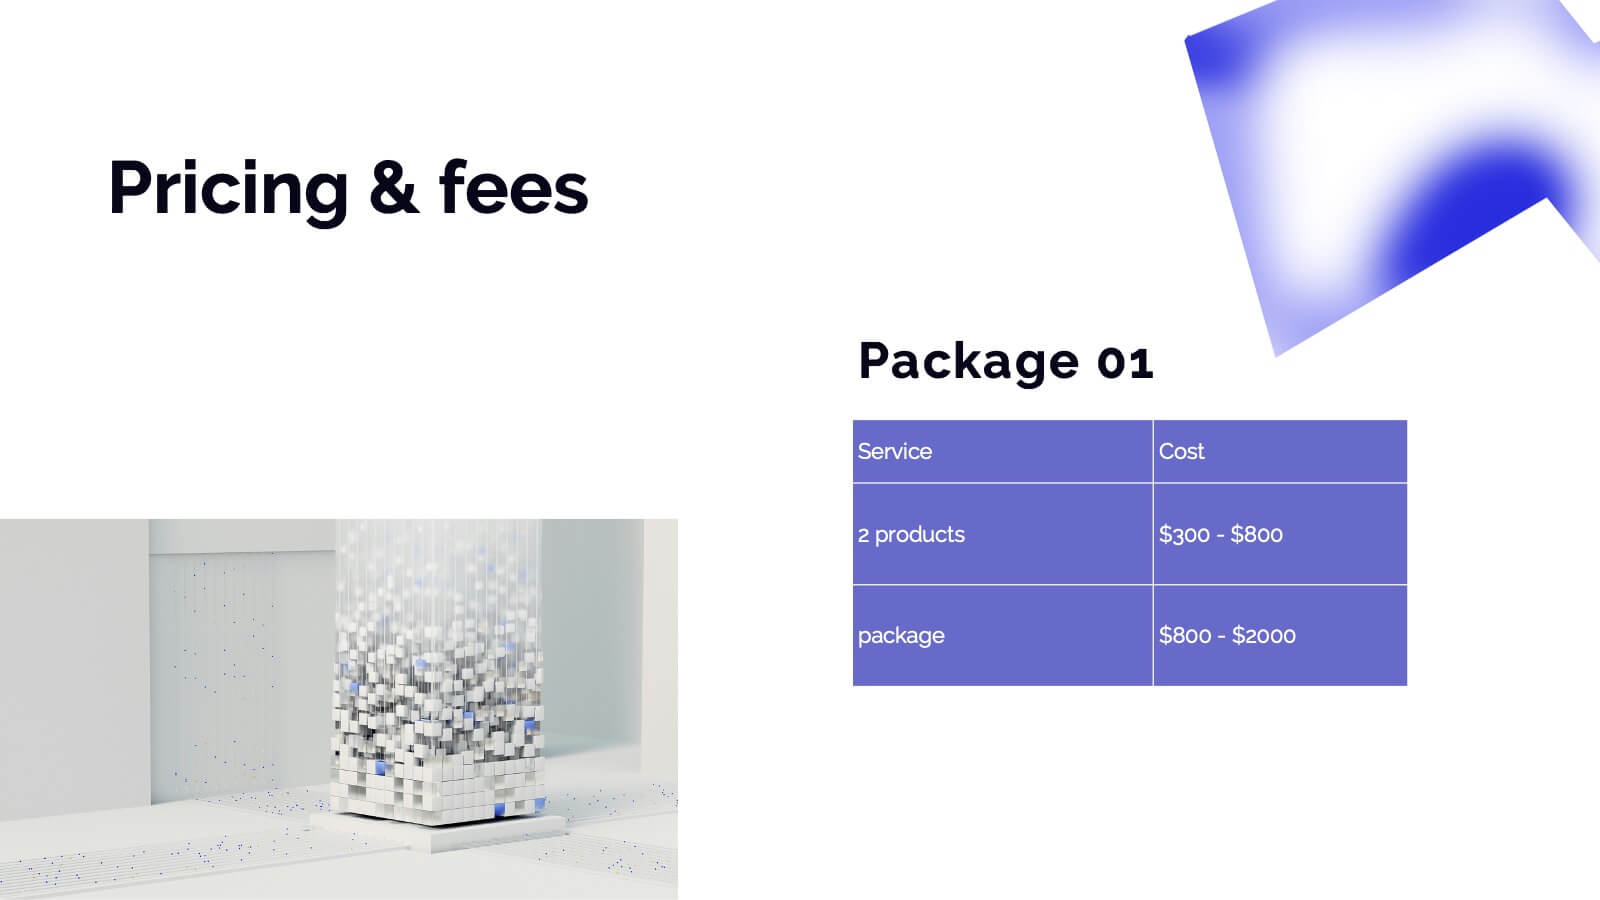
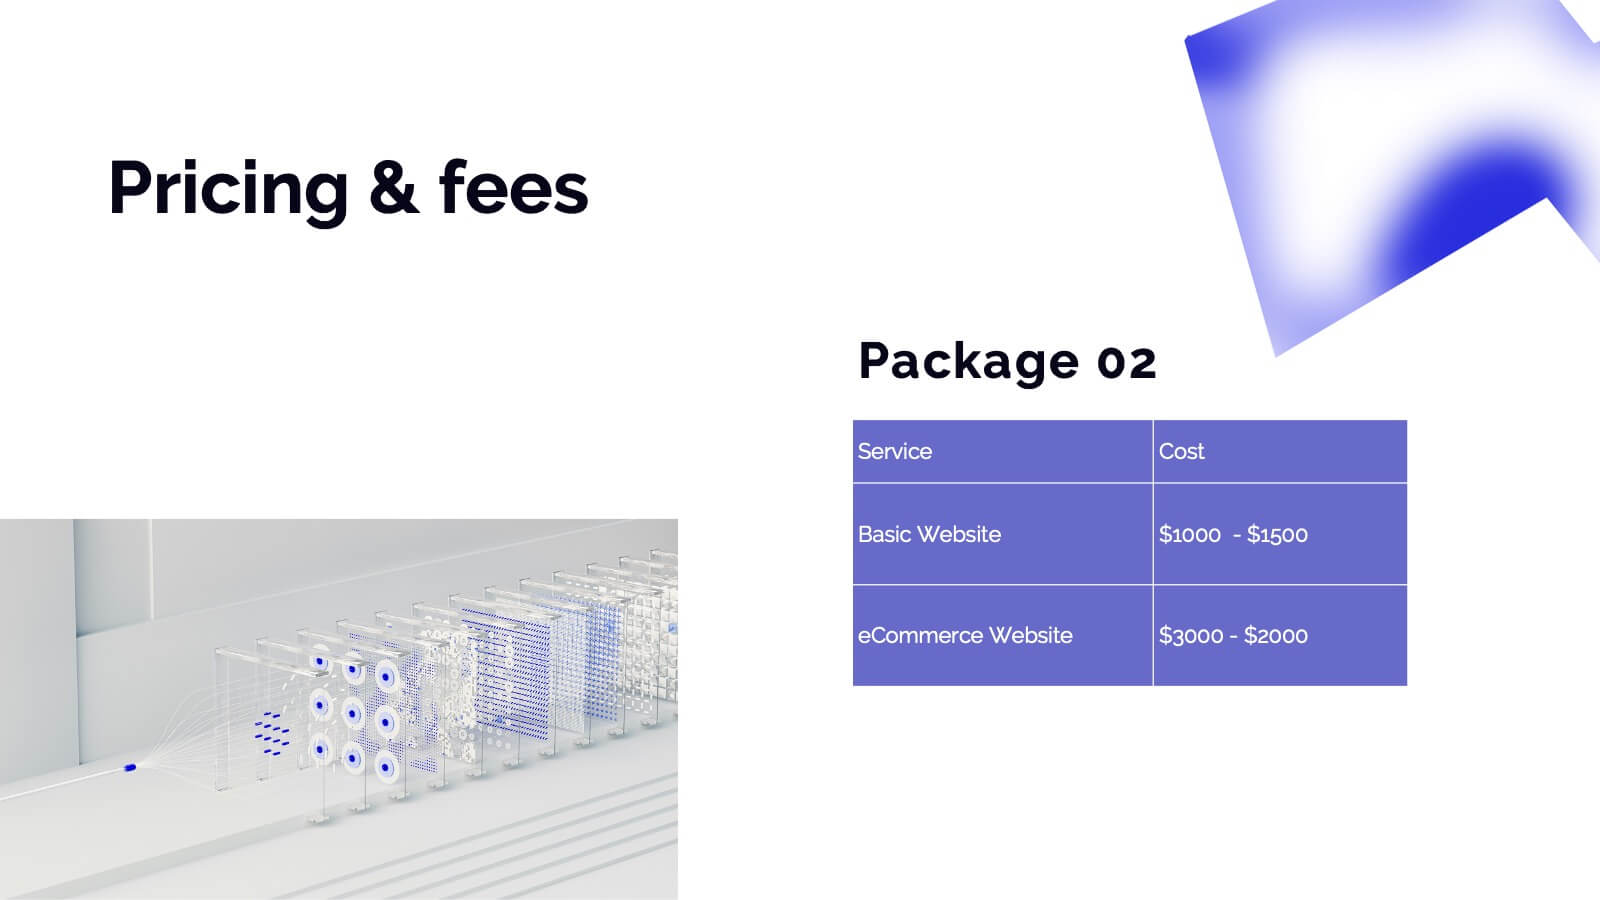
Dryad Photography Portfolio Template Presentation
Showcase your photography skills with this elegant and professional portfolio presentation template! Perfect for highlighting your projects, style, and creative process, this template covers everything from client testimonials to pricing and services offered. It’s ideal for photographers wanting to present their work with style and clarity. Compatible with PowerPoint, Keynote, and Google Slides for effortless sharing and presentations.


12 slides
Creative Mind Map Presentation
Unlock new perspectives with the Creative Mind Map Presentation. Designed to visualize brainstorming, strategic thinking, or concept development, this template offers an intuitive radial layout to highlight five key ideas. Fully customizable and ideal for professionals, educators, and creatives. Compatible with PowerPoint, Keynote, and Google Slides for seamless use.


7 slides
Loves Travel Infographic Presentation
Travel is an opportunity to get out of our comfort zones and be inspired to try new things, it changes our perspective on the world. Use this template to give your audience an overview of a trip and prepare them for what they will be experiencing. This template features an infographic style design, with plenty of room to describe the locations and activities as well as instructions and tips. Build your own infographic with this template, and add it to your presentations. You can easily add your own content in PowerPoint, Keynote, or Google slides and turn it into a fun presentation in minutes.


7 slides
AIDA Model Infographic Presentation Template
The AIDA model is the most commonly used marketing communication formula. It describes how people are influenced by advertising, and how brands can use this to their advantage. The AIDA model of marketing is a well-known strategy for organizations to use when presenting products and services. With this template you will be sure you have every element of the AIDA model covered in your presentation. This template will provide you with a perfect and easy way to create your ideal AIDA model presentation. This includes a comprehensive overview of the AIDA marketing funnel and how it works.


4 slides
3-Circle Venn Diagrams Presentation
Unlock clarity with a bold visual that highlights how ideas, data, or teams connect at key intersection points. This presentation makes complex relationships easy to explain with clean circles, labels, and structured insights. Fully editable and compatible with PowerPoint, Keynote, and Google Slides.


6 slides
Sales Strategy 30-60-90 Day Plan Presentation
Drive sales success with this structured 30-60-90 day strategy template! Designed to help sales teams and professionals set clear objectives, track progress, and optimize performance, this layout ensures a smooth transition from planning to execution. Fully customizable and compatible with PowerPoint, Keynote, and Google Slides for seamless presentations.


5 slides
Business Growth Cycle Presentation
Illustrate your company’s journey with the Business Growth Cycle slide. This dynamic layout features four sleek arrow segments that represent each phase of growth—from initiation to expansion. Color-coded steps and minimalist icons help guide the audience through your strategy clearly and efficiently. Ideal for outlining roadmaps, business stages, or workflow transitions. Fully editable and compatible with PowerPoint, Keynote, and Google Slides.


7 slides
Relationship Connectivity Infographic
The Relationship Connectivity Infographic provides a structured visualization to represent the interconnectedness of various elements within a system or project. This graphic organizes components into a cohesive layout that highlights how each part is related to and impacts the others. Ideal for demonstrating the complex synergy between different departments, phases of a project, or any scenario requiring a clear display of relationships, this infographic serves as an essential tool for planners, educators, and managers. It is designed to be user-friendly and is compatible with a range of platforms, including PowerPoint, Google Slides, and Keynote, making it easily customizable.


23 slides
Delphi Investor Pitch Presentation
The Delphi Pitch Deck offers a warm and inviting design, ideal for conveying complex business concepts in a clear and engaging manner. The deck features a cohesive layout that covers all the essential components of a successful pitch, including company overview, problem statement, solution, market opportunity, and target audience. With a focus on optimizing supply chain efficiency, the template is perfect for startups and businesses looking to showcase their unique selling proposition and innovative strategies. The deck also includes detailed sections on business model canvas, revenue model, competitive landscape, and financial projections, ensuring your audience receives a comprehensive understanding of your business. The soft color palette enhances readability while maintaining a professional tone, making it suitable for various industries. Fully compatible with PowerPoint, Keynote, and Google Slides, the Delphi Pitch Deck is the perfect tool for delivering a memorable and persuasive presentation.