


Features
- 4 Unique slides
- Fully editable and easy to edit in Microsoft Powerpoint, Keynote and Google Slides
- 16:9 widescreen layout
- Clean and professional designs
- Export to JPG, PDF or send by email


Do you have any questions?
Recommend


20 slides
Aether Marketing Research Report Presentation
The Marketing Research Report Presentation Template offers a sleek design with 20 fully customizable slides, ideal for presenting in-depth marketing insights. This template features sections for industry analysis, consumer behavior, emerging technologies, and marketing trends like SEO, social media, and influencer strategies. It also highlights e-commerce trends, personalization, sustainability, and storytelling techniques. The modern black-and-gold gradient aesthetic adds sophistication, making it perfect for professional reports. Compatible with PowerPoint, Keynote, and Google Slides, this template ensures a polished and engaging presentation experience.


5 slides
Performance Metrics and KPI Review Presentation
Visualize performance at a glance with the Performance Metrics and KPI Review presentation template. Featuring sleek gauge charts in various color schemes, this layout makes it easy to display progress, thresholds, and KPIs across categories. Customize each dial and label to reflect your own business metrics. Compatible with PowerPoint, Keynote, and Google Slides.


27 slides
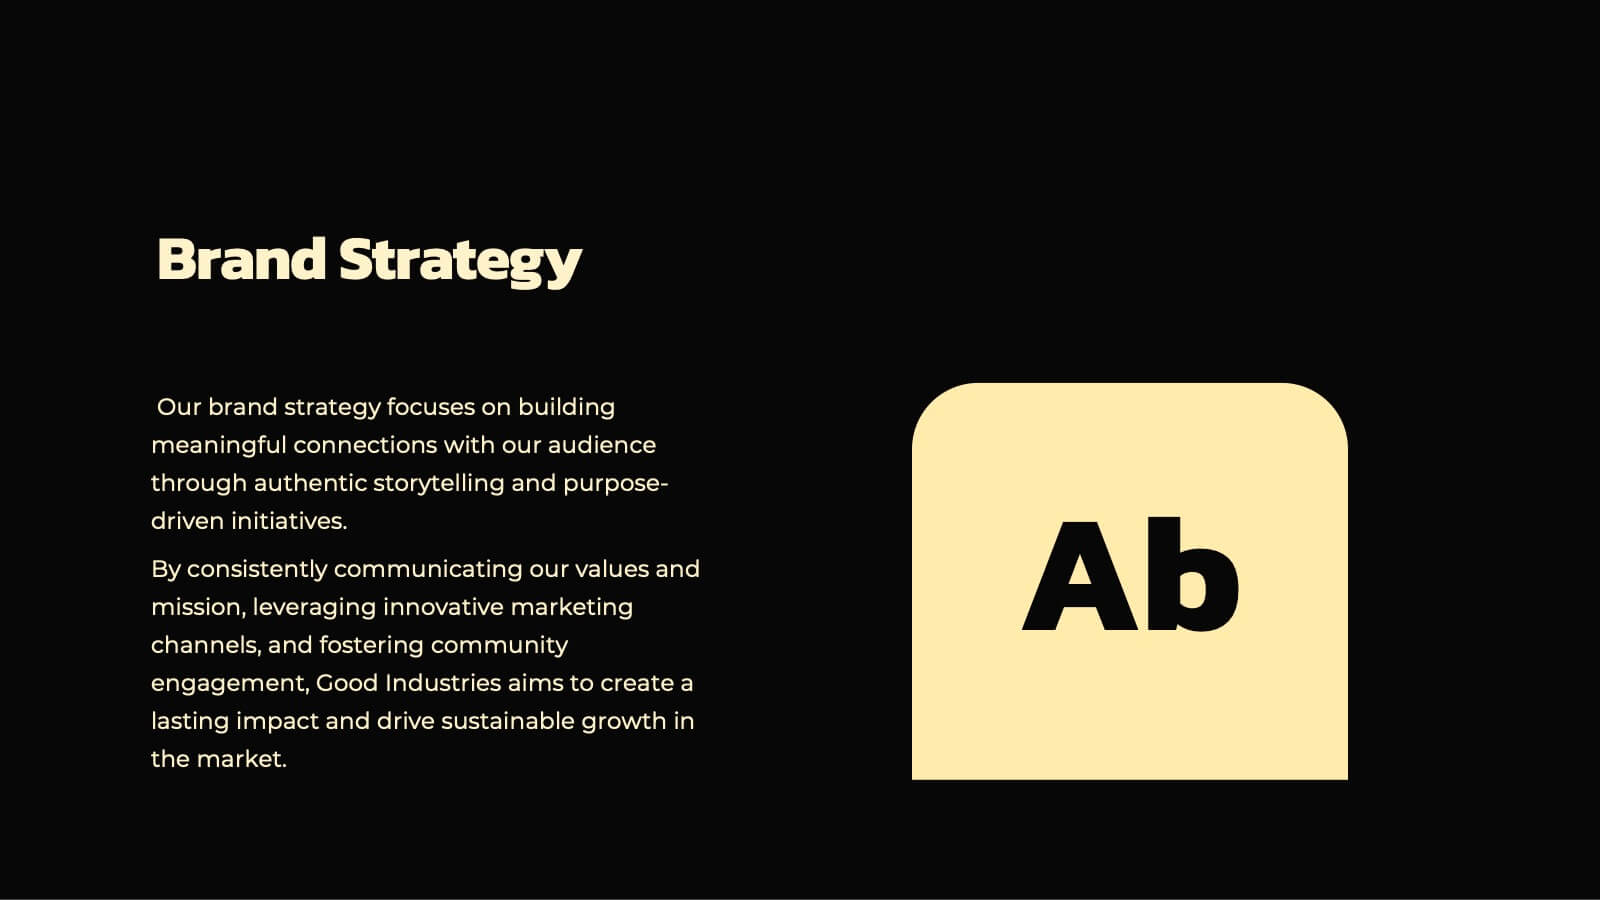
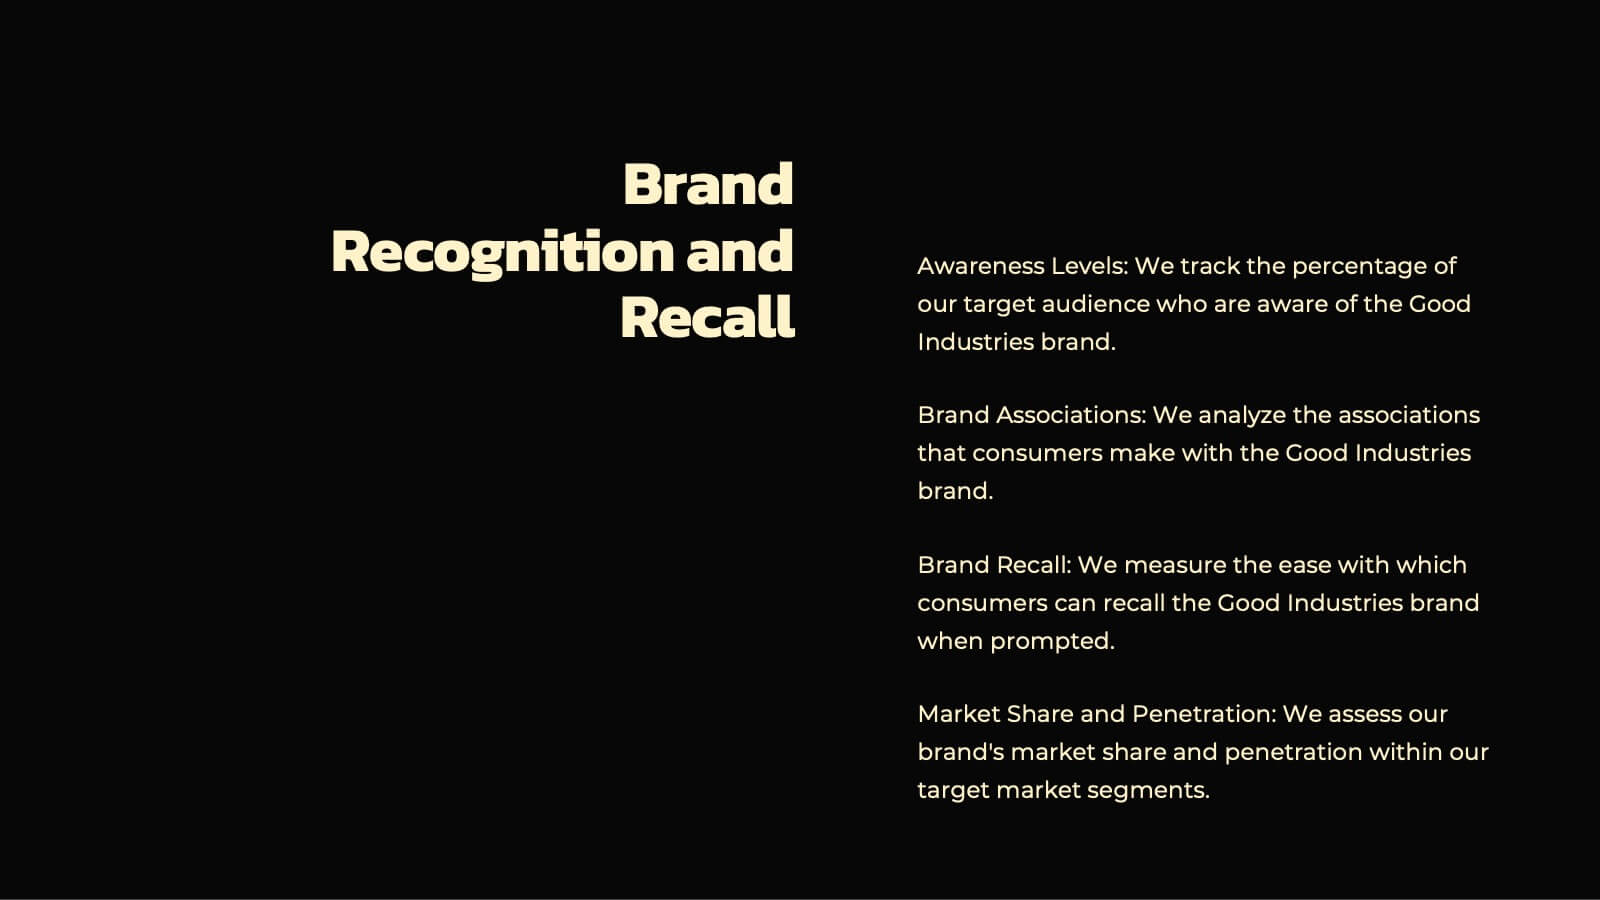
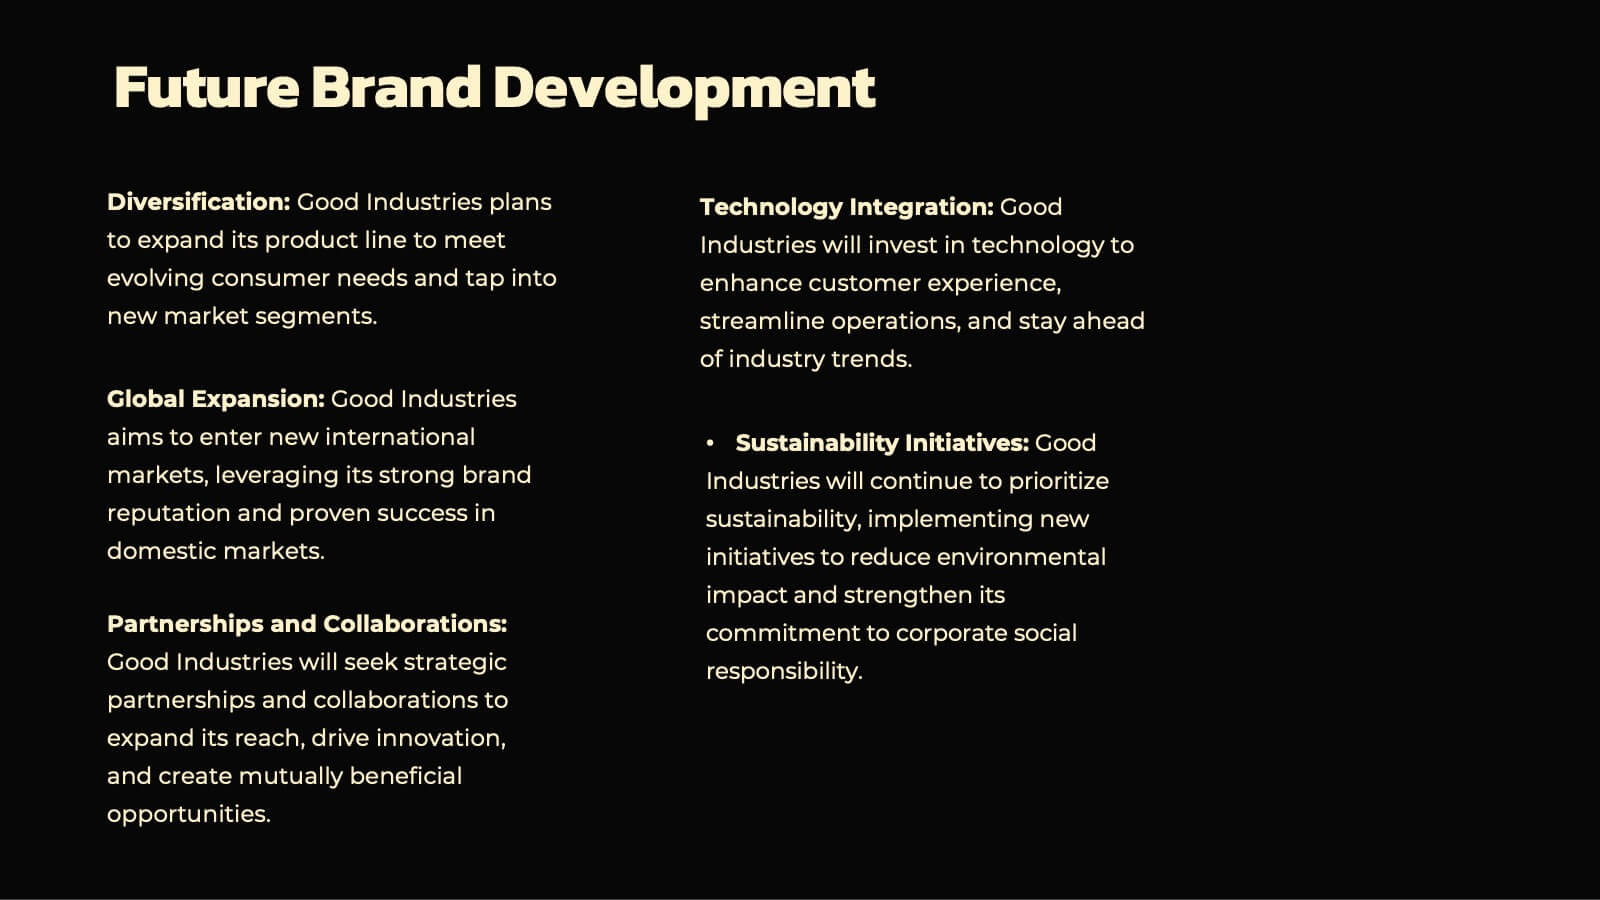
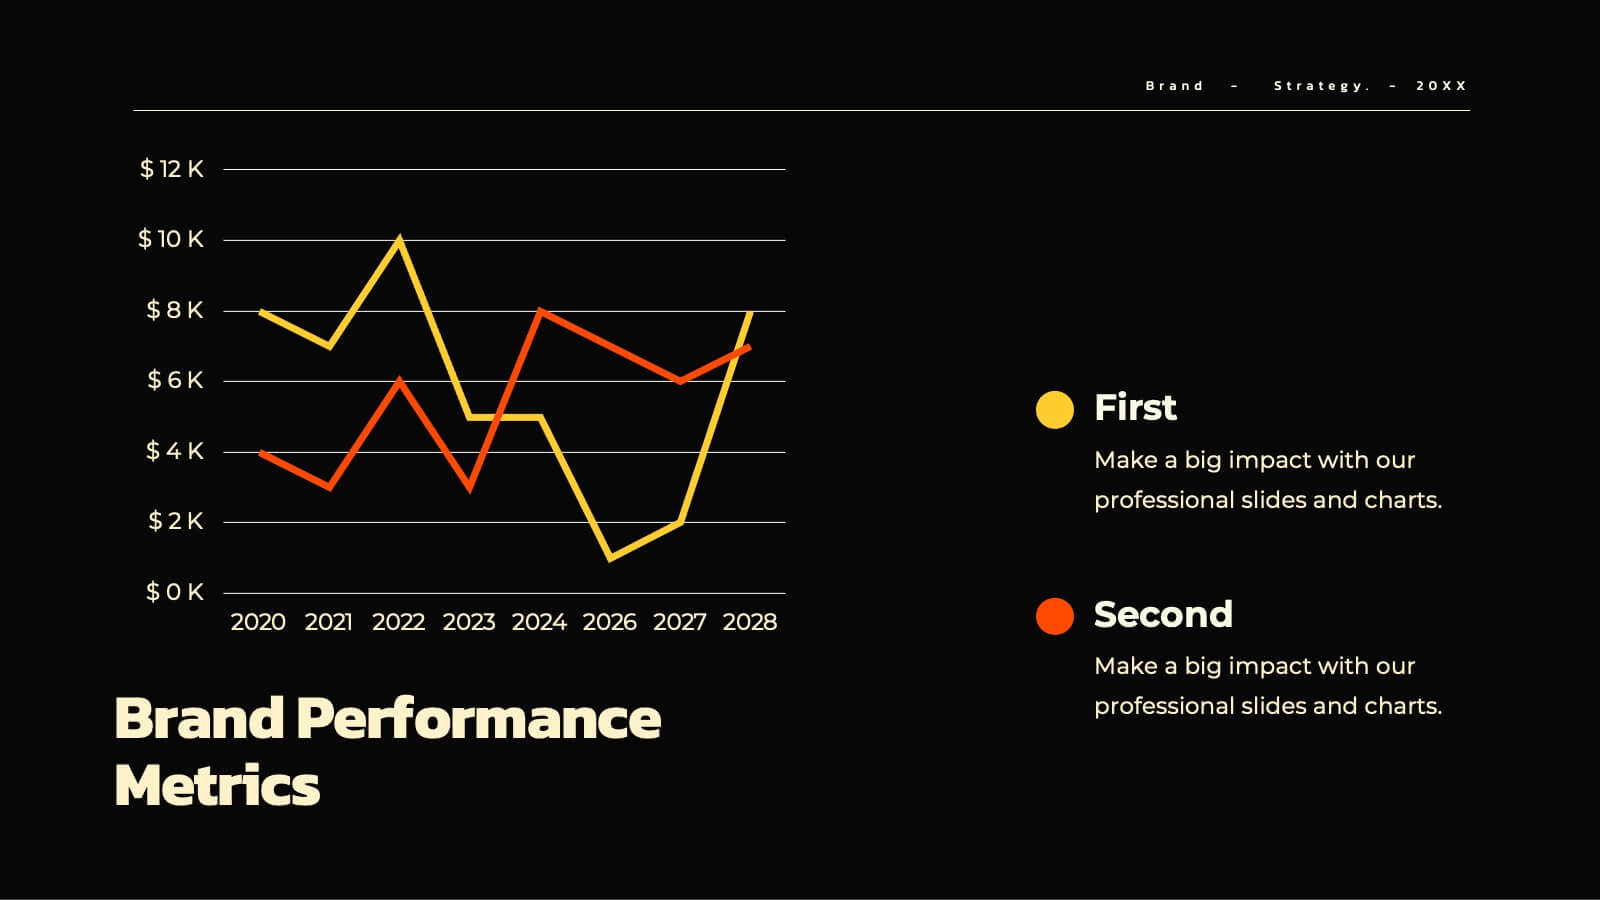
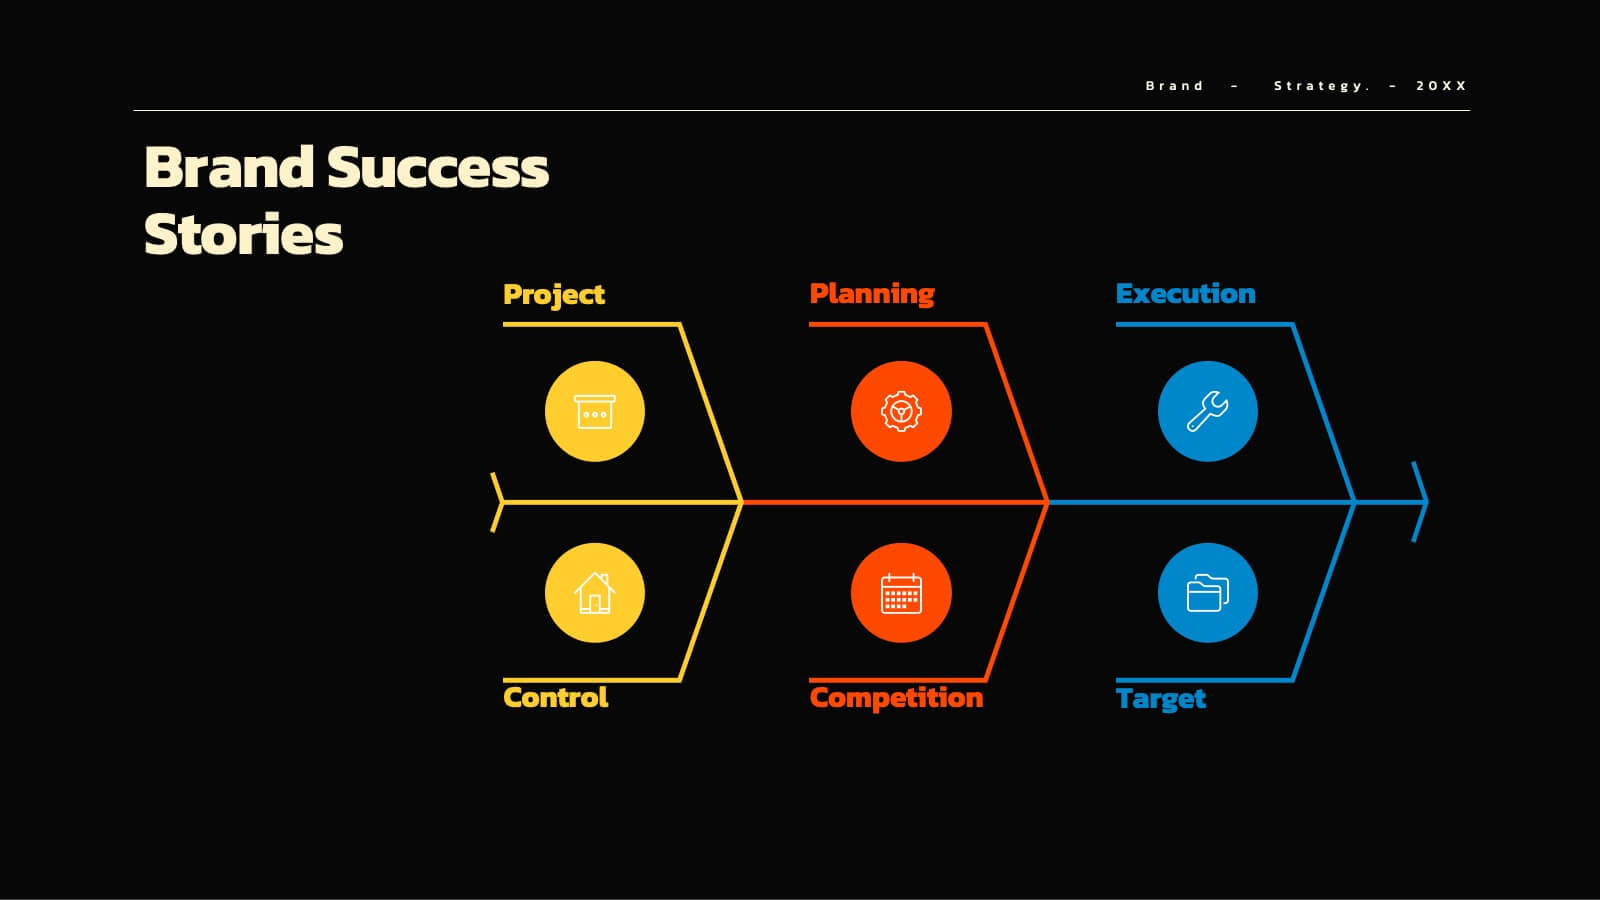
Aqua Brand Strategy Report Presentation
Make waves with this fresh, aqua-inspired presentation template, perfect for delivering a standout brand strategy report! Designed to help you showcase your brand's vision, market positioning, and strategic goals, it features a clean, modern layout that grabs attention. Compatible with PowerPoint, Keynote, and Google Slides for effortless customization.


5 slides
Financial and Growth Statistics
Present financial insights and growth metrics with impact using this visually engaging infographic. Ideal for showcasing revenue performance, profit trends, or investment results, this template keeps data clear and actionable. Fully customizable in PowerPoint, Keynote, and Google Slides to match your brand and strategy needs.


6 slides
McKinsey Strategy Implementation Model Presentation
Visualize organizational alignment with the McKinsey 7S Model slide. Featuring a clean circular layout, it highlights Strategy, Structure, Systems, Shared Values, Style, Staff, and Skills. Ideal for consulting, planning, or leadership presentations. Fully editable and compatible with PowerPoint, Google Slides, and Keynote for easy customization and branding.


6 slides
Building High-Performing Teams Presentation
Unlock your team's full potential with this dynamic Building High-Performing Teams template. Featuring a sleek 3-part circular layout, it's perfect for showcasing leadership roles, collaboration pillars, or performance drivers. Use it for HR meetings, training sessions, or team development plans. Fully editable in PowerPoint, Keynote, and Google Slides.


5 slides
Hydrology and Water Cycle Presentation
Showcase the complete water cycle with this vibrant Hydrology and Water Cycle infographic. Highlight key stages like precipitation, collection, evaporation, and condensation using clear visuals and numbered sections. Fully customizable for science, sustainability, or educational presentations. Compatible with PowerPoint, Keynote, and Google Slides for easy editing.


7 slides
Enterprise Governance Infographics
A Governance Infographic provides information about the principles and practices of governance, particularly in the context of organizations or institutions. This governance template can be used to cover a wide range of topics related to governance, including organizational structures, decision-making processes, risk management, compliance, and ethical standards. You can use this to include information on the roles and responsibilities of different stakeholders, such as board members, executives, and employees, as well as the policies and procedures that govern their interactions.


6 slides
Sustainabilitiy Management Goals and Metrics Presentation
Make your sustainability story shine with a clean, modern presentation that highlights environmental goals, measurable results, and ongoing progress. Perfect for communicating corporate impact and performance data with clarity and purpose. Fully customizable and compatible with PowerPoint, Keynote, and Google Slides for a professional and visually engaging delivery.


7 slides
Pyramid Analytics Infographic
Pyramid Infographics are the best way to show off your data in a visually appealing way that's easy to understand. They're fast, they're fun, and they're flexible enough to work with all sorts of data sets. This infographic template is the perfect way to bring your data to life. Designed with a hierarchical structure, the information is organized into groups of related items. This is perfect to showcase numbers, facts, and figures in an engaging way. Fully compatible with Powerpoint, Keynote, and Google Slides. This customizable template allows you to choose the color scheme, size, and orientation of the graphic, so you can pick what looks best for your presentation.


3 slides
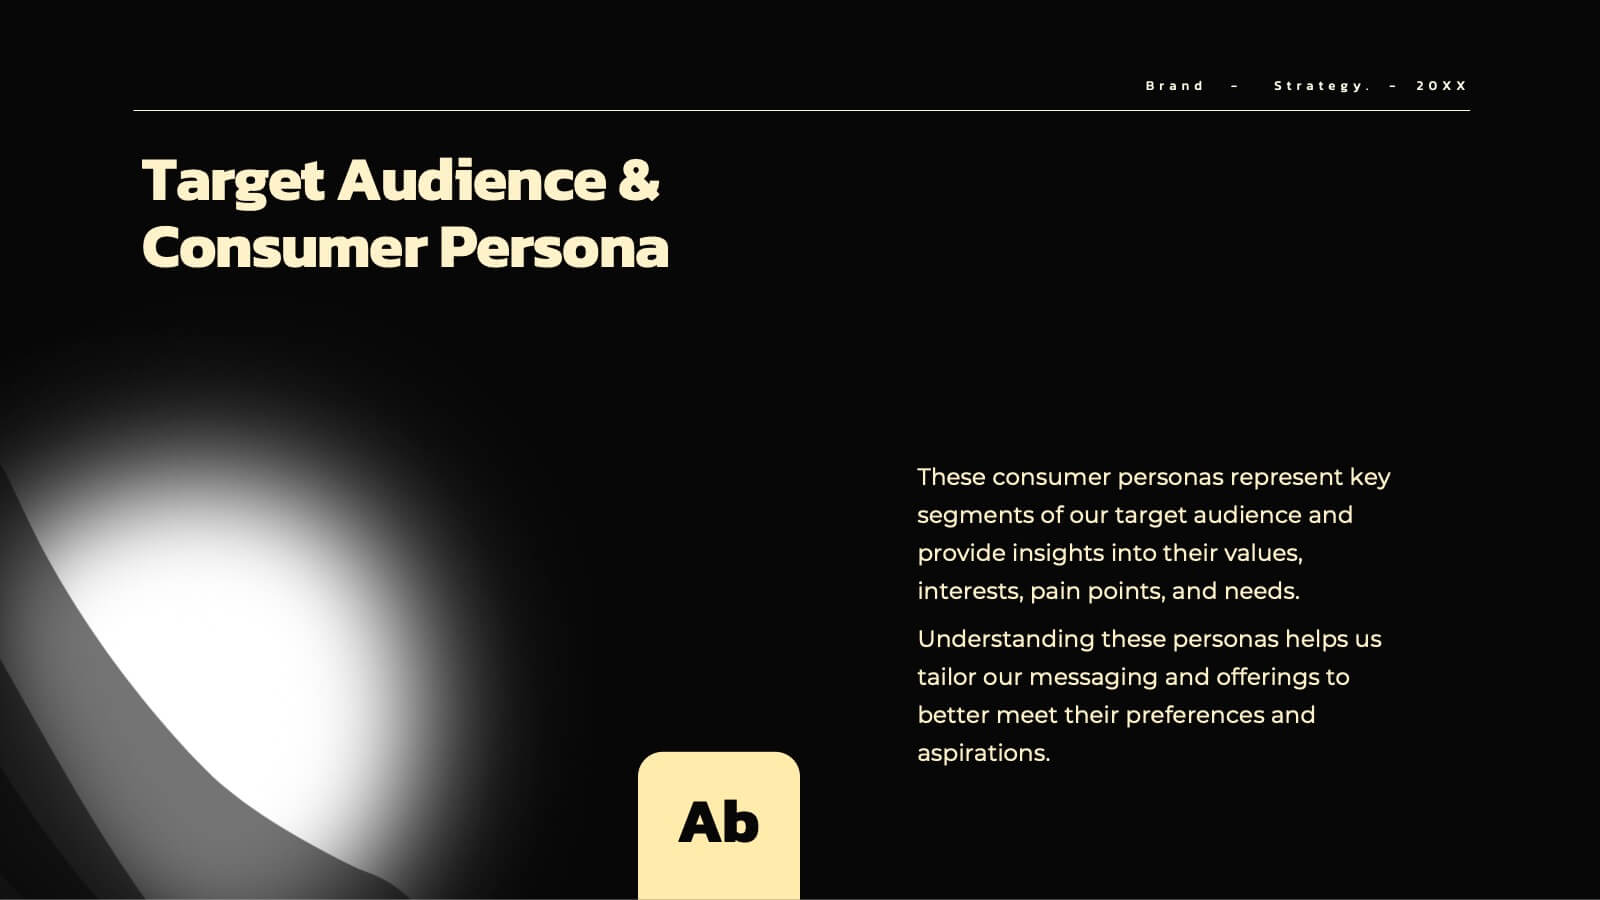
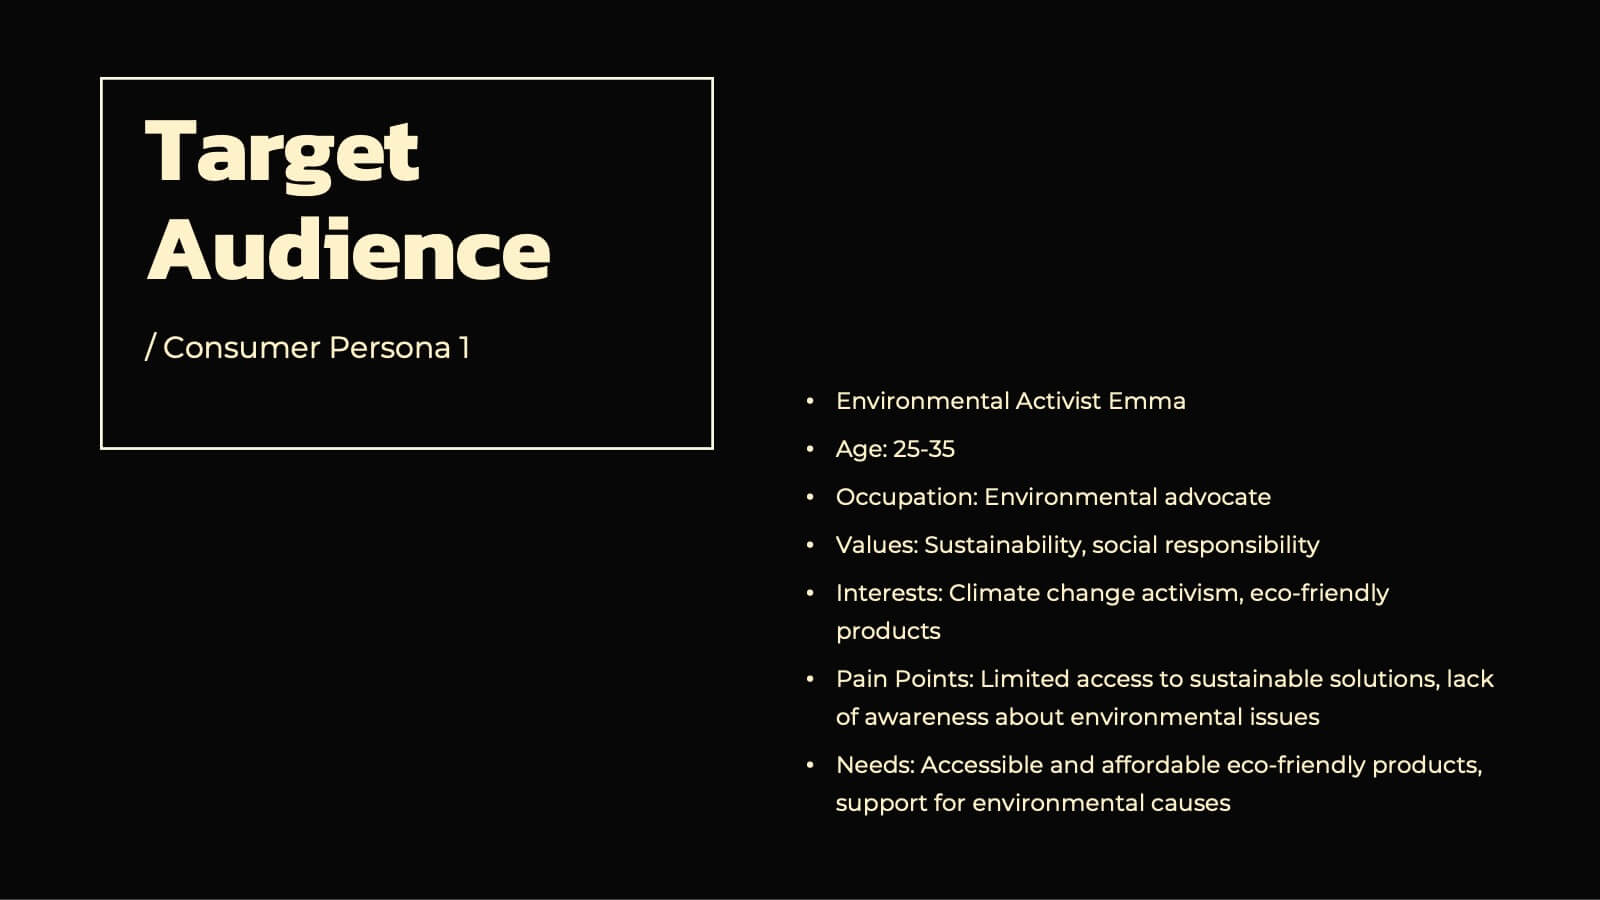
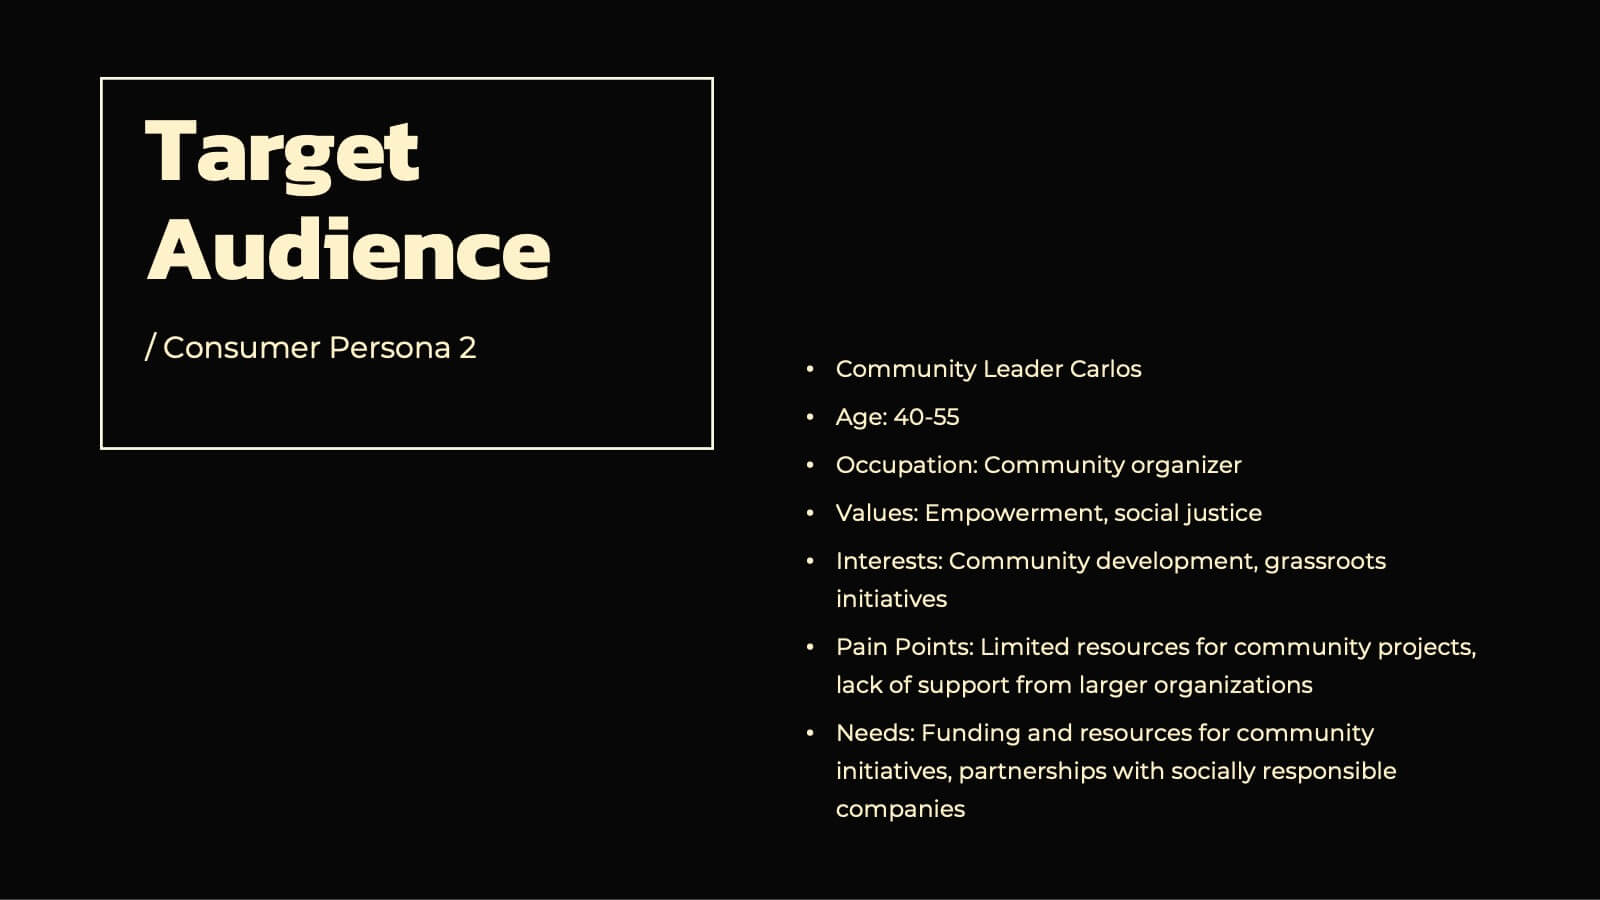
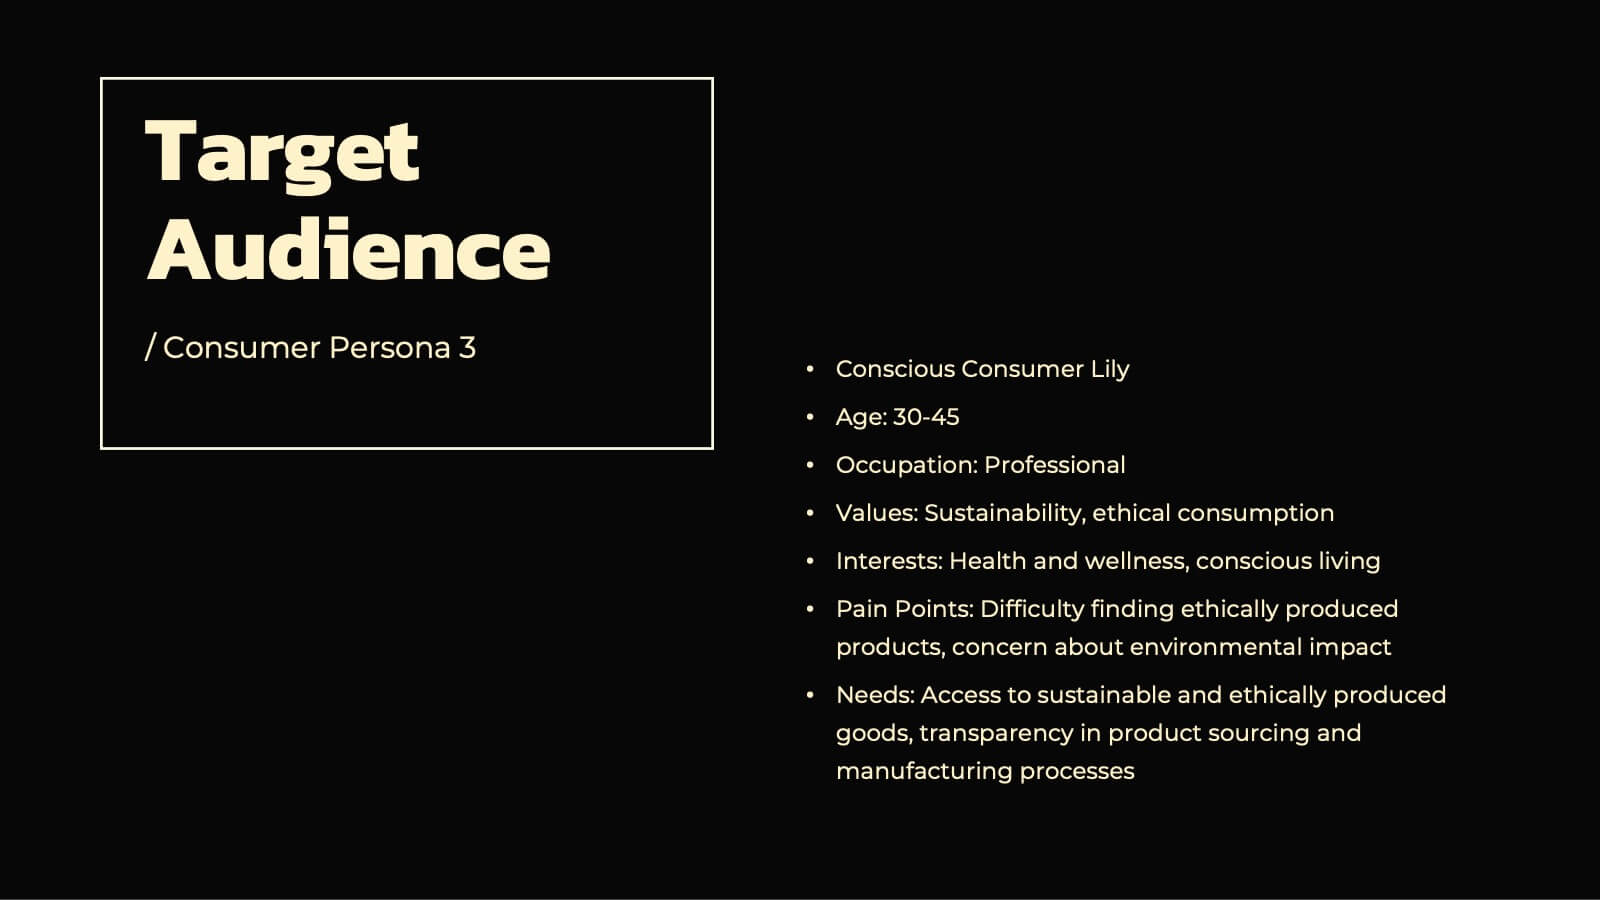
Persona Mapping for Target Audience Presentation
Get clear on who you're speaking to with this visual persona mapping slide. Ideal for marketing plans, customer research, or segmentation strategies, this layout helps you define and compare target audience types with clean icons and text space. Fully editable and works with PowerPoint, Keynote, and Google Slides.


30 slides
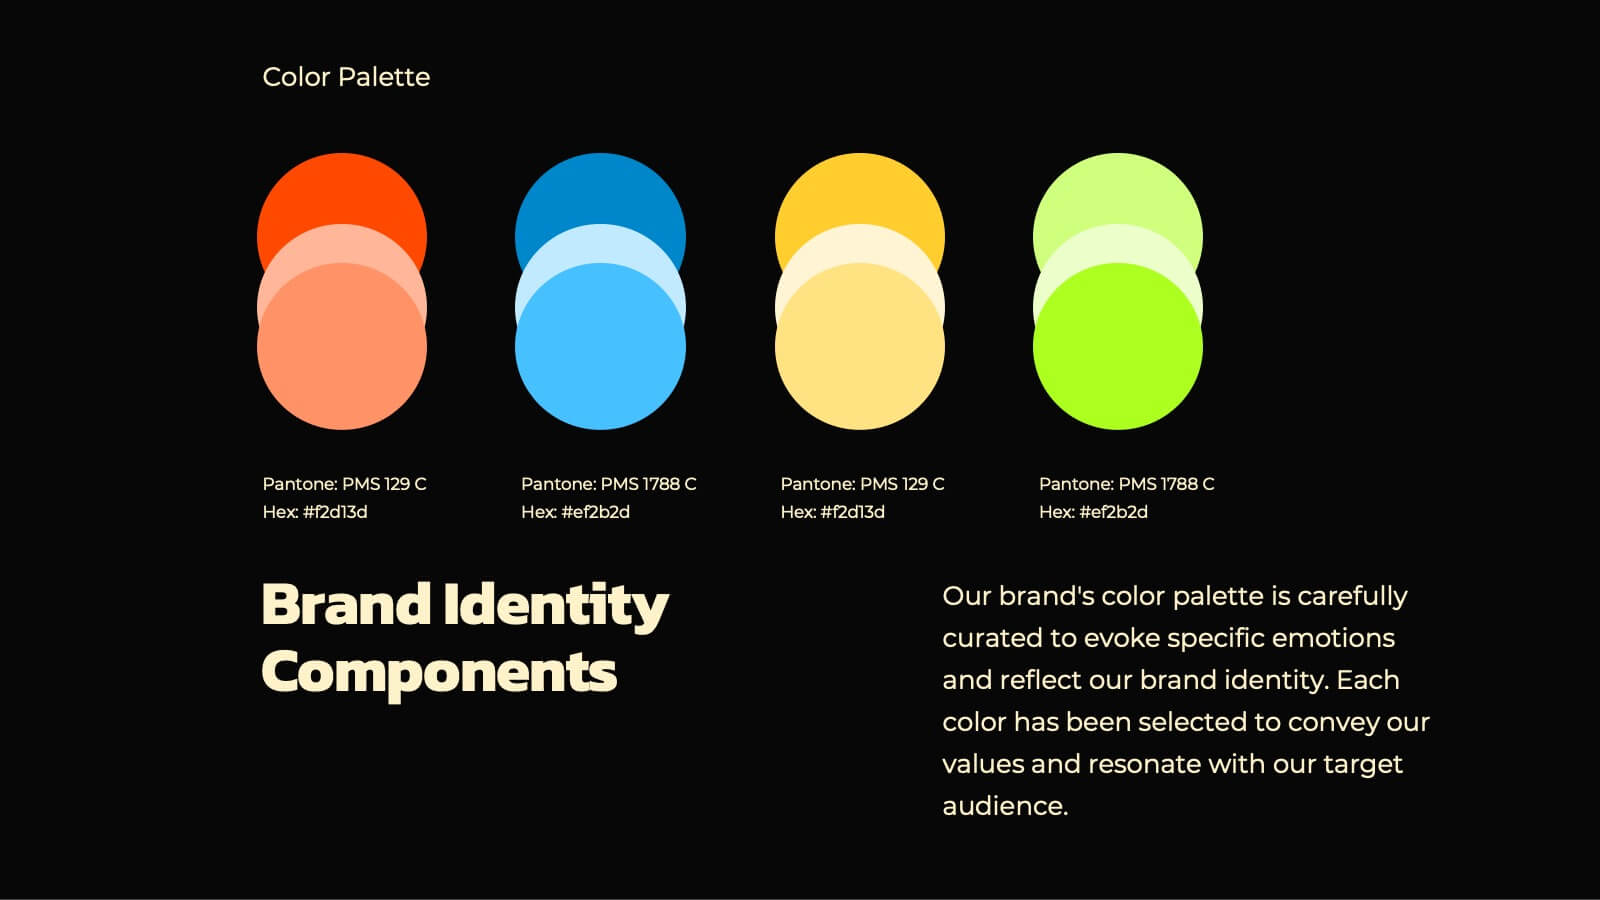
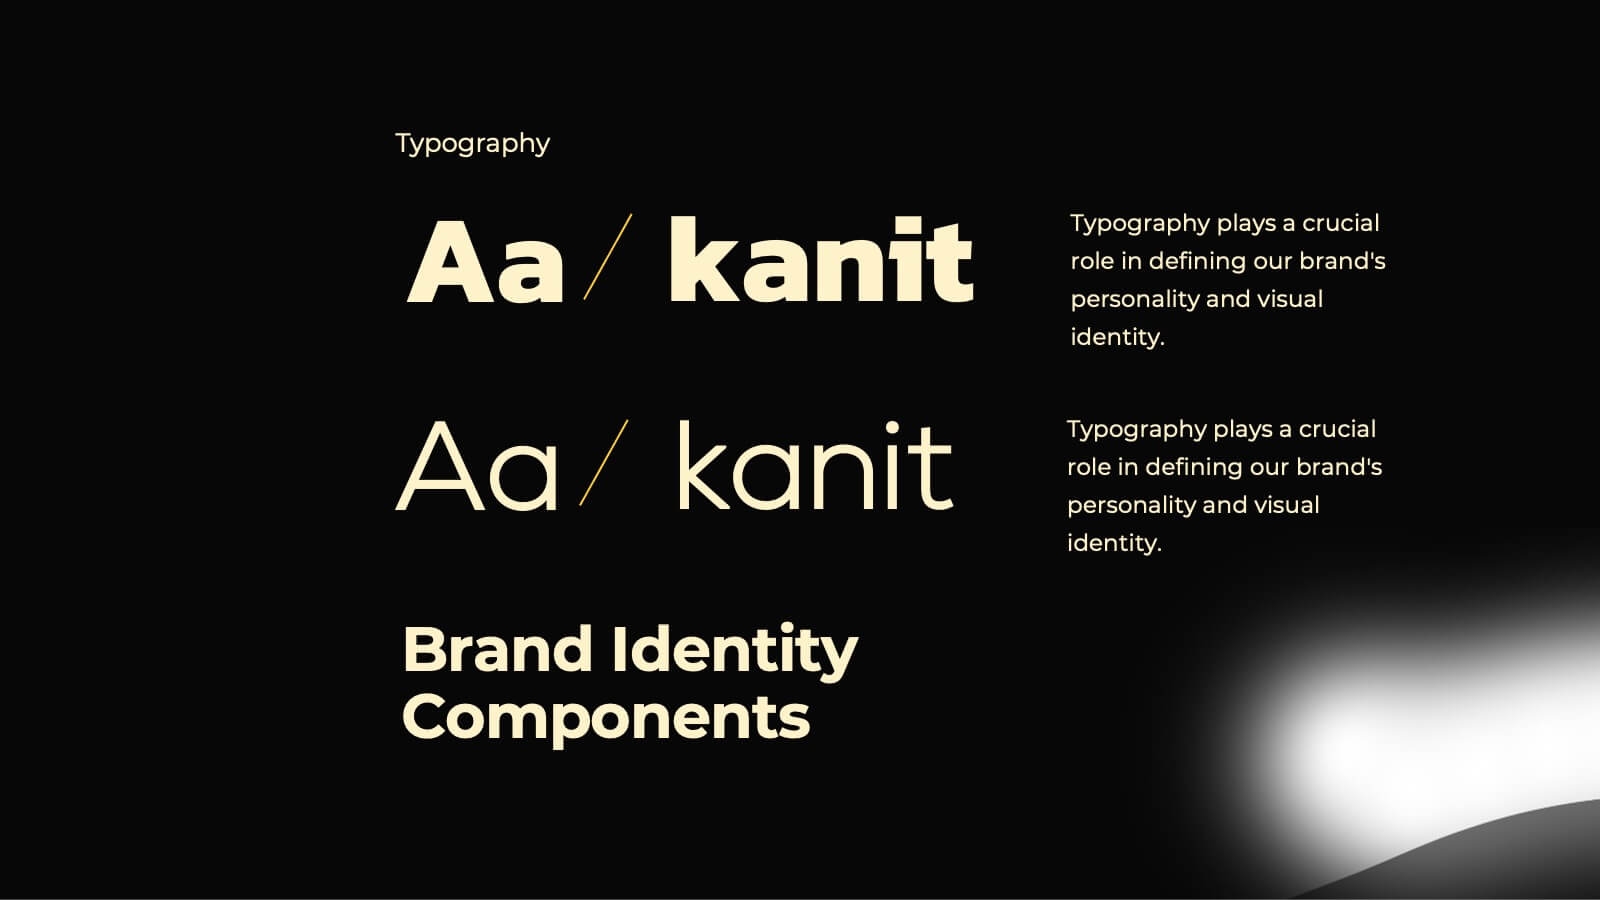
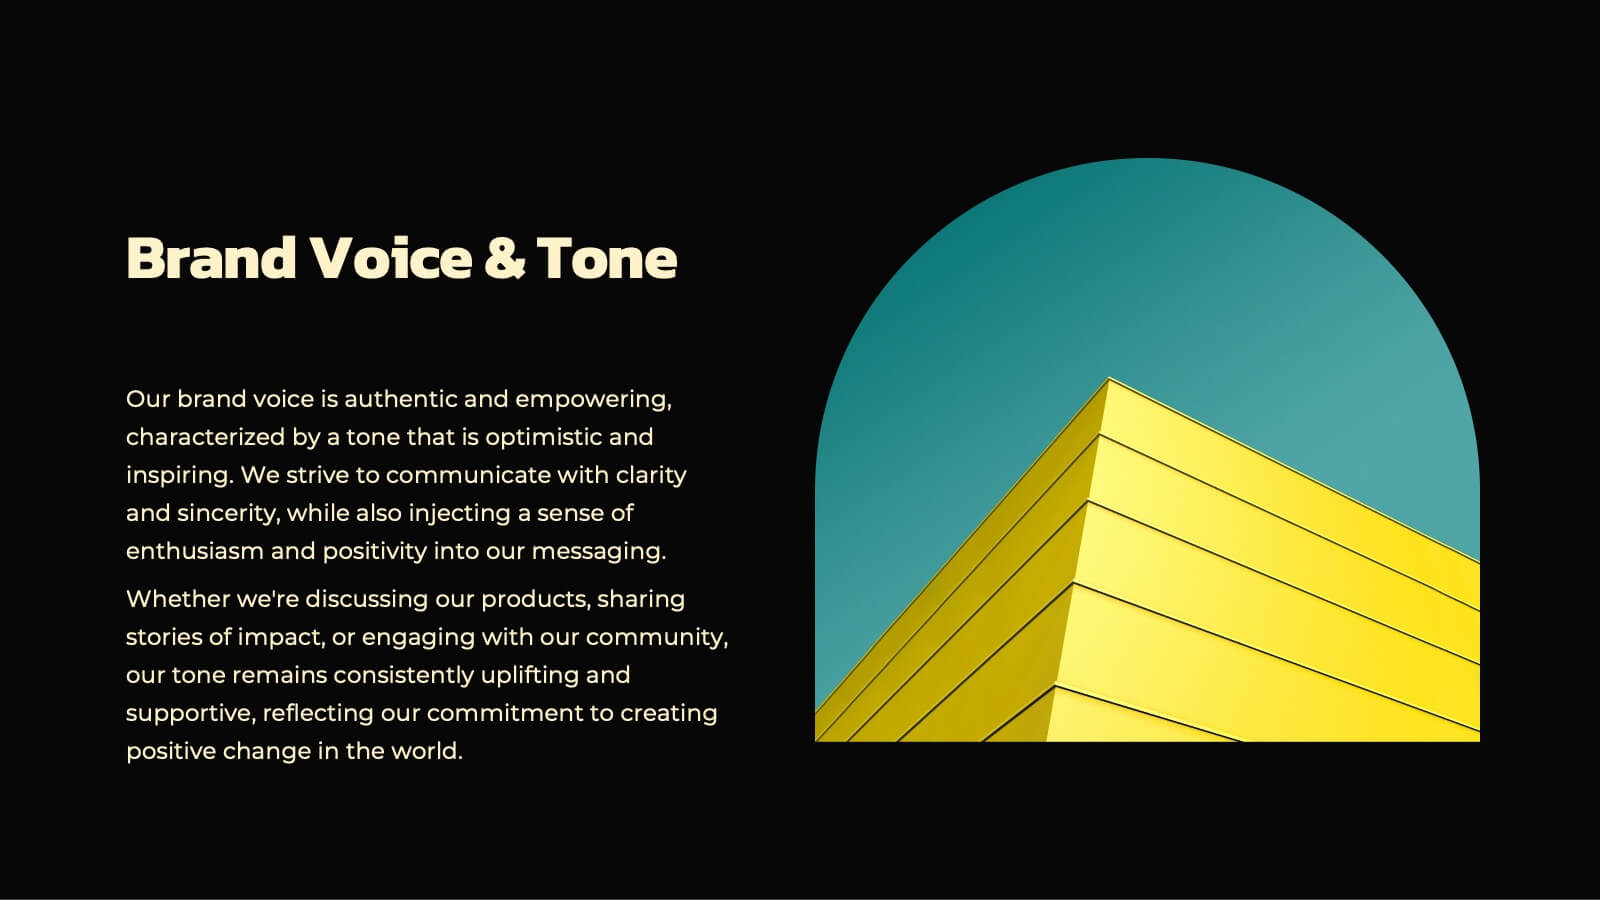
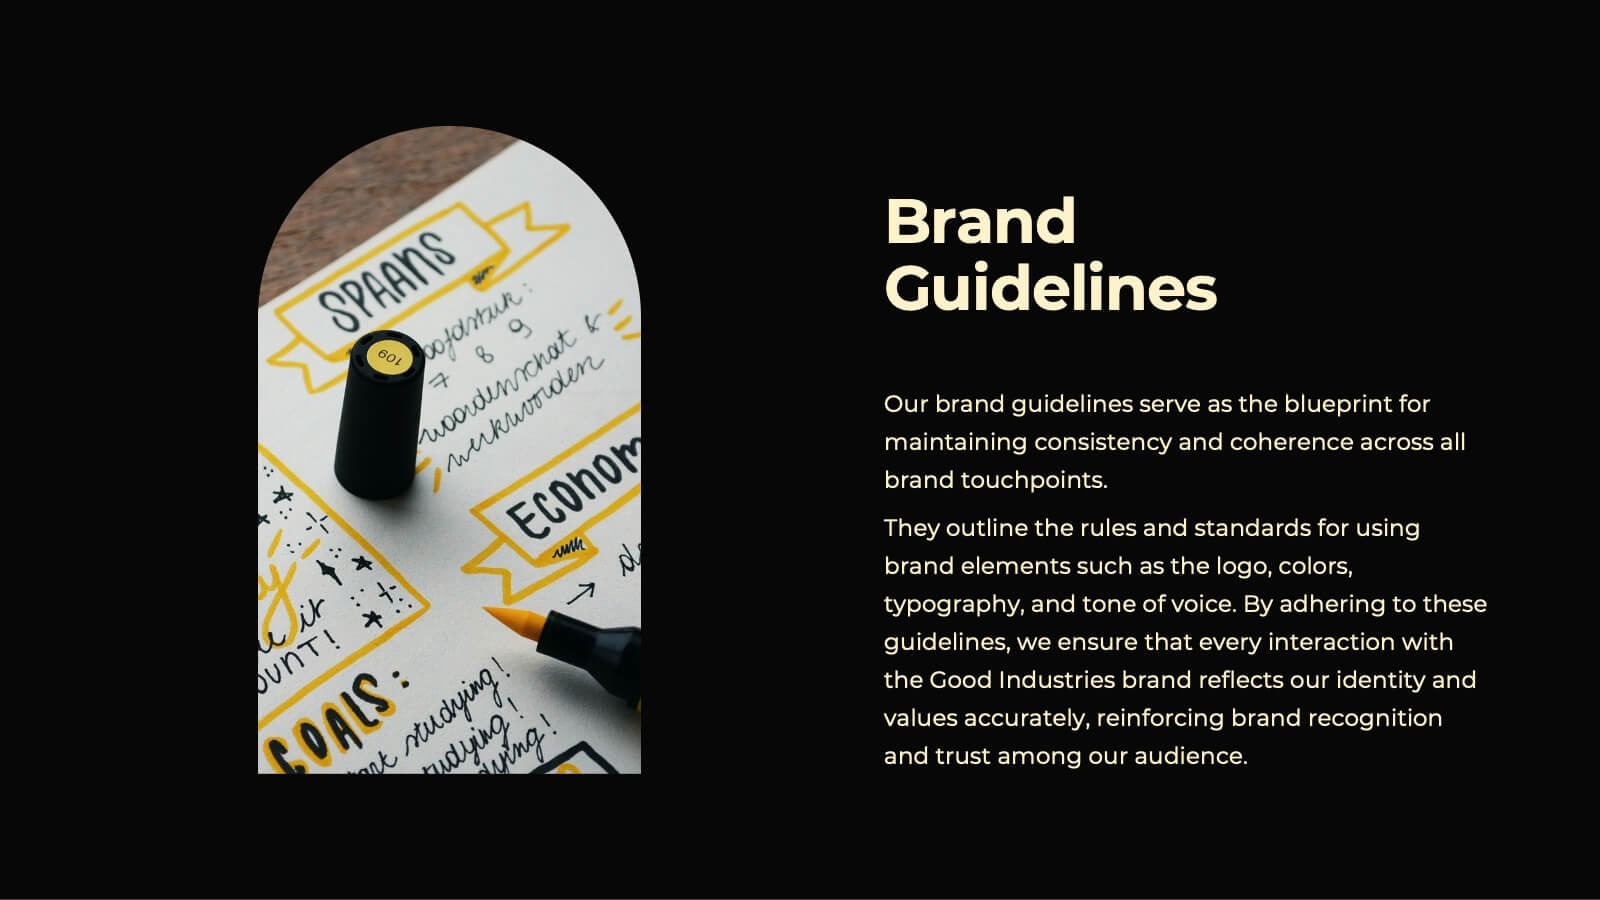
Fusoria Brand Guidelines Proposal Presentation
Build a strong and cohesive brand identity with this sleek and professional brand guidelines proposal presentation. Covering essential topics like typography, color palettes, visual direction, and branding principles, this template helps you define and communicate your brand’s essence. Fully customizable and compatible with PowerPoint, Keynote, and Google Slides for a seamless presentation experience.


26 slides
HIIT Workout Pink Presentation
Unleash the energy with our vibrant HIIT gym workout presentation template, a dynamic blend of pink, red, orange, and yellow, designed to bring your fitness regime to life. This energetic palette is perfect for gym owners, fitness influencers, and personal trainers aiming to showcase the high-intensity intervals that promise fast results. The template offers various graphics, icons, and image placeholders that add a visual punch to your information. Dive into creating an engaging, motivational fitness journey that highlights the benefits, routines, and transformative power of HIIT workouts, ensuring your audience is pumped and ready to go!


5 slides
SMART Objectives Slide Presentation
Kick your planning into gear with a bold, structured layout that makes goal-setting feel energetic and achievable. This presentation helps you outline clear objectives, track progress, and communicate strategy with a clean, organized flow designed for teams and leaders. Fully compatible with PowerPoint, Keynote, and Google Slides.


5 slides
Quarterly Action Planning Roadmap Presentation
Stay organized with the Quarterly Action Planning Roadmap Presentation. This clear, grid-based layout is perfect for mapping out priorities, goals, and deliverables across four quarters. Ideal for business planning, team tracking, and strategic reviews. Fully editable in PowerPoint, Keynote, Google Slides, and Canva for flexible customization.


10 slides
Sustainable Farming Practices
Present eco-friendly agricultural strategies with this visually structured layout. Featuring a linear process flow and eco-themed icons, this slide is ideal for outlining key sustainability practices, steps, or phases. Use it for presentations on regenerative agriculture, organic farming, or environmental policy. Fully editable in PowerPoint, Keynote, and Google Slides.


7 slides
Social Media Infographic Presentation Template
Social media is an important business tool due to the fact that it allows you to reach, nurture, and engage with customers no matter where they are located. Additionally, it allows you to target new audiences, create brand awareness, and grow your following. This template features a clean, fun design that is easy to read. With a variety of slides and infographics, it makes it simple to create. This template will inform you how social media can be a powerful tool. This template is a great way to keep your information organized and includes tips that can be added at the bottom of each section.